Article

Linear and Non-Linear Regression Analysis for the Adsorption Kinetics of SO2 in a Fixed Carbon Bed Reactor—A Case Study

by
Anna M. Kisiela-Czajka
1,* and
Bartosz Dziejarski
2
1
Faculty of Mechanical and Power Engineering, Wroclaw University of Science and Technology, 50-370 Wroclaw, Poland
2
Faculty of Environmental Engineering, Wroclaw University of Science and Technology, 50-370 Wroclaw, Poland
*
Author to whom correspondence should be addressed.
Energies 2022, 15(2), 633; https://doi.org/10.3390/en15020633
Submission received: 27 November 2021 / Revised: 11 January 2022 / Accepted: 14 January 2022 / Published: 17 January 2022
(This article belongs to the Special Issue Modelling and Calculation of Raw Material Industry)

Abstract

:
Here, we determined the kinetic parameters of SO2 adsorption on unburned carbons from lignite fly ash and activated carbons based on hard coal dust. The model studies were performed using the linear and non-linear regression method for the following models: pseudo first and second order, intraparticle diffusion, and chemisorption on a heterogeneous surface. The quality of the fitting of a given model to empirical data was assessed based on: R2, R, Δq, SSE, ARE, χ2, HYBRID, MPSD, EABS, and SNE. It was clearly shown that the linear regression more accurately reflects the behaviour of the adsorption system, which is consistent with the first-order kinetic reaction—for activated carbons (SO2 + Ar) or chemisorption on a heterogeneous surface—for unburned carbons (SO2 + Ar and SO2 + Ar + H2O(g) + O2) and activated carbons (SO2 + Ar + H2O(g) + O2). Importantly, usually, each of the approaches (linear/non-linear) indicated a different mechanism of the studied phenomenon. A certain universality of the χ2 and HYBRID functions has been proved, the minimization of which repeatedly led to the lowest SNE values for the indicated models. Fitting data by any of the non-linear equations based on the R or R2 functions only cannot be treated as evidence/prerequisite of the existence of a given adsorption mechanism.

1. Introduction

The structure of fuel consumption in Poland, based on hard coal and lignite, makes the energy sector one of the main sources of pollutants emitted into the air. According to the information presented in the report of the National Center for Balancing and Emission Management in Warsaw, in 2015–2017 the commercial power industry was responsible for 43–52% of the national SO2 emissions [1]. In EU countries, on the other hand, the emission of sulfur oxides (total) from the sector of thermal power plants and other combustion installations, in 2014 accounted for 66.9% of the total emissions from all installations covered by the provisions of the Directive on the Establishment of the European Pollutant Release and Transfer Register (E-PRTR) [2].
Due to the fast and unlimited spread of pollutants and direct impact on the natural environment, a significant tightening of emission standards for air pollutants is observed. Pursuant to EU regulations, emission limits of up to 200 mg SO2·Nm−3 have been in force since 2016, and, according to the projections developed in 2019, the national commitment to reduce emissions in the period 2020–2029 and from 2030 was set at 59% and 70%, respectively, compared to the emissions recorded in 2005 [3].
In the light of the information presented in the literature, the least invasive method that does not interfere with the combustion process is the capture of pollutants after the combustion process (i.e., post-combustion capture of pollutants). One of the solutions presented in the literature is an innovative technology for the use of unburned carbon from fly ash for flue gas cleaning [4,5,6,7,8,9]. Meanwhile, the attempts to re-utilize unburned carbon in this way may not only reduce the emission of pollutants but also enable an increase in the efficiency of electricity generation, minimize additional costs related to the storage of high-calorific waste (considering the legalization of the recovery process), and increase the commercial attractiveness of valorized fly ash.
The correctness of the method of adsorptive desulfurization of flue gas with the use of porous carbon materials is based on the knowledge of the adsorption mechanism and the state of adsorbate molecules in the pores of the adsorbent. According to literature reports on the methods of reducing SO2 emissions in installations in the energy production and transformation sector, adsorption on the surface of the carbon adsorbent turns out to be one of the most frequently analyzed solutions [10]. Despite the quite extensive variety of methods for removing sulfur dioxide from boiler flue gases [11,12], the practical significance of most of them is limited, and the research does not go beyond laboratory work.
The research on the kinetics and dynamics of adsorption is used to understand the interaction between the adsorbent and the adsorbate. While in the case of preparation on a laboratory scale testing the reaction rate is not necessary, it is imperative if one wants to adapt a given reaction on a technical scale. In light of the information presented in the literature, adsorption on a heterogeneous surface is most often described by the following models: pseudo first-order and pseudo second-order kinetic models (PFO and PSO), intraparticle diffusion model (Weber–Morris), and chemisorption on a heterogeneous surface (Elovich) [13,14,15,16]. However, a commonly used tool for the analysis of empirical data is linear regression, and the classic method of least squares is used to determine the optimal values of unknown parameters [17,18,19,20,21]. Nevertheless, the greatest disadvantage of the above method is the undefined distribution of empirical data errors when determining the parameters of a given model, as a result of transforming kinetic equations into linearized forms. This may affect its variance (a measure of the accuracy of fitting to experimental data) and cause a misinterpretation of kinetic parameters, ultimately leading to an incorrect indication of the optimal model and the form of its equation [22,23,24,25].
This makes non-linear regression or non-linear fit analysis worth considering, as it provides a mathematically rigorous method for determining the kinetic parameters and adsorption dynamics while using the basic form of the equation, which offers the most accurate fit of the model curve function to the experimental data [26,27]. It is closely related to the minimization of the value of the error function distribution between the experimental data and the predicted model value obtained based on the convergence criteria, i.e., the ability of a given model to “lead” towards the empirical result [27,28].
In view of the above requirements, it is necessary to identify and explain the usefulness of linear and non-linear regression in various adsorption systems. Interpretation of the values of individual error functions enables the selection of the most convenient and precise optimization criteria in the kinetics and dynamics of adsorption.
Referring to the above, this study aims to determine the parameters of SO2 adsorption kinetics by the method of linear and non-linear regression for the following models: pseudo first-order and pseudo second-order kinetic model, intraparticle diffusion, and chemisorption on a heterogeneous surface. The quality of the fitting of a given model to empirical data was assessed based on the following: determination coefficient (R2), correlation coefficient (R), relative standard deviation (Δq), sum squared error (SSE), average relative error (ARE), chi-square test (χ2), hybrid fractional error function (HYBRID), Marquardt’s percent standard deviation (MPSD), the sum of absolute errors (EABS), and the sum of normalized errors (SNE). The subject of research is selected fractions of unburned carbon recovered from lignite fly ash, created as a result of the nominal operation of the pulverized carbon boiler of a Polish power unit. Selected commercial activated carbons dedicated to industrial gas purification processes and traded on the domestic and foreign markets were used as reference materials.

2. Experimental Section

2.1. Materials

The subjects of the research presented in this paper are selected fractions of unburned carbon recovered from lignite fly ash, resulting from the nominal operation of the pulverized carbon boiler BB-1150 in Bełchatów Power Plant (370 MW unit). Unburned carbon along with fly ash was collected with the use of demonstration installation from the ash hoppers located under the second pas chamber and rotary air heater (more in [29]). The combustible parts have been separated by a mechanical classification system with a capacity of 500 kg·h−1 into three grain classes: ~0.8 mm and 57.3% (marked UnCarb_HAsh), ~1.0 mm and 44.6% (marked UnCarb_MAsh), and ~1.5 mm and 12.8% (marked UnCarb_LAsh). The commercial activated carbons AKP-5 and AKP-5/A were used as reference materials, manufactured and distributed by GRYFSKAND Sp. z o.o. (Gryfino, Poland), Hajnówka Branch, active carbon production plant (more in [30]). Both products were developed for the treatment of industrial gases, boiler flue gases in power plants, or waste incineration plants, including sulfur dioxide, nitrogen oxides, hydrogen chloride or dioxins, and furans.
The characterization of the carbon substance structure of the test material, including the analysis of the degree of pore expansion and the identification of surface oxygen functional groups, was presented in an earlier work by one of the authors [30].

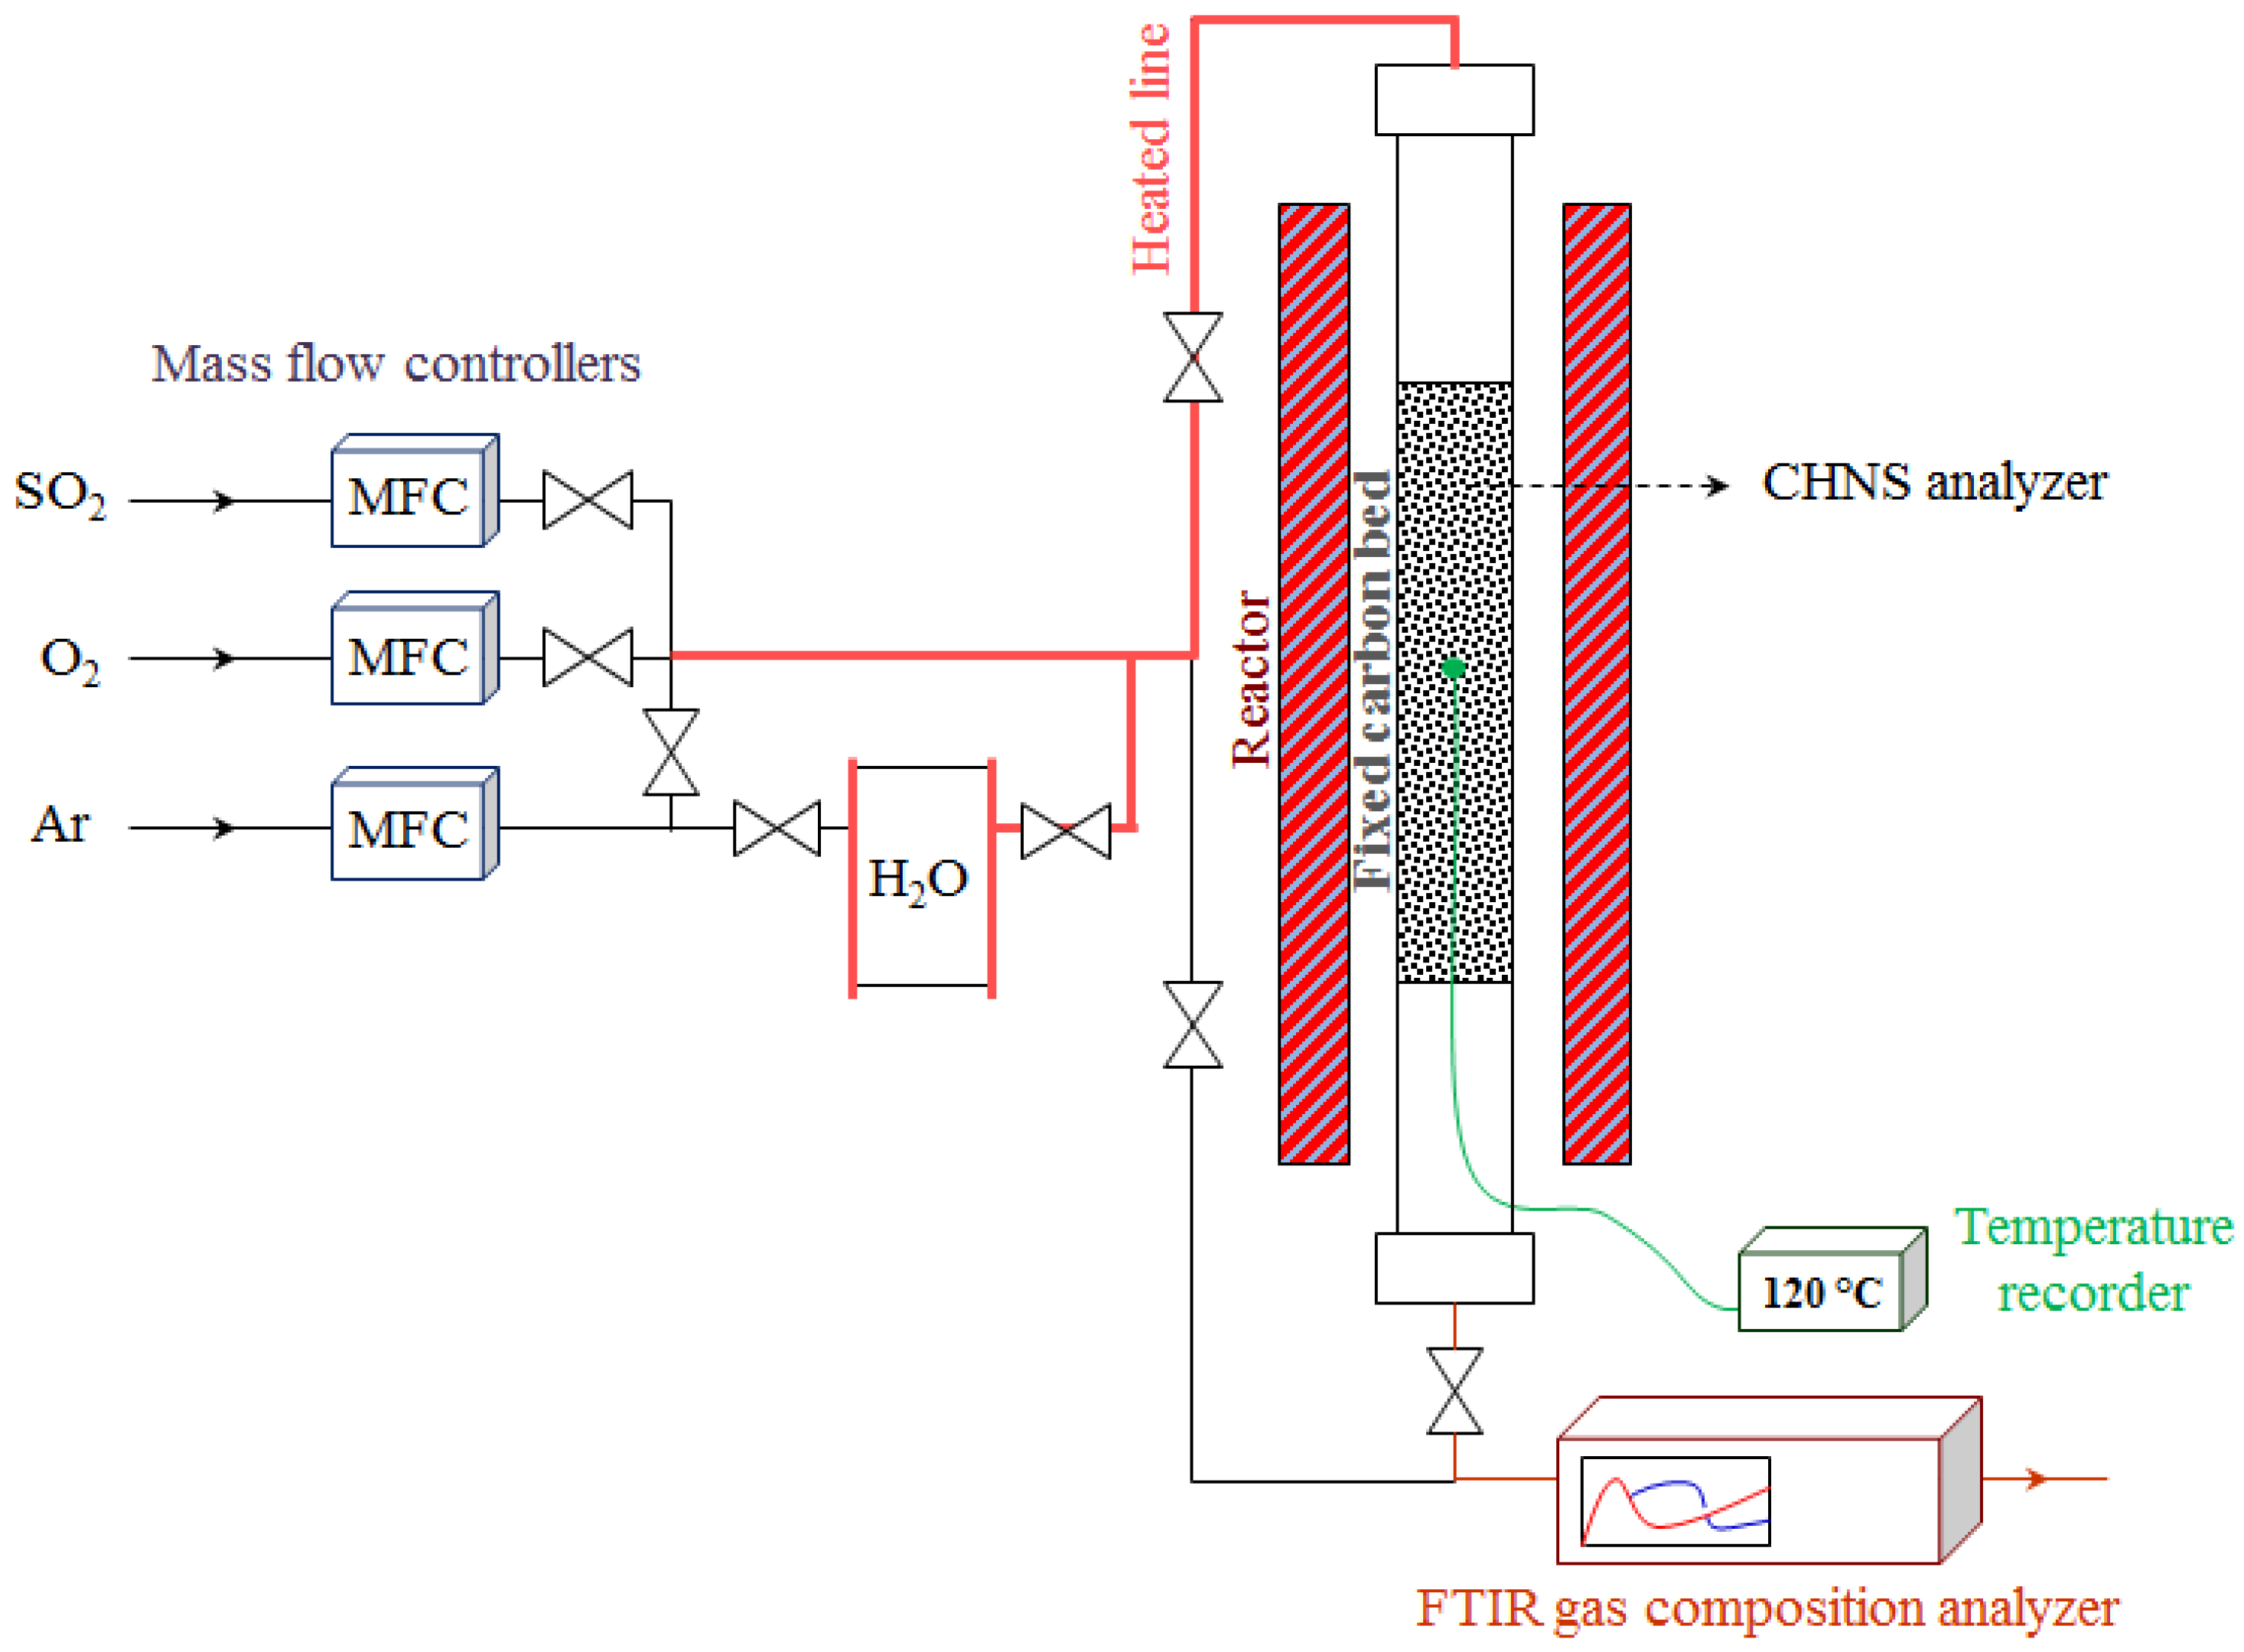
2.2. Experimental Studies

The model tests were carried out on the results of laboratory tests for SO2 adsorption on a fixed carbon bed, which were the subject of one of the author’s earlier works, published in [30]. The experiments were carried out at a temperature of 120 °C, in the presence of gas mixtures flowing linearly through 1.73 × 10⁻⁴ m3 of the bed and with the following composition (in volume concentration):
  • 5% of sulfur dioxide and 95% of argon (as carrier gas) and a volumetric flow rate of 2 × 10⁻³ m3∙min−1;
  • 2.5% of sulfur dioxide, 11% of water vapor, 20% of oxygen and 66.5% of argon (as carrier gas) and a volumetric flow rate of 2.05 × 10⁻³ m3∙min−1.
Measurements were made on a fixed-bed reactor (Figure 1), which enabled the assessment of both the degree and dynamics of the adsorption process. The water vapor was generated using Ar from a bubbling container that was bathed in 60.5 ± 0.1 °C water, and the relative humidity was controlled using the Ar flow based on the water vapor Antonio equation. The gas flow line to the reactor was maintained at an elevated temperature (120 °C) to prevent condensation. The final concentration of sulfur in the solid phase was used to assess the effectiveness of sulfur dioxide adsorption, which was carried out in accordance with the PN-EN 04584:2001 standard while correcting this value by the share of the so-called fuel sulfur:
m S ,   t = m S ,   m S , 0
where mS,t is the mass of adsorbed sulfur, mg; mS,∞ is the total mass of sulfur in the sample after the adsorption process, mg; mS,0 represents the mass of sulfur in the sample before the adsorption process, mg.
Due to the possibility of adsorption of various forms of sulfur dioxide and the occurrence of indirect chemical reactions, as a consequence of the presence of O2 and H2O(g) in the reaction system, no comparative analyzes were performed for the participation of sulfur dioxide in the solid phase.

2.3. Modelling Studies

2.3.1. Reaction Kinetics Models

Processes carried out in the environment of SO2 + Ar gases (UnCarb_HAsh, UnCarb_MAsh, UnCarb_LAsh, AKP-5, and AKP-5/A samples) and SO2 + O2 + H2O(g) + Ar (UnCarb_LAsh and AKP-5/A samples) were subjected to model tests. For this study, four models were chosen [31,32,33,34,35], i.e.,:
  • pseudo first-order kinetic model developed by Legergren,
  • pseudo second-order kinetic model developed by Ho i McKaya,
  • Weber-Morris intraparticle diffusion model, and
  • chemisorption on a heterogeneous surface called the Elovich or Roginski-Zeldowicz model,
which were verified by means of linear regression determined with the use of the least squares method and non-linear regression determined with the use of a numerical algorithm solved by means of the Solver in MS Excel.

Pseudo First-Order Kinetic Model (PFO)

The pseudo-first-order kinetic model, hereinafter referred to as model 1, makes the adsorption rate of sulfur dioxide/oxidized forms of sulfur dioxide (dmS,t·dt−1, g·kg−1min−1) dependent on the reaction rate constant k1 (min−1) and the difference in adsorbate mass after time t (mS,t, g·kg−1) and ∞ (mS,∞, g·kg−1), according to the relationship:
dm S , t dt = k 1 ( m S ,   m S , t )
The mS,∞ value was determined experimentally by washing the adsorbent bed with the gas mixture for 1, 5, 15, and 30 min. In order to determine the rate constant k1 (min−1), the relationship (2) was integrated with the range from 0 to mS,∞, obtaining a linear equation:
ln ( m S ,   m S , t ) = ln ( m S , ) k 1 t
which was then presented in semi-logarithmic coordinates (t, ln(mS,∞−mS,t)) so that the parameter k1 corresponds to the slope a, according to the relationship a = −k1. Integrating the differential Equation (2) with the above boundary conditions also gave a non-linearized function:
m S , t = m S , [ 1     exp ( k 1 t ) ]

Pseudo Second-Order Kinetic Model (PSO)

The pseudo second-order kinetic model hereinafter referred to as model 2, assumes that the adsorption rate changes depending on the constant k2 (kg·g−1·min−1) and the square of the adsorbate mass difference over time t and ∞, according to the equation:
dm S , t dt = k 2 ( m S ,   m S , t ) 2
the integration of which in the range from 0 (for t = 0) to mS, (for t = t), allowed to obtain the relationship:
t m S , t = 1 k 2 m S , 2 + t m S ,
The value of the total adsorbate mass (after time ∞) mS,∞, was not determined experimentally (as was the case for model 1), but it was determined together with the rate constant k2, based on the slope of the line (6) and the intercept in the system coordinates with a linear scale (t, t·mS,t−1). Integrating the differential Equation (5) with the above boundary conditions also gave a non-linearized function:
m S , t = m S , k 2 t 1 + m S , k 2 t

Model of Intraparticle Diffusion

The intraparticle diffusion model, hereinafter referred to as model 3, assumes that the amount of adsorbed sulfur dioxide/oxidized forms of sulfur dioxide at time t can be written by a simple equation:
m S , t = k id t 0 , 5 + C
where the kid coefficient is called the intraparticle diffusion rate constant (g·kg−1·min−0.5), and C (g·kg−1) is the thickness of the layer, called the thickness. If the only factor determining the speed of the process is intramolecular diffusion, then the linear relationship of q(t) to time t1/2 should be a straight line with a slope coefficient kid and going through the zero intercept, i.e., C = 0. However, the deviation from linearity indicates the existence of other factors limiting the rate of the adsorption process, such as: surface diffusion, diffusion of the boundary layer, gradual adsorption in the adsorbent pores, and adsorption on the active sites of the adsorbent [26].

Model of Chemisorption on a Heterogeneous Surface

The last of the applied models (model 4) was developed to describe the chemisorption on a heterogeneous surface. According to the Elovich equation, the adsorption rate of sulfur dioxide/oxidized forms of sulfur dioxide is described by the relationship:
dm S , t dt = α exp ( β m S , t )
the integration of which in the range from 0 (for t = 0) to mS,∞ (for t = t) allows for the obtainment of the relationship:
m S , t = ln ( t ) β + ln ( α β ) β
where α is the initial adsorption rate (g·kg−1min−1), and β is the Elovich constant, reflecting the degree of surface coverage and activation energy for chemisorption (kg·g−1). Presenting it in the system of semi-logarithmic coordinates (ln(t), mS,t) makes it possible to determine the parameters α and β based on the slope of the straight line and the intercept. Integrating the differential Equation (9) with the above boundary conditions also gave a non-linearized function:
m S , t = 1 β ln ( α β t )

2.3.2. Linear vs. Non-Linear Approach

In order to determine the linear kinetic parameters, the equations presented in Chapter 2.3.1 were used, i.e., Equation (3) for model 1, Equation (6) for model 2, Equation (8) for model 3, and Equation (10) for model 4. The determined kinetic parameters made it possible to determine the curve which shows the course of the reaction as a function of time. On the basis of these curves, a model amount of adsorbed components was determined and compared with the values measured experimentally. The discrepancies between the model and experimental data were analyzed by comparing 9 statistical criteria (summarized in Table 1), i.e., the determination coefficient (R2), the correlation coefficient (R), the relative standard deviation (Δq), sum squared error (SSE), average relative error (ARE), chi-square test (χ2), hybrid fractional error function (HYBRID), Marquardt’s percent standard deviation (MPSD), and the sum of absolute errors (EABS):
where: mS,t,mod is the model amount of adsorbate adsorbed by the adsorbent mass as a function of time (g·kg−1), mS,t,exp is the experimental amount of adsorbate adsorbed by the adsorbent mass as a function of time (g·kg−1), N is the number of experimental points and p is the number of parameters in a given mathematical model. The high data convergence is evidenced by the lowest possible value of the criteria, Δq, SSE, ARE, χ2, HYBRID, MPSD, and EABS, and the highest possible values for the criteria, R2 and R (Figure 2 and Table 2).
In order to determine the kinetic parameters via the linear method, the equations presented in Section 2.3.1 were used, i.e., Equation (4) for model 1, Equation (7) for model 2, Equation (8) for model 3, and Equation (11) for model 4. For each data series, these equations were solved in 9 different variants, assuming the minimization of individual statistical criteria (collected in Table 1). To select the optimal variant for the best convergence of the model and experimental results, the criterion of the sum of normalized errors (SNE) was applied, which took into account the values of each statistical error, in accordance with the method described in [38,39]. The variant with minimal SNE error was considered to be the optimal non-linear variant. In order to compare the effectiveness of the linear and non-linear approach, Section 3.3 compares the values of 9 statistical error functions and model curves for the best linear variant with the selected optimal non-linear variant (determined based on the lowest SNE value).

3. Results and Discussion

A detailed analysis of the adsorption capacity of unburned carbon from lignite fly ash and activated carbons based on hard coal dust in relation to SO2 was presented in the previous work by one of the authors [30]. This work also includes the characterization of the porous structure and the quantitative and qualitative analysis of surface oxygen functional groups, the key to the efficiency of the sulphur dioxide binding process. Therefore, this paper focuses on the mathematical description, which enables a deeper understanding of the mechanism of the observed reactions and to identify the optimum way to predict the behaviour of unburned carbons.

3.1. Linear Regression

The results of the model tests for linear regression are shown in Figure 2. As shown by the test results, the highest sorption capacity against sulfur dioxide is shown by unburned carbons UnCarb_MAsh and UnCarb_LAsh (Figure 2b,c). By mass, these materials adsorbed 28.90 and 28.95 g of S per kg of adsorbent, respectively. Among the selected materials, the lowest concentration of the active agent is characteristic of commercial activated carbons formed on the basis of hard coal dust. The mass of adsorbed sulfur dioxide for the AKP-5 and AKP-5/A samples is 41 and 32% lower than the least adsorbing unburned carbon (UnCarb_HAsh), for which 25.15 g S per kg of adsorbent was demonstrated. Additionally, due to the presence of oxygen and water vapor in the measurement system, the sorption capacity of the samples increased. The percentage of sulfur in the solid phase after the process increased 1.6 times for the UnCarb_LAsh material, while for commercial materials this value did not exceed 1.3 (Figure 2f,g).
As can be observed, the reaction rate constants determined during the tests range from 0.123 min−1 (AKP-5/A, SO2 + Ar + H2O(g) + O2) to 0.423 min−1 (UnCarb_HAsh, SO2 + Ar) for model 1 and from 0.0156 kg·g−1·min−1 (UnCarb_HAsh, SO2 + Ar) up to 0.114 kg·g−1·min−1 (UnCarb_LAsh, SO2 + Ar) for model 2 (Table 2). According to the theory, for both models, materials that quickly bind the adsorbate should be characterized by high reaction rates. However, in practice, the correlation between the values of k1 and k2 has not been confirmed. Interestingly, the calculations made for model 1 show a reduction in the rate of the adsorption process in the presence of H2O(g) and O2 (0.123–0.155 min−1 under SO2 + Ar + H2O(g) + O2 vs. 0.214–0.423 min−1 under SO2 + Ar).
A model parameter of great practical importance is the amount of adsorbate related to the equilibrium conditions mS,∞ (for unlimited contact time). It is interesting that this coefficient, determined on the basis of model 2, reaches a value similar to that obtained experimentally (for a contact time of 30 min), and the discrepancies (averaged for all analyzes) do not exceed 3.5% (Figure 3).
The calculations made for model 3 show that the values of the kid coefficient range from 2.81 AKP-5/A, SO2 + Ar) to 7.77 g·kg−1·min−0.5 (UnCarb_LAsh, SO2 + O2 + H2O(g) + Ar), while parameter C varies from 1.76 (AKP-5/A, SO2 + Ar) to 12.1 g·kg−1 (UnCarb_LAsh, SO2 + O2 + H2O(g) + Ar) (Table 2). In view of the information from [40], high C values and the low kid would indicate a role that the diffusion-controlled boundary layer could play. The reverse configuration of the discussed parameters would prove that the speed-limiting stage of the process was diffusion inside the pores of the solid phase surface. Nevertheless, as shown in Figure 2, the described model does not faithfully reflect the course of the reaction, which to some extent confirms the kinetic nature of the experiments performed. However, it is interesting that the addition of H2O(g) and O2 to the gas mixture significantly increased the C value (4.13 and 12.1 g∙kg−1 vs. 1.76 and 9.56 g∙kg−1, respectively, for the AKP-5/A and UnCarb_LAsh tests). Considering the information presented above, it should be assumed that under the conditions of the SO2 + Ar + H2O(g) + O2 mixture, the boundary layer effect in the SO2 adsorption process will be greater.
The kinetic parameters determined for model 4 are theoretical and physicochemical interpretation is difficult. Moreover, as far as the author is aware, the literature lacks studies on the kinetics of SO2 adsorption on unburned carbons, which would make it possible to compare the obtained results. Interestingly, the registered change in kinetic parameters for the addition of H2O(g) and O2 to the gas mixture would indicate a change in the kinetics of SO2 adsorption. In the case of the UnCarb_LAsh test, a decrease was noted in both the value of the reaction rate constant α and the degree of surface coverage with the β adsorbate (0.515 g∙kg−1min−1 and 0.160 kg∙g−1 vs. 5917 g∙kg−1min−1 and 0.370 kg∙g−1); for the AKP-5/A sample, the intensification of each of them (62.6 g·kg−1min−1 and 0.285 kg·g−1 against 8.24 g·kg−1min−1 and 0.206 kg·g−1) (Table 2).
Table 3 presents the analysis of statistical errors in kinetic models solved by the linear regression method. The highlighted data (in colours and bold) indicate the most appropriate values for a given sample out of the four analyzed models.
In the case of the SO2 + Ar mixture, for commercial samples of activated carbons, regardless of the statistical error function, the quality of the results suggests that SO2 adsorption is a first-order kinetic reaction. However, bearing in mind the considerations of Płaziński and Rudziński in [41,42], we should be cautious to hypothesize about a specific physical model of adsorption in the case of Equation (3). There is a belief that the indicated equation is not able to reflect changes in the mechanism controlling the adsorption kinetics, and the adjustment of the model data to the experimental data, especially in the case of systems close to the equilibrium state, results rather from mathematical foundations.
In the case of the UnCarb_HAsh trial, inconsistency in the indication of error values was obtained. It is highly likely related to the heterogeneity of the sample (ash content 57.3% for UnCarb_HAsh, 44.6% for UnCarb_MAsh, 12.8% for the UnCarb_LAsh [30]). Nevertheless, as evidenced in Table 3, 5 (Δq, ARE, χ2, HYBRID, MPSD) out of 9 functions indicate that model 4 reflects the empirical data most accurately. The determination (R2) and correlation (R) coefficients, as well as the sum squared error (SSE) indicate model 2; and the sum of absolute errors (EABS)—model 1. However, bearing in mind the information that in the case of the first and second-order models (models 1 and 2), the ability to fit data may result only from the mathematical properties of Equations (3) and (6), and not from specific physical assumptions, the compliance of adsorption with the kinetic mechanism of chemisorption on a heterogeneous surface was adopted for further comparative analyzes (according to model 4).
In the case of the UnCarb_MAsh and UnCarb_LAsh trials, greater consistency of the statistical error values was obtained, and their quality indicates the importance of the chemisorption phenomenon. This confirms the observations described in [30] that even in the absence of molecular oxygen in the gas mixture, the interaction between the adsorbate molecules and the carbon material occurs both due to relatively weak intermolecular van der Waals forces (corresponding to physical adsorption), as well as the chemical binding of sulfur dioxide.
The change of the atmosphere into SO2 + O2 + H2O(g) + Ar indicates that the reliability of the analyzed models changes towards model 1 < model 3 < model 2 < model 4. These data, in line with the results of experimental research [30], also prove the formation of strong chemical bonds between the adsorbent and the adsorbate in the presence of oxygen and water vapor, thus indicating a strong inhomogeneity of the adsorbent surface.

3.2. Non-Linear Regression

In the case of describing sulfur dioxide adsorption by non-linear regression, the so-called sum of normalized errors (SNE) method was applied, allowing to select the most appropriate error function used to optimize kinetic parameters. This method makes it possible to estimate the values that are not burdened with the error resulting from the use of only one type of function and enables the selection of the model that best describes the adsorption process.
Figure 4 shows the distribution of the parameter of the sum of normalized errors for all tested samples. As can be seen, the SNE value determined for one data series varies greatly. Within a given model, it may even decrease twofold (e.g., for the UnCarb_HAsh trial and model 3: 8.81 in the case of minimizing the R2 criterion and 4.39 in the case of minimizing the EABS criterion). Especially in the case of models 3 and 4, there is a correlation that minimization of the determination coefficient (R2) and correlation (R) leads to high SNE values. This observation does not confirm the commonly used assumption that the models with R2 > 0.7 describe the studied phenomena reliably [43,44]. It is therefore clear that fitting data by any of the non-linear equations based on the R or R2 functions only, cannot be treated as evidence or prerequisite of the existence of a mechanism that determines the kinetics or dynamics of adsorption in a given system. Notwithstanding the fact that it is quite common in the literature to use them as a basis for the assessment of the quality of fitting kinetic data to experimental data [45,46,47]. Interestingly, the analyses were performed to prove a certain universality of the χ2 and HYBRID functions. As noted, in 15 out of 28 cases the minimization of these functions led to the lowest SNE values for individual models (Table 4). For example, for the AKP-5 sample, HYBRID values in the range 5.60–6.28 were recorded—the lowest for models 1, 2, and 4; in the case of the AKP-5/A sample (SO2 + Ar + H2O(g) + O2), the noted values of χ2 were in the range 4.27–8.09—the lowest for models 2, 3, and 4.
Table 4 distinguishes the error functions used for non-linear regression (out of 9), for which the most appropriate values of the SNE function were obtained. These values served as a criterion for selecting an appropriate mathematical model for the discussed adsorption case. As can be seen, regardless of the tested sample and process conditions, in the case of models 1 and 2, the lowest SNE values were obtained by minimizing the complex fractional error function (HYBRID), and for models 3 and 4, by Marquardt’s percentage standard deviation (MPSD). Interestingly, all the indicated values correspond to the SO2 + Ar mixture. As a result of wetting and oxygenating the gas mixture, the functions of 9 statistical errors for each model generated higher SNE values.
A detailed analysis of the nonlinear fit and SNE values (Table 4 and Table 5), at the level of the tested samples and process conditions, clearly indicates that under the conditions of the SO2 + Ar mixture, in the case of commercial activated carbons and the unburned activated carbon UnCarb_MAsh sample, permanent bonding of sulfur dioxide could have occurred. Compatibility of adsorption with the Elovich equation (model 4) shows that the adsorption sites increased exponentially with the course of the process, which resulted in multilayer adsorption. Interestingly, for the UnCarb_HAsh and UnCarb_LAsh (SO2 + Ar and SO2 + Ar + H2O(g) + O2) and AKP-5/A (SO2 + Ar + H2O(g) + O2) samples, diffusion in boundary layers or inside the pores of adsorbents (model 3) could have been the stage limiting the adsorption rate. Considering the high values of parameter C (od 8.17 do 24.3 g·kg−1) (Table 5), it can be indicated that in the case of the UnCarb_LAsh and AKP-5/A samples, internal diffusion of sulfur dioxide dominated over the general adsorption kinetics. The phenomenon of external diffusion should rather be noted for the UnCarb_HAsh sample (C = 0) (Table 5), similar to the case [48].
It is worth emphasizing, disregarding the values of the SNE function, that as a consequence of the addition of H2O(g) and O2 to the gas mixture, the kinetic parameters of SO2 adsorption have changed (Table 5). Analogously to the linear regression method (Table 2), for both samples (UnCarb_LAsh and AKP-5/A) an increase in the boundary layer effect was noted (in accordance with C). Moreover, for the AKP-5/A test, the rate of SO2 adsorption under the SO2 + Ar + H2O(g) + O2 mixture was intensified (in accordance k1, k2 and α).

3.3. Comparative Analysis of Linear and Non-Linear Regression

To assess the validity of the description of the kinetics and dynamics of adsorption by means of linear or nonlinear regression, the values of statistical errors and model curves were compared for the models for which the smallest deviations from empirical data were recorded (Figure 5, Table 6). As can be seen, for 6 out of 7 tested trials, the research clearly proves that it is the linear regression that more accurately reflects the behaviour of the adsorption system (regardless of the process conditions). What is particularly interesting, only for the UnCarb_MAsh sample, the method of linear and nonlinear fitting indicates the same mechanism of the studied phenomenon (model 4). Depending on the applied statistical error, the linear and nonlinear approaches may differ even several dozen times. For example, for the AKP-5/A (SO2 + Ar + H2O(g) + O2) sample it was noted that the HYBRID error reached the value of 0.2 with linear regression and as much as 56 times more with non-linear regression (11.2).
What is also noteworthy, comparing the kinetic parameters from Table 2 for the linear regression method with the parameters from Table 5 for the non-linear regression method, it can be seen that the differences between them can be over 100%. As can be seen, the kid rate constant for the UnCarb_LAsh trial for the linear fit is 1.97 g·kg−1·min−0.5, and for the non-linear fit it is as much as 4.47 g·kg−1·min−0.5 (the difference is 227%).

4. Conclusions

The aim of this article was to determine the parameters of the kinetics and dynamics of adsorption by linear and non-linear regression for the following models: the pseudo first-order (model 1) and pseudo second-order (model 2) models, intraparticle diffusion (model 3), and chemisorption on a heterogeneous surface (model 4). The quality of fitting the model data to the experimental data was analyzed based on 9 statistical error functions (R, R2, Δq, SSE, ARE, χ2, HYBRID, MPSD, EABS) and, in the case of non-linear regression, the normalized error sum (SNE) method. The performed measurements and analyzes lead to the conclusion that:
-
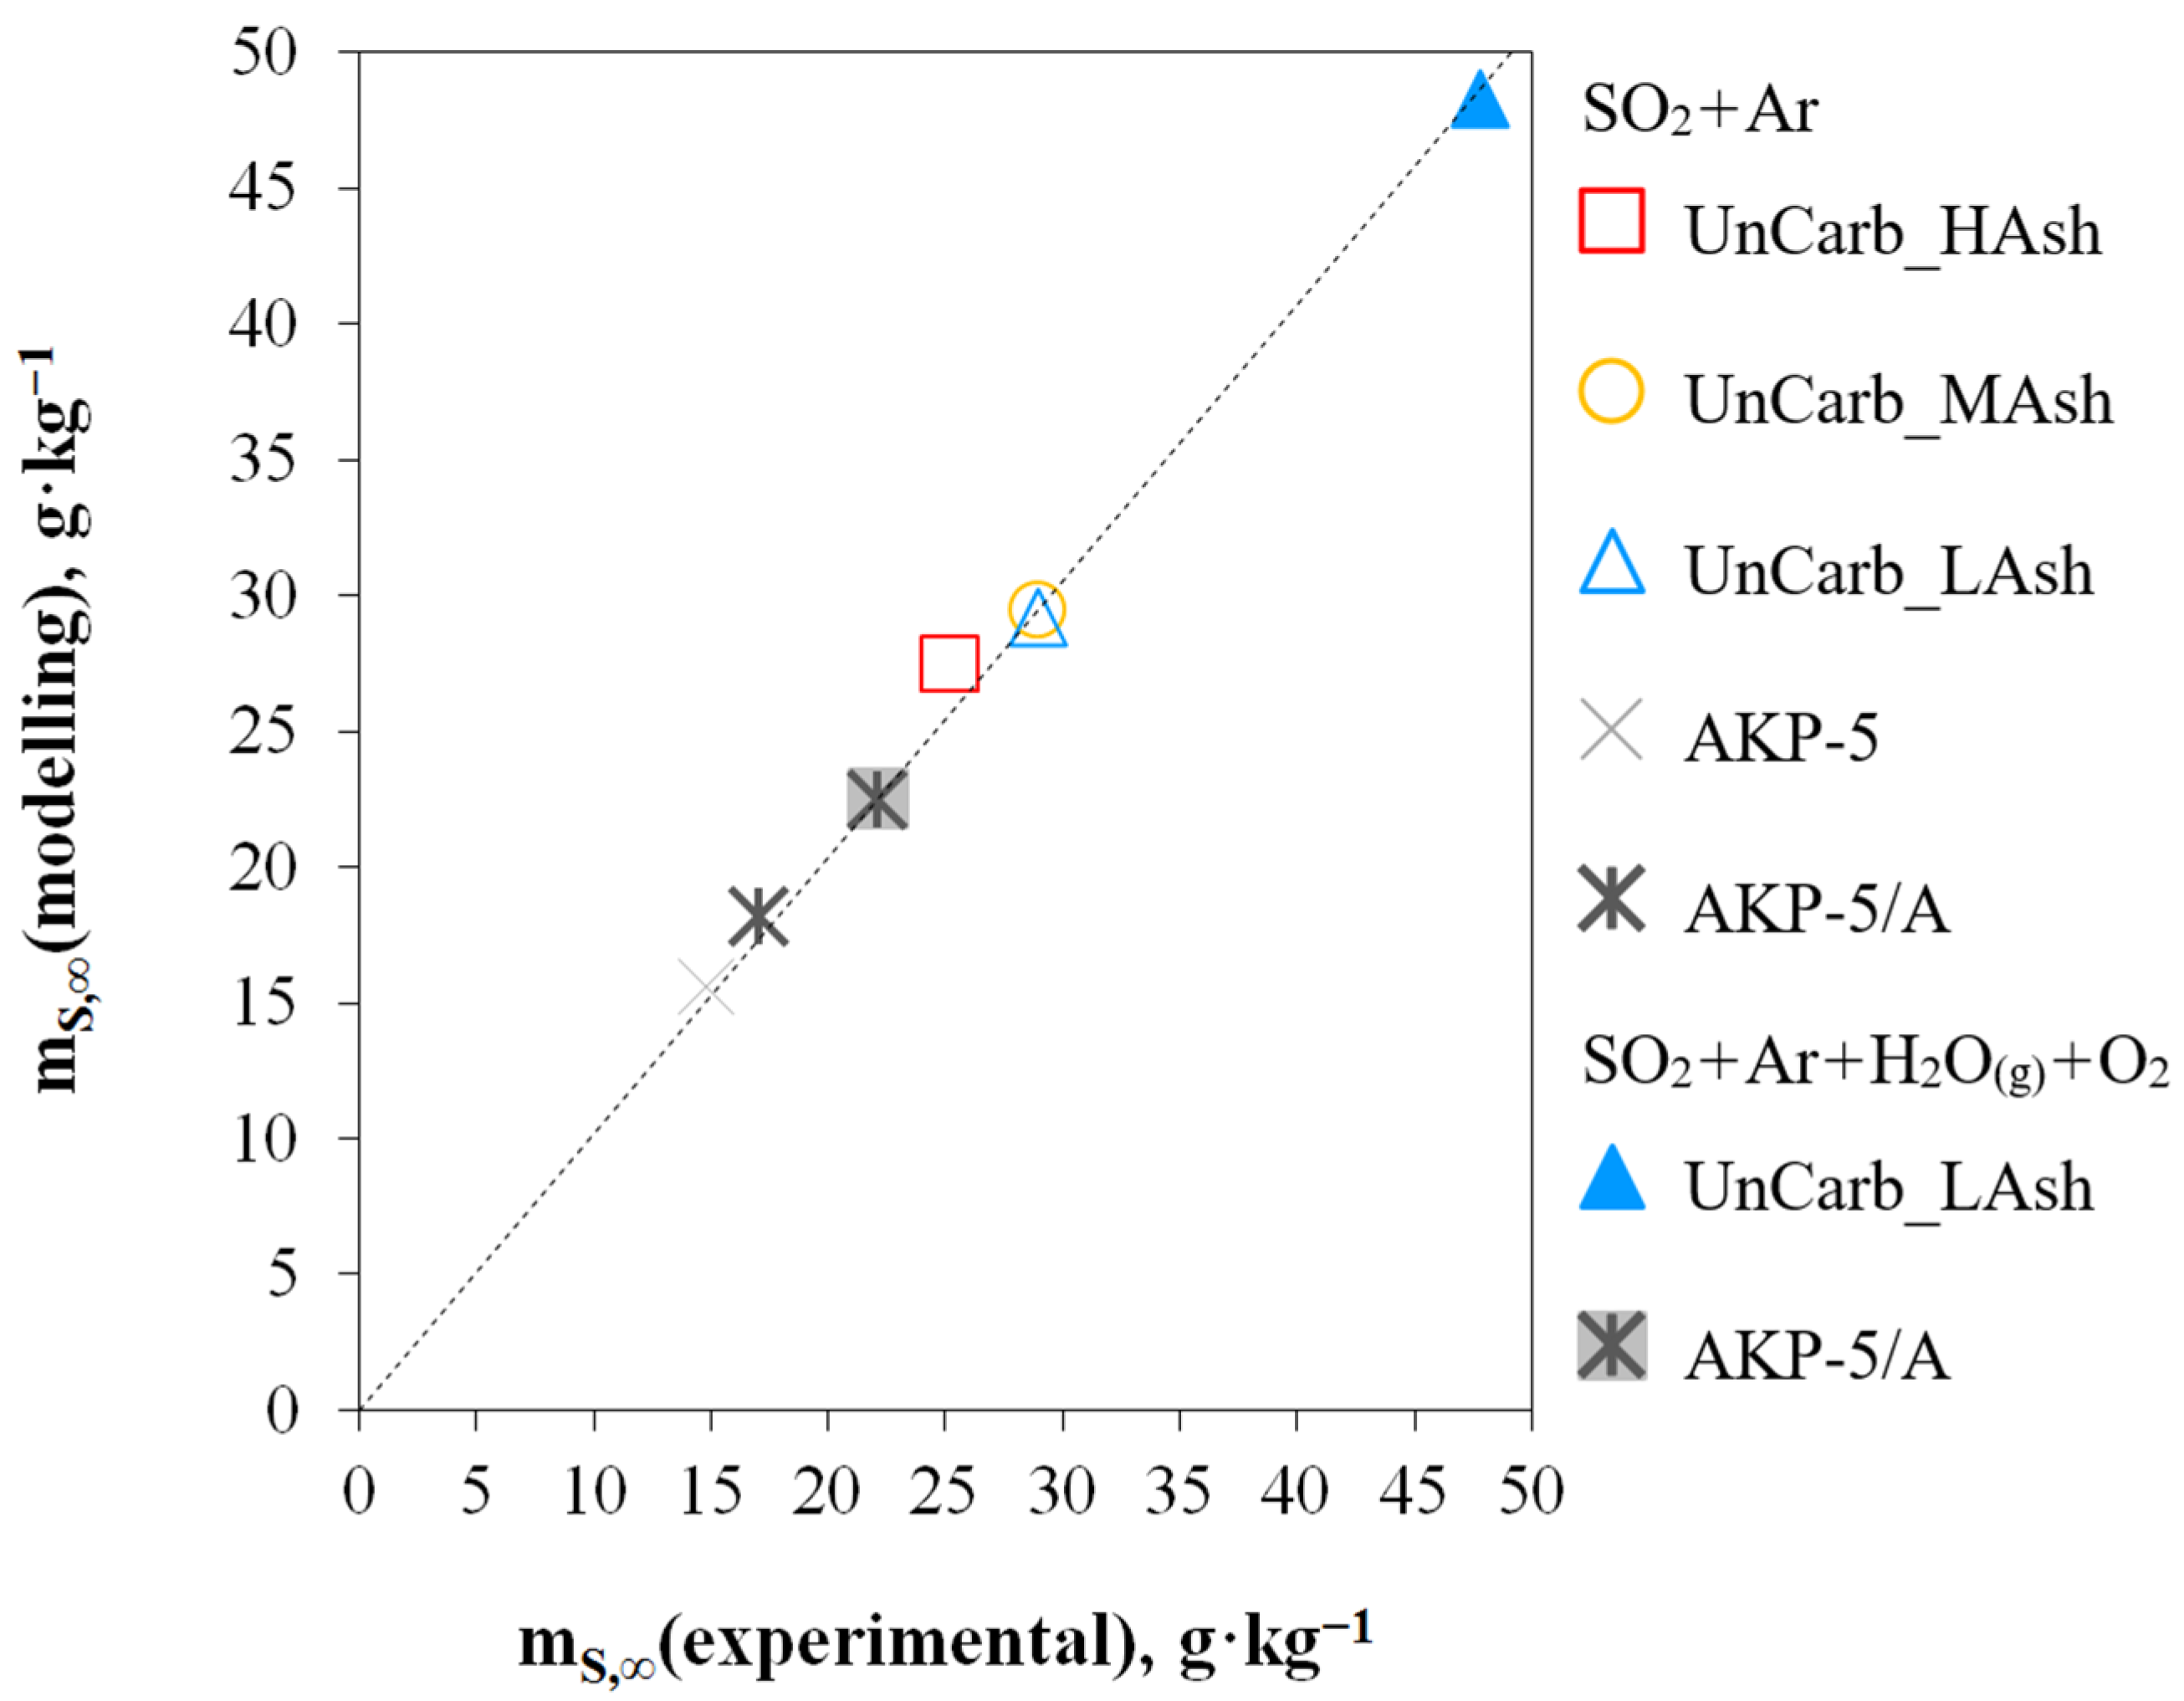
confronting 9 statistical error functions for the models was the most reliable for linear and non-linear regression, respectively, leading to an unequivocal conclusion that it is the linear regression that more accurately reflects the behaviour of the adsorption system (regardless of the process conditions);
-
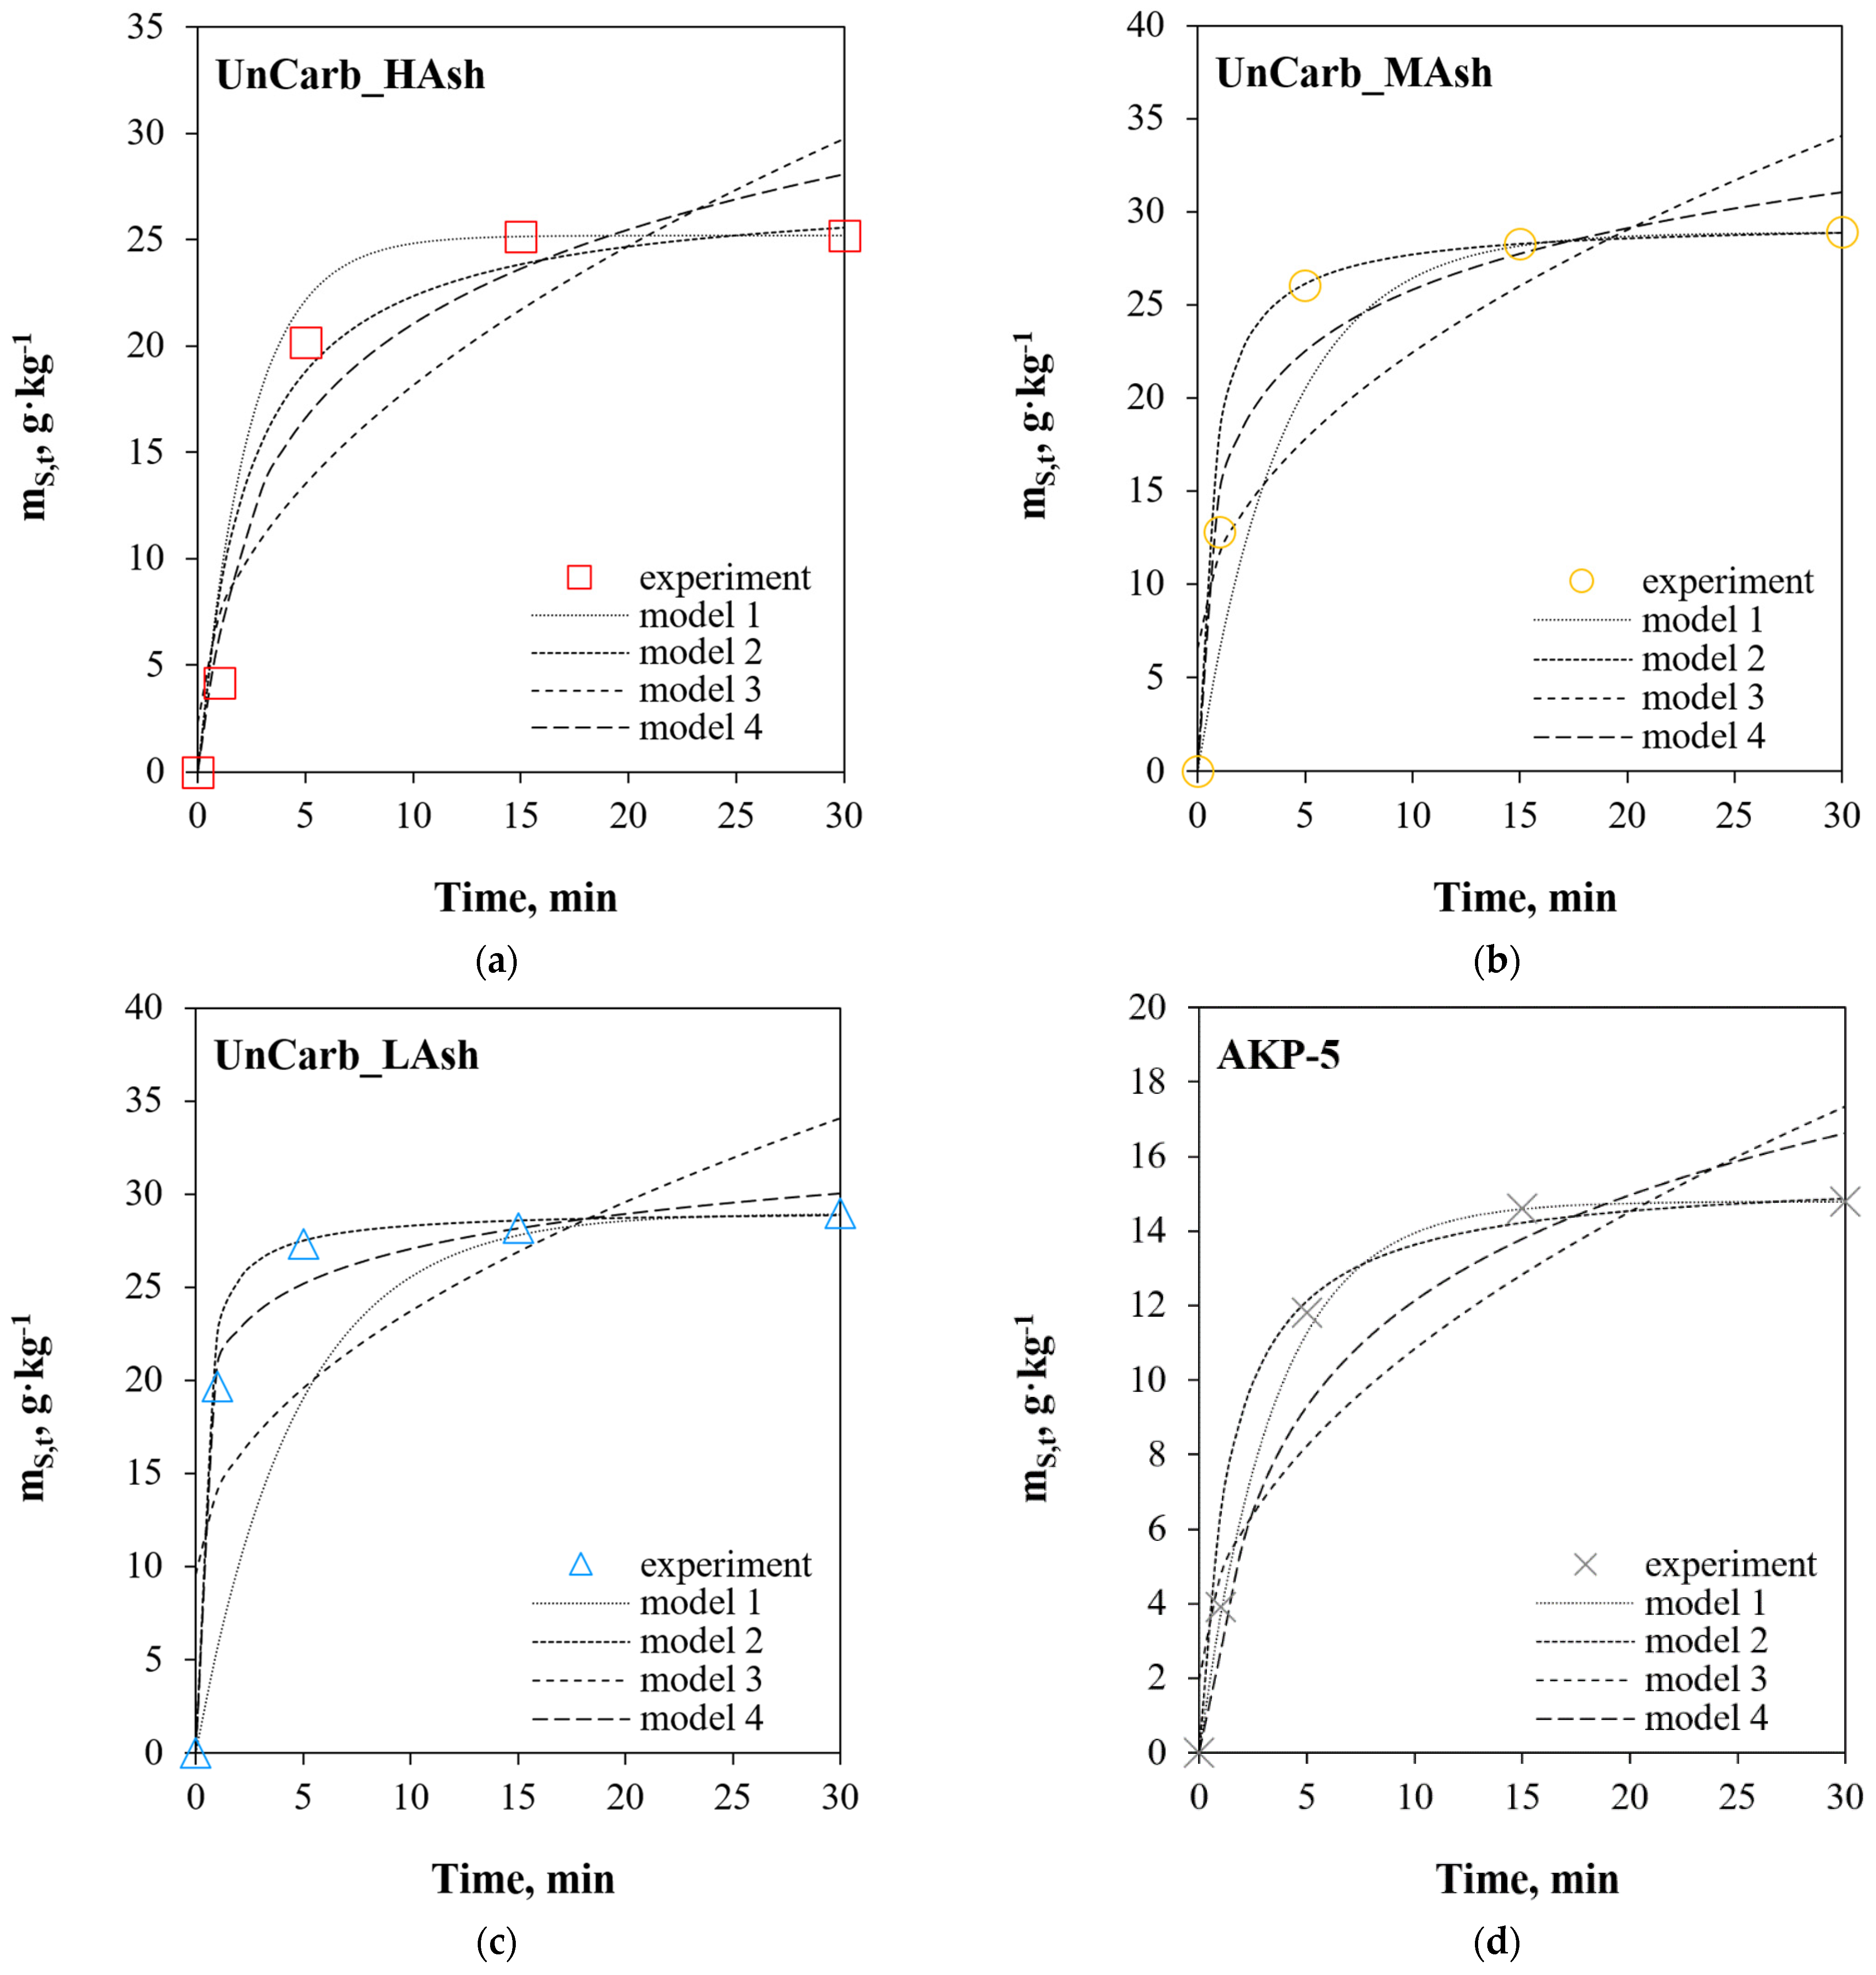
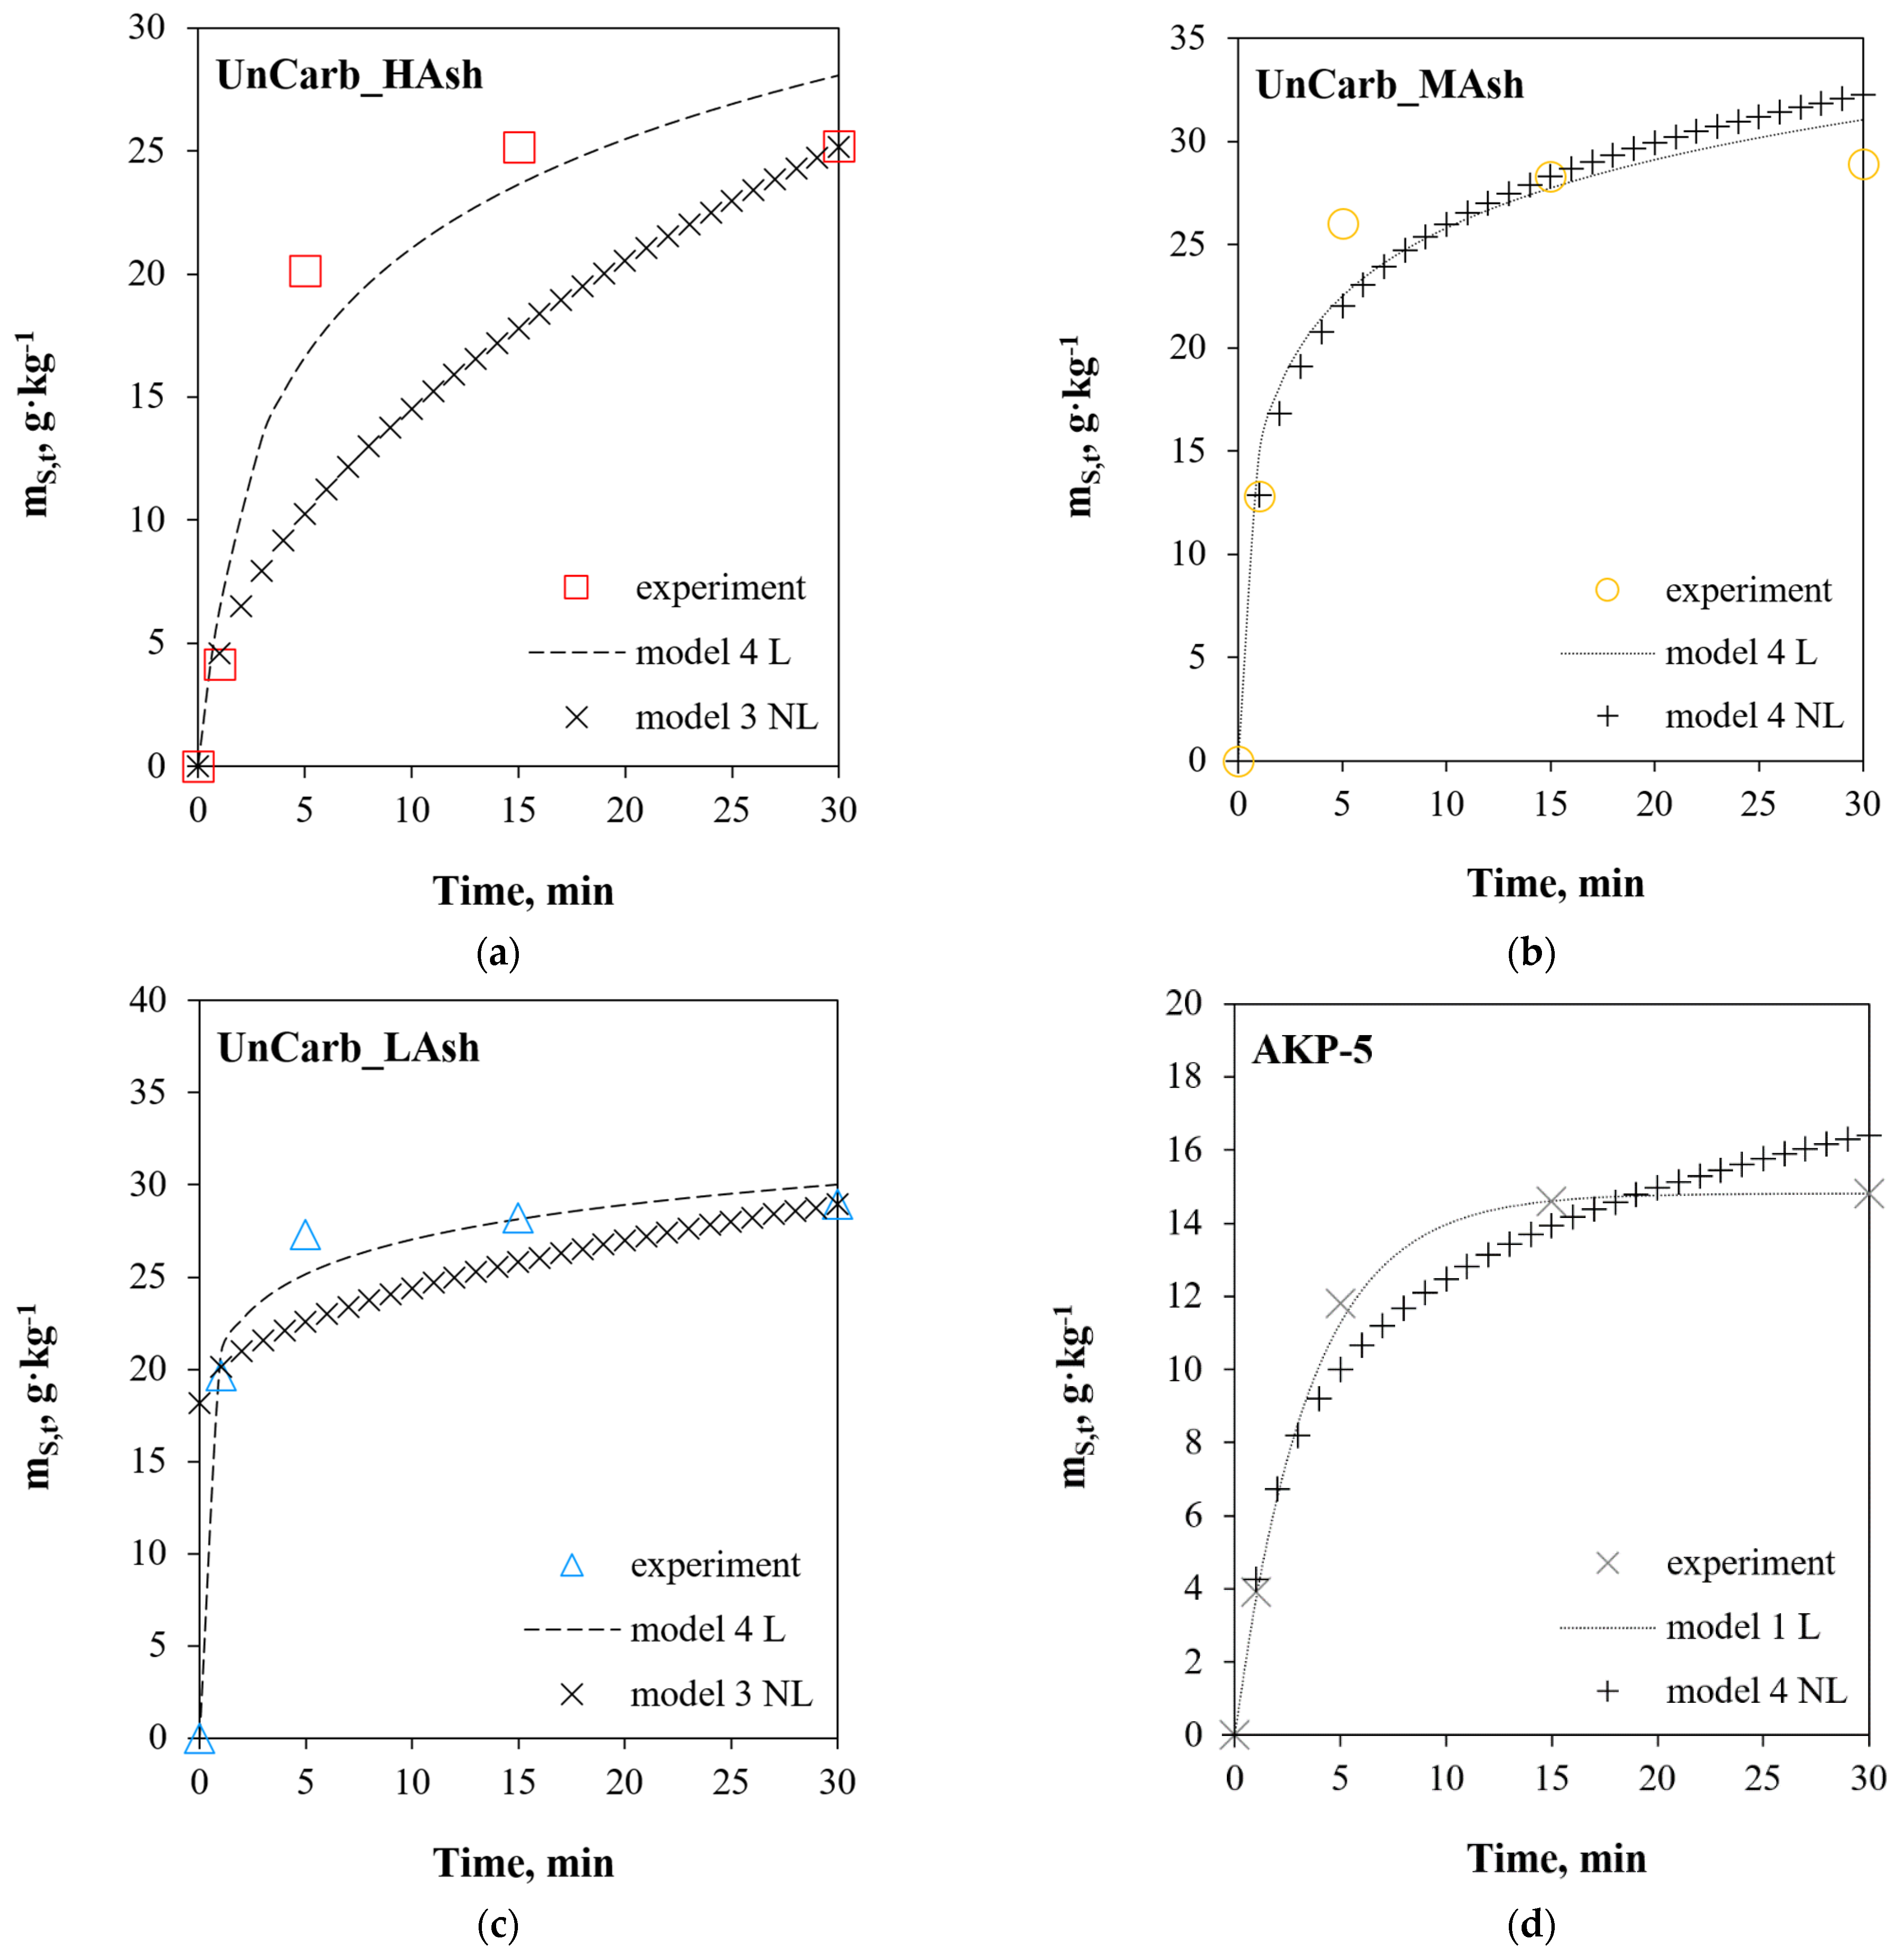
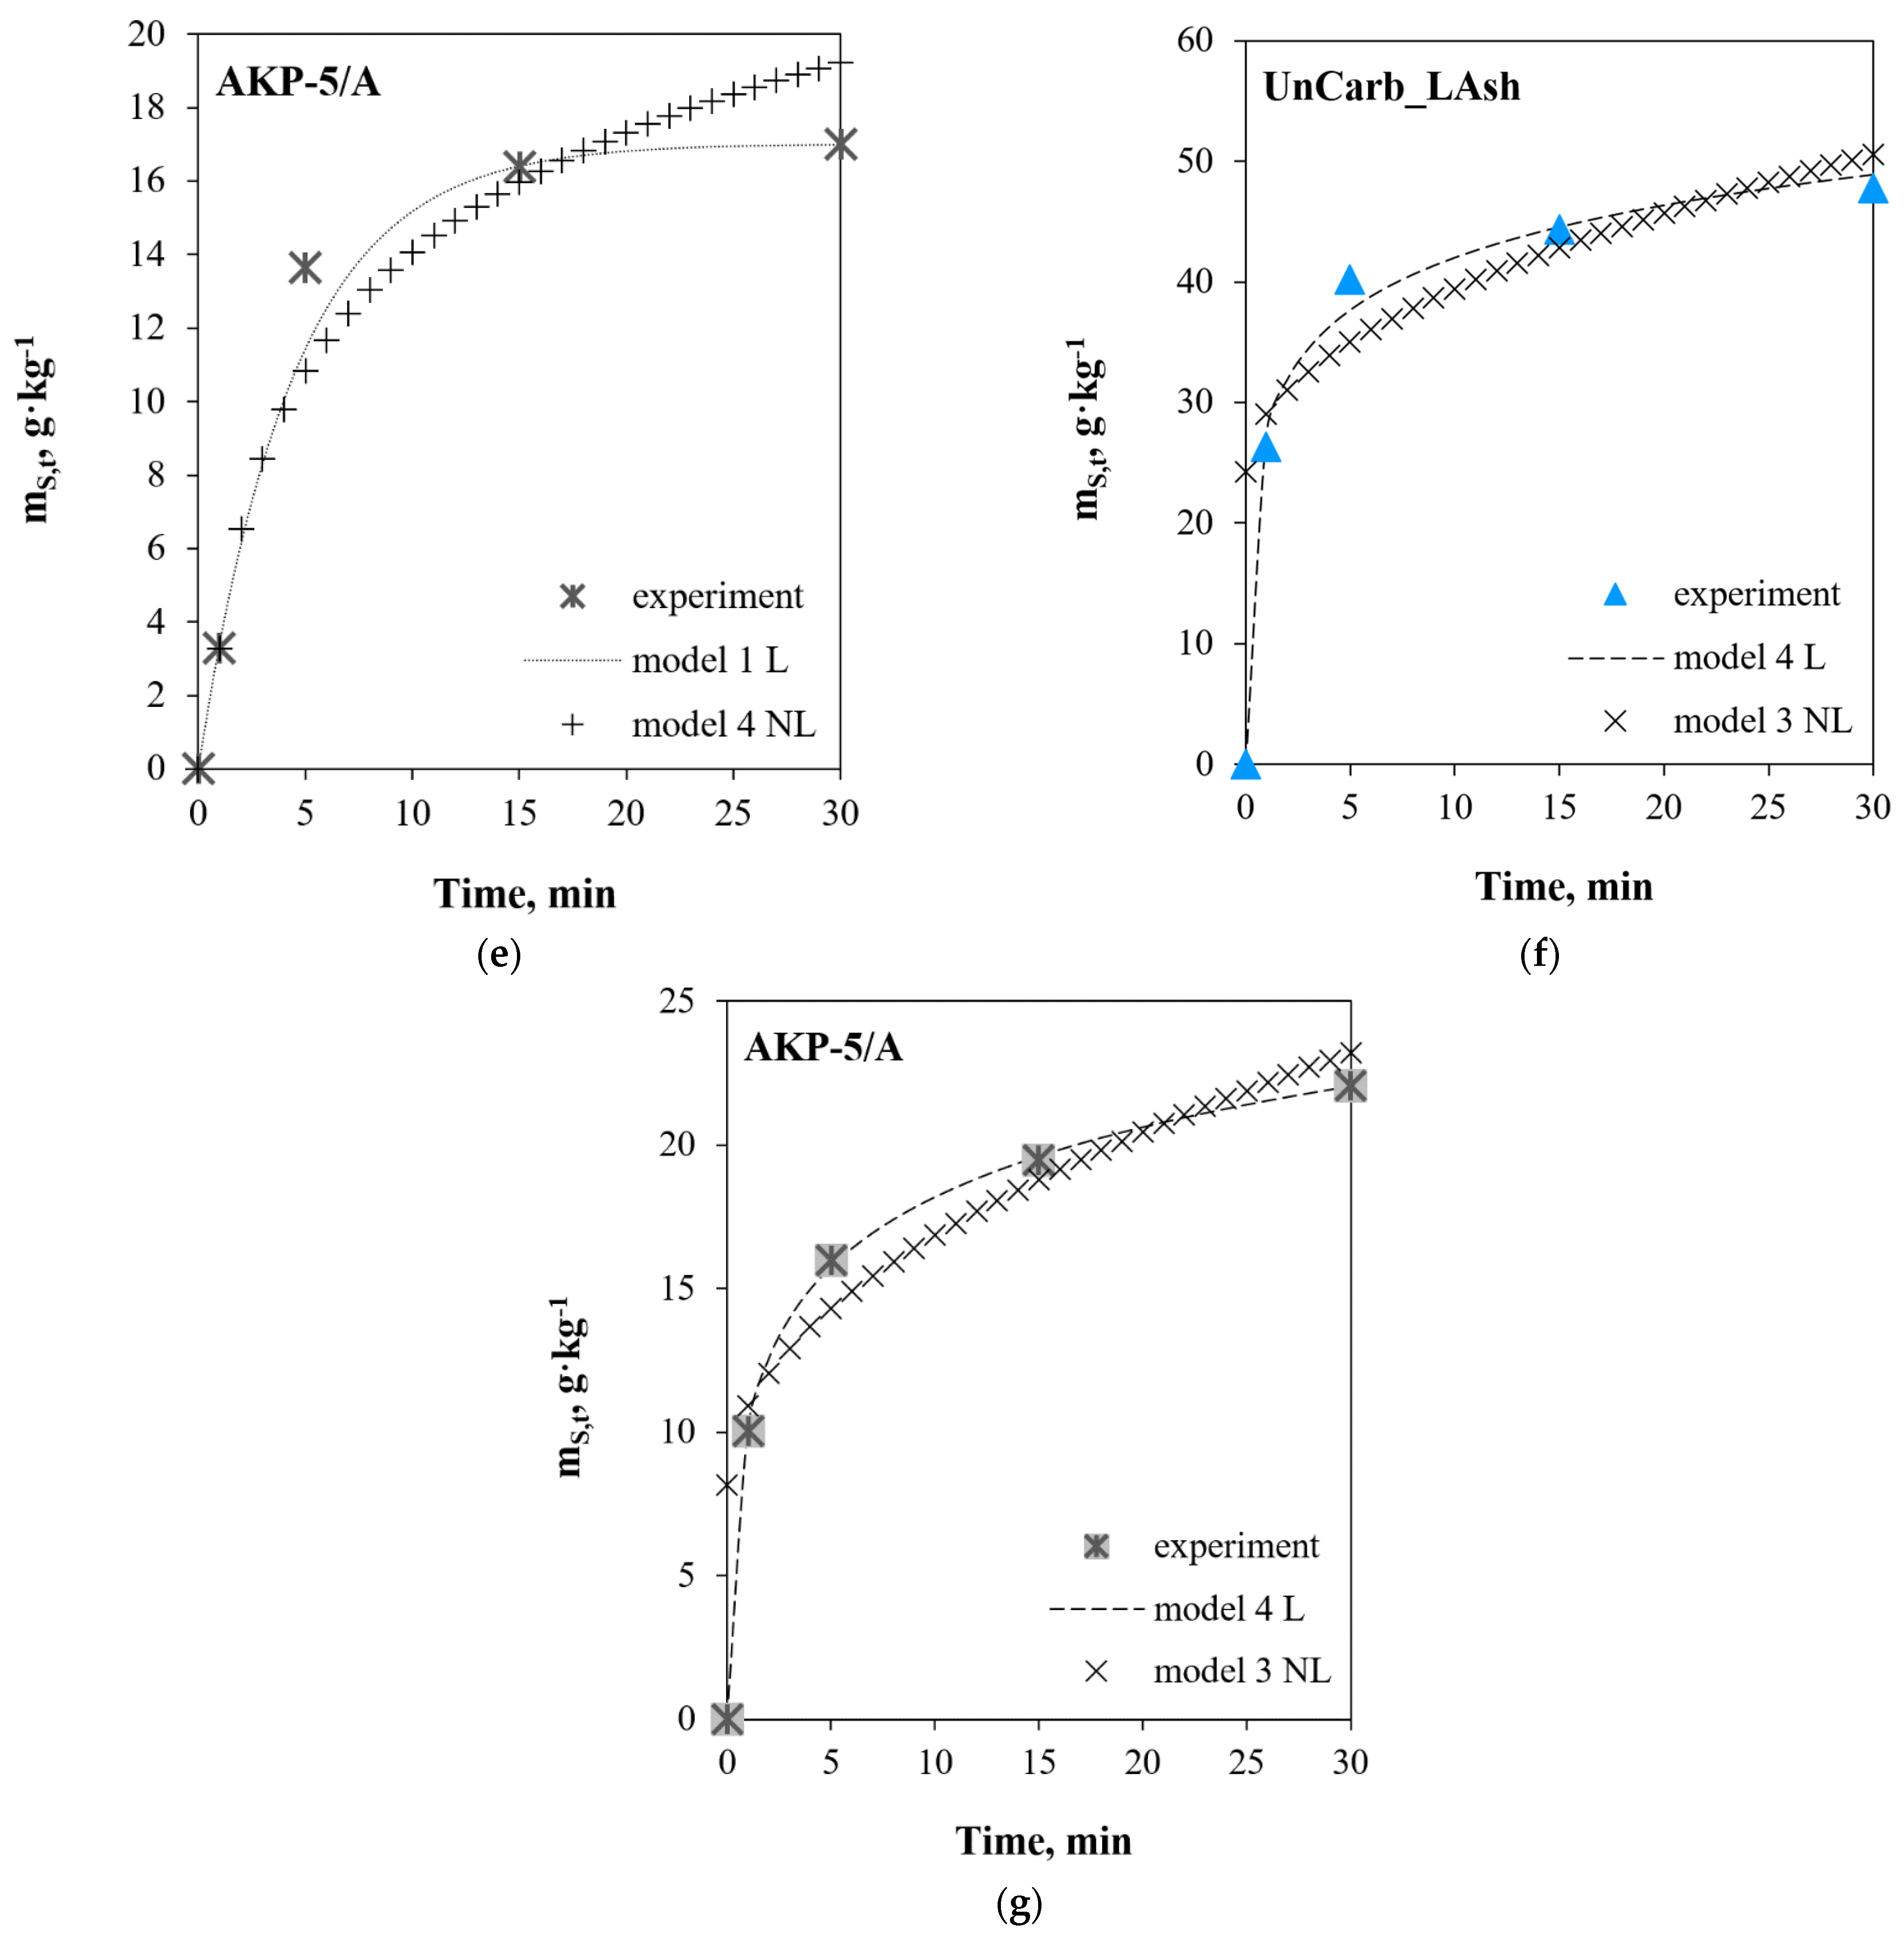
in the case of the SO2+Ar mixture, for commercial samples of activated carbons AKP-5 and AKP-5/A, regardless of the statistical error function, the quality of the results suggests that SO2 adsorption is a first-order kinetic reaction (model 1). However, it should be noted that fitting model data to experimental data for the systems close to the equilibrium state can only result from the mathematical foundations of model 1;
-
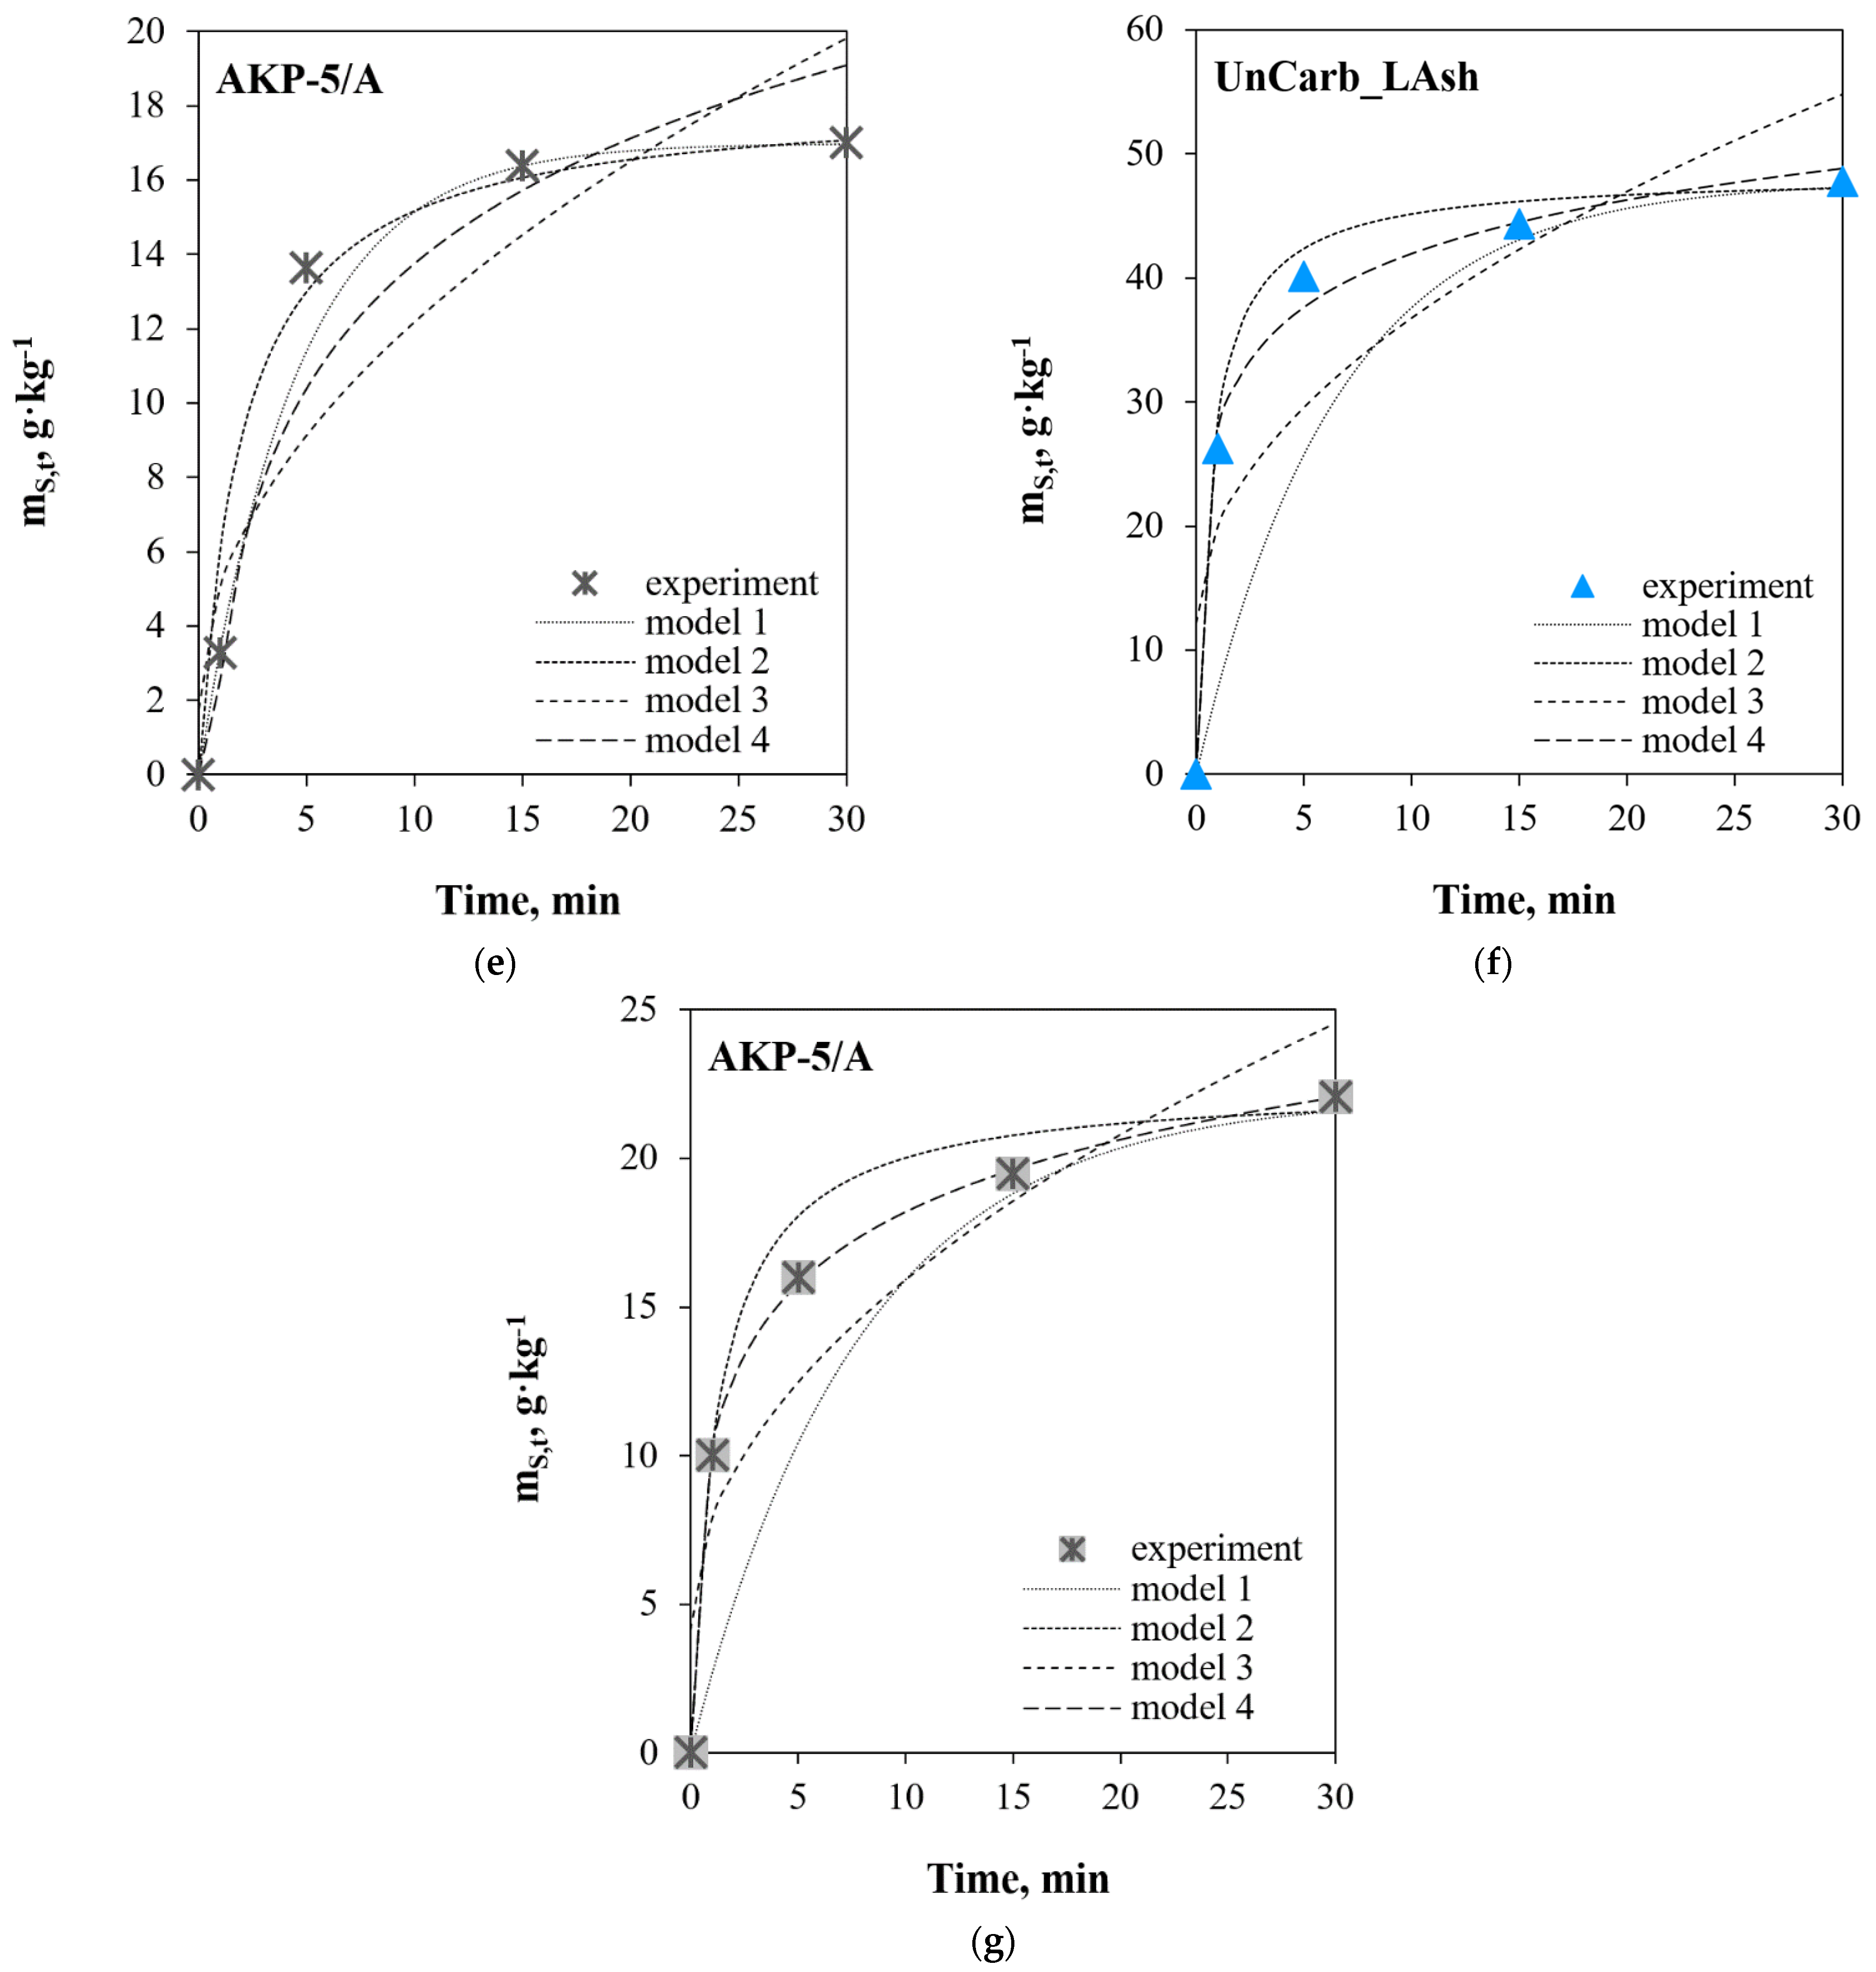
in the case of unburned carbons samples (UnCarb_HAsh, UnCarb_MAsh, UnCarb_LAsh), regardless of the process conditions, and the AKP-5/A (SO2 + Ar + H2O(g) + O2) sample, the quality of the results shows that the adsorption is compatible with the kinetic mechanism of chemisorption on the heterogeneous surface (according to model 4);
-
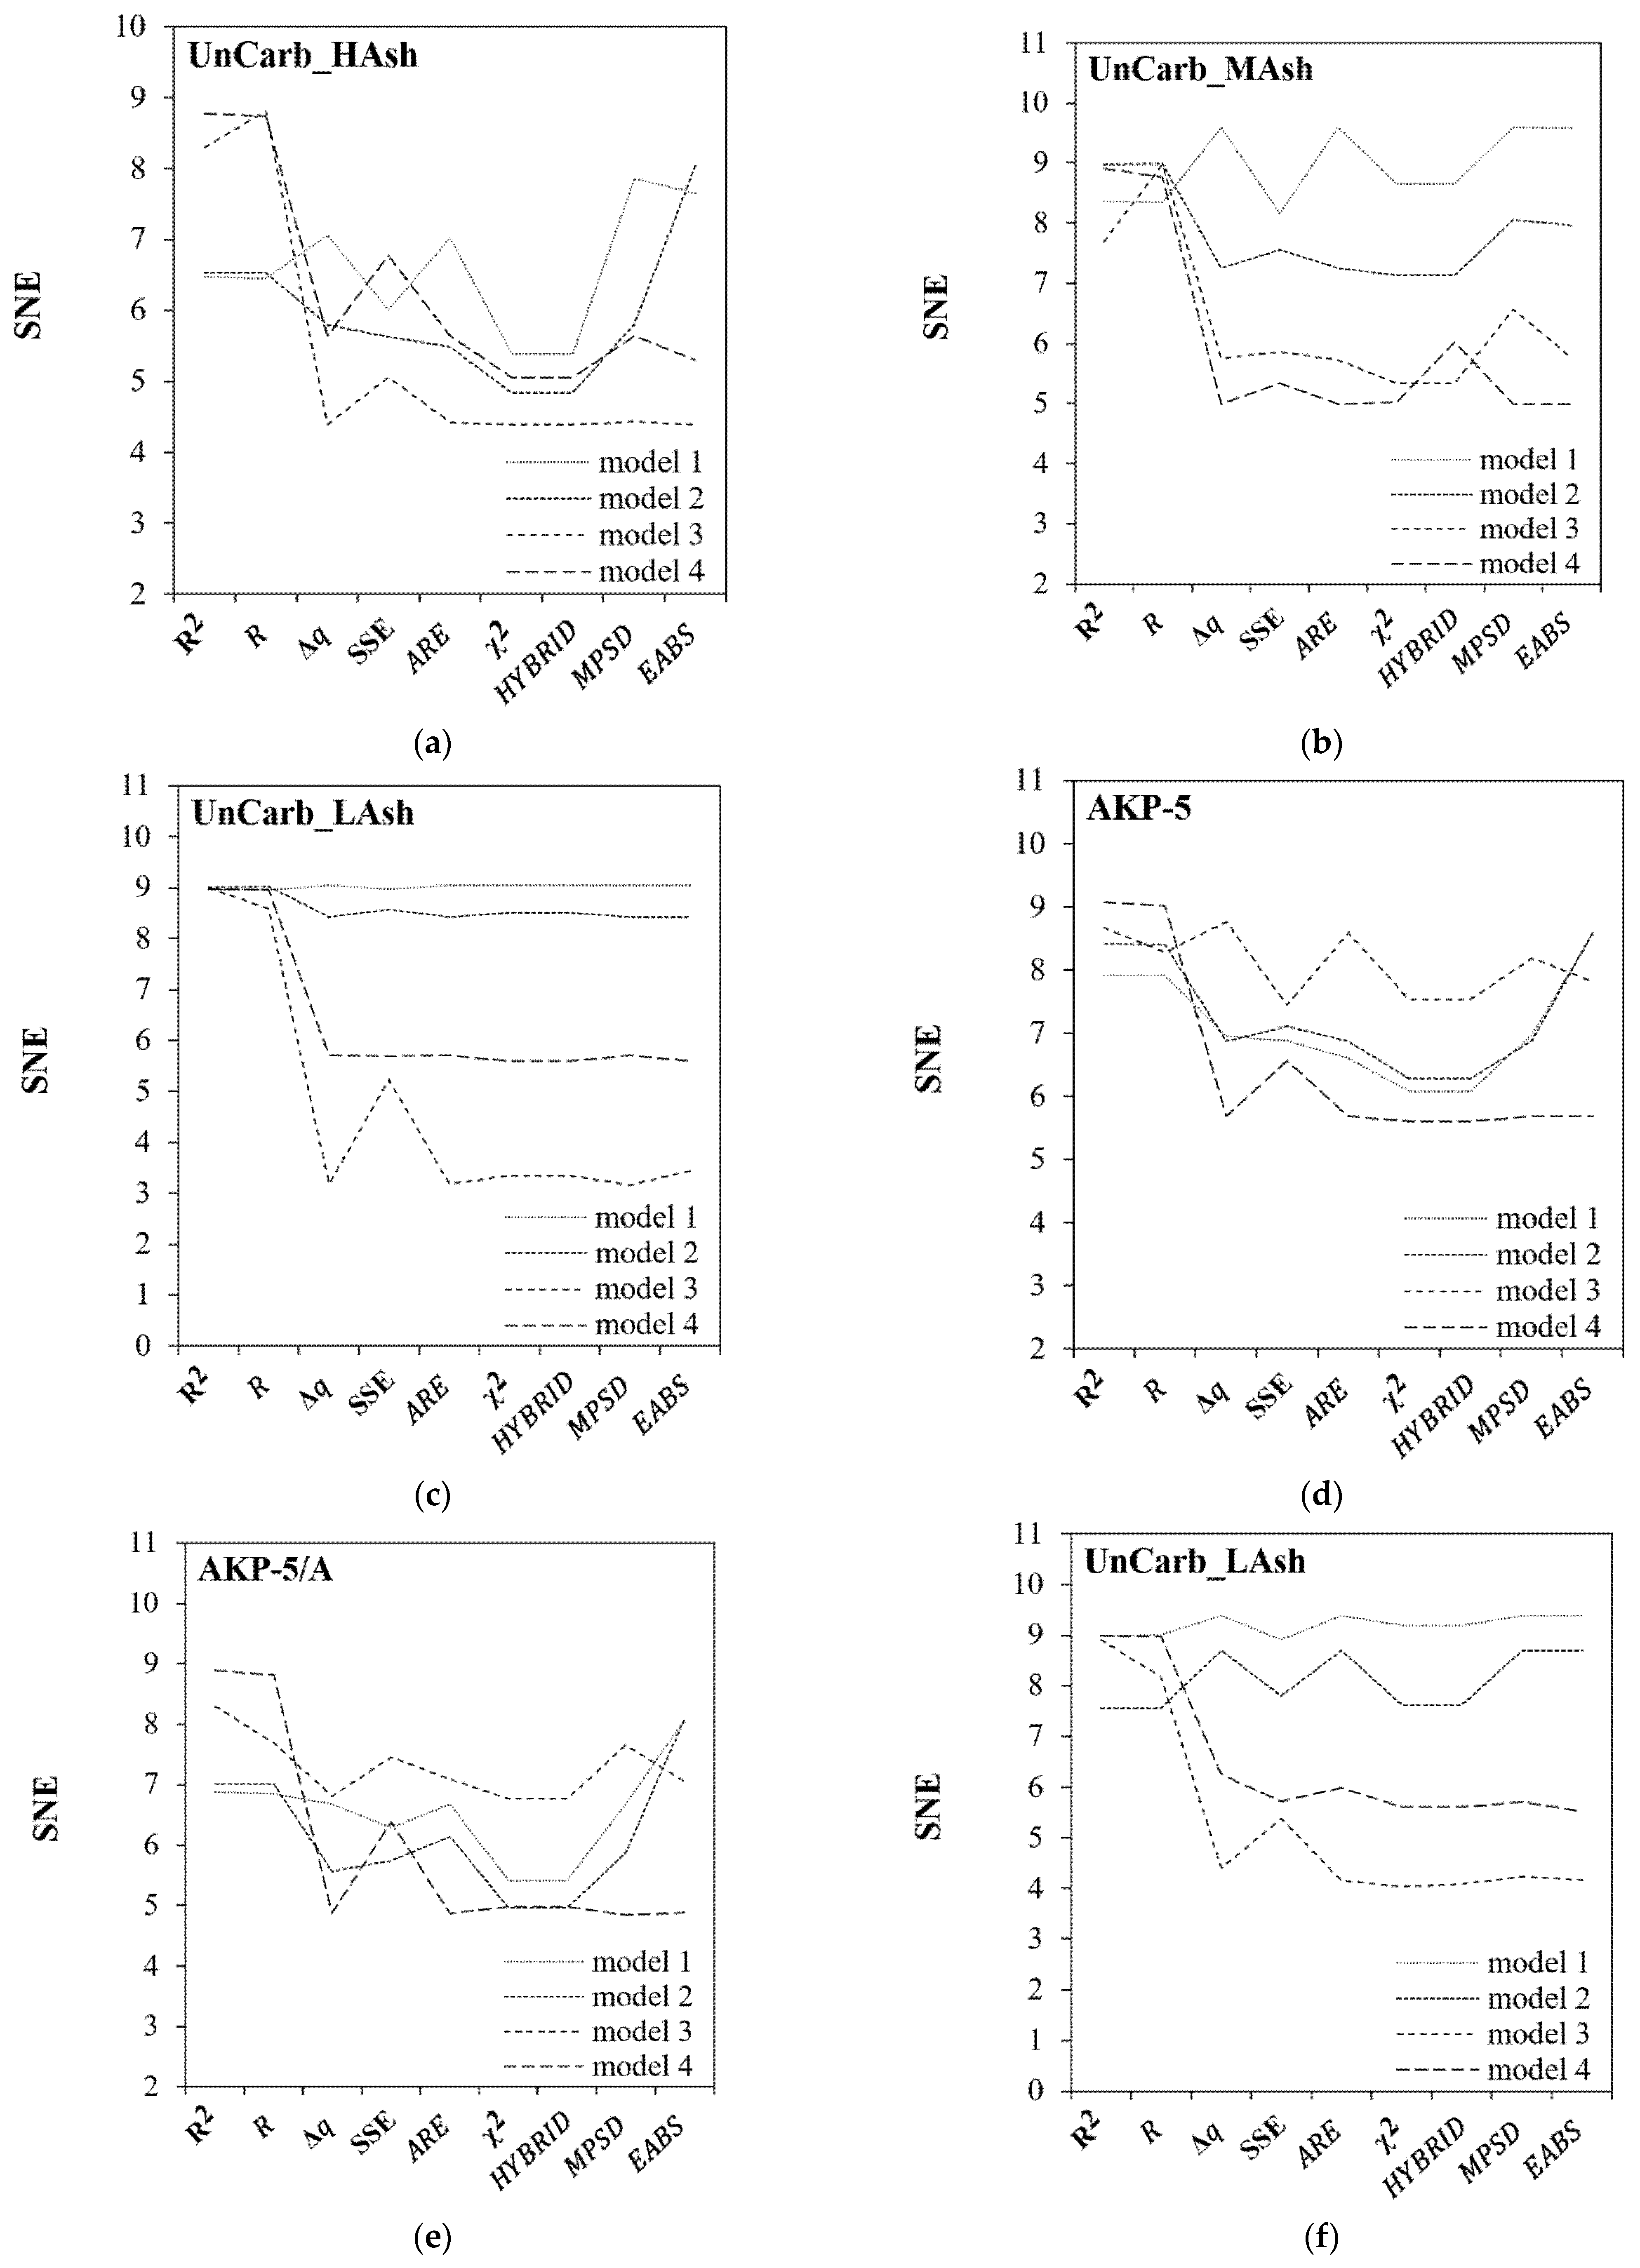
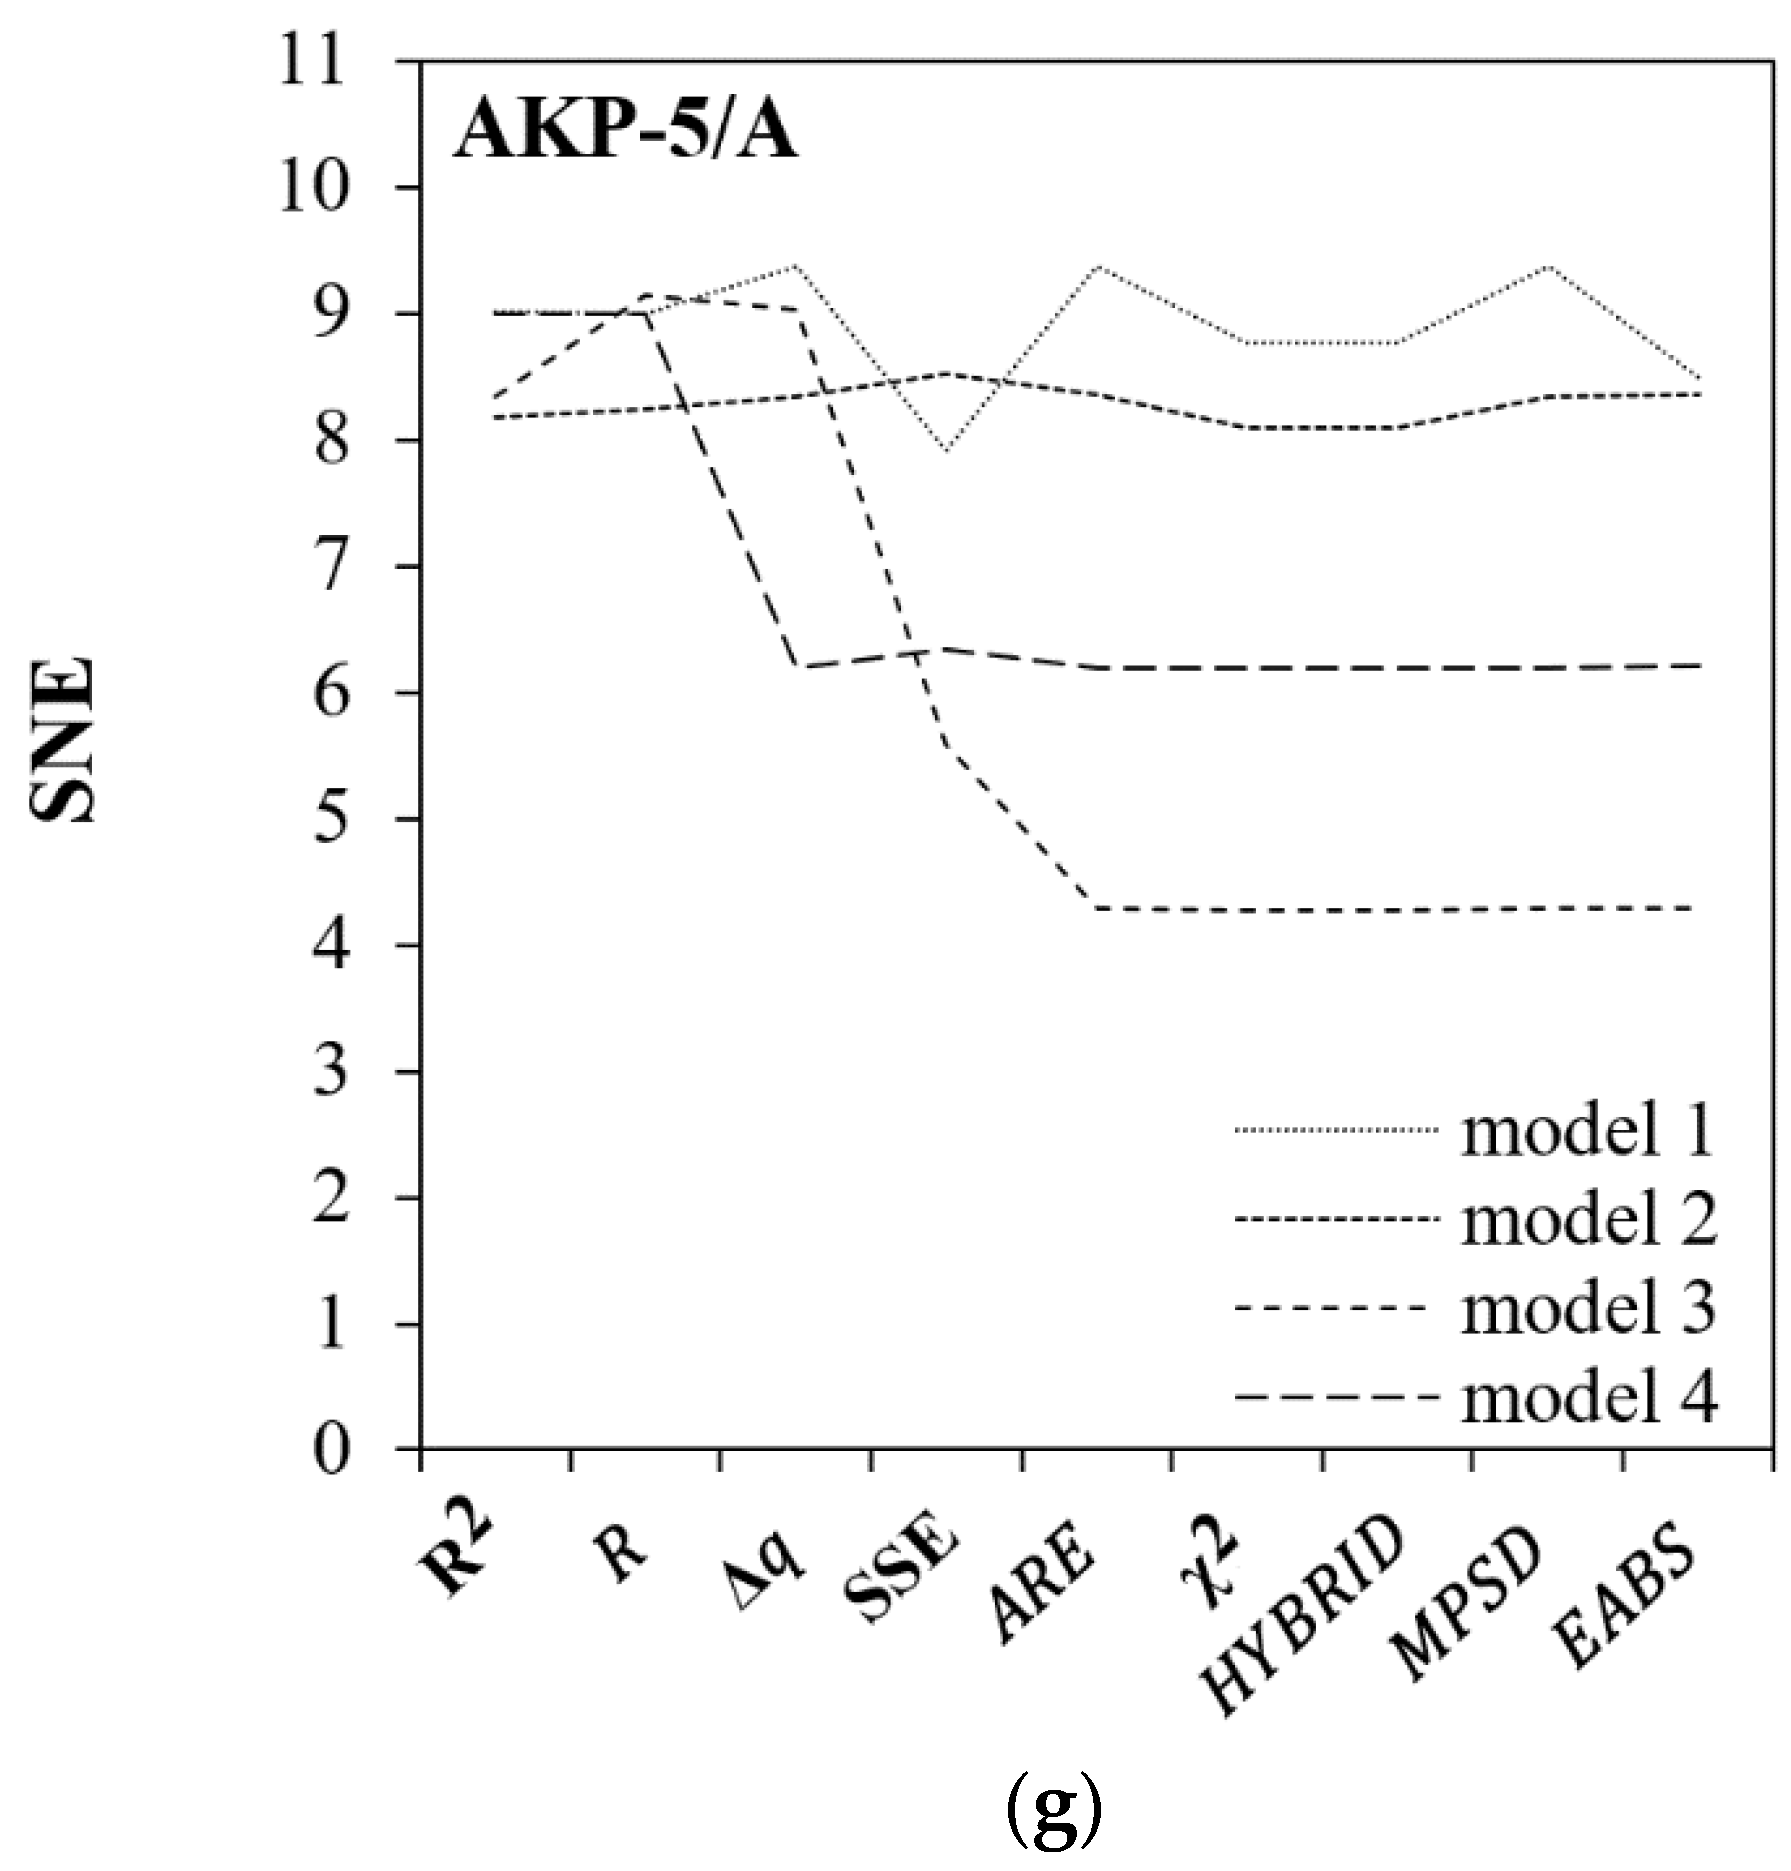
the sum of normalized errors, regardless of the tested sample and process conditions, reaches the lowest values for models 1 and 2 by minimizing the hybrid fractional error function (HYBRID), and for models 3 and 4 by the Marquardt’s percentage standard deviation (MPSD);
-
minimization of the determination coefficient (R2) and correlation (R) leads to high SNE values. Fitting data by any of the non-linear equations based on the R or R2 functions only cannot be treated as evidence or a prerequisite of the existence of a given mechanism determining the kinetics or dynamics of adsorption in a given system.
-
only in 1 case (UnCarb_MAsh) out of 7 possible, both linear and non-linear regression indicate the same mechanism of the adsorption phenomenon—identical to chemisorption on a heterogeneous surface (according to model 4).
The analysis presented above proves that linear methods generally enable the determination of kinetic parameters that reflect the character of adsorption more reliably than non-linear methods, although it is puzzling that usually each of the approaches indicates a different mechanism of the phenomenon. Hence, in order to determine the optimal set of kinetic pairs as faithfully reproducing the course of the analyzed processes as possible, it is recommended to perform both linear and non-linear regression, in accordance with the methodology presented in this paper. Moreover, the assessment of the mechanism of the adsorption reaction based solely on the accuracy of the kinetic model may be misleading and, in the opinion of the authors, requires additional discussion supported by experimental studies, as in the case of [30]. Considering the limited amount of data in the literature on SO2 adsorption on unburned carbon from lignite fly ash, the indicated work may be the first attempt at a thorough analysis of the chemical kinetics of this process, constituting the basis for considering the industrial application of the adsorption reaction.

Author Contributions

Conceptualization, A.M.K.-C.; methodology A.M.K.-C. and B.D.; validation, A.M.K.-C.; formal analysis, A.M.K.-C. and B.D.; investigation, A.M.K.-C.; resources, A.M.K.-C.; data curation, A.M.K.-C. and B.D.; writing—original draft preparation, A.M.K.-C.; writing—review and editing, A.M.K.-C.; visualization, A.M.K.-C., supervision, A.M.K.-C. All authors have read and agreed to the published version of the manuscript.

Funding

Not applicable.

Institutional Review Board Statement

Not applicable.

Informed Consent Statement

Not applicable.

Data Availability Statement

Not applicable.

Conflicts of Interest

The authors declare no conflict of interest.

References

  1. Institute of Environmental Protection—The National Centre for Emissions Management (KOBiZE). National Emission Balance of SO2, NOx, CO, NH3, NMVOC, Dust, Heavy Metals and POPs in the SNAP and NFR Classification System. Warsaw, 2015. Available online: https://www.kobize.pl/uploads/materialy/materialy_do_pobrania/krajowa_inwentaryzacja_emisji/Bilans_emisji_za_2017.pdf (accessed on 7 July 2021).
  2. Lecomte, T.; de la Fuente, J.F.F.; Neuwahl, F.; Canova, M.; Pinasseau, A.; Jankov, I.; Brinkmann, T.; Roudier, S.; Sancho, L.D. Best Available Techniques (BAT) Reference Document for Large Combustion Plants; EUR 28836 EN; Publications Office of the European Union: Luxembourg, 2017. [Google Scholar]
  3. Common Format for a National Air Pollution Control Program under Art. 6 of Directive (EU) 2016/2284. Available online: https://ec.europa.eu/environment/air/pdf/reduction_napcp/PL%20final%20NAPCP%2027Jun19%20annexed%20report.pdf (accessed on 14 July 2021).
  4. Bartonova, L. Unburned carbon from coal combustion ash: An overview. Fuel Process. Technol. 2015, 134, 136–158. [Google Scholar] [CrossRef]
  5. Hower, J.C.; Groppo, J.G.; Graham, U.M.; Ward, C.R.; Kostova, I.J.; Maroto-Valer, M.M.; Dai, S. Coal-derived unburned carbons in fly ash: A review. Int. J. Coal Geol. 2017, 179, 11–27. [Google Scholar] [CrossRef]
  6. Musyoka, N.M.; Wdowin, M.; Rambau, K.M.; Franus, W.; Panek, R.; Madej, J.; Czarna-Juszkiewicz, D. Synthesis of activated carbon from high-carbon coal fly ash and its hydrogen storage application. Renew. Energy 2020, 155, 1264–1271. [Google Scholar] [CrossRef]
  7. Kisiela-Czajka, A.M.; Hull, S.; Albiniak, A. Investigation of the activity of unburned carbon as a catalyst in the decomposition of NO and NH3. Fuel 2022, 309, 122170. [Google Scholar] [CrossRef]
  8. Kisiela, A.M.; Czajka, K.M.; Moroń, W.; Rybak, W.; Andryjowicz, C. Unburned carbon from lignite fly ash as an adsorbent for SO2 removal. Energy 2016, 116, 1454–1463. [Google Scholar] [CrossRef]
  9. Rubio, B.; Izquierdo, M.T.; Mayoral, M.C.; Bona, M.T.; Andres, J.M. Unburnt carbon from coal fly ashes as a precursor of activated carbon for nitric oxide removal. J. Hazard. Mater. 2007, 143, 561–566. [Google Scholar] [CrossRef] [Green Version]
  10. Bansal, R.C.; Goyal, M. Activated Carbon Adsorption; CRC Press: Boca Raton FL, USA, 2005. [Google Scholar]
  11. Roy, P.; Sardar, A. SO2 emission control and finding a way to produce sulphuric acid from industrial SO2 emission. J. Chem. Eng. Process Technol. 2015, 6, 1000230. [Google Scholar] [CrossRef] [Green Version]
  12. Moroń, W.; Ferens, W.; Czajka, K.M. Explosion of different ranks coal dust in oxy-fuel atmosphere. Fuel Process. Technol. 2016, 148, 388–394. [Google Scholar] [CrossRef]
  13. Wang, J.; Yi, H.; Tang, X.; Zhao, S.; Gao, F. Simultaneous removal of SO2 and NOx by catalytic adsorption using γ-Al2O3 under the irradiation of non-thermal plasma: Competitiveness, kinetic, and equilibrium. Chem. Eng. J. 2020, 384, 123334. [Google Scholar] [CrossRef]
  14. Li, B.; Zhang, Q.; Ma, C. Adsorption kinetics of SO2 on powder activated carbon. IOP Conf. Ser. Earth Environ. Sci. 2018, 121, 022019. [Google Scholar] [CrossRef]
  15. Zhangm, S.; Li, Z.; Yang, Y.; Jian, W.; Ma, D.; Jia, F. Kinetics and thermodynamics of SO2 adsorption on metal-loaded multiwalled carbon nanotubes. Open Phys. 2020, 18, 1201–1214. [Google Scholar] [CrossRef]
  16. Wang, H.; Duan, Y.; Ying, Z.; Xue, Y. Effects of SO2 on Hg adsorption by activated carbon in O2/CO2 conditions. Part 1: Experimental and kinetic study. Energy Fuels 2018, 32, 10773–10778. [Google Scholar] [CrossRef]
  17. Silalahi, D.D.; Midi, H.; Arasan, J.; Mustafa, M.S.; Caliman, J.-P. Kernel partial least square regression with high resistance to multiple outliers and bad leverage points on near-infrared spectral data analysis. Symmetry 2021, 13, 547. [Google Scholar] [CrossRef]
  18. Fehintola, E.O.; Amoko, J.S.; Obijole, O.A.; Oke, I.A. Pseudo second order kinetics model of adsorption of Pb2+ onto powdered corn cobs: Comparison of linear regression methods. Direct Res. J. Chem. Mater. Sci. 2015, 3, 1–10. [Google Scholar]
  19. Adnan, F.; Thanasupsin, S.P. Kinetic studies using a linear regression analysis for a sorption phenomenon of 17a-methyltestosterone by Salvinia cucullata in an active plant reactor. Environ. Eng. Res. 2016, 21, 384–392. [Google Scholar] [CrossRef] [Green Version]
  20. Moroń, W.; Czajka, K.M.; Ferens, W.; Babul, K.; Szydełko, A.; Rybak, W. NOx and SO2 emission during oxy-coal combustion. Chem. Process Eng. 2013, 34, 337–346. [Google Scholar] [CrossRef] [Green Version]
  21. Pilatau, A.; Czajka, K.M.; Filho, G.P.; Medeiros, H.S.; Kisiela, A.M. Evaluation criteria for the assessment of the influence of additives (AlCl3 and ZnCl2) on pyrolysis of sunflower oil cake. Waste Biomass Valorization 2017, 8, 2595–2607. [Google Scholar] [CrossRef]
  22. Hanna, O.T.; Sandall, O.C. Computational Methods in Chemical Engineering; Prentice Hall International Series in the Physical and Chemical Engineering Sciences; Prentice Hall: Hoboken, NJ, USA, 1995. [Google Scholar]
  23. Ngakou, C.S.; Anagho, G.S.; Ngomo, H.M. Non-linear regression analysis for the adsorption kinetics and equilibrium isotherm of phenacetin onto activated carbons. Curr. J. Appl. Sci. Technol. 2019, 36, 1–18. [Google Scholar] [CrossRef]
  24. Lin, J.; Wang, L. Comparison between linear and non-linear forms of pseudo-first-order and pseudo-second-order adsorption kinetic models for the removal of methylene blue by activated carbon. Front. Environ. Sci. Eng. 2009, 3, 320–324. [Google Scholar] [CrossRef]
  25. Kumar, K.V. Comparative analysis of linear and non-linear method of estimating the sorption isotherm parameters for malachite green onto activated carbon. J. Hazard. Mater. 2006, 136, 197–202. [Google Scholar] [CrossRef] [PubMed]
  26. Lataye, D.H.; Mishra, I.M.; Mall, I.D. Adsorption of 2-picoline onto bagasse fly ash from aqueous solution. Chem. Eng. J. 2008, 138, 35–46. [Google Scholar] [CrossRef]
  27. Kumar, K.V.; Porkodi, K.; Rocha, F. Isotherms and thermodynamics by linear and non-linear regression analysis for the sorption of methylene blue onto activated carbon: Comparison of various error functions. J. Hazard. Mater. 2008, 151, 794–804. [Google Scholar] [CrossRef] [PubMed]
  28. Edgar, T.F.; Himmelblau, D.M. Optimization of Chemical Processes; McGraw-Hill College: New York, NY, USA, 1988. [Google Scholar]
  29. Rybak, W.; Moroń, W.; Czajka, K.M.; Kisiela, A.M.; Ferens, W.; Jodkowski, W.; Andryjowicz, C. Co-combustion of unburned carbon separated from lignite fly ash. Energy Procedia 2017, 120, 197–205. [Google Scholar] [CrossRef]
  30. Kisiela-Czajka, A.M. Adsorption behaviour of SO2 molecules on unburned carbon from lignite fly ash in the context of developing commercially applicable environmental carbon adsorbent. Preprint (SSRN/Elsevier). [CrossRef]
  31. Lagergren, S. About the theory of so-called adsorption of soluble substances. K. Sven. Vetensk. Akad. Handl. 1989, 241, 1–39. [Google Scholar]
  32. Ho, Y.S.; McKay, G. Pseudo-second order model for sorption processes. Process Biochem. 1999, 34, 451–465. [Google Scholar] [CrossRef]
  33. Weber, W.J.; Morris, J.C. Kinetics of adsorption on carbon from solutions. J. Sanit. Eng. Div. 1963, 89, 31–60. [Google Scholar] [CrossRef]
  34. Low, M.D. Kinetics of chemisorption of gases on solids. Chem. Rev. 1960, 60, 267–312. [Google Scholar] [CrossRef]
  35. Shafiq, M.; Alazba, A.A.; Amin, M.T. Kinetic and isotherm studies of Ni2+ and Pb2+ adsorption from synthetic wastewater using Eucalyptus camdulensis–derived biochar. Sustainability 2021, 13, 3785. [Google Scholar] [CrossRef]
  36. Ghaffari, H.R.; Pasalari, H.; Tajvar, A.; Dindarloo, K.; Goudarzi, B.; Alipour, V.; Ghanbarneajd, A. Linear and non-linear two-parameter adsorption isotherm modeling: A case-study. Int. J. Eng. Sci. 2017, 6, 1–11. [Google Scholar] [CrossRef]
  37. Sivarajasekar, N.; Baskar, R. Adsorption of basic magenta II onto H2SO4 activated immature Gossypium hirsutum seeds: Kinetics, isotherms, mass transfer, thermodynamics and process design. Arab. J. Chem. 2019, 12, 1322–1337. [Google Scholar] [CrossRef] [Green Version]
  38. Ho, Y.S.; Porter, J.F.; McKay, G. Equilibrium isotherm studies for the sorption of divalent metal ions onto peat: Copper, nickel and lead single component systems. Water Air Soil Pollut. 2002, 141, 1–33. [Google Scholar] [CrossRef]
  39. Anirudhan, T.S.; Radhakrishnan, P.G. Kinetic and equilibrium modelling of Cadmium (II) ions sorption onto polymerized tamarind fruit shell. Desalination 2009, 249, 1298–1307. [Google Scholar] [CrossRef]
  40. Soco, E.; Kalembkiewicz, J. Effect of chemical modification of the coal fly ash onto adsorption of lead (II) ions in the presence of cadmium (II) ions in a single- and bi-component system. Eng. Prot. Environ. 2016, 19, 81–95. [Google Scholar] [CrossRef]
  41. Płaziński, W.; Rudziński, W.; Płazińska, A. Theoretical models of sorption kinetics including a surface mechanism: A review. Adv. Colloid Interface Sci. 2009, 152, 2–13. [Google Scholar] [CrossRef]
  42. Płaziński, W.; Rudziński, W. Adsorption kinetics at solid/solution interfaces. The meaning of the pseudo-first and pseudo-second-order equations. Wiadomości Chem. 2011, 65, 1055–1067. [Google Scholar]
  43. Czajka, K.M.; Modliński, N.; Kisiela-Czajka, A.M.; Naidoo, R.; Peta, S.; Nyangwa, B. Volatile matter release from coal at different heating rates—Experimental study and kinetic modeling. J. Anal. Appl. Pyrolysis 2019, 139, 282–290. [Google Scholar] [CrossRef]
  44. Moore, D.S.; Notz, W.I.; Flinger, M.A. The Basic Practise of Statistics, 3rd ed.; W. H. Freeman and Company: New York, NY, USA, 2013. [Google Scholar]
  45. Hashem, A.; Badawy, S.M.; Farag, S.; Mohamed, L.A.; Fletcher, A.J.; Taha, G.M. Non-linear adsorption characteristics of modified pine wood sawdust optimized for adsorption of Cd(II) from aqueous systems. J. Environ. Chem. Eng. 2020, 8, 103966. [Google Scholar] [CrossRef]
  46. Saravanan, A.; Karishma, S.; Jeevanantham, S.; Jeyarsi, S.; Kiruthika, A.R.; Senthil Kumar, P.; Yaashikaa, P.R. Optimization and modeling of reactive yellow adsorption by surface modified Delonix regia seed: Study on nonlinear isotherm and kinetic parameters. Surf. Interfaces 2020, 20, 100520. [Google Scholar] [CrossRef]
  47. Mohammed, N.A.S.; Abu-Zurayk, R.A.; Hamadneh, I.; Al-Dujaili, A.H. Phenol adsorption on biochar prepared from the pine fruit shells: Equilibrium, kinetic and thermodynamics studies. J. Environ. Manag. 2018, 226, 377–385. [Google Scholar] [CrossRef]
  48. Módenes, A.N.; Scheufele, F.B.; Espinoza-Quiñones, F.R.; de Souza, P.S.C.; Cripa, C.R.B.; dos Santos, J.; Steffen, V.; Kroumov, A.D. Adsorption of direct of yellow ARLE dye by activated carbon of shell of coconut palm: Diffusional effects on kinetics and equilibrium states. Int. J. Bioautom. 2015, 19, 187–206. [Google Scholar]
Figure 1. Scheme of the measuring system for SO2 adsorption.
Energies 15 00633 g001
Figure 2. Summary of model and experimental curves for linear regression for the following mixtures: (ae) SO2 + Ar, (f,g) SO2 + O2 + H2O(g) + Ar.
Energies 15 00633 g002aEnergies 15 00633 g002b
Figure 3. Relationship between the model and experimental amount of bound adsorbate.
Energies 15 00633 g003
Figure 4. SNE error analysis for kinetic models solved by non-linear regression method for the following mixtures: (ae) SO2 + Ar, (f,g) SO2 + O2 + H2O(g) + Ar.
Energies 15 00633 g004aEnergies 15 00633 g004b
Figure 5. Summary of model and experimental curves for linear and non-linear regression for the following mixtures: (ae) SO2 + Ar, (f,g) SO2 + O2 + H2O(g) + Ar.
Energies 15 00633 g005aEnergies 15 00633 g005b
Table 1. Statistic error functions [36,37].
FunctionEquation
Determination coefficient (R2) R 2 = i = 1 n ( m S , t , mod m S , t , exp ¯ ) 2 i = 1 n ( m S , t , mod m S , t , exp ¯ ) 2 + i = 1 n ( m S , t , mod m S , t , exp ) 2 (12)
Correlation coefficient (R) R 2   = R (13)
Relative standard deviation (Δq) Δ q = i = 1 n ( m S , t , exp m S , t , mod m S ,   t , exp ) 2 N     1 (14)
Sum of squared deviations (SSE) SSE   =   i = 1 n ( m S , t , exp   m S , t , mod ) 2 (15)
Average Relative Error (ARE) ARE = 100 N i = 1 n | m S , t , exp m S , t , mod m S , t , exp | (16)
Chi-square test (χ2) χ 2 = i = 1 n ( m S , t , exp m S , t , mod ) 2 m S , t , exp (17)
Hybrid fractional error function (HYBRID) HYBRID = 100 N - p i = 1 n ( m S , t , exp   m S , t , mod ) 2 m S , t , exp (18)
Marquardt’s percent standard deviation (MPSD) MPSD = 100 1 N p i = 1 n ( m S , t , exp m S , t , mod m S , t , exp ) 2 (19)
Sum of absolute errors (EABS) EABS = i = 1 n | m S , t , exp m S , t , mod | (20)
Table 2. Kinetic parameters determined by the method of linear regression.
SampleModel 1Model 2Model 3Model 4
k1k2mS,∞kidCαβ
min−1kg·g−1·min−1g·kg−1g·kg−1·min−0.5g·kg−1g·kg−1min−1kg·g−1
SO2 + Ar
UnCarb_HAsh0.4230.015627.55.012.3317.20.156
UnCarb_MAsh0.2470.052729.55.036.561070.210
UnCarb_LAsh0.2140.11429.24.479.5659170.370
AKP-50.2860.044915.62.811.947.920.244
AKP-5/A0.2220.027318.23.301.768.240.206
SO2 + O2 + H2O(g) + Ar
UnCarb_LAsh0.1550.029348.37.7712.15150.160
AKP-5/A0.1230.036322.53.734.1362.60.285
Table 3. Error analysis for kinetic models solved by linear regression method.
SampleR2RΔqSSEAREχ2HYBRIDMPSDEABS
Model 1 1
UnCarb_HAsh0.9550.97754.924.623.95.1617263.46.55
UnCarb_MAsh0.9060.95227.673.614.54.5115031.812.2
UnCarb_LAsh0.7450.86338.926820.812.642145.022.9
AKP-50.9980.9993.720.3462.100.03831.284.290.776
AKP-5/A0.9790.9898.395.053.980.37312.49.682.38
Model 2 1
UnCarb_HAsh0.9580.97949.920.722.64.2714257.67.15
UnCarb_MAsh0.9580.97919.926.28.062.0467.923.05.23
UnCarb_LAsh0.9870.9947.047.773.280.39213.18.133.42
AKP-50.9610.98031.16.5214.01.6254.137.03.27
AKP-5/A0.9620.98142.48.2418.42.3879.548.93.84
Model 3 1
UnCarb_HAsh0.8400.91743.292.028.35.9119749.920.1
UnCarb_MAsh0.7710.87819.3144.813.53.8512822.223.5
UnCarb_LAsh0.6470.80422.121115.94.7715925.529.4
AKP-50.8510.92221.326.816.21.9163.824.610.7
AKP-5/A0.8470.92033.338.123.13.1410538.512.7
Model 4 1
UnCarb_HAsh0.9520.97628.327.817.42.1772.532.710.1
UnCarb_MAsh0.9660.98311.021.57.700.96132.012.78.24
UnCarb_LAsh0.9880.9945.206.993.500.2729.076.014.40
AKP-50.9450.97220.011.814.01.1839.323.16.36
AKP-5/A0.9440.97217.416.012.41.2240.620.16.74
Model 1 2
UnCarb_LAsh0.7760.88141.1587.422.719.665347.535.6
AKP-5/A0.8240.90840.886.322.87.4224747.114.1
Model 2 2
UnCarb_LAsh0.9920.9965.1712.43.690.35511.85.976.59
AKP-5/A0.9820.9917.336.144.460.36112.08.463.90
Model 3 2
UnCarb_LAsh0.9780.87619.535414.05.4818322.638.2
AKP-5/A0.8670.93116.641.111.91.5752.319.213.2
Model 4 2
UnCarb_LAsh0.9940.9974.149.152.750.2458.174.785.03
AKP-5/A1.001.000.8980.07870.6140.004940.1651.040.471
1 SO2 + Ar; 2 SO2 + O2 + H2O(g) + Ar.
Table 4. SNE error analysis for kinetic models solved by non-linear regression method—the most appropriate values.
SampleModel 1Model 2Model 3Model 4
SO2 + Ar
UnCarb_HAshHYBRIDHYBRIDEABSχ2
5.404.844.395.06
UnCarb_MAshSSEχ2χ2Δq
8.167.135.375.00
UnCarb_LAshR2EABSMPSDEABS
8.978.433.165.59
AKP-5HYBRIDHYBRIDEABSHYBRID
6.086.286.945.60
AKP-5/AHYBRIDχ2χ2MPSD
5.424.976.774.84
SO2 + Ar + H2O(g) + O2
UnCarb_LAshSSERχ2EABS
8.927.554.045.52
AKP-5/ASSEχ2χ2χ2
7.918.094.276.18
Table 5. Kinetic parameters determined by the method of linear regression.
SampleModel 1Model 2Model 3Model 4
k1k2mS,∞kidCαβ
min−1kg·g−1·min−1g·kg−1g·kg−1·min−0.5g·kg−1g·kg−1min−1kg·g−1
SO2 + Ar
UnCarb_HAsh0.2246.57E-0331.84.59013.60.123
UnCarb_MAsh0.5812.41E-0231.05.387.4854.40.175
UnCarb_LAsh1.196.85E-0229.41.9718.239550.353
AKP-50.3121.97E-0217.13.450.46011.80.280
AKP-5/A0.2521.19E-0220.63.520.7759.440.213
SO2 + O2 + H2O(g) + Ar
UnCarb_LAsh0.8652.59E-0247.54.8024.33900.153
AKP-5/A0.5783.71E-0221.52.748.1761.70.284
Table 6. Error analysis for kinetic models solved by linear and non-linear regression methods.
ModelR2RΔqSSEAREχ2HYBRIDMPSDEABS
UnCarb_HAsh 1
Model 4 L0.9520.97628.327.817.42.272.532.710.1
Model 3 NL0.7520.86729.1152.917.87.1235.933.617.7
UnCarb_Mash 1
Model 4L0.9660.98311.021.57.70.9632.012.78.24
Model 4NL0.9610.9809.627.45.41.0133.611.17.4
UnCarb_Lash 1
Model 4L0.9880.9945.27.03.50.39.16.04.4
Model 3NL0.2200.4699.7358.95.71.034.411.225.8
AKP-5 1
Model 1L0.9980.9993.70.32.10.041.34.30.8
Model 4NL0.9670.98310.66.47.90.517.012.24.4
AKP-5/A 1
Model 1L0.9790.9898.45.14.00.412.49.72.4
Model 4NL0.9530.97612.313.17.30.929.614.25.5
UnCarb_Lash 2
Model 4L0.9940.9974.19.22.80.28.24.85.0
Model 3 NL0.4650.6829.0633.36.51.238.910.436.5
AKP-5/A 2
Model 4L1.001.000.90.080.60.0050.21.00.5
Model 3NL0.6860.8287.572.15.60.311.28.712.5
1 SO2 + Ar; 2 SO2 + O2 + H2O(g) + Ar.
Publisher’s Note: MDPI stays neutral with regard to jurisdictional claims in published maps and institutional affiliations.

