Article

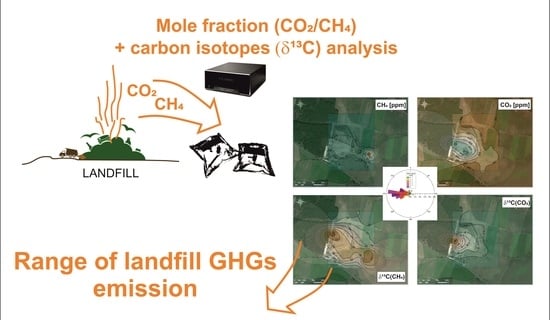
Assessment of GHG Interactions in the Vicinity of the Municipal Waste Landfill Site—Case Study

1
Faculty of Earth Science and Environmental Management, University of Wrocław, Cybulskiego 32, 50-205 Wroclaw, Poland
2
Faculty of Environmental Engineering, Wroclaw University of Science and Technology, Plac Grunwaldzki 13, 50-377 Wroclaw, Poland
*
Author to whom correspondence should be addressed.
Energies 2021, 14(24), 8259; https://doi.org/10.3390/en14248259
Submission received: 7 November 2021 / Revised: 27 November 2021 / Accepted: 7 December 2021 / Published: 8 December 2021
(This article belongs to the Special Issue Modelling and Calculation of Raw Material Industry)

Abstract

:
Landfills have been identified as one of the major sources of greenhouse gas (GHG) emissions and as a contributor to climate change. Landfill facilities exhibit considerable spatial and temporal variability of both methane (CH4) and carbon dioxide (CO2) rates. The present work aimed to evaluate the spatial distribution of CH4 and CO2 and their δ13C isotopic composition originating from a municipal landfill site, to identify its contribution to the local GHG budget and the potential impact on the air quality of the immediate surroundings in a short-term response to environmental conditions. The objective was met by performing direct measurements of atmospheric CO2 and CH4 at the selected monitoring points on the surface and applying a binary mixing model for the determination of carbon isotopic ratios in the vicinity of the municipal waste landfill site. Air samples were collected and analysed for isotopic composition using flask sampling with a Picarro G2201-I Cavity Ring-Down Spectroscopy (CRDS) technique. Kriging and Inverse distance weighting (IDW) methods were used to evaluate the values at unsampled locations and to map the excess of GHGs emitted from the landfill surface. The large off-site dispersion of methane from the landfill site at a 500 m distance was identified during field measurements using isotopic data. The mean δ13C of the landfill biogas emitted to the surrounded atmosphere was −53.9 ± 2.2‰, which corresponded well to the microbial degradation processes during acetate fermentation in the waste deposits. The calculated isotopic compositions of CO213C = −18.64 ± 1.75‰) indicate the domination of biogenic carbon reduction by vegetation surrounding the landfill. Finally, amounts of methane escaping into the air can be limited by the appropriate landfill management practices (faster covers active quarter through separation layer), and CH4 reduction can be achieved by sealing the cover on the leachate tank.

Graphical Abstract

1. Introduction

Carbon dioxide (CO2) and methane (CH4) derive from a majority of natural and anthropogenic sources and play a critical role in regulating the Earth’s climate by trapping heat and contributing to overall global warming [1,2,3]. There are limitations of the accuracy of emissions data derived from the official inventories, especially fugitive emissions from landfills, and estimates obtained from direct atmospheric measurements. Methane and carbon dioxide are major components of landfill gas (biogas), accounting for ~45–60% and ~40–60% of the total gas emissions [4], respectively; their variations depend on the composition and age of the waste [5], as well as landfill operating procedures [6]. Biogas also includes other gases, such as volatile organic compounds (VOCs), non-methane organic compounds (NMOCs), hydrogen sulfide (H2S), and ammonia (NH3), as well as trace amounts of harmful compounds [7].
Landfill gas is produced by the degradation of organic matter in the waste mix in a series of biological and physicochemical mechanisms under anaerobic conditions [5,8,9]. The production of landfill gas consists of the following five phases: (1) hydrolysis (in the presence of oxygen complex organic polymers, become converted into simple compounds, sugar, fatty acids, and amino acids, further O2 becomes depleted while CO2 is generated), (2) acidogenesis (anaerobic acidic phase after the oxygen in the landfill is exhausted and anaerobic bacteria convert compounds produced by hydrolysis into acetic, lactic and formic acids and alcohols; CO2 and H2 are then generated as end products), (3) acetogenesis (the methanogenesis process starts and acids from acidogenesis are decomposed into acetate, decrease in pH; the production of CH4 increases up to a level of around 70%, and the production of CO2 decreases from 70 to 40%), (4) methanogenesis (the equilibrium is reached and acetophilic methanogens directly produce CH4 and CO2 from acetate or hydrogenophilic methanogenic bacteria using hydrogen to yield CH4 and CO2), and (5) maturation (most organic waste is already degraded and most of the landfill gas emissions occur, then the volume of gas generation decreases with respect to the landfill stabilization) [10,11,12].
Emissions of landfill gases (LFG) and the presence of contaminants in wastewater (leachate) are the two major contributors to environmental impacts in the immediate surroundings [13,14,15]. Moreover, inappropriate waste maintenance and landfilling constitute a serious threat to public health and the welfare of the ecosystem [16,17]. The negative environmental impact can be limited by extracting the captured biogas, which can be flared or collected and purified, and used as renewable fuel whenever environmentally and economically convenient (e.g., electricity generation or vehicle fueling). Landfill gas collection begins in the extraction wells (network composed of slotted plastic pipes) installed and operated vertically and/or horizontally inside the waste mass, depending on site-specific factors [5]. It is necessary to reduce the abrasive and corrosive nature of raw landfill gas streams by treating and further removing moisture with a moisture separator and mist eliminator, and removing particulates and other impurities through the use of filtration [5,18]. Collected LFG condensate is commonly combined with the formation of landfill leachate that requires optimal system operations to conduct and store the leachate for its further treatment or disposal [5,18].
It is still difficult to assess the scale of CO2 and CH4 emissions from landfill facilities due to the large temporal and spatial variations in the landfill source strength [7,19,20]. The combination of high-resolution atmospheric and precise stable isotope measurements acts as an effective tool for monitoring the strength of major CO2 and CH4 sources and understanding GHGs biogeochemistry [21,22,23,24,25]. The ranges of isotopic signatures (δ13C) of carbon dioxide and methane emitted from the major source categories are very large. With respect to carbon isotopic fractionation during methanogenesis, three types of methane sources have distinct δ13C signatures, whereby biogenic CH4 is heavily depleted in 13C (from −75 to −55‰) [26,27] whereas thermogenic methane typically has δ13C values (from −60 to −20‰) [28,29] and pyrogenic methane is assigned more enriched values (−50 to −40‰) [21,30]. The isotopic range of δ13C(CO2) for terrestrial vegetation varies from −29 to −12‰ [31,32] whereas the δ13C composition of fossil fuel combustion ranges from −44‰ to −22‰ [22,33].
Methane released by biogas production processes, leachate characterization, and the maturity stage of the landfill site, can also be detected by measuring the stable isotopic composition of methane δ13C(CH4) [8,34,35,36,37]. Carbon sources at landfill sites access a narrow range of isotopic methane signatures, however, the oxidation of CH4 processes alongside alteration and isotopic exchange can influence the raw CH4 biogenic genesis signal [37]. According to Fischer et al. [38], isotopic signatures of methane emission from gas-collection systems in landfills located in Germany and the Netherlands were in the range of −60.3 to −57.4‰, with an average of −57.4 ± 2.2‰; samples derived from the atmospheric upwind and downwind measurements values of δ13C(CH4) varied within the range typical for terrestrial biogenic CH4 sources (from −58.0 to −54.2‰, with an average of −55.4 ± 1.4‰). In the study conducted in Kuwait [39], reported methane isotopic signatures for samples obtained at the vicinity of a landfill site were in a range from −59.4 to −51.9‰, with an average δ13C(CH4) value of −56.6 ± 3.1‰. A study on the isotopic composition of methane emissions from active landfill sites in the United Kingdom [40] reveal the isotopic signature of δ13C(CH4) to be in the range −60 to −58‰. The δ13C(CH4) values measured at two Danish landfills were in the range of −59.94 and −48.45‰ for downwind samples and ranged between −49.43 and −46.68‰ for upwind gas samples from the source area [41].
An isotopic analysis is important in studies on the metabolic pathways of methane production. For biogenic methane formation from the microbial decomposition of organic matter (OM), two main methanogenic pathways can be isotopically differentiated, namely, acetate fermentation (AF) and hydrogen-utilizing CO2-reduction (CR). The third major methanogenic pathway in OM degradation is through the utilization of methyl (amines and mercaptans) and methanol, yet the generated CH4 is less isotopically distinct and can resemble CH4 acetate fermentation. Methanogenesis leads to CH4 depletion in 13C compared to the organic substrate. Typical δ13C(CH4) values, in the range –65 to −50‰, Δ13C(CO2-CH4) between 30 and 55‰, and δ2H < −300‰ are indicative of an AF pathway. The CR pathway generates more 13C-depleted CH4, typically in the range −60 to −80‰, Δ13C(CO2-CH4) between 55 and 100‰, although less 2H-depleted in the range −250 to −150‰. The reason for the large Δ13C(CO2-CH4) is that the fractionation during CO2-reduction (multiple enzymatic steps) is higher than in cases of acetate disproportionation to CO2 and CH4, and the residual CO2 becomes progressively 13C-enriched, depending on how open/closed the system is [8,37,38,41,42,43,44].
There have been few studies that attempted to estimate mechanisms and the relative contribution of emissions of CH4 from landfill sources [45,46,47,48]. An investigation of spatial and temporal variations of CH4 fluxes from the landfill facilities with the use of interpolation methods was conducted by Haro et al. [48], Gonzalez-Valencia et al. [49] and Zhang et al. [50]. In general, landfills are known to be a source of significant fugitive methane emissions, however, there is also a large spatial variability in CH4 rates from similar sources in various locations across countries. Moreover, most of the investigations reported in the literature focused on: (1) the biogeochemical transformations between CH4/CO2 from municipal waste landfill (MWL) and dissolved inorganic carbon (DIC) in leachate, so the process is quite well known; (2) investigations of geochemical and isotopic maturation in CH4/CO2 in MWL, although mostly in reclaimed MWL and well-drilled/exploited biogas systems. Therefore, the objective of this study was to assess the spatial distribution of GHGs (CH4 and CO2 and their δ13C isotopic composition) originating from the municipal waste landfill (MWL) site, and to elucidate the interactions and effects of biogenic CO2 components (assimilation by neighboring vegetation) to examine the MWL effect on the local atmosphere around the dump area and short-term responses to environmental factors. The analyzed MWL is quite unique because the half area is a reclaimed quarter (with biogas drilling well system and co-generator use), whereas the second half is still an active location, to which a huge amount of municipal waste (segregated and not) is supplied, which can act as a completely uncontrolled bio-reactor and a source of a significant amount of GHGs. The research tasks included field measurements of concentrations and isotopic analyses of atmospheric CO2 and CH4 in combination with landfill-site investigations and a review of existing reported emission reports, in order to provide a comprehensive approach for distinguishing the signal and confirming the off-site migration of landfill gases in the surrounding atmosphere. The closest location to the MWL is a forest as well as an arable land area, both of which can work as a possible buffer from the MWL genesis of GHGs.

2. Materials and Methods

2.1. Site Description

The research site (51°38′03.3″ N 16°41′56.8″ E) is located in the Rudna Wielka village in the north-central part of the Lover Silesia Voivodeship (Figure 1), Góra County, Wąsosz commune. Rudna Wielka is located 80 km north-west from Wrocław (4th biggest polish city and main supplier of waste to landfill). The climate of Lower Silesian Voivodship is characterized by variability due to the topography. The northern area is on the border of the temperate zone of the oceanic and continental climate. The climatic conditions throughout the entire area of the Góra County are practically uniform and is characterized as a temperate climate—dry and warm. Temperature fluctuations here are smaller than the average fluctuations in Poland, the springs and summers are early and warm, and winters are mild. The average annual temperature is 8 °C, which is classified as high, the average temperature in July is 18 °C, and in January it is −2 °C. The average monthly atmospheric pressure ranges from 1014.4 hPa in April to 1018.2 hPa in January. The average annual sums of atmospheric precipitation over many years (1951–1980) range from 500 mm in the west to 600 mm in the east of the county. The winds prevail from the west and their average speed at a height of 10 m above the ground is 3.0–3.5 m·s−1 [51].
The municipal waste landfill (MWL) in Rudna Wielka was opened in 2004. The area where the waste is stored is secured by an artificial geological sealing barrier (clays) and a synthetic geomembrane so that the leachate does not penetrate into the ground and, in the next stage, into groundwater. The leachate that arises in the landfill is discharged through a drainage system to the leachate tank. Biogas in the Rudna Wielka landfill (which is produced by the decomposition of biochemical processes) is absorbed by degassing wells and then converted into energy and heat. This process allows for the reduction of biogas emissions (including methane) to the atmosphere.
The landfill in Rudna Wielka meets all the conditions stipulated by Polish law and European Union directives. The owner of the MWL aims to minimize the negative impact on the environment. The company oversees waste collection, segregation, recovery and the management of waste that is no longer suitable for use. According to the obtained data, the most often segregated waste types (typical composition) in the Rudna Wielka municipal waste landfill site received from the Voivodeship city of Wroclaw in 2017 [53] are shown in Table 1. Based on the amount of waste collected in MWL, the main component was non-combustible mixed waste (73.95% mass), which contained unsorted (mixed) municipal waste and bulky waste. The waste composition also has a high organic/biodegradable content, which constitutes 20.53% of the mass of the waste material deposited on the landfill. The waste contained a 3.46% mass of packaging fractions, (mainly glass) and residual minerals (1.55% mass), which mainly includes other non-biodegradable waste, soil and stones, a small percentage (0.51% mass) of construction and demolition debris.
The landfill for non-hazardous and inert waste consists of three quarters with a total area of 8.07 ha. The capacity of quarters 1 and 2 is approximately 960,000 m3, while the capacity of quarter 3 is 700,000 m3. Currently, headquarters No. 3 is in operation, and plots 1 and 2 have been reclaimed (Figure 1). There is an installation for mechanical and biological waste treatment in the landfill. The mechanical part consists of a modular waste segregation station (140,000 Mg·year−1) and an installation for the mechanical treatment of waste (151,200 Mg·year−1) [54].
In the biological part, the installation allows for the replacement or parallel performance of biological drying processes (100,000 Mg·year−1 for the biodegradable fraction at least 0–80 mm or 21,765 Mg·year–1 for biological drying of mixed waste), biological waste processing under aerobic conditions (55,000 Mg·year−1) and waste composting in the recovery process (13,000 Mg·year−1). In addition, there was an installation for composing alternative fuels (110,000 Mg·year−1 and a maximum of 20 Mg·h−1) in the landfill [54,55]. At the landfill (in the reclaimed quarters 1 and 2), there is an installation for the disposal/recovery of landfill gas (accounting for 46.85% of CH4) by burning in a flare (about 447,620 m3 in 2017) or for energy use in a cogeneration system [54]. The leachate water is collected with a drainage system located at the bottom of the quarters and collected in the leachate tank, and then transported to the sewage treatment plant (approximately 10,174 m3 in 2017) [54] or recirculated to the top of the landfill.

2.2. Sampling Methodology

The ambient air samples (Figure 1) were collected in 32 locations across the study site on 22 August 2017, in 1-L PTFE bags (SKC, Bag, Tedlar®, 1 L, Single PP Fitting) by using a vacuum pump with a miniature in-line magnesium perchlorate trap. All sites were sampled windward between 12.00–3.00 PM local time c.a. 1.5–2 m above ground level. Filled Tedlar bags were subsequently analyzed within 24 h at the laboratory for δ13C(CO2) and δ13C(CH4), CO2 and CH4 mole fraction by CRDS laser spectroscopy (G2201-i, Picarro Inc., Santa Clara, CA, USA). The sample air during measurements had a relatively constant water vapour mole fraction, typically of around 0.5–0.8%. As the background of atmospheric methane and carbon dioxide mole fraction and as δ13C(CH4) and δ13C(CO2) values are not affected by local biogenic and anthropogenic processes, the data for Mace Head (MHD) Ireland NOAA station (August 2017) were used [56]. The main air masses arrive in Poland from the North Atlantic area, hence MHD station (53.3260° N, 9.899° W) was deemed to be the most appropriate as a clean background sample.

2.3. CO2 and CH4 Mole Fraction and Carbon Isotope Analysis

The CO2 and CH4 mole fractions and 13C/12C isotope ratios in ambient air (transferred into Tedlar bags) were measured by cavity ring-down spectroscopy (CRDS—Picarro G2201-i isotopic analyzer). Measurements were verified using fixed working reference gas in synthetic air, with a CO2 concentration of 408 ± 2 ppm, a δ13C(CO2) value around −30.2 ± 0.3‰ and 1.88 ± 0.04 ppm for CH4 with a δ13C(CH4) value of −42.6 ± 0.4‰. In order to confirm the quality of methane measurements and the long-term stability of the analyzer, three standard gases with high and low concentrations of CH4 were applied. The cylinders of the certified (VPDB) CH4 mole fraction and the isotopic composition ranged between (standard 1) 9.5 ppm, δ13C(CH4): −69.8‰; (standard 2) 1.88 ppm, δ13C(CH4): −42.6‰, (standard 3) 3.3 ppm, δ13C(CH4): −55.1‰.

2.4. Meteorological Data

Weather parameters (barometric pressure, relative humidity, temperature, wind speed and direction) were recorded during the field campaign using an on-site weather station (Kestrel 5500 Weather Meter, Kestrel Instruments, Boothwyn, PA, USA). The meteorological station was placed at the level of 1.5 m a.g.l. on a portable tripod at each ambient air sampling point.

2.5. Data Analysis

The statistical analysis (using Statistica 13.0 Software) was carried out on samples collected over a sampling campaign to test CO2 and CH4 mole fractions, and δ13C analysed both GHG gases as well as measured meteorological parameters. Normality tests were performed using Shapiro–Wilk estimates. Due to a lack of normality, Spearman’s rank correlation coefficient was used to test possible relationships between the analysed parameters.
The Keeling plot method [57] was used to determine the isotopic composition of the atmospheric carbon dioxide and methane mixing ratio, respectively. A two-end-component mixing model, for estimating the intercept and standard error of the intercept of the Keeling plot, is represented by the carbon-isotope (δ13C) signatures as a function of the inverse (1/CO2) of atmospheric gas mixing ratios, derived from a geometric mean regression as follows (Equation (1)) [58]:
δ mix = C atm × ( δ atm δ src ) C mix + δ src ,
where:
  • δmix—background C isotope mixing ratio;
  • δsrc—mean source C isotope mixing ratio;
  • Cmix—background atmospheric C concentration;
  • Catm—C concentrations of the mean source.
The graphical relations between measured parameters were prepared using Grapher® (from Golden Software LLC, Golden, CO, USA, www.goldensoftware.com (accessed on 27 November 2021)), whereas a spatial map distribution of analysed parameters was produced using Surfer® (from Golden Software, LLC, Golden, CO, USA, www.goldensoftware.com (accessed on 27 November 2021)). The maps of CO2 mole fraction, as well as δ13C(CO2) and δ13C(CH4), were extrapolated using the Kriging method, whereas the CH4 mole fraction map, due to the large data differences, was extrapolated using an inverse-distance to a power method [59].

3. Results

3.1. Weather Conditions

During the investigation on 22 August 2017, the weather conditions were quite stable with occasionally small wind velocity and direction fluctuations (Table 2 and Figure 2).
Weather parameters were as follows: the air temperature varied between 17.1 and 20.2 °C (average of 18.6 ± 0.8 °C), wind speed varied between 0.0 and 6.9 m·s−1 (average of 3.4 ± 1.7 m·s−1), wind direction fluctuated between 27 and 345° (average of 258 ± 57° which indicated prevailing westerly winds Figure 2), relative humidity varied between 47.4 and 56.5% (average of 52.6 ± 2.6%) and the atmospheric pressure increased from 1004.6 to 1006.5 hPa (average of 1005.8 ± 0.5 hPa). The notably weak statistical relations (Table 3) between the different meteorological parameters due to very low parameter fluctuations are accidental rather than representative of environmental dependence.

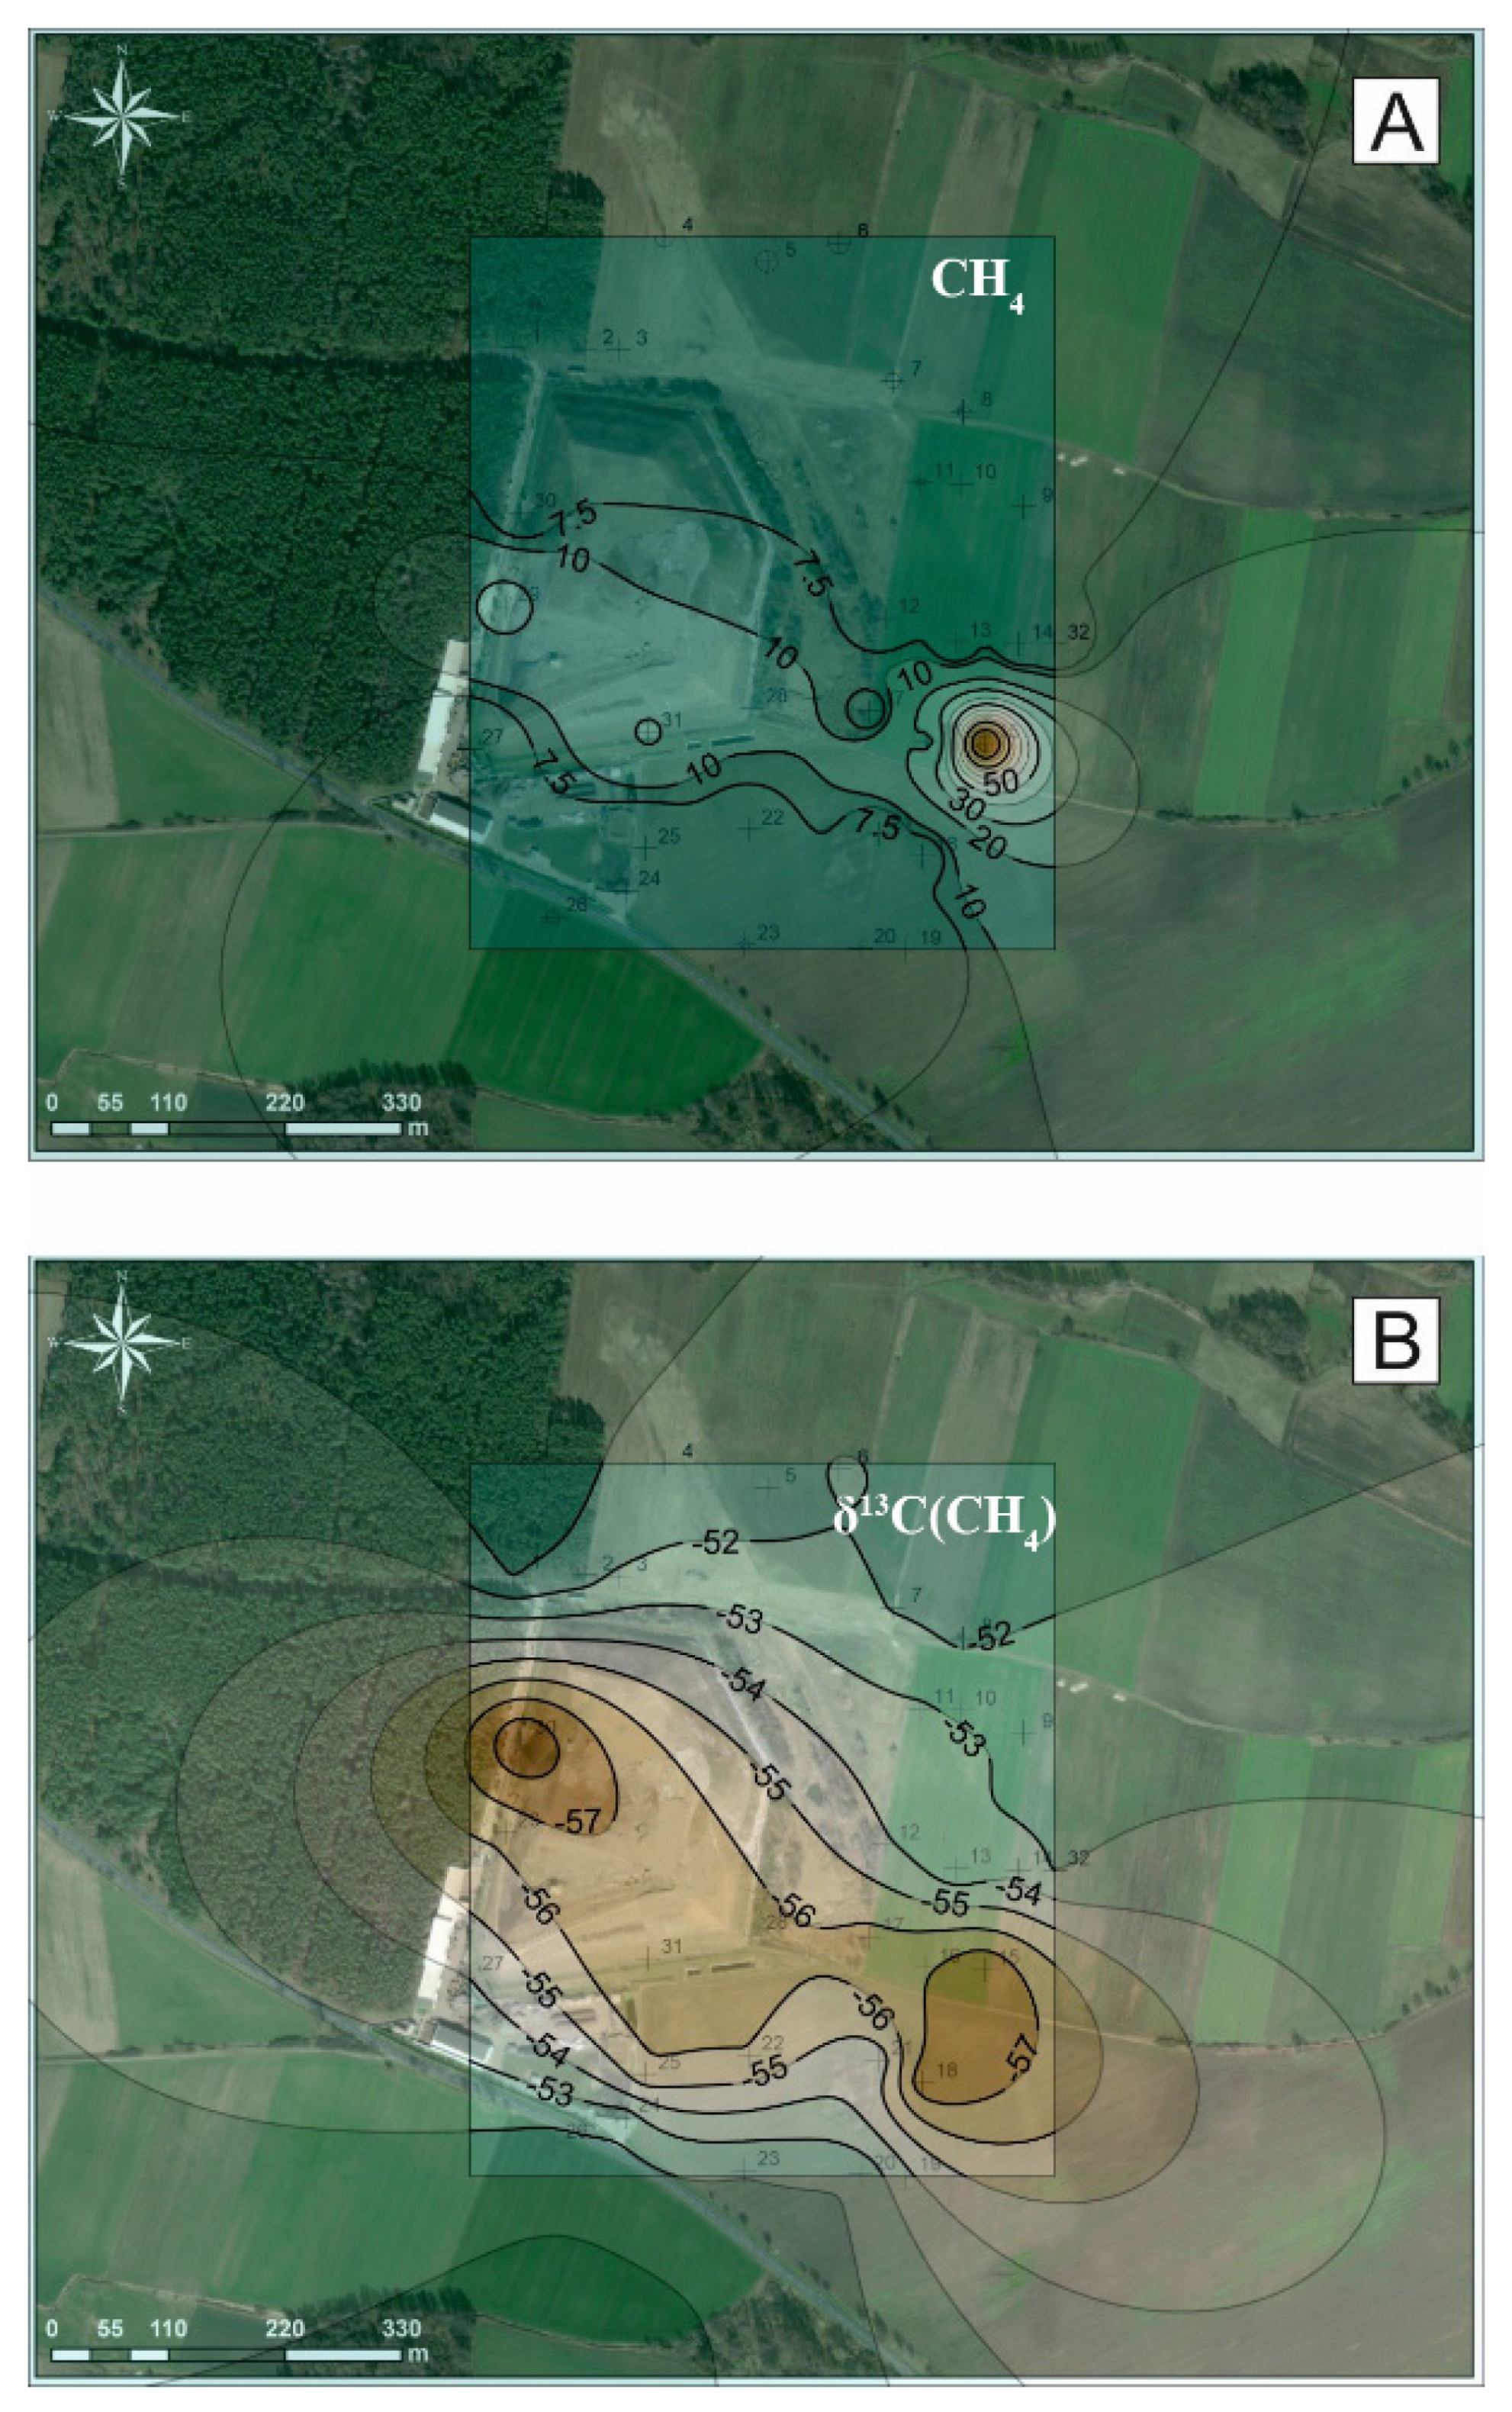
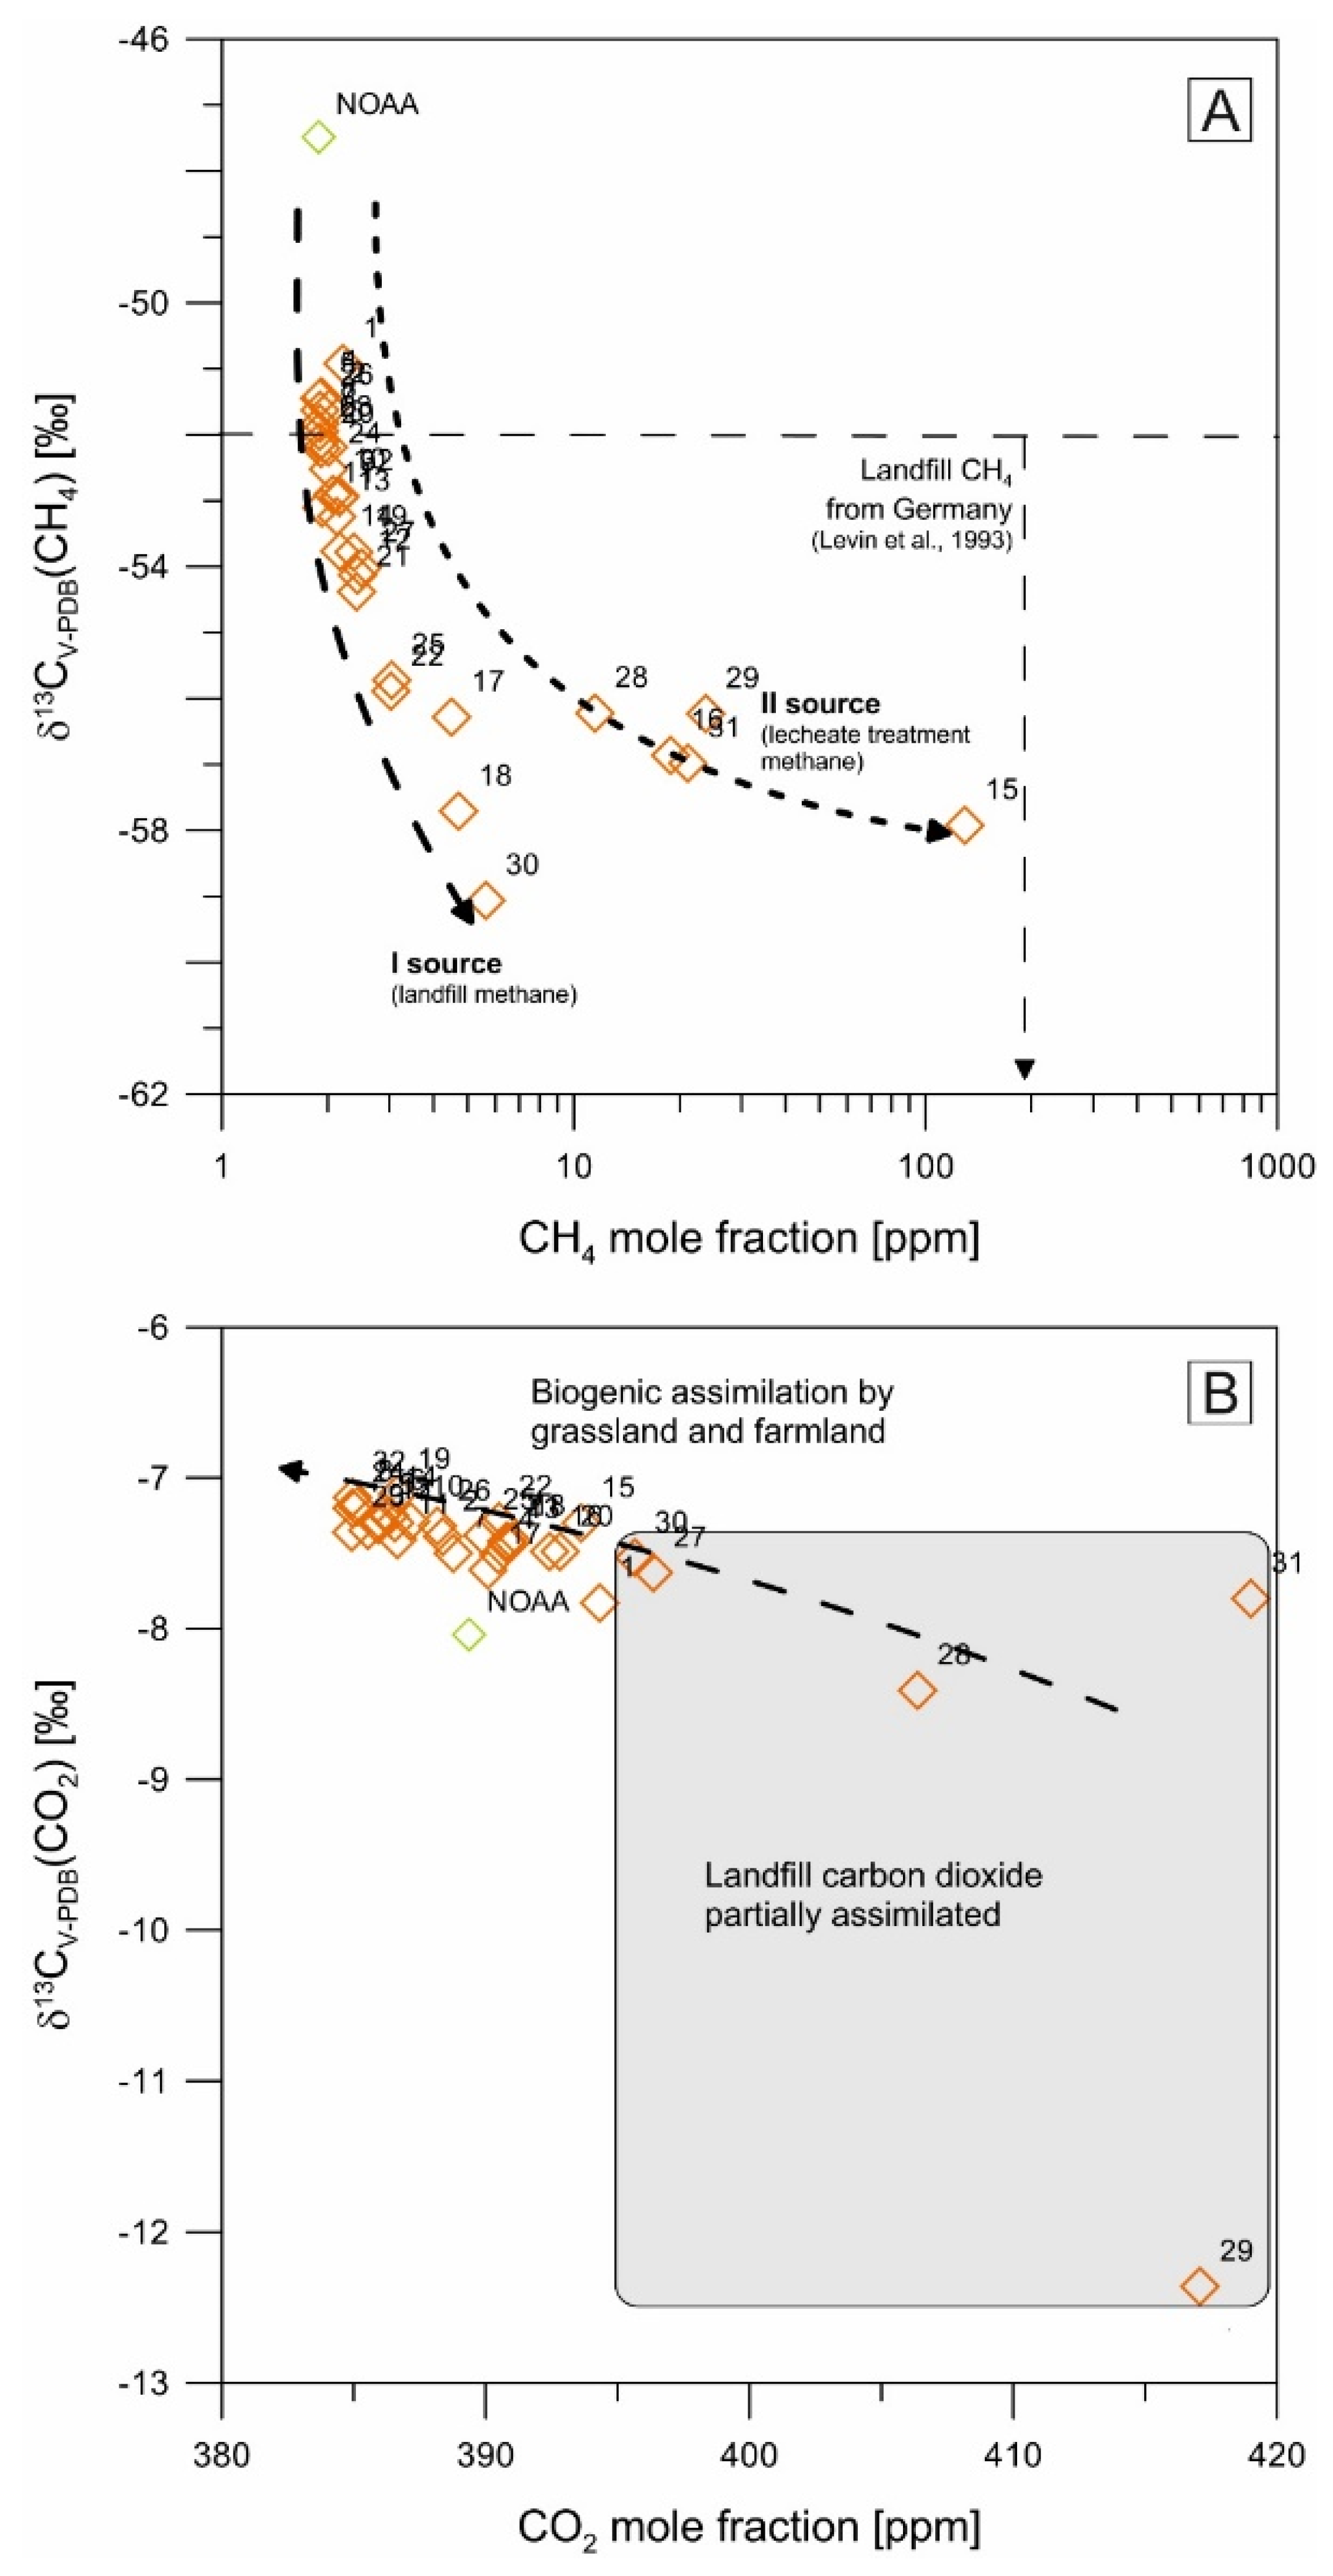
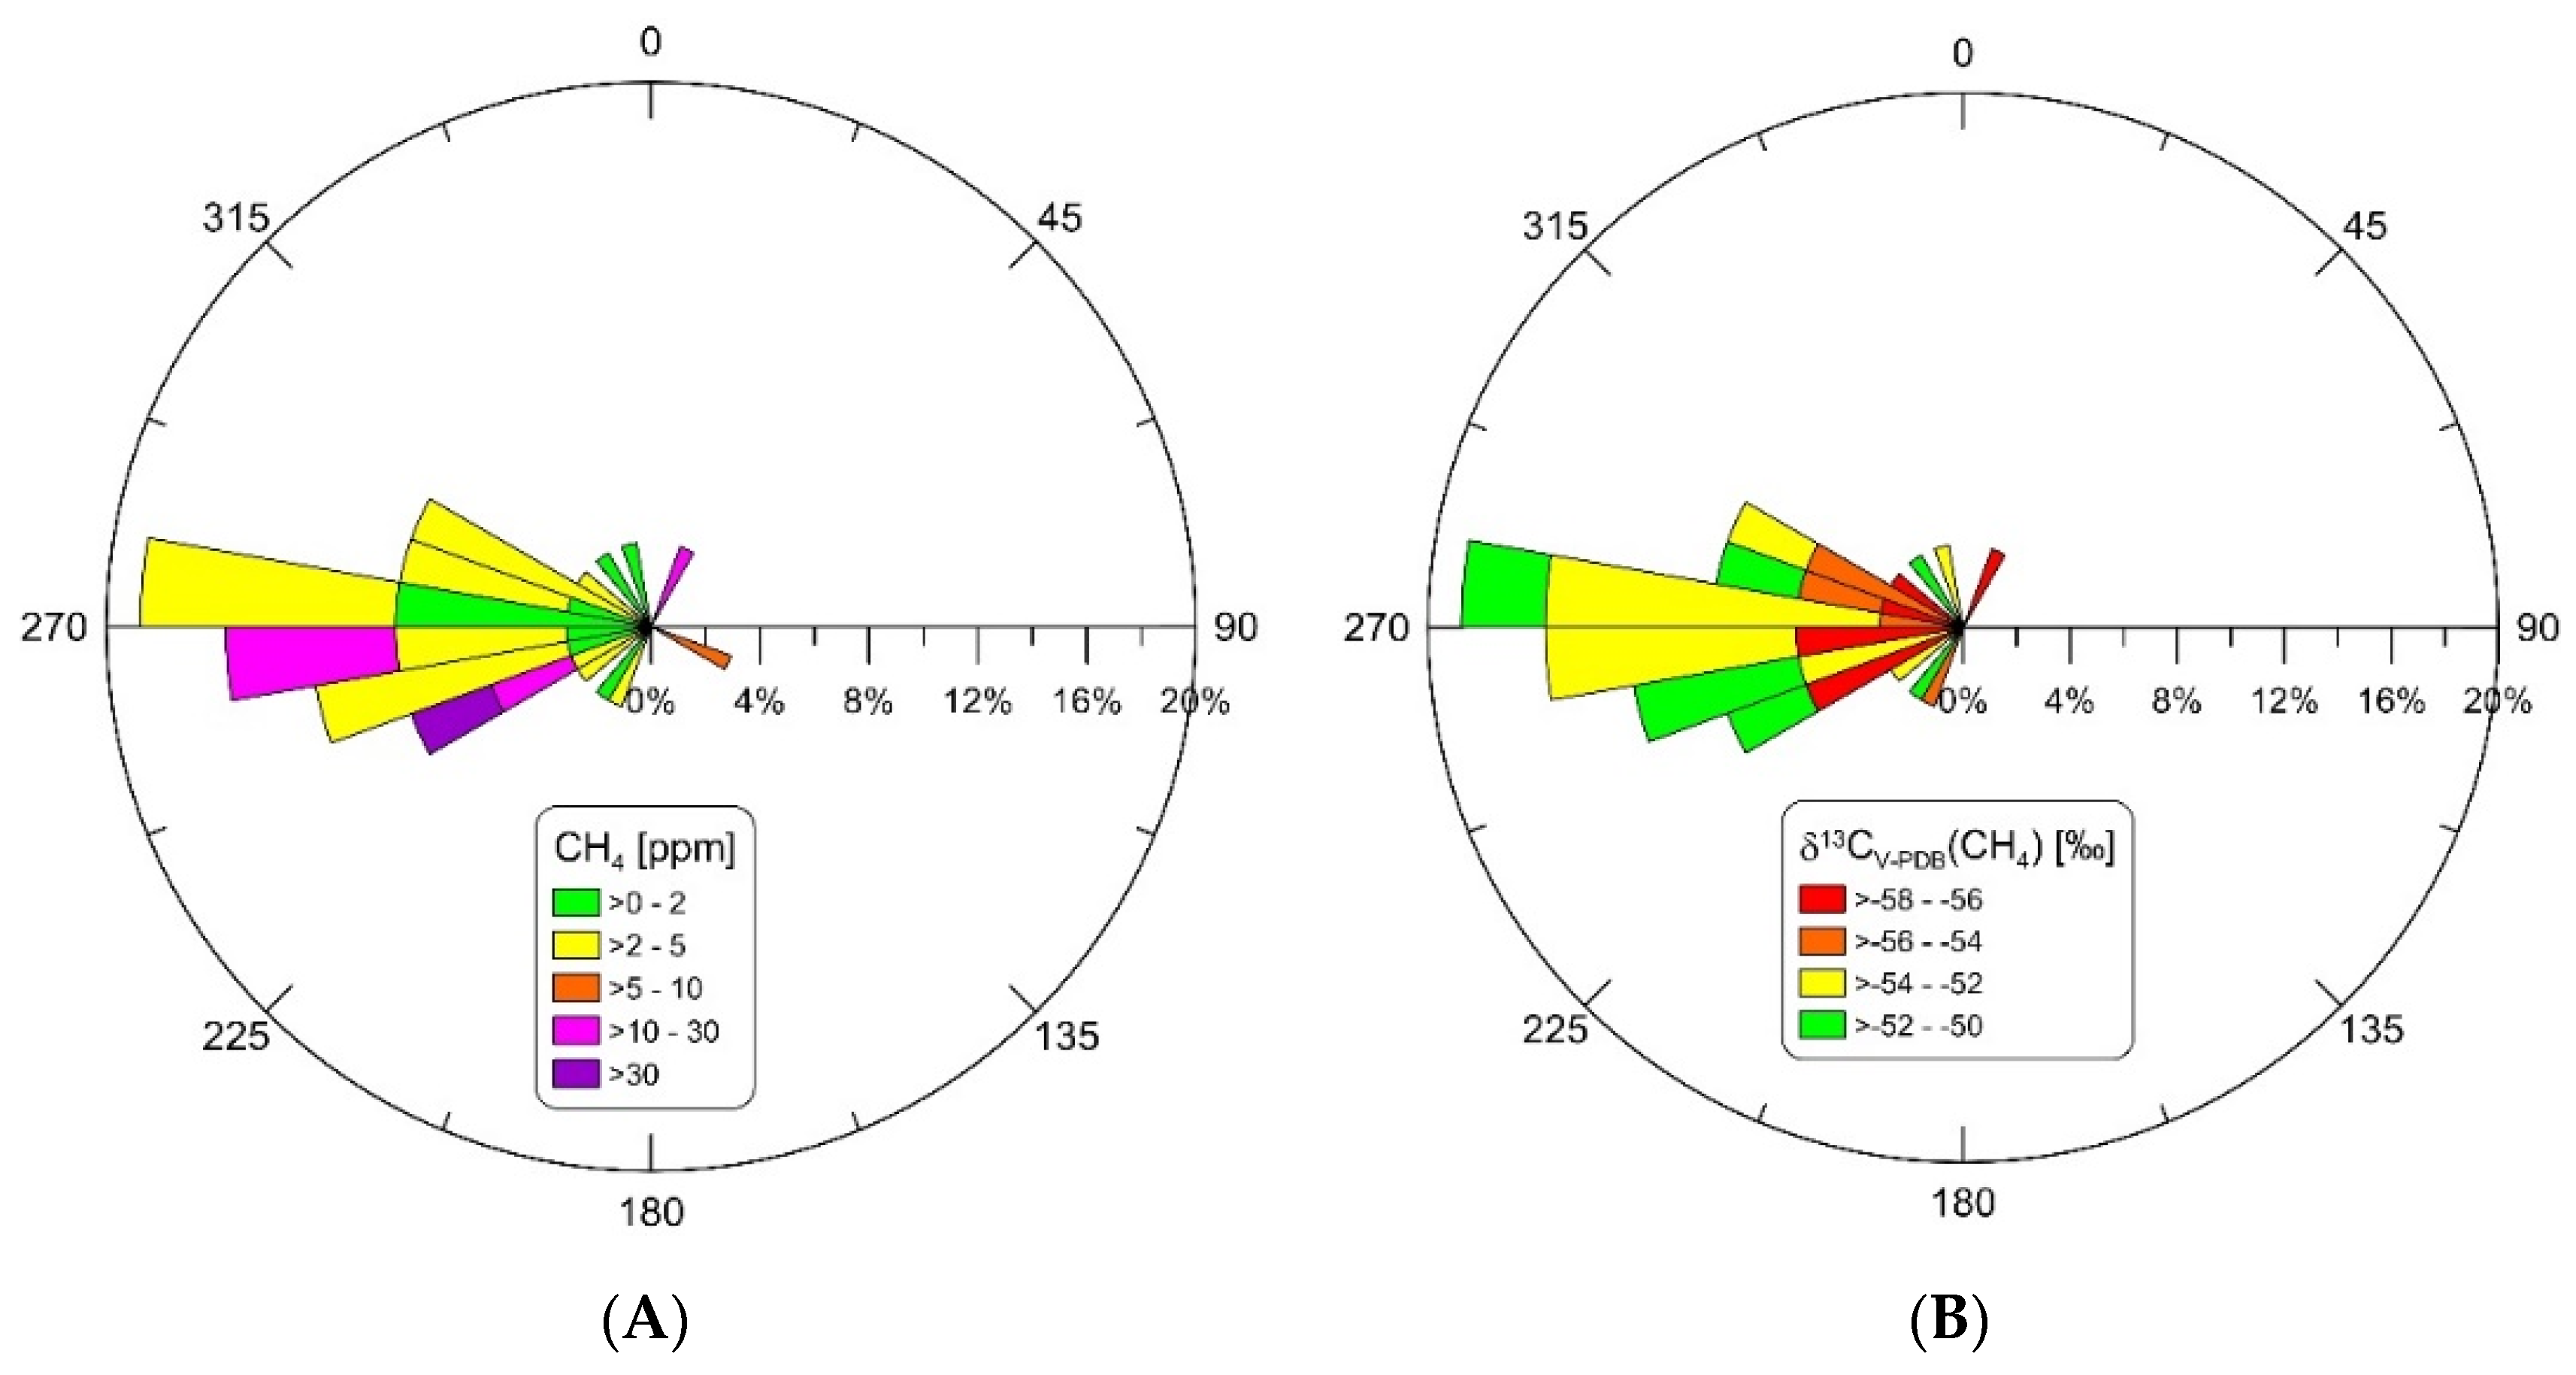
3.2. Mole Fraction and Stable Carbon Isotopic Composition of CH4 in the Vicinity of the Municipal Waste Landfill

The CH4 mole fraction measured during the 22 August 2017 sampling investigation varied from 1.89 to 129.48 ppm with an average value of 8.48 ± 22.46 ppm and a median of 2.17 ppm (Table 2). At some sampling points (e.g., No. 15), the mole fraction of ambient atmospheric CH4 in the vicinity of the municipal waste landfill showed significant enrichment (up to 65 times) compared to the global methane Mace Head Ireland NOAA (1.92 ppm, August 2017) background [56]. The significant differences between the average and median values indicate that some CH4 hot spots were observed rather than an enrichment of the entire analyzed area (Figure 3A).
The δ13C(CH4) in the ambient atmosphere follows the variability with 13C depletion in samples in the direction of the wind from landfill relation to samples with other wind directions. The δ13C(CH4) values vary between −59.1 and −50.9‰ with an average value of −53.9 ± 2.2‰ and median of −53.2‰; 13C was clearly depleted when compared to the Mace Head Ireland NOAA (−47.6‰, August 2017) background [56]. The carbon isotope composition clearly indicates hot spots (Figure 3B), however, similar values of the average and median suggest more mixed local air than the CH4 mole fraction data. The Spearman’s rank correlation coefficient between CH4 mole fraction data and δ13C(CH4) values reached −0.88 (Table 3) and indicate a significant negative relationship between both parameters.

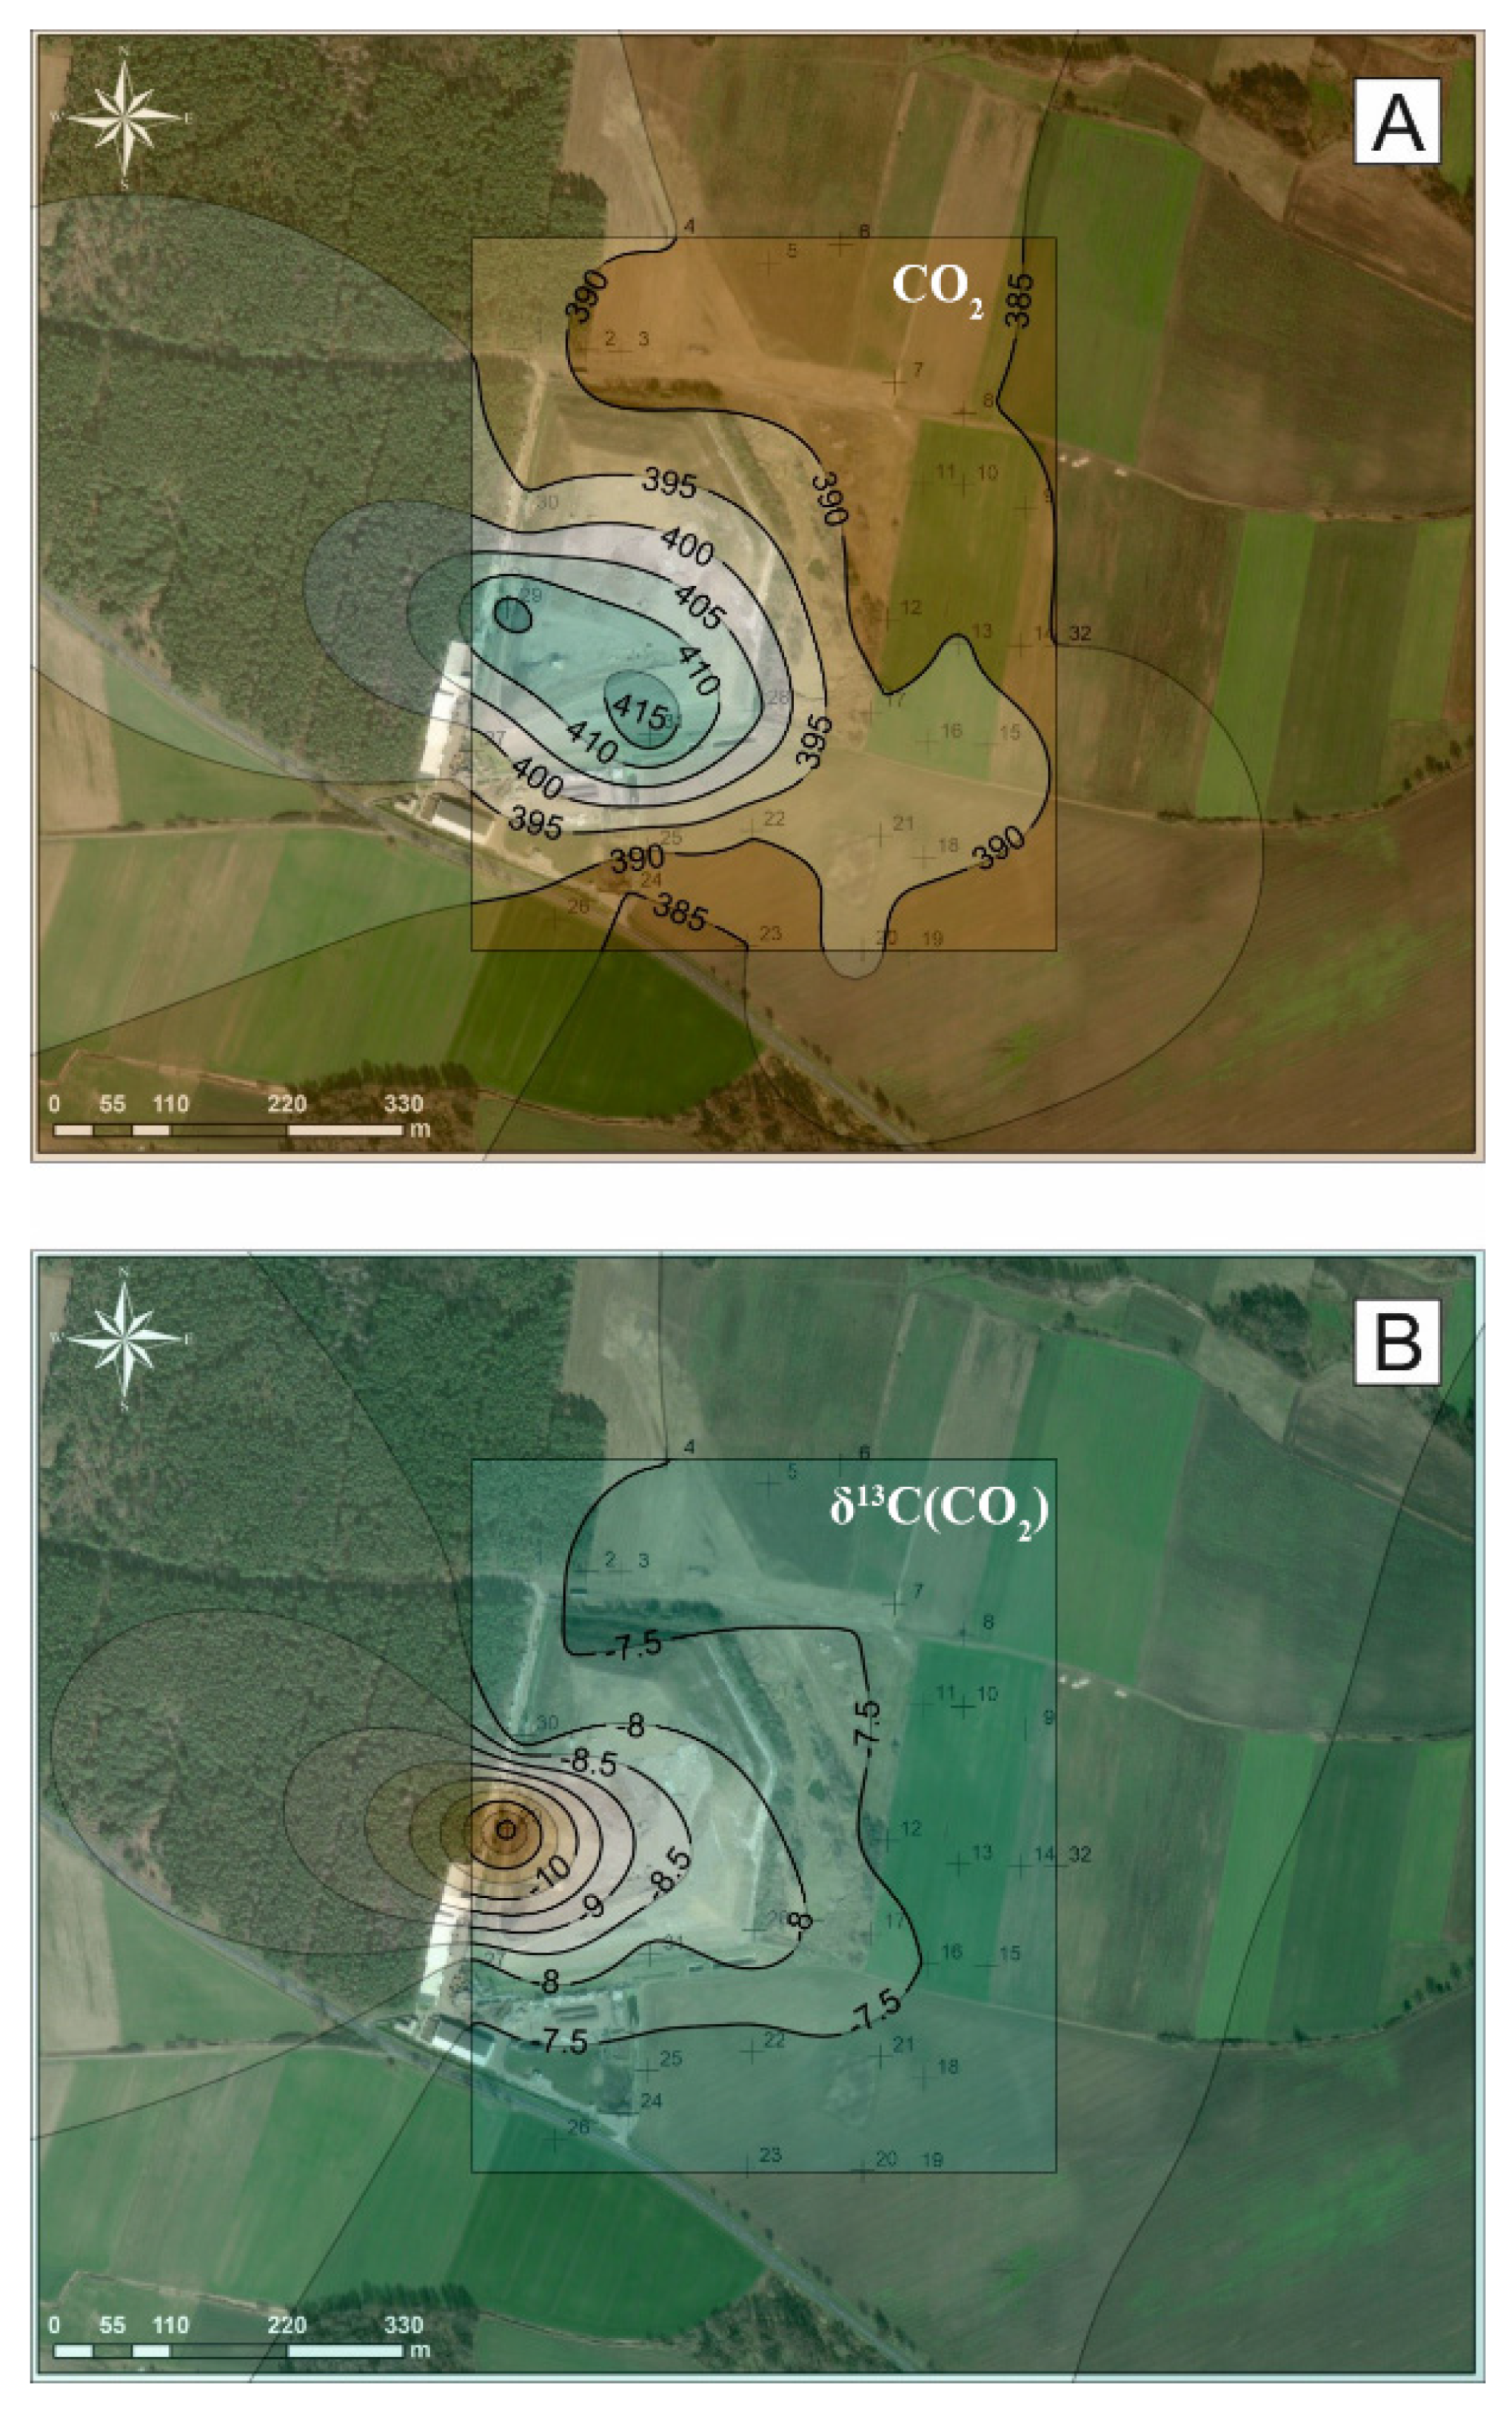
3.3. Mole Fraction and Stable Carbon Isotopic Composition of CO2 in the Vicinity of the Municipal Waste Landfill

The mole fraction of ambient atmospheric CO2 measured in the vicinity of the municipal waste landfill showed similar values to the global carbon dioxide Mace Head Ireland NOAA (402.5 ppm, August 2017) background [56], slightly changed due to local assimilation during the vegetation season (Table 2). The CO2 mole fraction during the 22 August 2017 sampling campaign varied from 384.9 to 419.0 ppm, with an average value of 391.4 ± 8.2 ppm and median value of 389.3 ppm. The lack of significant differences between the average and median as well as the similarity to the background NOAA CO2 mole fraction indicate that rather moderate CO2 hot spots existed in the analyzed area (Figure 4A).
The δ13C(CO2) in the ambient atmosphere follows the variability with 13C depletion in samples in the direction of the wind in relation to the landfill, observed for samples with other wind directions. However, the range of 13C depletion compared to the background values indicates a negligible but notable influence on local air. The δ13C(CO2) values vary between −12.4 and −7.1‰ with an average value of −7.6 ± 0.9‰ and median of −7.4‰. The carbon isotope composition clearly indicates hot spots (Figure 4B), however, similar values of average and median suggest a mixed local-air similarly to the CO2 mole fraction data. Moreover, most samples indicate 13C enrichment compared to with the NOAA background (−8.2‰, August 2017), especially on arable areas [56]. The Spearman’s rank correlation coefficient between CO2 mole fraction data and δ13C(CO2) values reaches −0.80 (Table 3) and indicated significant negative relationships between both parameters.

4. Discussion

4.1. General Divagation about GHGs on Investigated Landfill

The present work reveals the adverse impact of an active municipal waste landfill on GHGs levels in the neighboring atmosphere. Some studies also provided evidence that biogeochemical processes concerning bio-waste degradation in landfills ultimately lead to increased CO2 and CH4 emissions [4,50]. The rates of landfill-gas generation depend on the composition (organic content), age (or time since emplacement), moisture content, particle size and compaction and methods of landfilling, climate variables, etc. [7]. In general, standard gas production rates vary from 0.0007 to 0.0080 m3 per kg·year−1 [61].
The average mole fraction of CH4 and CO2 reported by the automatic measurement system in the biogas installation of our investigated landfill in 2017 was 46.85% and 37.73%, respectively and the amount of biogas (methane) collected and neutralized during burning in the flare and cogeneration processes (for electricity and heat production in generator) was 447,620 m3·year−1 [54]. Our investigations focused on two main gases (CH4 and CO2), due to the fact that official emissions of this municipal waste landfill reported in the KOBIZE (Poland’s National database on greenhouse gases and other substances emissions) database from the 2017 year are: 1073.920 Mg·year−1 CH4 from landfill quarters and 9.963 Mg·year−1 CO2 biogas used in electricity and heat generator in landfills [62]. The present results, compared to other reported data, are quite unique, due to analyzing an MWL for which a section has been reclaimed with a well-working biogas collection system, whereas the other section is still active with a completely uncontrolled emission of GHGs to the surrounding atmosphere.
The amount of biogas generated by fugitive emissions noted in [54] was 191,837 m3·year−1. In spite of effective and environmentally friendly procedures and installations such as reclaimed quarters I and II, with a biogas collection/burning system and alternative fuel production line, etc., the negative impact of GHGs on the local atmosphere should exist. The Keeling plots revealed the contribution from landfill methane and leachate treatment methane, with an average end-member δ13Csource of −58.36 ± 0.44‰ (Figure 5 and Figure 6). The intercept of CH4 contributed to by landfilling was also confirmed by a highly significant linear regression model (R2 = 0.80, p < 0.05). In contrast, the obtained δ13Csource of carbon dioxide end-member in the mixing model (Figure 5 and Figure 6) has an average value of −18.64 ± 1.75‰, which is in the range of photosynthetic CO2 assimilation in C3 plants. The significance of biogenic CO2 sources during the vegetative season was previously reported for the Wroclaw urban area [63]. In general, the ranges of δ13C values of CO2 and CH4 observed in our study are comparable to those from other European landfills, with a mean δ13C(CO2) = −16.8 ± 0.4‰, δ13C(CH4) = −52.9 ± 5.4‰. The obtained values of δ13C are consistent with other isotopic studies and indicate the main pathway of CH4 production in the MWL, resulting from acetate fermentation [37,38,44].
The largest sources of methane emissions from the analyzed landfill site were: (I) active landfill quarter III; (II) landfill leachate tank; (III) biogas collecting well. According to carbon dioxide, the most probable hotspots (Figure 1) were (I) the active landfill quarter III; (II) the biogas heat and power generator. The highest mole fractions of CH4 and CO2 were expected in the nearest eastward points from the landfill (Figure 1) due to the dominant wind existing westward (Figure 2) during the sampling campaign. Finally, the field sampling campaign revealed that substantial amounts of methane escaped from the leachate tank and quarter No. 3 (in operation) in the MWL. The plume of the gases released from the mentioned sources towards the east direction had a potential negative impact on the air quality of the immediate surroundings. The enhanced methane–mole fraction and strongly diluted δ13C(CH4) in ambient air were measured at a few points on the east side of the landfill (e.g., point No. 15—129.48 ppm; point No. 16—18.85 ppm; point No. 28—11.48 ppm) (Table 2, Figure 3).

4.2. CH4 Balance in the Vicinity of Municipal Waste Landfill

During the sampling campaign, we observed notable CH4 mole fractions not only in the nearest landfill points (Figure 1 and Figure 3A) but also at a distance of 300–500 m eastward/southeastward. The spatial distribution (Figure 3A) found a high methane–mole fraction in the air, even 25 times above the background (e.g., No. 15 allocated on the leeward side), compared to other analyzed points in the vicinity of landfill. Moreover, samples with higher CH4 mole fraction reported notable depletion of 13C, confirmed by the negative −0.88 coefficient of Spearman’s rank (Table 3). Graphical representation (Figure 5A) allowed us to hypothesize that: (i) the carbon isotope composition of many samples indicate biogenic landfill methane according to Levin et al. [30] data; (ii) two main CH4 hotspot sources probably exist, connected with landfill methane derived from active quarter III as well as generated in the open leachate tank (Figure 1 and Figure 3A,B). Landfill methane [30,45,64] has a similar range of δ13C(CH4) values (between −60 and −50‰) for methane generated from leachates [65] and from sewage [24].
The Keeling plot (Figure 6A) clearly indicates a biogenic origin (landfill + leachates) of methane with an intercept δ13C(CH4) value −58.36 ± 0.44‰ as a dominant CH4 source in the analyzed area. Biogenic CO2 derived from decomposition processes in landfills/or soil/root respiration, as well as from anthropogenic CO2 from biogas/fossil fuels burning was only connected with sample No. 29. In spite of the lack of δD(CH4) values, according to the C/H isotopes plot in Coleman et al. [66], the range of our δ13C(CH4) values indicate that the acetate-fermentation pathway dominates the CO2-reduction pathway. The δ13C(CO2) values did not show a genetic relation with the CO2-reduction pathway, both at its preliminary stage (when 13C depleted CO2 exists), as well as on its final stage, where it appears to be mostly reduced and enriched in 13C(CO2).
We did not discount the fact that intensive CO2/CH4 exchange can exist in covered and reclaimed landfill part in quarters I and II, however, almost the entire biogas from these quarters was found to be captured in wells and burned in a generator. Hence, methane observed in the vicinity is probably generated mostly in situ from “fresh” municipal waste and from landfill leachates. The lack or the very negligible increase of the CH4 mole fraction, as well as the fact that it was generally not isotopically different from the background in north and northeast sampling points (near reclaimed fragment of landfill) confirmed our hypothesis. The rose-type diagram for the CH4 mole fraction (Figure 7A) and δ13C(CH4) values (Figure 7B) revealed the dominant wind direction and velocity to be factors that controlled methane spread in the local atmosphere, in spite of pure or a lack of official statistical relations (Table 3).

4.3. CO2 Balance in the Vicinity of Municipal Waste Landfill

Surprisingly, for a given study period, the above-atmospheric levels of CO2 (>390 ppm) were possible to observe only in the nearest landfill points (No. 27–31 Figure 1 and Figure 4A). The other sampling points reached similar or slightly lower (up to 5 ppm) CO2 mole fractions compared to the background level [56]. Similarly to the CO2 mole fraction, the δ13C(CO2) values of most air samples collected further from landfills showed a slight 13C enrichment compared to the background, and only the nearest (No. 28 and 29) points indicate a notable depletion in 13C (up to 4.4‰). The relationship between the CO2 mole fraction and δ13C(CO2) values (Figure 5B) clearly indicated a biogenic input of the surrounding landfill agriculture fields and grassland. An assimilation process of CO2 by vegetation or by soil microorganisms [67,68,69] caused a lower CO2 mole fraction of residue carbon dioxide in ambient air, as well as the enrichment of 13C due to preferential 12C consumption.
The slightly marked CO2 hotspot near generator burned biogas (methane) (Figure 1) and leachate tank influence the local landfill atmosphere (Table 2 and Figure 4A,B). As a result, the very intensive aerobic bacterial reactions on active quarter III are not spatially observed in CO213C(CO2) values plum. A total of 447,600 m3 of biogas was burned in the flare and generator (0.294 MW of electric power) in 2017. However, a CO2 signal was not detected, probably due to the hot exhaust gases being conventionally raised and mixed in the upper layers of the atmosphere, although not affecting the local atmosphere.
Many authors noted extremely enriched in δ13C(CO2) values, reaching up to +20‰ for landfill CO2 and CO2/DIC in landfill leachates [8,45,64]. Therefore, in the case of the existing bacterial CO2 reduction process, extremely 13C enriched residual ambient CO2 in landfill and neighboring sampling points have been expected. Instead of this, the slightly depleted in 13C(CO2), observed in the vicinity of the landfill, was probably connected with exhaust gasses from the exploitation of heavy machinery (garbage trucks, landfill compactors) and from the biogas generator (marked on Figure 5B as landfill CO2). Conversely, the oxidation of biogas methane in landfills results in a significant depletion in 13C(CO2) in the landfill atmosphere [66]. However, in this situation, both the CO2 mole fraction, as well as the carbon isotopic signal of carbon dioxide have not been observed in the analysed landfill.
We hypothesize that intensive CO2 reduction on this landfill does not occur, especially in active open quarter III, and only local grassland/agriculture fields were able to buffer and assimilate CO2 that potentially derived from the landfill. This thesis is confirmed by the positive (ρ = 0.80) coefficients of Spearman’s rank between CO2 and δ13C(CO2) and negative (ρ = −0.41) between the CH4 mole fraction and δ13C(CO2) (Table 3). The Keeling plot (Figure 6B) for n = 31 points’ mixing ratio source (δ13Csource = −18.64 ± 1.75‰) indicates assimilation by vegetation surrounding the landfill, rather than (i) biogenic CO2 derived from decomposition processes on landfills/or soil/root respiration, as well as (ii) anthropogenic CO2 from biogas/fossil fuels burning (only connected with sample No. 29).

5. Conclusions

This study presented the spatial characteristic of atmospheric CO2 and CH4 levels in short-term responses to environmental conditions observed in the vicinity of the municipal waste landfill for our August 2017 sampling campaign. Our investigation confirmed the negative influence of the municipal waste landfill site, especially at the hot-spot zones, on the local GHG balance in the surrounding atmosphere, but less than assumed. We observe a negligible CO2 mole fraction difference in relation to that of the background, as well as its carbon isotopes signal in samples at a distance of 100 m from the landfill. A very significant CO2 assimilation process in the surrounded agriculture/grassland area completely compensated for the possible negative CO2 input. Most of the ambient CO2 samples collected around the landfill had prevailing background CO2 levels (varied from 384.9 to 419.0 ppm), with an average value of 391.4 ± 8.2 ppm, which were calculated by the binary mixing model isotopic signature and had a mean source value of −18.64 ± 1.75‰.
The obtained results suggest that the isotopic content of methane in the immediate surroundings (average value of δ13C = −53.9 ± 2.2‰) is strongly influenced by microbial origins (acetate -fermentation pathway) in the studied landfill site. Methane contribution was likely connected with two of the landfill CH4 hotspots, including (1) active quarter III and (2) the leachate system/tank. The highest excess of CH4 and notable methane depletion in 13C was observed c.a. 300 m eastward/northeastward from the landfill. The CH4 mole fraction in the emitted gases close to the hotspots reached up to 129.48 ppm, with an average δ13C value of −57.3 ± 1.0‰. The reclaimed quarters I and II showed negligible methane emission to the local atmosphere, due to the existing well-working biogas collection and processing system (with heat and power co-generator).
Biogas emissions showed a good correlation with air temperature and wind velocity, however, no significant relationships between relative humidity, atmospheric pressure and methane levels were observed. The effect of moderate to strong westward wind (average of 3.4 ± 1.7 m·s−1) on the dispersion of landfill origin GHG gases (CO2 and CH4) in the local atmosphere dominated up to 500 m from the landfill. The dispersion of GHG emissions from landfill areas should be further investigated using in situ surveys, as their contribution to the local carbon budget vary significantly in different spatial and temporal settings. Finally, to maximize the potential of CH4 mitigation, emissions from landfill sites should be reduced by utilizing waste composition as a source. Therefore, further research should focus on assessing the level of biogas production from active quarter III and the leachate tank, using chamber methods and experimental well drilling, followed by dispersion modeling, which should help to minimize the negative impact of GHGs derived from MWLs on the environment.

Author Contributions

Supervision, writing original draft, investigation, methodology, visualization: M.G.; writing original draft, methodology, investigation: Y.B.; writing, review and editing, funding acquisition: I.S. All authors have read and agreed to the published version of the manuscript.

Funding

This research received no external funding.

Institutional Review Board Statement

Not applicable.

Informed Consent Statement

Not applicable.

Data Availability Statement

Not applicable.

Acknowledgments

The authors thank Nikola Nowak for assistance with field sample collection. We would like to thank Dariusz Strąpoć for his helpful advice on principal methane production processes during the preparation of this manuscript. We are also grateful to the National Center for Emissions Management, Poland (KOBiZE) for access to emission data for particular source categories in the selected years.

Conflicts of Interest

The authors declare no conflict of interest. The funders had no role in the design of the study; in the collection, analyses, or interpretation of data; in the writing of the manuscript, or in the decision to publish the results.

References

  1. Friedlingstein, P.; O’Sullivan, M.; Jones, M.W.; Andrew, R.M.; Hauck, J.; Olsen, A.; Peters, G.P.; Peters, W.; Pongratz, J.; Sitch, S.; et al. Global Carbon Budget 2020. Earth Syst. Sci. Data 2020, 12, 3269–3340. [Google Scholar] [CrossRef]
  2. Smith, K.R.; Desai, M.A.; Rogers, J.V.; Houghton, R.A. Joint CO2 and CH4 accountability for global warming. Proc. Natl. Acad. Sci. USA 2013, 110, E2865–E2874. [Google Scholar] [CrossRef] [PubMed] [Green Version]
  3. Saunois, M.; Stavert, A.R.; Poulter, B.; Bousquet, P.; Canadell, J.G.; Jackson, R.B.; Raymond, P.A.; Dlugokencky, E.J.; Houweling, S.; Patra, P.K.; et al. The Global Methane Budget 2000–2017. Earth Syst. Sci. Data 2020, 12, 1561–1623. [Google Scholar] [CrossRef]
  4. Pehme, K.-M.; Orupõld, K.; Kuusemets, V.; Tamm, O.; Jani, Y.; Tamm, T.; Kriipsalu, M. Field Study on the Efficiency of a Methane Degradation Layer Composed of Fine Fraction Soil from Landfill Mining. Sustainability 2020, 12, 6209. [Google Scholar] [CrossRef]
  5. Speight, J. Natural Gas; Elsevier: Amsterdam, The Netherlands, 2019; ISBN 9780128095706. [Google Scholar]
  6. Yang, L.; Chen, Z.; Zhang, X.; Liu, Y.; Xie, Y. Comparison study of landfill gas emissions from subtropical landfill with various phases: A case study in Wuhan, China. J. Air Waste Manag. Assoc. 2015, 65, 980–986. [Google Scholar] [CrossRef]
  7. Robertson, T.; Dunbar, J. Guidance for evaluating landfill gas emissions from closed or abandoned facilities. In EPA Report; United States Environmental Protection Agency: Washington, DC, USA, 2005. [Google Scholar]
  8. de Medeiros Engelmann, P.; dos Santos, V.H.J.M.; Barbieri, C.B.; Augustin, A.H.; Ketzer, J.M.M.; Rodrigues, L.F. Environmental monitoring of a landfill area through the application of carbon stable isotopes, chemical parameters and multivariate analysis. Waste Manag. 2018, 76, 591–605. [Google Scholar] [CrossRef]
  9. Kjeldsen, P.; Barlaz, M.A.; Rooker, A.P.; Baun, A.; Ledin, A.; Christensen, T.H. Present and Long-Term Composition of MSW Landfill Leachate: A Review. Crit. Rev. Environ. Sci. Technol. 2002, 32, 297–336. [Google Scholar] [CrossRef]
  10. Białowiec, A. Some Aspects of Environmental Impact of Waste Dumps. In Contemporary Problems of Management and Environmental Protection; University of Warmia and Mazury in Olsztyn: Olsztyn, Poland, 2011; ISBN 978-83-929462-7-4. [Google Scholar]
  11. Khalil, D.M.J.; Gupta, R.; Sharma, K. Microbiological Degradation of Municipal Solid Waste in Landfills for LFG Generation. In National Conference on Synergetic Trends in engineering and Technology (STET-2014) International Journal of Engineering and Technical Research; ISSN 2321-0869. Special Issue; Available online: https://www.erpublication.org/published_paper/IJETR_APRIL_2014_STET_03.pdf (accessed on 2 November 2021).
  12. Njoku, P.O.; Odiyo, J.O.; Durowoju, O.S.; Edokpayi, J.N. A Review of Landfill Gas Generation and Utilisation in Africa. Open Environ. Sci. 2018, 10, 1–15. [Google Scholar] [CrossRef] [Green Version]
  13. Vaverková, M.D. Landfill Impacts on the Environment—Review. Geosciences 2019, 9, 431. [Google Scholar] [CrossRef] [Green Version]
  14. Brennan, R.B.; Healy, M.G.; Morrison, L.; Hynes, S.; Norton, D.; Clifford, E. Management of landfill leachate: The legacy of European Union Directives. Waste Manag. 2016, 55, 355–363. [Google Scholar] [CrossRef] [PubMed]
  15. Ozbay, G.; Jones, M.; Gadde, M.; Isah, S.; Attarwala, T. Design and Operation of Effective Landfills with Minimal Effects on the Environment and Human Health. J. Environ. Public Health 2021, 2021, 1–13. [Google Scholar] [CrossRef] [PubMed]
  16. Toro, R.; Morales, L. Landfill fire and airborne aerosols in a large city: Lessons learned and future needs. Air Qual. Atmos. Health 2018, 11, 111–121. [Google Scholar] [CrossRef]
  17. Rao, M.N.; Sultana, R.; Kota, S. Solid and Hazardous Waste Management; Elsevier: Amsterdam, The Netherlands, 2016; ISBN 9780128098769. [Google Scholar]
  18. U.S. Environmental Protection Agency. International Best Practices Guide for Landfill Gas Energy Projects; United States Environmental Protection Agency: Washington, DC, USA, 2012.
  19. Xu, L.; Lin, X.; Amen, J.; Welding, K.; McDermitt, D. Impact of changes in barometric pressure on landfill methane emission. Glob. Biogeochem. Cycles 2014, 28, 679–695. [Google Scholar] [CrossRef] [Green Version]
  20. Goldsmith, C.D.; Chanton, J.; Abichou, T.; Swan, N.; Green, R.; Hater, G. Methane emissions from 20 landfills across the United States using vertical radial plume mapping. J. Air Waste Manag. Assoc. 2012, 62, 183–197. [Google Scholar] [CrossRef] [Green Version]
  21. Menoud, M.; van der Veen, C.; Necki, J.; Bartyzel, J.; Szénási, B.; Stanisavljević, M.; Pison, I.; Bousquet, P.; Röckmann, T. Methane (CH4) sources in Krakow, Poland: Insights from isotope analysis. Atmos. Chem. Phys. 2021, 21, 13167–13185. [Google Scholar] [CrossRef]
  22. Zimnoch, M.; Necki, J.; Chmura, L.; Jasek, A.; Jelen, D.; Galkowski, M.; Kuc, T.; Gorczyca, Z.; Bartyzel, J.; Rozanski, K. Quantification of carbon dioxide and methane emissions in urban areas: Source apportionment based on atmospheric observations. Mitig. Adapt. Strateg. Glob. Chang. 2019, 24, 1051–1071. [Google Scholar] [CrossRef] [Green Version]
  23. Pang, J.; Wen, X.; Sun, X. Mixing ratio and carbon isotopic composition investigation of atmospheric CO2 in Beijing, China. Sci. Total Environ. 2016, 539, 322–330. [Google Scholar] [CrossRef] [PubMed]
  24. Górka, M.; Lewicka-Szczebak, D.; Fuß, R.; Jakubiak, M.; Jędrysek, M.O. Dynamics and origin of atmospheric CH4 in a Polish metropolitan area characterized by wetlands. Appl. Geochem. 2014, 45, 72–81. [Google Scholar] [CrossRef]
  25. Stolper, D.A.; Martini, A.M.; Clog, M.; Douglas, P.M.; Shusta, S.S.; Valentine, D.L.; Sessions, A.L.; Eiler, J.M. Distinguishing and understanding thermogenic and biogenic sources of methane using multiply substituted isotopologues. Geochim. Et Cosmochim. Acta 2015, 161, 219–247. [Google Scholar] [CrossRef] [Green Version]
  26. Douglas, P.M.J.; Stolper, D.A.; Eiler, J.M.; Sessions, A.L.; Lawson, M.; Shuai, Y.; Bishop, A.; Podlaha, O.G.; Ferreira, A.A.; Santos Neto, E.V.; et al. Methane clumped isotopes: Progress and potential for a new isotopic tracer. Org. Geochem. 2017, 113, 262–282. [Google Scholar] [CrossRef] [Green Version]
  27. Schaefer, H.; Fletcher, S.E.M.; Veidt, C.; Lassey, K.R.; Brailsford, G.W.; Bromley, T.M.; Dlugokencky, E.J.; Michel, S.E.; Miller, J.B.; Levin, I.; et al. A 21st-century shift from fossil-fuel to biogenic methane emissions indicated by 13CH4. Science 2016, 352, 80–84. [Google Scholar] [CrossRef]
  28. Zazzeri, G.; Lowry, D.; Fisher, R.E.; France, J.L.; Lanoisellé, M.; Kelly, B.F.J.; Necki, J.M.; Iverach, C.P.; Ginty, E.; Zimnoch, M.; et al. Carbon isotopic signature of coal-derived methane emissions to the atmosphere: From coalification to alteration. Atmos. Chem. Phys. 2016, 16, 13669–13680. [Google Scholar] [CrossRef] [Green Version]
  29. Tait, D.R.; Maher, D.T.; Santos, I.R. Seasonal and Diurnal Dynamics of Atmospheric Radon, Carbon Dioxide, Methane, δ13C-CO2 and δ13C-CH4 in a Proposed Australian Coal Seam Gas Field. Water Air Soil Pollut. 2015, 226, 350. [Google Scholar] [CrossRef]
  30. Levin, I.; Bergamaschi, P.; Dörr, H.; Trapp, D. Stable isotopic signature of methane from major sources in Germany. Chemosphere 1993, 26, 161–177. [Google Scholar] [CrossRef]
  31. Hare, V.J.; Loftus, E.; Jeffrey, A.; Ramsey, C.B. Atmospheric CO2 effect on stable carbon isotope composition of terrestrial fossil archives. Nat. Commun. 2018, 9, 252. [Google Scholar] [CrossRef] [PubMed] [Green Version]
  32. Jasek, A.; Zimnoch, M.; Gorczyca, Z.; Smula, E.; Rozanski, K. Seasonal variability of soil CO2 flux and its carbon isotope composition in Krakow urban area, Southern Poland. Isot. Environ. Health Stud. 2014, 50, 143–155. [Google Scholar] [CrossRef] [PubMed]
  33. Graven, H.; Keeling, R.F.; Rogelj, J. Changes to Carbon Isotopes in Atmospheric CO2 Over the Industrial Era and Into the Future. Glob. Biogeochem. Cycles 2020, 34, e2019GB006170. [Google Scholar] [CrossRef]
  34. North, J.C.; Frew, R.D.; Van Hale, R. Can stable isotopes be used to monitor landfill leachate impact on surface waters? J. Geochem. Explor. 2006, 88, 49–53. [Google Scholar] [CrossRef]
  35. Raco, B.; Dotsika, E.; Battaglini, R.; Bulleri, E.; Doveri, M.; Papakostantinou, K. A Quick and Reliable Method to Detect and Quantify Contamination from MSW Landfills: A Case Study. Water Air Soil Pollut. 2013, 224, 1380. [Google Scholar] [CrossRef]
  36. Wimmer, B.; Hrad, M.; Huber-Humer, M.; Watzinger, A.; Wyhlidal, S.; Reichenauer, T.G. Stable isotope signatures for characterising the biological stability of landfilled municipal solid waste. Waste Manag. 2013, 33, 2083–2090. [Google Scholar] [CrossRef] [PubMed]
  37. Widory, D.; Proust, E.; Bellenfant, G.; Bour, O. Assessing methane oxidation under landfill covers and its contribution to the above atmospheric CO2 levels: The added value of the isotope (δ13C and δ18O CO2; δ13C and δD CH4) approach. Waste Manag. 2012, 32, 1685–1692. [Google Scholar] [CrossRef] [PubMed]
  38. Bergamaschi, P.; Lubina, C.; Königstedt, R.; Fischer, H.; Veltkamp, A.C.; Zwaagstra, O. Stable isotopic signatures (•13C, gD) of methane from European landfill sites. J. Geophys. Res. 1998, 103, 8251–8265. [Google Scholar] [CrossRef]
  39. Al-Shalan, A.; Lowry, D.; Fisher, R.E.; Nisbet, E.G.; Zazzeri, G.; Al-Sarawi, M.; France, J.L. Methane emissions in Kuwait: Plume identification, isotopic characterisation and inventory verification. Atmos. Environ. 2021, 268, 118763. [Google Scholar] [CrossRef]
  40. Bakkaloglu, S.; Lowry, D.; Fisher, R.; France, J.; Lanoiselle, M.; Fernandez, J. Characterization and Quantification of Methane Emissions from Waste in the UK. In Proceedings of the EGU General Assembly 2020, Online, 4–8 May 2020. [Google Scholar] [CrossRef]
  41. Aghdam, E.F.; Fredenslund, A.M.; Chanton, J.; Kjeldsen, P.; Scheutz, C. Determination of gas recovery efficiency at two Danish landfills by performing downwind methane measurements and stable carbon isotopic analysis. Waste Manag. 2018, 73, 220–229. [Google Scholar] [CrossRef] [PubMed] [Green Version]
  42. Sanci, R.; Panarello, H.O. Carbon stable isotopes as indicators of the origin and evolution of CO2 and CH4 in urban solid waste disposal sites and nearby areas. Environ. Earth Sci. 2016, 75, 294. [Google Scholar] [CrossRef]
  43. Whiticar, M.J. Stable isotope geochemistry of coals, humic kerogens and related natural gases. Int. J. Coal Geol. 1996, 32, 191–215. [Google Scholar] [CrossRef]
  44. Whiticar, M.; Faber, E.; Schoell, M. Biogenic methane formation in marine and freshwater environments: CO2 reduction vs. acetate fermentation—Isotope evidence. Geochim. Et Cosmochim. Acta 1986, 50, 693–709. [Google Scholar] [CrossRef]
  45. Baldassare, F.J.; Laughrey, C.D. Identifying the sources of stray methane by using geochemical and isotopic fingerprinting. Environ. Geosci. 1997, 4, 85–94. [Google Scholar]
  46. Tecle, D.; Lee, J.; Hasan, S. Quantitative analysis of physical and geotechnical factors affecting methane emission in municipal solid waste landfill. Environ. Geol. 2009, 56, 1135–1143. [Google Scholar] [CrossRef]
  47. Zhang, C.; Xu, T.; Feng, H.; Chen, S. Greenhouse Gas Emissions from Landfills: A Review and Bibliometric Analysis. Sustainability 2019, 11, 2282. [Google Scholar] [CrossRef] [Green Version]
  48. Haro, K.; Ouarma, I.; Nana, B.; Bere, A.; Tubreoumya, G.C.; Kam, S.Z.; Laville, P.; Loubet, B.; Koulidiati, J. Assessment of CH4 and CO2 surface emissions from Polesgo’s landfill (Ouagadougou, Burkina Faso) based on static chamber method. Adv. Clim. Chang. Res. 2019, 10, 181–191. [Google Scholar] [CrossRef]
  49. Gonzalez-Valencia, R.; Magana-Rodriguez, F.; Martinez-Cruz, K.; Fochesatto, G.J.; Thalasso, F. Spatial and temporal distribution of methane emissions from a covered landfill equipped with a gas recollection system. Waste Manag. 2021, 121, 373–382. [Google Scholar] [CrossRef] [PubMed]
  50. Zhang, C.; Guo, Y.; Wang, X.; Chen, S. Temporal and spatial variation of greenhouse gas emissions from a limited-controlled landfill site. Environ. Int. 2019, 127, 387–394. [Google Scholar] [CrossRef]
  51. Climate-Data.org. Available online: https://en.climate-data.org/europe/poland/lower-silesian-voivodeship-456/ (accessed on 9 October 2021).
  52. OpenStreetMap. Available online: OpenStreetMap.org (accessed on 11 November 2020).
  53. Information on Individual Types of Municipal Waste Collected from the Wroclaw Urban Area. Available online: https://www.google.com/url?sa=t&rct=j&q=&esrc=s&source=web&cd=&ved=2ahUKEwjXt-vzwpr0AhUEt4sKHdw9CDcQFnoECAkQAQ&url=https%3A%2F%2Fbip.um.wroc.pl%2Fattachments%2Fdownload%2F57300&usg=AOvVaw3O4-ZvhtKb5GEwKlTRZ1yG (accessed on 2 November 2021).
  54. GIOŚ. Chief Inspectorate of Environmental Protection (GIOS, Poland). Inspection Report no. WIOŚ-Wroc 301/2018; GIOŚ: Wrocław, Poland, 2018. [Google Scholar]
  55. Chybiński, S.; Gaworecka, M.; Olearnik, M.; Krzyśków, A. Analysis of the State of Municipal Precipitation Management in the Kobierzyce Commune; Gmina Kobierzyce: Wrocław, Poland, 2015. [Google Scholar]
  56. NOAA. Carbon Cycle Gases Mace Head, County Galway, Ireland. Available online: https://gml.noaa.gov/dv/iadv/graph.php?code=MHD&program=ccgg&type=lg (accessed on 28 April 2021).
  57. Keeling, C.D. The concentration and isotopic abundances of atmospheric carbon dioxide in rural areas. Geochim. Et Cosmochim. Acta 1958, 13, 322–334. [Google Scholar] [CrossRef]
  58. Pataki, D.E. Seasonal cycle of carbon dioxide and its isotopic composition in an urban atmosphere: Anthropogenic and biogenic effects. J. Geophys. Res. 2003, 108, 4735. [Google Scholar] [CrossRef]
  59. Bezyk, Y.; Sówka, I.; Górka, M.; Blachowski, J. GIS-Based Approach to Spatio-Temporal Interpolation of Atmospheric CO2 Concentrations in Limited Monitoring Dataset. Atmosphere 2021, 12, 384. [Google Scholar] [CrossRef]
  60. Nowak, N. Assessment of Greenhouse Gas Emissions from the Municipal Waste Landfill in Rudna Wielka on the Basis of Concentrations and Carbon Isotopic Composition of Atmospheric CO2 and CH4. Master’s thesis, University of Wroclaw, Wroclaw, Poland, 2018. [Google Scholar]
  61. Ezekwe, I.C.; Arokoyu, S.B. Landfill Emissions and their Urban Planning and Environmental Health Implications in Port Harcourt, South-South Nigeria. Desenvolv. E Meio Ambiente 2017, 42, 42–224. [Google Scholar] [CrossRef] [Green Version]
  62. KOBiZE. Poland’s National Database on Greenhouse Gases and other Substances Emissions. Data on the Waste Management Plant. Installations and Sources, Emission Levels of Selected Substances for 2016–2020; IOŚ-PIB: Warsaw, Poland, 2021. [Google Scholar]
  63. Bezyk, Y.; Sówka, I.; Górka, M. Assessment of urban CO2 budget: Anthropogenic and biogenic inputs. Urban Clim. 2021, 39, 100949. [Google Scholar] [CrossRef]
  64. Hackley, K.C.; Liu, C.L.; Coleman, D.D. Environmental Isotope Characteristics of Landfill Leachates and Gases. Ground Water 1996, 34, 827–836. [Google Scholar] [CrossRef]
  65. Bréas, O.; Guillou, C.; Reniero, F.; Wada, E. The Global Methane Cycle: Isotopes and Mixing Ratios, Sources and Sinks. Isot. Environ. Health Stud. 2001, 37, 257–379. [Google Scholar] [CrossRef] [PubMed]
  66. Coleman, D.D.; Liu, C.L.; Hackley, K.C.; Pelphrey, S.R. Isotopic Identification of Landfill Methane. AAPG Div. Environ. Geosci. J. 1995, 2, 95–103. [Google Scholar]
  67. Schubert, B.A.; Jahren, A.H. The effect of atmospheric CO2 concentration on carbon isotope fractionation in C3 land plants. Geochim. Et Cosmochim. Acta 2012, 96, 29–43. [Google Scholar] [CrossRef]
  68. Bezyk, Y.; Dorodnikov, M.; Sówka, I. Effects of climate factors and vegetation on the CO2 fluxes and δ13C from re-established grassland. E3S Web Conf. 2017, 22, 00017. [Google Scholar] [CrossRef] [Green Version]
  69. Werth, M.; Kuzyakov, Y. 13C fractionation at the root–microorganisms–soil interface: A review and outlook for partitioning studies. Soil Biol. Biochem. 2010, 42, 1372–1384. [Google Scholar] [CrossRef]
Figure 1. Location of the municipal waste landfill site (51°38′03.3″ N 16°41′56.8″ E) and 32 atmospheric air sampling points on 22 August 2017. Base map source [52].
Energies 14 08259 g001
Figure 2. Wind rose measured on 22 August 2017 in the vicinity of the municipal waste landfill.
Energies 14 08259 g002
Figure 3. Spatial distribution of CH4 mole fraction (A) and the δ13C(CH4) values (B) in the vicinity of the municipal waste landfill sampled on 22 August 2017 campaign. Brightness rectangle covered sampling points, whereas the area outside has been extrapolated.
Energies 14 08259 g003
Figure 4. Spatial distribution of CO2 mole fraction (A) and the δ13C(CO2) values (B) in the vicinity of the municipal waste landfill sampled on 22 August 2017 campaign. Brightness rectangle covered sampling points, whereas the area outside has been extrapolated.
Energies 14 08259 g004
Figure 5. Relations between mole fraction and carbon isotopes composition of methane (A) and carbon dioxide (B) from ambient air gathered in the vicinity of municipal waste landfill sampled during the 22 August 2017 campaign. Dashed lines show the linear regression fit for the data sampled. The green dots represent average background values according Mace Head Research Station, Ireland, NOAA. Black solid/dashed lines represent expected source contribution range.
Energies 14 08259 g005
Figure 6. Relations between reciprocal of mole fraction and carbon isotopes composition of methane (A) and carbon dioxide (B) from ambient air gathered in the vicinity of municipal waste landfill sampled on 22 August 2017 campaign. Dashed lines show the linear regression fit of the data sampled. The green dots represent average background values according to Mace Head Research Station, Ireland, NOAA.
Energies 14 08259 g006
Figure 7. The circular distribution of directional data of CH4 mole fraction (A) and δ13C(CH4) values (B) from ambient air gathered in the vicinity of municipal waste landfill sampled during 22 August 2017 campaign.
Energies 14 08259 g007
Table 1. Amount and composition of waste in the municipal waste landfill site collected in 2017, according to the survey in [53].
Waste ComponentClassification Codes for Waste in EUAssumed (Mg·Year−1)% Mass in Wet Basis
Organic, biodegradable20 02 0123,797.3320.53
Non-combustible mixed waste20 03 01, 20 03 0785,701.5573.95
Minerals20 02 02; 20 02 031792.271.55
Textile20 01 112.630.00
Mixed construction and demolition debris17 01 07; 17 09 04587.700.51
Packaging fractions:
- glass15 01 073814.433.29
- multilayer packages15 01 06202.600.17
* Total 115,898.51100
* Information on waste composition received from Wrocław urban area.
Table 2. Meteorological parameters and geochemical data of ambient air samples gathered in the vicinity of the municipal waste landfill site during the campaign on 22 August 2017.
No SampleWind Direction [◦]Wind Velocity [m/s]Temperature [°C]RH [%]Pressure [hPa]CO2 [ppm]1/CO2 [ppm−1]δ13C(CO2) [‰]CH4 [ppm]1/CH4 [ppm−1]δ13C(CH4) [‰]
1 *2491.618.652.81005.2394.32.536−7.82.210.452−50.9
2 *2533.818.355.11005.4388.42.575−7.42.020.495−51.6
3 *2643.317.955.41005.7386.62.587−7.32.010.497−52.2
4 *2200.020.254.21005.5390.52.561−7.51.920.521−51.4
5 *2723.717.551.31005.9385.92.591−7.31.900.528−51.5
6 *2705.518.153.61006.2386.42.588−7.31.900.528−52.1
7 *2835.217.753.11006.4388.82.572−7.51.900.527−52.0
8 *3303.017.755.61006.2385.12.596−7.21.900.525−51.8
9 *2553.218.854.51006.4385.52.594−7.42.160.463−53.0
10 *2523.918.254.61006.5387.22.583−7.32.070.484−52.9
11 *3454.418.454.01006.2386.72.586−7.41.920.520−53.1
12 *2970.819.549.61006.2385.92.591−7.32.430.411−54.1
13 *3006.917.150.51006.5390.82.559−7.42.120.471−53.2
14 *2675.117.653.51006.5386.22.590−7.22.170.461−53.8
15 *248918.252.81006.2393.62.540−7.3129.480.008−57.9
16 *2642.419.654.11006.2392.42.548−7.518.850.053−56.9
17 *2853.720.252.61006.0390.12.564−7.64.490.223−56.3
18 *3052.219.152.81006.0391.02.558−7.44.710.212−57.7
19 *2406.918.948.81006.2386.72.586−7.12.370.421−53.8
20 *2744.119.349.61005.9392.82.546−7.51.920.522−52.2
21 *2761.719.249.21005.9390.82.559−7.42.410.415−54.4
22 *2862.619.850.31005.5390.52.561−7.33.030.331−55.9
23 *2733.318.950.61005.5384.92.598−7.41.890.528−52.1
24 *2734.018.547.91005.0384.92.598−7.22.010.499−52.5
25 *3003.319.948.81005.2389.92.565−7.43.040.329−55.7
26 *2595.018.447.41005.5388.22.576−7.31.900.525−51.6
27 *2030.518.455.61005.2396.42.523−7.62.500.400−54.0
28 *2483.518.756.21005.4406.42.461−8.411.480.087−56.2
29 *270.619.356.51005.0417.12.398−12.423.720.042−56.2
30 *1111.917.852.21004.7395.72.527−7.55.630.178−59.1
31 *2614.618.955.91005.0419.02.387−7.821.120.047−57.0
32 *2774.717.753.71006.5385.02.598−7.12.170.462−52.9
Min.270.017.147.41004.7384.92.387−12.41.890.008−59.1
Max.3456.920.256.51006.5419.02.598−7.1129.480.528−50.9
AVG2583.418.652.61005.8391.42.556−7.68.480.380−53.9
Median2693.418.653.01005.9389.32.569−7.42.170.461−53.2
SD571.70.82.60.58.20.0510.922.460.1712.2
* data from [60].
Table 3. Spearman’s rank correlation coefficient between analyzed parameters (n = 32). Statistically significant coefficients for p < 0.05 are bolded.
Wind Direction [°]Wind Velocity [m/s]Temperature [°C]RH [%]Pressure [hPa]CO2 [ppm]1/CO2 [ppm−1]δ13C(CO2) [‰]CH4 [ppm]1/CH4 [ppm−1]
Wind velocity [m/s]0.27
Temperature [°C]0.00−0.45
RH [%]−0.35−0.19−0.17
Pressure [hPa]0.380.42−0.36−0.01
CO2 [ppm]−0.40−0.350.300.24−0.45
1/CO2 [ppm−1]0.400.35−0.30−0.240.45−1.00
δ13C(CO2) [‰]0.290.39−0.37−0.310.48−0.800.80
CH4 [ppm]−0.27−0.420.390.17−0.250.67−0.67−0.41
1/CH4 [ppm−1]0.270.42−0.39−0.170.25−0.670.670.41−1.00
δ13C(CH4) [‰]0.030.24−0.33−0.030.10−0.520.520.28−0.880.88
Publisher’s Note: MDPI stays neutral with regard to jurisdictional claims in published maps and institutional affiliations.

