1. Introduction
Following the European Union’s (EU) 2030 targets [
1] and the need to reduce one of the main sources of air pollution, namely the transport sector [
2,
3,
4], many subsidy programs have been suggested to support electric vehicles (EVs) sales and construction of charging stations [
4]. The main benefit of promoting EVs and associated construction of charging stations is to reduce emissions produced by the transport sector, especially in urban areas with a high concentration of both cars and inhabitants [
5]. The operation of EVs directly meets this requirement, as they have zero local emissions [
6].
However, transforming internal combustion engine cars into EVs will not be sufficient to reach the climate neutrality goals without a fundamental change in the energy mix of individual countries towards a significant contribution from renewable energy sources [
1]. Achieving the emission reduction targets in the transport sector (and ultimately the climate neutrality objectives) will require both a transition from fossil fuel electricity generation [
7,
8,
9,
10] and, in line with the energy efficiency first principle [
11], also ideally increasing the efficiency of using recovered energy [
12].
The CO
2 emission targets for 2025 and 2030 are defined as a percentage reduction from the EU fleet-wide target in 2021, with a reduction of 37.5% in the passenger car sector and 31% in the van sector in 2030 [
1]. Several studies (e.g., [
10,
13,
14,
15]) have therefore focused on the use of renewable energy sources (RES) such as wind or solar power plants for EV charging in an effort to reduce the carbon footprint associated with a kilowatt-hour charged in an EV.
However, respecting the energy efficiency first principle, using energy that would otherwise be wasted is another good option [
2,
12,
16], but this has been much less explored so far [
2,
12,
16,
17,
18,
19,
20,
21].
Therefore, this paper takes this approach and focuses on reducing the CO
2 associated with each kilowatt-hour charged into an EV battery using the recuperative braking energy (RBE) from trains, which is generated while a moving train is slowing into a station [
2]. Using this energy for EV charging is another way to use it efficiently and not to waste it (usually converted to heat in onboard resistors/rheostats) [
2,
12,
16]. Additionally, the paper considers the use of RBE by varying the charging power of EV chargers without the necessary additional installation of an energy storage system.
The objective of this paper is to find out what the economic and environmental effects of using the recuperative braking energy (RBE) to charge electric vehicles (EV) are. We do so by defining the following research questions:
How efficiently (in terms of %) can a charging system installed in an existing car park near a train station use RBE and how successfully (in %) can RBE be used for charging EVs?
How will RBE reduce the amount of CO2 associated with kWh charged into an EV, especially with respect to the Czech Republic’s energy mix?
How can a charging system using RBE achieve the price per kWh that users with private garages and chargers enjoy?
2. State of the Art
Many car manufacturers have already responded to the EV demands and supported the shift from internal combustion engine cars to EVs with their strategy [
22]. However, despite subsidies for the purchase of EVs [
23], which vary from one EU country to another [
24], there has not been a significant change in the fleet towards EVs [
25,
26].
There are several reasons why users do not choose EVs, but the three main reasons are as follows: (i) high purchase price, (ii) users’ concerns about the short range of EVs, and (iii) users’ concerns about the uncertainty of recharging an EV before the next trip [
4,
24,
27,
28].
The price of an EV is still high for a wide group of users, as has been confirmed by Xu et al. [
27], who, among other things, considered the ratio between the percentage of registered EVs of California car owners and their annual salary level. The study states that 45% of car owners with an annual salary above the USD 150,000 threshold have a registered EV, but only 15% of car owners whose annual salary does not exceed this threshold have a registered EV. Although the purchase price of EVs is still higher than that of internal combustion engine cars in the same category [
29], the costs of EVs can be expected to fall in the future [
2,
30]. This expectation is also reflected in the current trend of falling prices of batteries [
2], one of the most expensive components of EVs [
6]. If we compare the price of a battery between 2010 and 2020, we see that the price has fallen by 89%, and in 2020 the price reached USD 100 per kWh of battery capacity [
31].
The second important issue for potential EV users is the short mileage range of EVs due to the small capacity of the installed batteries [
32]. Studies [
27,
32,
33] report that the average daily distance travelled by a user living in Beijing, California, and the Czech Republic is no more than 50 km. Taking into account all currently available battery EV models, with an average installed battery capacity of 60 kWh [
34] and average energy consumption of about 20 kWh/100 km [
35], the mileage range of the EV on one charge can belittle this concern. In fact, these users with an average daily mileage of no more than 50 km get an opportunity to travel for up to six days without recharging.
The third important issue for many respondents is the charging of EVs and the question of a dense network of charging stations [
4,
24,
27,
28,
33,
36]. In other words, the reason for not deciding to buy an EV is often the absence of a private garage or parking space equipped with a charging station that would enable the user to recharge the battery before the next journey.
One of the aims of this article is to contribute to the solution of the third issue. The solution for these EV customers who do not have their own charger-equipped parking space could be a dense network of strategically located public charging stations or the possibility of sharing or reserving either public or private chargers [
32,
37,
38,
39]. Unfortunately, building a dense network of public charging stations would require breaking the vicious circle [
7]. The reason for the small number of charging stations is that many investors are still reluctant to build more charging stations because the number of EVs in operation is below the level the investors economically require [
7,
23]. However, sharing charging stations can be a solution.
Nevertheless, sharing of private charging stations, similar to the construction of new public ones, also has its limitations. Shared private charging stations can be divided into two categories. The first category is sharing chargers by individual EV owners who have a charger located in a private garage or parking space. The advantage of this type of sharing can be seen in many charging points being randomly distributed in the city [
32,
37]. The disadvantage is the owner’s responsibility for the charging station provided [
32]. However, a significant disadvantage of this sharing is the probability of a charging requirement overlap between the owner and the potential customer in the afternoons and evenings [
33,
40]. The second sharing category, to which the present paper also contributes, is constituted by sharing a larger number of charging stations in car parks, such as company car parks, car parks near hospitals, schools and shopping centers, or even car parks on the outskirts of cities [
33]. These car parks are mostly used between 7 a.m. and 7 p.m. and minimally outside this time span [
41]. Therefore, the benefit of these car parks, such as the large capacity of parking spaces with chargers and lower occupancy in the evenings, diminishes the number of refused charges, mostly in the desirable evening hours [
27,
42,
43]. Selecting a suitable place for the construction of a charging point, optimizing the number and power of chargers, and using renewable energy resources are therefore critical [
2,
6,
7,
17,
33,
38,
40,
44].
Concerning dimensioning both the power and the number of chargers in relation to the installation place and charging requirements, Dvořáček et al. [
33] conclude that a higher number of chargers is for city centers and suburban areas a higher priority than high power when building charging stations. Based on the analysis of charging requirements [
45], users leave EVs parked and connected to chargers located in urban areas for a longer time than required to recharge the battery. This can be demonstrated by the fact that it was possible to charge the battery of an EV with a lower-power 3.6 kW charger during the same parking time [
33].
However, this statement should not be applied to dimensioning a charging point for specific groups such as electric taxi drivers [
46]. The same rules for dimensioning charging points along highways and other expressways apply to these groups with specific charging requirements. In these cases, high charging power and consequently short charging times are a priority [
47].
Besides optimization of the number and power of charging stations, there are other criteria such as (i) good access from the viewpoint of transport infrastructure [
39], (ii) installation near more attractive points of interest (POI) [
39], and (iii) focusing on the capacity of the site’s electrical connection to the distribution system and the stability of the local distribution system [
7,
10,
27,
40,
48].
The stability of local electricity distribution grids (EDG) by supplementing energy storage systems (ESS) or a new source of renewable energy was addressed in [
49,
50,
51,
52,
53,
54]. Both the ESS and the new energy source should be built as close as possible to the EV charging point [
55]. Due to the nearby installation, there are no frequently long-distance energy transmissions that would overload the grid and also contribute to energy transmission losses [
10,
53]. In addition, the benefits of ESS include smoothing of peaks in the consumption pattern and accumulation of energy produced from RES that is not directly consumed [
54].
Similarly to the EDG, power peaks also occur in the train power system and threaten its stability. There are generally two types of catenary conductor feeding compared to the distribution network: DC and AC power supply, while the power feeding system is still not united [
56]. For instance, in the Czech Republic, the catenary conductors in the southern part of the country are fed by AC, and DC still feeds the northern part [
57]. However, a change towards AC power technology is a trend bringing the advantage of DC for powering an extended segment of the catenary conductor from a single feeder due to lower transmission losses over longer distances [
56]. The AC-powered catenary conductors can thus be 40 km to 60 km long [
58]. These segments can be fed by a reversible substation from one side or both sides. The advantage of these reversible substations is the possibility of transferring the unconsumed RBE back to the EGD [
16]. The disadvantage of transferring the recuperated energy via reversible substations back to the EGD is the possible instability of the grid and the generation of AC harmonics [
16]. One of the limitations on effective RBE use is the impossibility of transferring this energy between neighboring segments without additional modern technologies [
18,
19]. Therefore, it is advantageous to consume the RBE directly in the given segment. According to the benefits of AC compared to DC, we will focus in our article only on AC power systems and RBE consumption directly in the given railway segment with the reversible substation.
The research gap to which this article responds is the construction of charging points for EVs in car parks near train stations, with efficient use of existing catenary conductor networks [
2]. Furthermore, in order to achieve more efficient use of these charging stations, reservation of charging stations at night is used [
33]. In consideration of occupancy profiles of these car parks near train stations [
41], evening reservations for EV charging are directly offered. After all, these car parks are mainly occupied throughout the day [
41], when they are used by people arriving by car and travelling on by train [
59]. In the evenings, these car parks are often unused [
41] and can be offered to returning users who live in the area around the train station and do not have their own private charger.
The high power levels of catenary conductor networks and their stability [
12,
16,
58,
60], as well as the location of train stations, typically in city centers [
59], directly offer this opportunity for building EV charging points. Furthermore, the construction of charging sites for EVs near train stations connected to the catenary conductor networks offers the possibility of using recuperative braking energy (RBE) of trains [
2]. The RBE is generated while a moving train is slowing into a station and can charge EVs. Since there are no CO
2 emissions from the generation of RBE, by consuming and efficiently using this energy, the amount of CO
2 associated with the need for each kilowatt-hour of energy is reduced significantly. Moreover, the contribution of this recovered energy to the charging of EVs helps reduce emissions by substituting some of the electricity required from the distribution grid [
12].
However, RBE is very often not used effectively on many segments of railway lines. On railway segments equipped with neither ESS nor a power system with the facility to transfer RBE back to the EGD, RBE is wasted by conversion to heat in the train onboard resistors (rheostats) [
2,
12,
16]. Fernández-Rodríguez et al. [
2] showed that the inefficiently used RBE on a selected Italian train line was up to 15 MW per day (roughly 10% of all daily RBE). On a selected Spanish railway line, the daily inefficiently used RBE was 10.28 MWh (roughly 13% of all daily RBE). Fernández-Rodríguez et al. [
2] further reported that the maximum inefficient use of RBE on the railway lines was observed, particularly when the time intervals between trains were long. In the peak periods during the day, when the time intervals between trainsets were short, and hence RBE consumers were numerous, up to 98% of RBE was used efficiently [
2].
Effective use of train RBE has also been the subject of other studies [
2,
12,
16,
17,
18,
19,
20,
21]. The studies can be divided into three categories. The first one wants to transfer the recovered energy from one separately fed railway segment to neighboring segments at the same time [
18,
19]. This transferred energy will replace part of the electricity consumed by starting or accelerating trains on the other segments, thereby reducing the electricity consumed from the EDG and, consequently, carbon emissions [
12]. The second group of studies [
2,
16,
60] focuses both on storing the RBE in ESSs and on schedule optimization to achieve the lowest electricity consumption from the grid while efficiently using the RBE. These ESSs also contribute to smoothing out any power fluctuations in the catenary conductor networks and thus ensure the stability of the traction power system. The ESSs typically used to accumulate RBE are capacitors, which have better charge and discharge rates, durability and life cycles than batteries [
16]. The third group of studies [
2,
17,
58] focuses on the possibility of using RBE stored in battery storage systems to charge EVs.
Our proposed solution and the developed model approaches EVs charging with the same objective to efficiently use the RBE as in the studies mentioned above, but with no need to install an ESS, which would significantly increase the initial investment in the whole system.
3. Model of EV Charging Site Using RBE
From the viewpoint of the EV user, car parks near train stations are among the most sought-after points of interest (POIs) and thus a place with a high population density [
61]. In terms of charging time for EVs, charging stations at train station car parks bring users the benefit of effective use of the long parking time when an EV is unused, and charging it thus contributes to increased user comfort. Building charging stations at such locations is therefore of great importance. Therefore, our model considers constructing a charging point at a strategically located car park at a train station where the battery capacities of the individual EVs being charged directly replace the ESS capacity. The recuperated energy thus supplies a significant part of the energy absorbed by the EV batteries, but simultaneously, the electricity available from the railway line power is also used for charging.
3.1. Scheme of EV Charging Site with Variable Charging Power Function
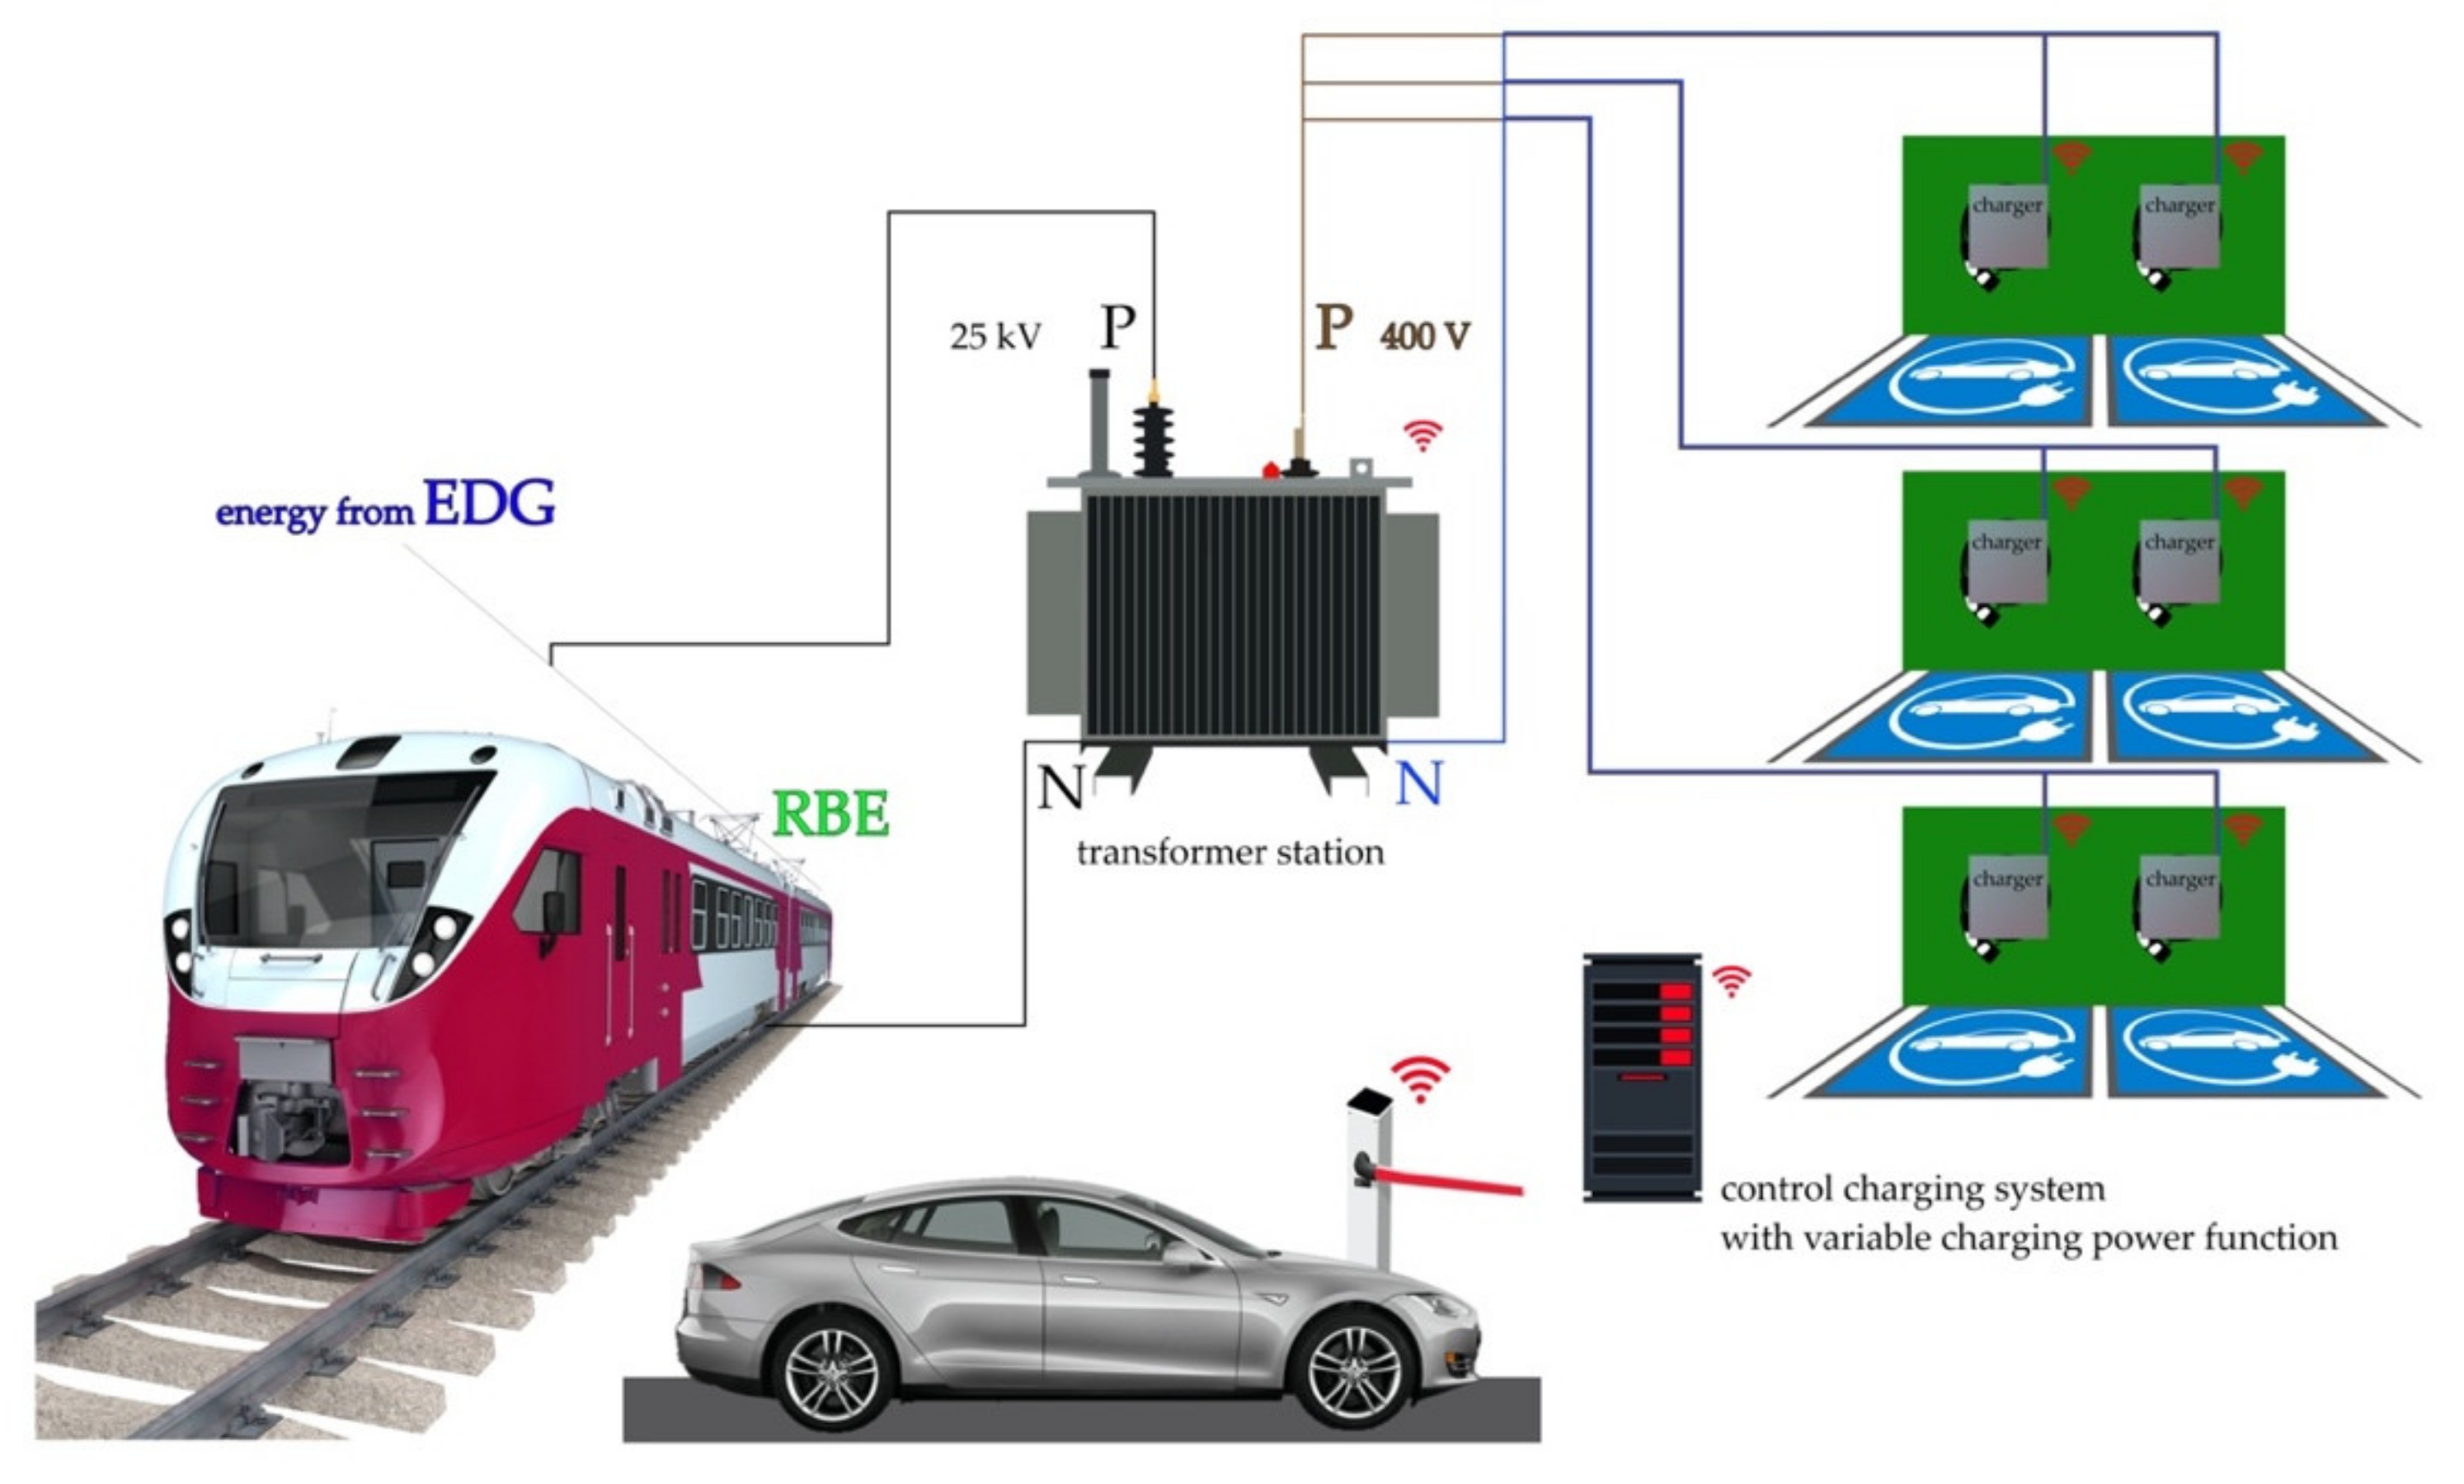
In addition to more efficient use of charging stations through user reservations in the evenings, the model considered uses the variable charging power function of charging stations. Due to charging power variation, the model is able to better respond to fluctuations in the RBE and thus uses this energy with more efficiency for charging EVs. The charging power level is adjusted based on the number of simultaneously charging EVs and the amount of predicted RBE at the same time (
Figure 1).
In the model, individual parking lots are equipped with single-phase AC charging stations with a power ranging from 3.6 to 7.4 kW. We chose these types of charging stations based on testing results provided by the company ŠKO-ENERGO [
45]. Their results confirmed that the variation in charging power with the AC type and the given power range is not blocked by the EV onboard system. AC charging stations with charging power up to 11 kW could also be used for charging, but the standard three-phase design limits their implementation. To achieve 11 kW AC charging power would require modifications to charging station manufacturing and production of an AC charging station that would achieve this power on one phase with a 50 A current [
62]. In terms of current limits, chargers taking 50 A do not affect train power systems operating at tens of kiloamperes, unlike the EDG.
When considering the use of a DC charging station with a power exceeding 50 kW, we are confronted with the problem of the choice of the charging power level, which is set by the EV onboard charging system in this case according to the OCPP standard [
63]. The maximum charging power value is adjusted depending on the type of battery cells used, their actual temperature and life cycle [
63]. The charging station’s request for an increase in charging power would thus not be accepted.
3.2. Model Input Parameters
The input parameters for a model car park equipped with low-power chargers fed by a railway line power system with the benefit of using RBE are as follows:
Maximum number of parking places in the car park assumed (QPL);
EV arrivals on weekdays;
Data describing demand for electricity by arriving EV users;
Data describing fluctuation of recuperative braking energy (RBE) in the railway line segment.
The model of charging infrastructure for a car park near a train station consists of a 25 kV/400 V single-phase AC transformer station (TS), a switch disconnector and isolator, a circuit breaker, a fuse, cabling, a charging control system and chargers.
The model considers the following aspects: The charging issue is always related to the maximum load of a single-phase transformer, where model input parameters such as a fixed number of chargers (n) and the maximum power level of the charging station used (p) define the required transformer power (PCH). The nominal apparent power (Sn) of a suitable transformer depends on the power factor (cos φ).
This dimensioning of the transformer power is very important due to the variable charging power function used. For efficient use of RBE, the charging power of the chargers is adjusted to ensure that the energy generated by RBE is fully exploited.
3.3. Variable Charging Power Function
The charger and the EV communicate using the OCCP protocol from the start of the charging process [
64]. During this communication, the charging station gets information about the specific parameters of the connected EV and the amount of energy needed to fully charge its battery [
64]. These charging processes are primarily beneficial for the EV’s battery life, where the battery temperature stays at optimal levels. Consequently, the batteries are ready to increase the charging power. A further benefit brought by continuous EV charging consists in keeping the electricity consumption of the train charging system free of significant fluctuations in its load.
The issue of charging power variation is divided into three scenarios in the model which differ by the number of charging EVs and the amount of RBE. However, the same basic charging power of the AC chargers, which does not decrease below the minimum power level of the charger is used for all scenarios.
The first scenario describes a situation where RBE is zero, and the basic power of AC chargers is used to charge all EVs.
The second charging scenario describes a situation where RBE becomes higher than zero but does not exceed the energy consumed by EVs charged by the basic power of AC chargers. In this scenario, the RBE replaces part of the energy that would have to be supplied from the EDG to the train power system and then consumed by the chargers.
The third scenario describes a situation in which RBE becomes higher than zero and simultaneously exceeds the energy consumption by EVs charged by the basic power of AC chargers. In this case, the model sets the required power increase for all used chargers within the range limited by their maximum charging power to use the RBE efficiently.
Furthermore, there are variations in the chargers’ charging power in the specific case where RBE is higher than zero, and at the same time, there are cars in the group of charging EVs with a demand for energy that the charger can supply when using the maximum charging power. In this case, RBE is used preferentially to recharge these cars.
3.4. Description of Users
A fundamental issue in setting up a model car park located near a train station equipped with chargers is to dimension and adapt its equipment to the requirements of individual groups of EV users. Generally, car park users can be divided into two main groups. The first group consists of EV users who commute to a car park near a train station to continue to work or other destinations by train. The second group consists of users (residents) who live close to the train station and rent a parking space mainly for charging in the evenings. As far as residents are concerned, the reservation of a parking space equipped with a charger offers them a similar convenience as to people living in family houses who have their own garage or private parking space equipped with a charger.
Our model assumes that the first group of EV users (nonresidents) use the car park in the daytime when, especially in the morning at (X) o’clock, they leave their EVs in the car park and use the train service to continue their journey. Nonresident EVs are thus parked and can be charged until the nonresidents return from work or other journeys at (Y) o’clock. Therefore, nonresident users’ priority is parking rather than charging, which is not mandatory for them. Before parking, each nonresident user chooses whether he/she wants to charge his/her EV. After leaving the parking place, the user pays an appropriate hourly parking rate and the energy bill. Since the train station car park is not primarily intended as a public charging site, nonresidents are not guaranteed fully charged batteries. Parking only increases the energy level in the EV; the problem of full recharging is solved by home charging or by other means.
For the second group (residents), the car park model offers the possibility of renting parking places with a charger during evening hours. If the residents arrive no later than at the set evening time (TSCH), they are guaranteed minimum charging power for the entire parking time and the appropriate amount of energy (ChR). Therefore, the rules for the resident group require a different setting. It is assumed that residents want to rent a parking place due to the absence of private charging points and the guaranteed battery charge before the next trip.
Compared to nonresidents, residents are financially motivated to use the car park to charge their EVs. The proposed principle to encourage residents to charge their EVs is to introduce a minimum flat rate for residential parking. Under the flat fee, residents are guaranteed energy recharge regardless of actual usage. Charging beyond the guaranteed energy recharge is then calculated per kWh. The flat rate will ensure a reduction in the risk of non-covered fixed costs (NCFC) due to blocking cars with little need for charging. Another source of risk is the mutual blocking of users; this issue is addressed in the following section.
3.5. Blocking Issues
To completely prevent charger blocking, additional installation of chargers in each parking place is assumed. Moreover, the model sets a maximum number of reserved parking spaces for residents to avoid blocking between the nonresident and resident groups. The limiting factor for determining the number of resident parking spaces in a car park is the number of spaces available at (X) am or (Y) pm, with a probability exceeding 90%. Then the number of resident spaces is defined by choosing a smaller number when comparing the available parking spaces at (X) o’clock in the morning or (Y) o’clock in the evening.
The smaller number of resident parking spaces than the number of nonresident ones and the ability to reserve resident memberships for a specific day mostly solve a potential problem of mutual parking space blocking. Besides, the model allows residents to reserve membership in a parking group rather than a specific parking space to avoid a resident parking space being blocked by a nonresident’s delayed departure.
Since the primary purpose of a car park located near a train station is to provide parking space for nonresident users who leave their EVs in the car park and use the train service to continue their journey, it is necessary to consider possible blocking by residents using the car park overnight. Therefore, residents who choose not to leave before (
X) am are charged a special daytime rate. The minimum rate per each blocking hour (
Rresident) is set as the product of the NCFC per unsold kWh (
LP_kWh_nonresident) and the average nonresident charging power (
PACH_nonresident).
otherwise, if a nonresident decides not to leave and blocks a resident after (
Y) pm, the special nighttime rate is charged. The minimum rate per each blocking hour (
Rnonresident) is set as the product of the NCFC per unsold kWh (
LP_kWh_resident) and the average resident charging power (
PACH_resident).
4. Economic Aspects of Proposed Model
Besides the technical aspects, economic factors must also be taken into account when constructing charging infrastructure in an existing car park near a train station. One of the key issues is the competitiveness of the project compared to other charging methods, such as public charging stations as well as home charging with private chargers. We assume that the main priority of the model is to maximize the use of RBE in order to reduce the amount of energy purchased from the EDG. Reducing the amount of energy purchased from the EDG using RBE reduces the cost per kilowatt-hour for both residents and nonresidents. The minimum price per kilowatt-hour sold is then compared with both the kilowatt-hour prices of charging at competitive public chargers and the prices users pay when charging at home.
In order to assess the economic effectiveness, the model uses the levelized costs of electricity (LCOE) to recalculate individual capital expenditures (CAPEX) with different lifetimes and operating expenses (OPEX) converted to a unit price per kWh. The CAPEX include a HV/LV single-phase transformer, switch disconnectors and isolators, circuit breakers, fuses, cabling, installation material, chargers, connection fees, installation work and a charging control system. The OPEX are generally divided into two items, the first one consisting of maintenance and the second one associated with electricity consumption.
Since the TS is responsible for significant losses, the following empirical formula given by the standard CSN 341610 is used for the estimation of annual losses in the TS.
where
TL is the annual time of full transformer losses,
Tm is the utility factor, and
T0 is the annual operating time of the TS.
where
WL is the annual energy losses in the transformer,
Pnl is the power transformer no-load loss,
T0 is the annual operating time of the TS,
Pkn is the short-circuit transformer losses,
Sm is the maximum apparent-power load of the transformer,
S is the apparent power of the TS, and
TL is the time equivalent of losses at the maximum load of the transformer per year.
These transformer losses affect both the energy supplied from the EDG and the RBE energy generated by braking trains. The losses caused by the transformation decrease the efficiency of the RBE energy use and consequently have an impact on both the price of a kilowatt-hour charged to EVs as well as the increase in CO2 emissions associated with it.
The objective of the economic evaluation of the model is to determine the levelized costs of electricity (
LCOE) for both nonresident and resident charging groups.
where the variable
Ni denotes an initial investment in the equipment;
M denotes the annual maintenance expenditures, and
NE is the electricity bill in the year
ty,
r is the discount rate,
TLT is lifetime, and
E denotes electricity sold in the year
ty [kWh].
5. Case Study
The following chapter deals with an application of the model to real data. The chapter consists of four subchapters. The first two present and analyze the real data entering the model. They are followed by a technical evaluation of the case study data (the third subchapter) and an economic evaluation (the fourth subchapter).
5.1. Car Park Description
Data from a car park located at the Praha Holešovice train station with 64 parking spaces were selected for the survey. The data capture the car park occupancy in five-minute intervals from 2013 to 2018. The car park occupancy data do not include data for holidays and public holidays, which would significantly alter occupancy information for the days in question. The parking data do not include any private residents.
For further processing, information about the car park occupancy in five-minute intervals was divided into weekdays (from Monday to Friday) and weekends (Saturday and Sunday). The average weekday and weekend occupancy levels were calculated for each five-minute interval based on this six-year study.
Subsequently, a comprehensive data analysis was performed to identify significant differences in car park occupancy between weekdays (Monday to Friday) and weekends.
The analysis of weekdays shows that user behavior is almost identical on weekdays. Conversely, significant differences were observed when comparing the behavior of users on weekdays and weekends, especially in the full occupancy interval of the car park. On weekdays, the car park was almost full between 6 a.m. and 2 p.m., while its occupancy reached a maximum between 1 and 3 p.m. during the weekends. Assuming a daily occupancy of the car park from
X = 6 a.m. to
Y = 7 p.m., the rate of deviation (the ratio of the standard deviation occupancy to the average occupancy) between individual working days does not exceed 13% (
Figure 2).
Considering a daily occupancy of the car park from
X = 6 a.m. to
Y = 7 p.m., the rate of deviation (the ratio of the standard deviation occupancy to the average occupancy) between the reference years 2013 to 2018 is less than 15% (
Figure 3).
The disadvantage of the data used to characterize the car park occupancy is that the data do not track the arrivals and departures of individual cars at five-minute intervals but only reflect car park occupancy. Thus, at five-minute intervals, when the number of departing cars equals the number of arriving ones, the car park occupancy tracking shows zero change and consequently introduces inaccuracies into our modelling. Therefore, the model tries to approximate the parking occupancy curve by generating vehicle arrivals and their parking times to achieve the real occupancy of the Praha Holešovice station car park. The departure time was modelled using a Gaussian distribution with a mean and a standard deviation described in the following paragraph.
The purpose of the train station car park and requirements of its users during the day had to be taken into account in the modelling. It is assumed that users (nonresidents) arriving at the car park before 9 a.m. use it for all-day parking until they return from work or other journeys. Therefore, for nonresidents arriving before 9 a.m., a Gaussian function with a 6-h mean and a standard deviation of 3 h was used for parking time modelling. A Gaussian function with a 2-h mean and a standard deviation of 1 h was used to model the parking time of users (nonresidents) who used the car park after 9 a.m..
The data obtained from the charging stations operated by PRE [
65] (Prague, Czech Republic) were used to simulate the demand for recharging of EVs. During the one-year measuring from November 2019 to November 2020, data on 3000 charging iterations from various types of EVs were obtained.
The charging data were obtained from seventy-seven charging points, each equipped with a 22 kW DC power charger. At eleven of these seventy-seven charging points, it was also possible to use a 50 kW DC charger. Six of the seventy-seven charging points were equipped with 75 kW DC chargers. The most powerful supercharger with 150 kW DC was installed only in two of the seventy-seven charging points.
A more in-depth analysis of the data provided information about the time spent in the car park and the time required for sufficient charging (
Figure 4). The analysis shows that users left their EVs parked and connected to the charger for periods longer than needed to recharge the batteries. This can also be demonstrated by the fact that it is possible to recharge the required energy to fully charge the EVs’ batteries by using a charger with a lower power over the same parking time. The only exception was for charging iterations shorter than 30 min, where the results of the analysis were affected by the 150 kW supercharger. During these charging iterations, the EV batteries were supplied by energy for which a 3.6 kW charger would take almost twice as long.
Figure 4 shows that users park longer than necessary to recharge the battery to the full capacity after less than 30-min charging iterations, and therefore, they unnecessarily block the possibility of recharging other EVs.
Figure 4 and
Figure 5 show that more than 80% of the car users analyzed could have done with a shorter charging time to recharge the required energy or using a 3.6 kW AC charger to achieve the same recharging level in the same amount of parking time.
The EV charging sample also offers a valuable outline of the demand for electricity recharging. The data obtained from 3000 charging iterations were sorted based on the energy consumed and subsequently used to calculate the cumulative distribution function (CDF).
The most frequent groups (12%) are EVs with a charging requirement of 6 kWh and 7 kWh, followed by a group of EVs (11%) with a charging requirement of 9 kWh. The charging requirements show that 90% of arriving EVs require less than 13 kWh to recharge, corresponding to approximately 4 h of recharging with a 3.6 kWh charger (see
Figure 6).
Data capturing the RBE overflows on the busiest train line between Prague and Brno were used for the simulation [
66]. The RBE overflow data were captured at five-minute intervals during the yearly monitoring at the feeder, which is the connection between the EDG and the train power system.
For further processing, the average levels were calculated for each five-minute interval based on annual monitoring of RBE overflows on weekdays.
The data capturing RBE during weekends were not available for the busiest train line between Prague and Brno. The absence of the weekend RBE data from this train line is also the reason why the case study focuses, in the following, on simulating both the car park operation and the recuperated energy consumption only for weekdays.
5.2. Analysis of Input Users’ Data
The case study considers the integration of charging infrastructure into an existing car park near the Praha Holešovice train station with 64 parking spaces (QPL) in Prague. The input data vector describing the car park occupancy during one day was composed of 288 five-minute intervals. The analysis of the real data showed that with more than 90% probability, 20 parking spaces are available in the car park on weekdays at 6 a.m. and 27 parking spaces at 7 p.m.. Therefore, 20 parking spaces (QR) can be reserved from Y = 7 p.m. to X = 6 a.m. for residents out of the total capacity of 64 parking spaces (QPL).
The number of nonresidents in the car park at a given five-minute interval (
t) is estimated by using a Gaussian distribution function. The mean and the standard deviation of the Gaussian distribution (
A(
t)) were obtained from the input occupancy data on weekdays in a given five-minute interval (
t).
Similarly, the time spent by a nonresident in a parking lot is estimated by using a Gaussian distribution function where the mean and the standard deviation depend on the occupancy time interval. For nonresidents arriving at the car park before 9 a.m., a 6-h mean and a standard deviation of 3 h were used for parking time modelling. A Gaussian function with a 2-h mean and a standard deviation of 1 h was used to model the parking time of users (nonresidents) who used the car park after 9 a.m.. The median value of 8 h and a standard deviation of 30 min were used to model the time spent by a resident in a parking lot. The departure time of residents is around 6 a.m..
The parking requirements are described as follows:
where for nonresidents arriving in the car park at the time
t:
6 a.m. < t < 9 a.m.∶ µL = 6 h, σL = 3 h
t > 9 a.m.∶ µL = 2 h, σL = 1 h
and residents arriving in the car park at the time t:
The nonresidents’ charging requirement (
EN(
x)) assumed a distribution function, which correlates with real requirements obtained from charging stations of PRE [
65] (Prague, Czech Republic) during the annual measuring.
The charging requirements are described as follows:
Since no data were obtained describing evening arrivals and morning departures of residents living close to the considered car park at Praha Holešovice station, the case study models only the charging requirement of the residents’ group. The charging demands are obtained from the study results [
67] focused on the PDF of the daily distance driven by a car (
Figure 7). We obtain information about the required energy charge (
ER) by dividing the daily distance driven by cars by the average EV consumption of 20 kWh per one hundred kilometers [
35].
The reason for adjusting the residents’ charging requirements is that the parking cost increased by the guaranteed amount of energy (ChR) is too high for users with a lower charging demand. The increase motivates residents to use the car park for evening parking as well as charging when they really need to recharge their EVs battery. Residents with a requirement to charge a small amount of energy (units of kilowatt-hours) are able to recharge their EV at public charging points during their journey in a short time and without significant inconvenience.
When focusing on the time required to fully charge a residents’ EV battery, it is necessary to consider the energy losses incurred during the charging process. Depending on the charging station power, 10 to 25% of the energy is converted into heat. However, it can be assumed that charging with a low-power AC charger in the range from 1.38 kW to 7.4 kW results in losses close to 10%.
The minimum charging current required to ensure a charging process without interruption is set to 6A according to the standard CSN EN IEC 61851. This corresponds to a charging power of 1.38 kW when considering a single-phase charger. Concerning this standard, the minimum charging power for residential charging is set at 1.38 kW in the case study. This reduction in the minimum charging power from 3.6 kW to 1.38 kW ensures that the resident charging process is kept as long as possible during parking. Due to the charging of twenty resident EVs, the power flexibility of the system ranges from 27.6 kW to 148 kW. Thanks to the low charging power level, the system also has sufficient available capacity in the batteries of the charged EVs, and therefore, it can efficiently respond to RBE peaks, especially in the morning hours. Then a simple increase in the power of the charging stations is sufficient to use RBE efficiently since all EVs are ready to consume the supplied energy immediately during continuous charging until their batteries are fully charged.
From the residents’ charging point of view, shifting the start of their charging depends on the effective use of RBE by charging nonresident vehicles. Although residents can arrive at the car park starting at 7 pm, the charging process for them does not start until the nonresident consumption falls below the RBE level. Considering the input data of this case study, resident charging starts at around 8:30 in the evening. From this moment, the charging process is initiated at each resident EV successively. It continues without interruption until all cars are fully charged or leave around 6 o’clock in the morning of the following day. In addition, resident departures are considered to have a Gaussian distribution, where the mean value equals 6 h, and the standard deviation is 30 min.
Since the minimum charging power of the charger in the resident mode is 1.38 kW and the resident parking time is roughly 9 h, the guaranteed amount of energy (
ChR) is set to 12 kWh. Furthermore, this amount of energy will cover the users’ 60 km daily driving range with an assumed average consumption of 20 kWh/100 km [
35]. Besides Pareschi’s study, other studies focusing on the daily range of users [
27,
32,
33] have confirmed that the range does not exceed 50 km. Therefore, the 12 kWh guaranteed amount of energy should be entirely sufficient concerning the average daily mileage.
5.3. Technical Aspects of System Dimensioning
The capacity of the single-phase transformer is dimensioned with regard to both the number and the maximum power of the chargers considered. This dimensioning ensures that the transformer parameters do not limit the possibility of increasing charging power at all chargers to their maximum in case of a large increase in RBE. It is important to mention that due to the number of EVs charged and the level of RBE, it would be sufficient to install a single-phase transformer with a lower capacity. However, in the dimensioning of the transformer capacity in this case study, the possibility of using the full power potential of the charging stations, and thus full RBE utilization, while avoiding unwanted overflows of this energy back into the EDG is a higher priority for us.
For the installation of the charging system at the Praha Holešovice station car park, the case study considers equipping all 64 parking spaces (
n) with a 7.4 kW maximum charging power (
p); thus, a single-phase 25/0.4 kV transformer with a capacity (
Sn) of 500 kVA must be installed for the connection to the 25 kV catenary.
Furthermore, a parking management system is considered which directs residents arriving especially in the evenings to charging stations available at which the resident charging mode with a basic charging power of 1.38 kW is activated. In terms of charging issues for both user groups, the case study assumes that all nonresidents require both parking and charging of EVs.
5.4. Economic Analysis of Case Study
The previous chapter has shown that the use of RBE for EV charging is technically feasible, and almost all the energy from RBE can be used for EV charging. Since RBE is considered to be carbon-free, the total CO2 emissions per EV recharge are reduced as well.
From the economic point of view, it is necessary to include the financial parameters of the model and verify the competitiveness of the price for the charging and parking with respect to conventional charging. Finally, the minimum consumer price per kWh will be defined by the levelized costs of electricity (LCOE) for the nonresident and resident groups.
Here, the variable Ni denotes the initial investment in the equipment; M denotes the annual maintenance expenditures and NE is the electricity bill in the year tY. Providing that the values do not change from one year to another, the variables CA and Fty can be set. CA indicates the annualized costs for the corresponding discount rate r, and Fty denotes the annual electricity bill. E represents annual electricity sold (kWh).
The key issue is to correctly set the ratio of the CAPEX division between nonresidents and residents. The case study presents the range of recharging costs depending on how CAPEX (
Table 1) are distributed among users.
The costs associated with the electricity consumption (OPEX) differ from a standard connection to the EDG since the charging system in the car park is connected to the train power system. The OPEX are shown in
Table 2 and
Table 3.
Table 3 shows the fixed operating costs related to transformer maintenance and overhauls as well as the annual energy losses incurred.
Compared to a standard connection to the EDG, the connection to the train system does not include a fee for reserved power. The price per kilowatt-hour consumed from the train power system consists of the catenary transmission fee, the price of energy, system services and renewable energy sources (RES) and the electricity tax. The unit cost of purchasing electricity from the train power system is shown in
Table 2. The unit price per kilowatt-hour taken from the train power system is EUR 4.15 without VAT. Since no financial revenue is provided for the train power system operator for RBE overflows back to the EDG, the model also assumes a zero cost for each kWh from RBE.
Since the weekend RBE data are not available, only weekday car park operations were considered. The calculation of annual transformer losses (empirical formula given by the standard CSN 341610) corresponds to the weekday car park operation, where transformer operation and losses are considered only in 250 days of the year.
6. Results
The following chapter presents the results of the model applied to the real data obtained from the car park near Praha Holešovice train station, the data capturing the RBE overflows on the busiest train line (between Prague and Brno) and users’ charging needs from the PRE charging station data. The percentages of RBEs in both resident and nonresident recharge requirements are presented. Consequently, the use of RBEs is also associated with reducing the amount of CO2 emissions that would have been generated by supplying electricity from the EDG to cover the charging requirements, and last but not least, the levelized costs of electricity values are also presented to show the competitiveness of the charging points.
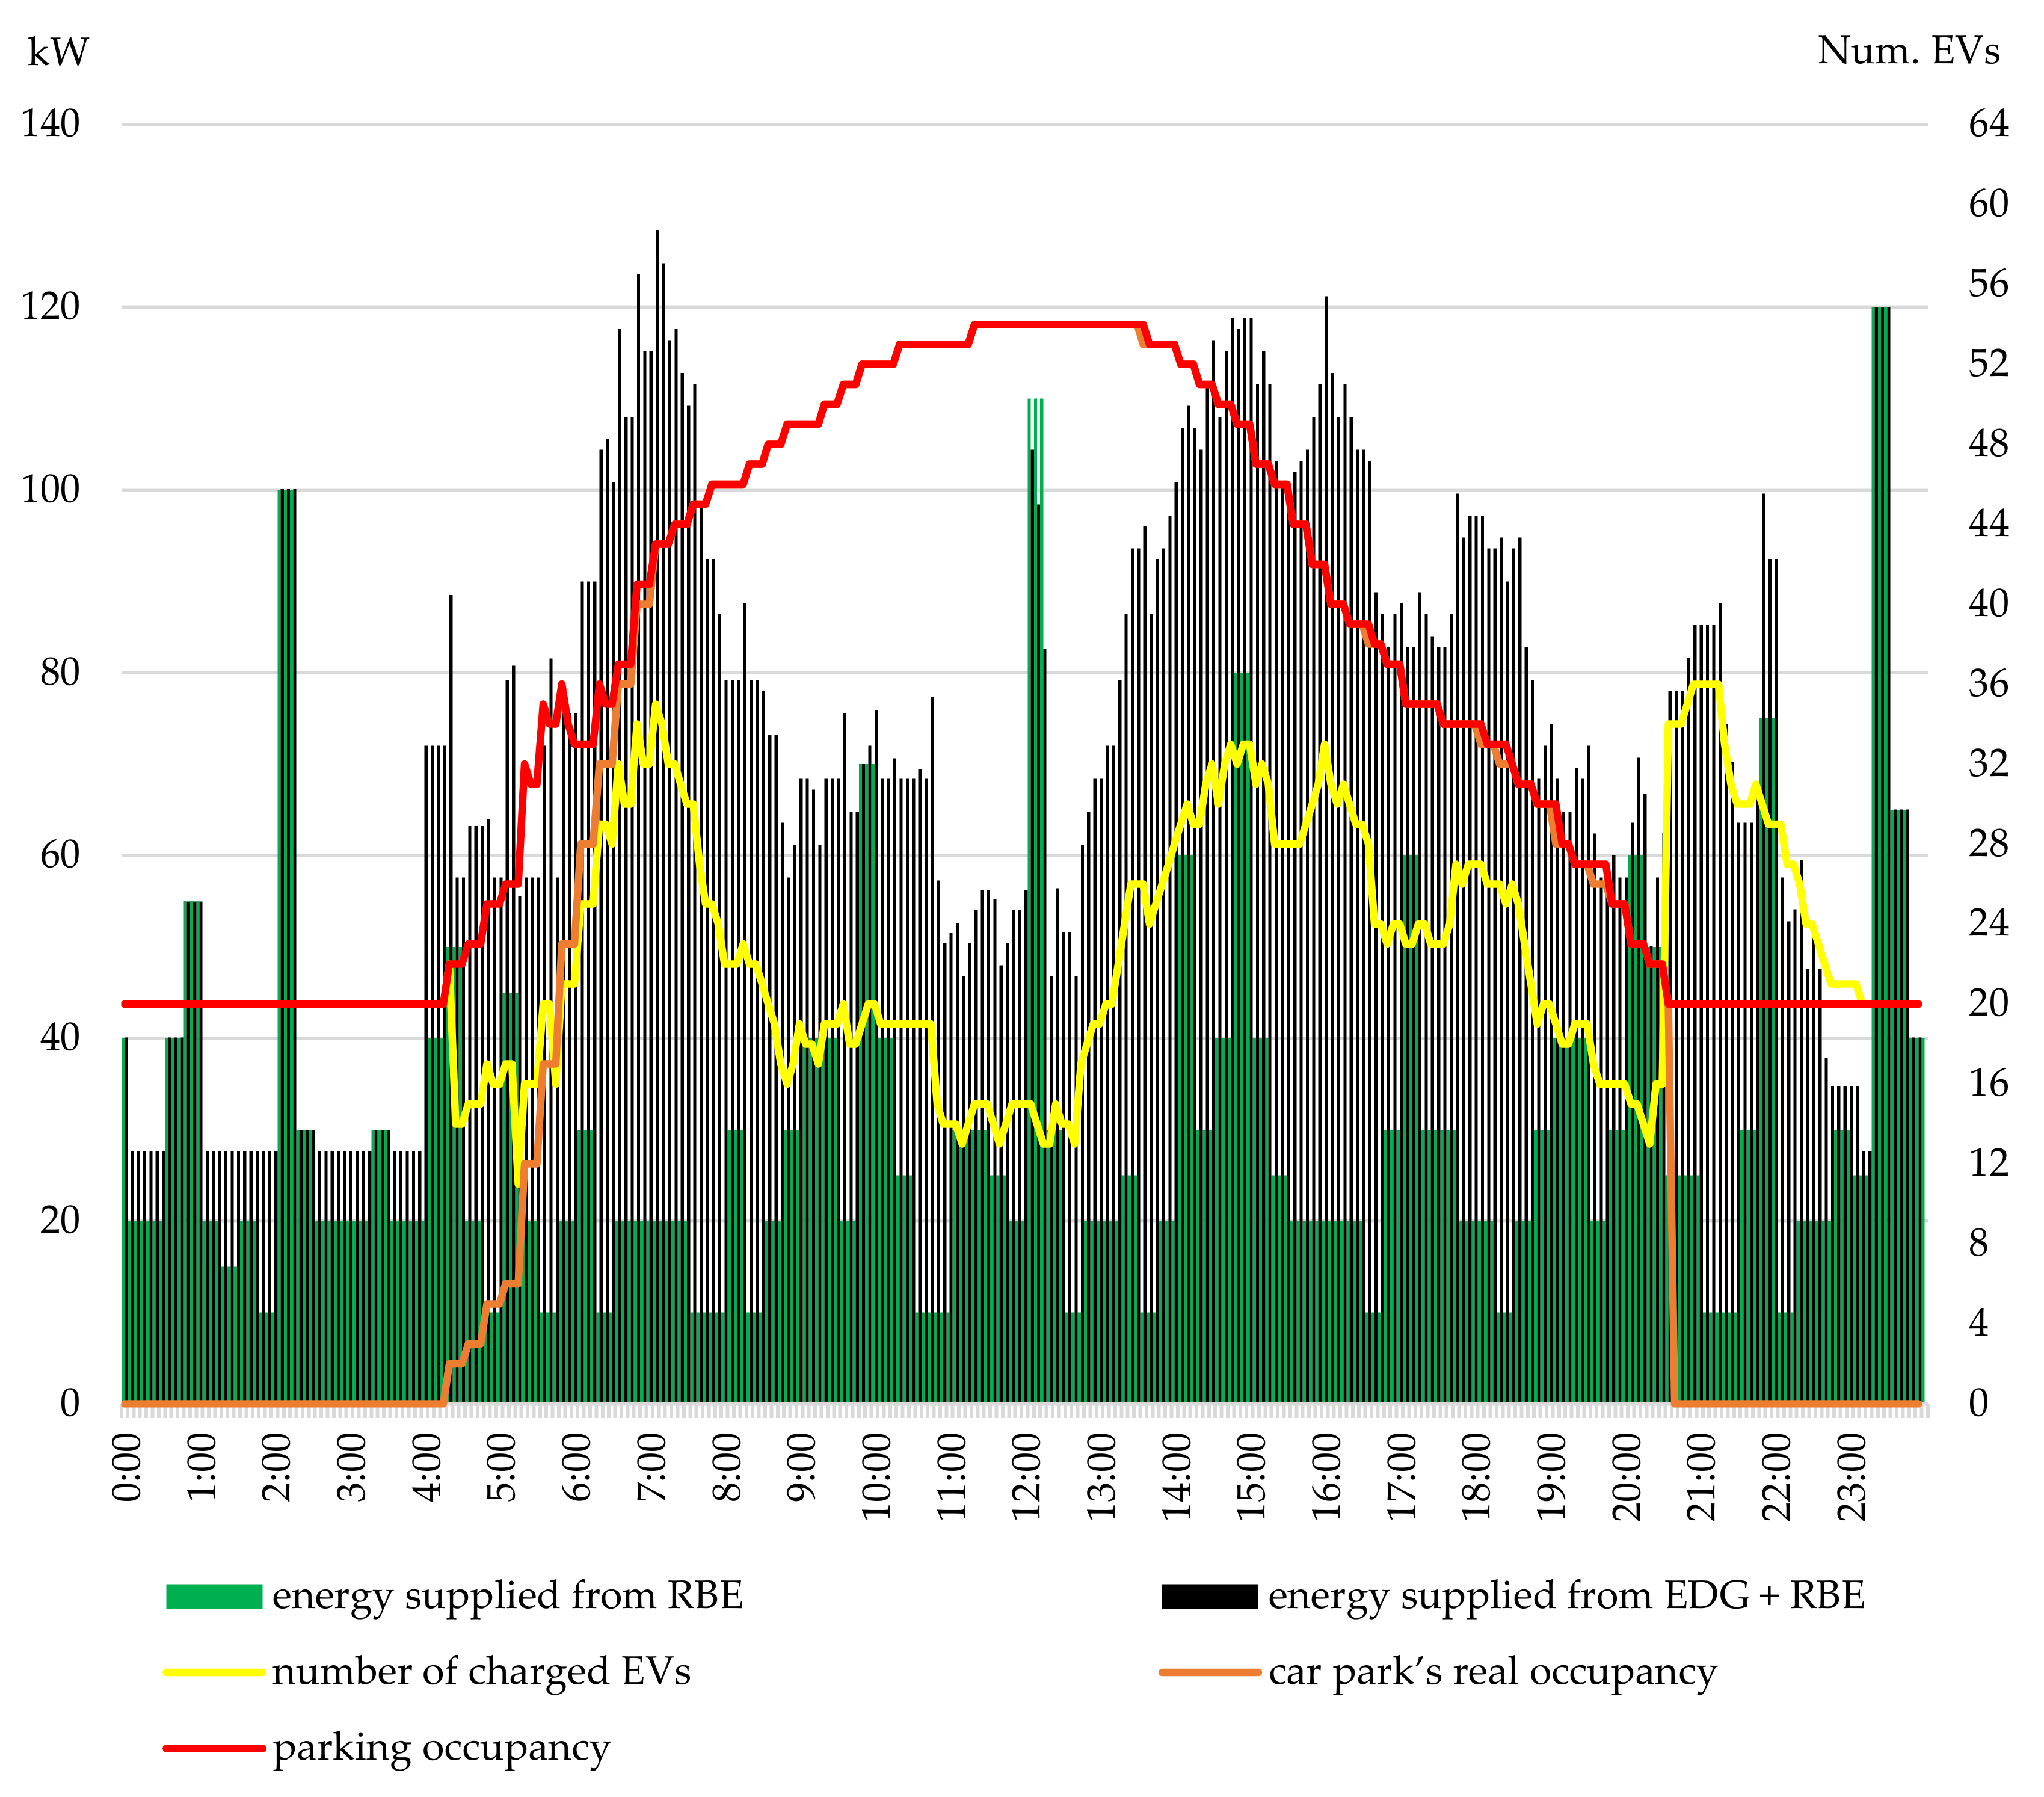
Figure 8 presents an average electricity consumption in the car park during weekdays, where the total energy consumed by the charging point in a given time interval exceeds the amount of RBE supplied due to the minimum charging power requirement of each EV (indicated by black bars). Using the variable charging power function, the model then adjusted the charging performance of each charger to ensure that the RBE was always used as efficiently as possible and did not overflow back to the EDG.
The same set of 40 simulations was performed to obtain reliable results, but with different charging requirements and parking lengths for each participant. Focusing on the fluctuation of the user arrivals and departures modelled on the basis of an approximation of the real car park occupancy during weekdays, the average number of nonresidents served is 215. The number of residents served is limited to a fixed number of 20.
In terms of the car park electricity consumption during weekday operation, the total energy consumption did not exceed 1694 kWh. This amount of energy already includes losses incurred in the transformer given by the standard CSN 341610.
From the total of 1694 kWh of energy, the 20 residents consumed 350 kWh on average, and a further 1344 kWh was consumed during the day by nonresidents’ charging requirements. A more in-depth analysis of the total car park consumption data shows that RBE supplied 775 kWh of energy on average. These RBE energy supplies covered 199 kWh of residents’ energy requirements, corresponding to 57% of the residents’ total consumption. Nonresident RBE energy covered 577 kWh, equivalent to 43% of the total nonresidents’ consumption (
Figure 9). The remaining amount of energy needed to cover the charging requirements of both user groups was purchased and supplied from the EDG. Regarding the power load on the train power system due to the purchase of energy required to operate the chargers in addition to the energy obtained from RBE, the power load did not exceed 110 kW during the nonresident charging on the given day. Furthermore, the power load did not exceed 52 kW during the resident charging on the given day.
Focusing on the efficiency of RBE consumption and the use of this energy for EV charging, it was found that all RBE was used for nonresident charging, and there was no overflow into the EDG. RBE was used for residential charging with a 99.7% success rate. Due to earlier morning departures of some residents, RBE was not fully used. Therefore, less than 1 kWh of RBE overflowed into the EDG.
The charging station power level changes within the range from 3.6 to 7.4 kW for nonresidents and from 1.38 kW to 7.4 kW for residents with the objective of using the RBE efficiently. The reason for the increase in the charging power level was the train braking and simultaneous generation of RBE. In terms of the increasing charging power, the average charging power for each of the 215 resident cars was identified as 2 kW. As might be expected, when charging a group of 20 resident cars, which is nearly one-eleventh the number of nonresidents, the average charging power for each EV was 3.78 kW. Focusing on the success rate of charging residents’ vehicles to the full battery charge, we find out that, on average, 18 out of 20 residents are satisfied in this way, and the success rate is therefore 80%.
All residents are guaranteed a 12 kWh energy amount if they arrive in the car park at the required time. However, the simulations found that due to the RBE energy on the train line between Prague and Brno being considered, each resident’s EV can get 22 kWh of energy due to the increasing charging power of the chargers.
The fundamental benefit of charging at the car park considered compared to charging at a public charging station or at home without renewables is the lower amount of CO
2 emissions associated with each kilowatt-hour charged into the battery. The average amount of emissions correlated with each kilowatt-hour supplied by the distribution network in the Czech Republic in 2019 is equal to 428 gCO
2. Since both electricity from the EDG and RBE are used to charge the EVs at the car park in question, the emissions associated with the charging are lower than those from the energy supplied from the distribution network in terms of CO
2 emissions. Therefore, each kilowatt-hour charged to the EV battery, regardless of the charging time at the car park in question, is equivalent to 228 gCO
2 (
Figure 10). Assuming an average EV consumption of 20 kWh/100 km, an EV charged in the car park has emissions of 46 gCO
2 per kilometer.
A more detailed analysis of the CO2 emissions associated with a kilowatt-hour in the resident and nonresident groups found that 46% of the energy used to cover the charging requirements of the resident group came from RBE. Therefore, the emissions associated with a kilowatt-hour recharged by the resident charging group reached the level of 181 gCO2/kW. However, the emissions associated with a kilowatt-hour of nonresident charging, where RBE supplied 43% of the 1344 kWh, reached 240 gCO2/kWh. Considering an average EV consumption of 20 kWh/100 km, a resident’s EV charged in the car park in question has emissions of 48 gCO2 per kilometer. In contrast, a kilometer driven by a nonresident’s vehicle results in emissions of less than 38 gCO2.
Compared to the emissions of an EV recharging at a public charging station that uses only electricity from the EDG, the amount of gCO2 produced by each kilometer of a resident driving is lower by almost 37 gCO2. A resident charging at the car park in question produces almost 49 gCO2 less per kilometer than a user who charged their EV at a public charging station.
Results of Economic Part
Table 4 and
Table 5 below present the LCOE dependence on the two most important input parameters: the yield of the project (discount rate) and the share of inclusion of fixed costs (CAPEX) between the user groups being considered.
Before presenting the final prices per kWh in the modelled car park, it is necessary to illustrate the conditions of home charging, which is the main competitor. Home charging in the Czech Republic provides EV owners with a special electricity rate known as D27d [
70]. This rate offers eight hours of charging between 18:00 and 8:00 with a price per kWh close to EUR 0.09 in the low rate bracket and close to EUR 0.2 in the high rate bracket.
A more in-depth analysis of the residents’ table shows that in the limit case (green field), the residents’ charging price per kWh in the car park reaches the low rate price per kWh of home charging. As far as the green field (the discount rates and CAPEX shares) is concerned, nonresidents have a lower price per kWh than they would have with home charging at a high rate. The blue part in both tables denotes a price per kWh that is lower than or equal to the price per kWh at the high home-charging rate. From the perspective of users who can charge at home, this price is not very profitable. However, for users with the absence of private parking, the given prices per kWh are very profitable compared to public charging stations [
71]. The red part in both tables shows the area with minimal difference in price per kWh between both groups if the fixed costs are divided by the ratio of 25% for residents and 75% for nonresidents.
7. Discussion
The analysis of data obtained from real chargers shows some important results. More than 80% of the sample of 3000 charging iterations from Prague shows that users leave their EVs parked and connected to the charger for a time longer than necessary for recharging the battery. Chargers with a charging power of 3.6 kW would be sufficient for these users to charge the full battery capacity for the same parking time. The exception was the remaining 20% of the EV user sample studied, whose priority was to quickly recharge their EV and continue their way. Thus, they chose a 75 kW charger or 150 kW supercharger station to charge their EV, which satisfied their requirement. A charging station with a power range of 3.6 to 7.4 kW could not meet this requirement. In terms of developing the installation of charging stations in urban and suburban areas, a sufficient number of low-power chargers is a higher priority than building fewer chargers with higher charging power. The same consideration must be applied to building charging infrastructure in car parks near train stations. The way these car parks are used correlates with the users’ long parking times and, therefore, with the sufficient time to recharge their EVs.
Moreover, car parks at train stations equipped with charging infrastructure are suitable for evening reservations due to their minimal occupancy in the evenings. The reservations then create the same conditions for EV users who live in the area and do not have their own private parking space with chargers as users with their own garage do.
As shown in the economic section of the case study, our solution offers residents a guaranteed recharge of 12 kWh. Depending on the amount of RBE, residents could recharge up to 22 kWh during their parking. The residents’ price per kWh was constant throughout the charging time and mainly depended on the discount rate and the percentage split of the investment costs (CAPEX) between the resident and nonresident groups. The smallest difference in price per kWh between the two groups was achieved with CAPEX split between users at 25% for residents and 75% for nonresidents. At these discount rates and CAPEX shares, the residents’ price per kWh ranged between EUR 0.12 and EUR 0.20 per kWh.
The case study results show that using RBE from trains efficiently is possible without installing battery storage or a capacitor. The charging power management system, which varied the charging power of the chargers depending on the number of EVs being charged and the RBE size, was able to use RBE with almost 100% efficiency.
In terms of resident charging, the system is designed to use RBE as efficiently as possible. It guarantees all residents a 12 kWh energy amount if they arrive in the car park at the required time. A high priority of the modelled charging system was to use the RBE efficiently, whereas 100% recharging for residents was not fundamental to the model. Conversely, if 100% recharging for residents was a high priority and RBE covered only a part of the total energy consumed, the system would increase the charging power of the chargers to the maximum power level at times when RBE alone would not be sufficient for residents to recharge fully. The charging system would have to monitor the amount of energy required for the full battery charge of each resident vehicle during charging. When the amount of energy required approaches a limit that the charger would no longer be able to achieve without increasing the charging power to the maximum, considering the remaining parking time, the charging system would then have to change from the resident charging mode to the maximum charging mode. This would fully satisfy all residential charging requirements but with a significant increase in energy consumption from the EDG.
Another important issue is the CO2 emissions associated with both the production of electricity and the operation of EVs themselves. The results of many studies and the results presented in our case study highlight the importance of converting electricity generation from fossil to renewable energy sources. The part of the case study focusing on EV charging in the conditions of the Czech Republic and its current energy mix shows that for each kilometer driven by an EV, the CO2 production does not meet the required European targets. In addition to the construction of renewable sources, efficient use of recuperative braking energy (BRE) can also contribute to reducing CO2 emissions. BRE is generated when trains are braking and sometimes wasted by conversion to heat in the onboard resistors (rheostats).
It is evident that for a better setup of all model parameters, it will be necessary to analyze the behavior and requirements of specific users of EVs, both those living in the vicinity of the car park and those using the car park services primary during the day. In particular, the number of resident parking spaces provided may be different depending on the arrivals and behavior of local residents. It can be higher due to an increase in the number of residents arriving later than 7 p.m. and conversely leaving earlier than 6 a.m..
8. Conclusions
The paper analyses the economic and environmental effects of using RBE to charge EVs in a car park located near a train station where additional construction of charging infrastructure is considered.
The model primarily focuses on the efficient use of RBE by adjusting the charging power of individual chargers. In general, the model defines two groups of users for which it sets the power range of the chargers. The first group (nonresidents) are users who use the car park for all-day parking. Typically, nonresidents leave their EVs at the car park near the train station in the morning and continue to travel by train. Consequently, their EVs are parked in the car park and charged until they return from work or other journeys in the evening. The second group (residents) live close to the car park and rent parking spaces primarily for overnight parking.
The charging station power level changes within the range from 3.6 to 7.4 kW for nonresidents and from 1.38 kW to 7.4 kW for residents with the objective of using the RBE efficiently. The lower power limit of the chargers during the charging of the resident group was set to ensure enough charged cars and thus providing the possibility to increase their charging power whenever needed during the resident parking time.
The case study in this paper uses recharging data from the company PRE and parking place occupancy data for a car park with 64 parking spaces near the Praha Holešovice train station. Data capturing RBE overflows on the busiest train line between Prague and Brno were used for the simulation. Building of EV charging infrastructure using RBE at the existing car park has been considered along this train line.
For the case study, annual data were taken from the charging stations between 2019 and 2020, with more than 3000 recharges from seventy-seven charging points. At each of these charging points, a 22 kW AC charger could be used for charging an EV. Eleven of these seventy-seven charging points also had a 50 kW DC charger for EV charging. Six of the seventy-seven charging points had 75 kW DC chargers. The most powerful 150 kW DC supercharger was installed at only two of the seventy-seven charging points. The remaining 20% of the studied EV users had a priority to quickly recharge their EV and continue their way. Thus, they chose a 75 kW charger or a 150 kW supercharger station to charge their EV, which satisfied their requirement.
Focusing on the efficiency of RBE consumption and the use of this energy for EV charging, it was found that due to the variable charging power function used, RBE was used with almost 100% efficiency. RBE contributed to the total daily car park consumption, equaling 1695 kWh, with more than 45%. Since there are no CO2 emissions from the generation of RBE, by consuming and efficiently using this energy, the amount of CO2 associated with the need for each kilowatt-hour of energy is reduced significantly.
Comparing the average amount of 428 gCO2 emissions associated with each kilowatt-hour supplied from the distribution grid in the Czech Republic in 2019 with the amount of CO2 emissions associated with each kilowatt-hour charged into the EV battery at the car park in question, it was found that the CO2 emissions were reduced by more than 45%. Each kilowatt-hour charged to the EV battery using RBE, regardless of the charging time at the car park considered, is equivalent to 228 gCO2. Assuming an average EV consumption of 20 kWh/100 km, an EV charged in the considered car park has emissions of 46 gCO2 per kilometer. Therefore, the use of RBE would contribute to the achievement of the 50 gCO2/km target set by the EU for the year 2050 in the energy mix of the Czech Republic, where more than 40% of the total energy was produced by coal power plants in 2019.
From the economic point of view, the results show that the residents’ prices per kWh are able to compete with home charging. However, these prices are considerably dependent on the division of CAPEX between both groups of users and the required discount rate. In the presented case study, a competitive price per kWh was achieved if residents contributed 10% of the CAPEX, and the required discount rate was 7%. If the required discount rate were equal to 23%, the resident contribution to CAPEX would be only 5% to achieve a competitive price.


