Article

Optimal Deployment of Mobile MSSSC in Transmission System

School of Electrical and Electronic, University College Dublin, D04 V1W8 Dublin, Ireland
*
Author to whom correspondence should be addressed.
These authors contributed equally to this work.
Energies 2022, 15(11), 3878; https://doi.org/10.3390/en15113878
Submission received: 2 May 2022 / Revised: 19 May 2022 / Accepted: 22 May 2022 / Published: 24 May 2022

Abstract

:
With the rapid development of the renewable energy source (RES), network congestion management is increasingly important for transmission system operators (TSOs). The limited transmission network capacity and traditional intervention methods result in high RES curtailment. The near-term, powerful, and flexible solutions, such as advanced flexible AC transmission systems (FACTS), are considered to mitigate the risks. The mobile modular static synchronous series compensator (MSSSC) is one of the grid-enhancing solutions. The mobility of the solution allows it to offer fast deployment and seasonal redeployability with limited cost. The demonstration of the mobile MSSSC solution has shown significant benefits for RES curtailment reduction, network congestion alleviation, and facilitating the demand and RES connection. For unlocking the true value of the mobile solution, they should be optimally allocated in the transmission networks. This paper develops a security-constrained DCOPF-based optimisation tool to investigate the optimal allocation of the mobile MSSSC solution in transmission networks. A linear mobile MSSSC model with the operation dead-band was introduced that can be used in large-scale realistic power system planning. The proposed model was implemented in the IEEE 118-bus system to assess the performance of the mobile MSSSC.

1. Introduction

1.1. Objectives

The existing transmission networks are hurdling the RES penetrations in many countries. The traditional topology of the grid is hardly adapted to the changes in the energy transition. This caused increasing network congestion, curtailments of RES, and contingency risks. The traditional methods, such as upgrading lines or building new lines, require a long lead time and capital costs to fully address the issues. Therefore, TSOs are seeking for advanced grid enhancement technologies to mitigate the grid constraints by maximising the utilisation of existing infrastructures.
The MSSSC technology, as an isolated-gate bipolar transistor (IGBT)-based technology, can inject controllable inductive or capacitive voltages into the circuits [1,2]. This enables it to effectively manage the power flows with negligible sub-synchronous resonance issues [3]. Due to the variable power flows along with the demand growth and grid expansion, the near-term solution for power flow control is increasingly high [4]. The mobile MSSSC solution can be flexibly redeployed, fast installed, and transported. This allows TSOs to resolve short-term system needs in multiple locations with low costs by using the limited number of devices [5]. The technology has been successfully demonstrated in Flexitranstore projects as part of the European Commission’s Horizon 2020 programme [6]. Positive impacts on RES curtailment reduction and cross-border power transfer capacity were observed by managing the system congestion [7]. Hence, the mobile MSSSC solution is expected to play a crucial role in thermal overloads mitigation with an optimal deployment strategy.

1.2. Literature Review

There are a number of existing solutions for resolving the transmission network constraints, such as generating unit redispatching [8], demand response [9], dynamic line rating [10], and energy storage system [11]. As one of the network constraint solutions, the MSSSC devices were proposed as an economic and powerful solution for transmission system planning [12]. By augmenting to power system planning tools, it was found that the MSSSC solution has positive impacts on the day-ahead market and capital costs with given assumptions [13]. The simulation study indicated that the MSSSC technology can significantly increase the available transfer capacity of the existing transmission line [5]. It requires half of the investment as much as the new transmission line construction-based conventional methods to meet the same level of RES mandates. The MSSSC solution has been analysed to reduce regional RES curtailments and accelerate RES integrations [14], resulting in great C O 2 avoidance and electricity price reduction for global transmission and distribution system applications, such as US [15,16], Europe [17], Australia [18], and South America [19].
Further, a study showed that the SSSC technology application can effectively enhance the grid stability and reliability by dynamically balancing the power flows [20]. This novel power flow controller (PFC) technology can provide operational dispatching flexibility to maximise the utilisation of existing infrastructures [21]. The SSSC solution can be applied for voltage control to avoid redispatching the generators [22]. It has been demonstrated that the MSSSC, unlikely the traditional technology, has negligible SSR risks, but it is able to suppress the SSR issues in certain cases [3]. It is believed that the mobile MSSSC solution will play a vital role in the transmission line thermal overloads mitigation [23]. The current installation of the mobile MSSSC solution in Austria demonstrated that the technology can potentially increase electricity market integration by maximising power transfer capacity [24]. In the FLEXITRANSTORE project, which is a European Commission funded innovation project, the deployment speed and re-deployability of the mobile MSSSC solution were demonstrated in Southeast Europe, dramatically increased local RES integration and the availability of cross-border power flow transfer capacity [7]. The flexible controllability of the MSSSC enables the mobile solution to support post-contingency recoveries with advanced communication devices [15,25]. In addition, the MSSSC technology can be considered as a potential solution for potential voltage control, transition stability, harmonic issues, and demand uncertainty management [12,26].
A number of methodologies have been studied for various types of FACTS devices allocation. Line-flow-based multiple FACTS devices analysis methodologies were considered as a compatible and adaptive approach with the robust Newton–Raphson (NR) algorithm which is widely used in commercial software [27]. The generic algorithm was considered as an efficient solution for multi-type FACTS devices location optimisation [28,29]. A power flow entropy-based FACTS optimal allocation tool with group searcher optimization (GSO) technique was investigated for power flow regulation [30]. The objective function of minimising the transmission system power losses can be introduced for FACTS devices optimal placement study, and the tool with bacterial swarming algorithm showed robust performance [31]. The multi-objective evolutionary algorithm was considered as a compatible optimal FACTS devices deployment method for power system losses and voltage deviation management [32]. A system security-based FACTS devices deployment study indicated that FACTS devices offer enhancement of network security margin [33]. In addition, a GAMS-based fixed MSSSC optimal deployment study with an equivalent impedance MSSSC model was conducted to indicate significant technical and economic performance of the MSSSC as the grid constraints solution [34].
Additionally, the DC-optimal-power-flow-based (DCOPF) linear model of MSSSC devices was introduced and used for setting point optimisation and power system analysis [35,36]. It is found that the approximated active-set interior point algorithm has a negligible impact on the ACOPF-based FACTS models [37].
In summary, the existing FACTS devices allocation tools are shown in Table 1.
However, it is noted that there is limited mobile MSSSC optimal deployment investigation literature. This is an obstacle for wide application of mobile MSSSC solutions in transmission system planning. Hence, this work proposes an open-source DCOPF tool to support system planners to identify the optimal mobile MSSSC deployment locations.

1.3. Contributions

The contribution of this work are introduced as follows:
  • Introduces a novel open-source tool to support system planners to explore the DCOPF-based optimal placement of mobile MSSSC in transmission systems.
  • Considers the operation deadband in linear MSSSC model.
  • The proposed linear and multi-period model considers the historical Irish transmission system data, including wind and demand patterns, and system non-synchronous penetration (SNSP).

1.4. Paper Structure

The structure of this paper is indicating the tool development details. The models and methodologies used in the tool development are described in Section 2. The study results are discussed and concluded in Section 3. The sensitivity analysis is conducted in Section 4. Finally, the main findings and suggestions for future works are presented in Section 5.

2. Materials and Methods

2.1. Formulations

2.1.1. The DCOPF Model

The DCOPF problem is an approximation of ACOPF with necessary assumptions of a large ratio of the reactance and resistance of the transmission lines ( X / R   > >   1 ), negligible charging capacitance, and the constant of voltage magnitude as 1 p.u. The DCOPF method is commonly used in transmission network planning, due to its computation simplicity [38,39].
A DCOPF model was established whose objective function (1) is to minimise the total generation cost. The voltage angle constraints (2), generation units power output constraints (3), generation ramping speed constraints (4), transmission line thermal limit (5), nodal power balance Equation (6), and DC power flow Equation (7) were modelled, respectively.
In addition, a load aattern ( L P ) is defined as the ratio of the hourly load and maximum load during a selected period, allowing the change of load with respect to the time in (6).
i , t m i n g , t C o s t ( P g , t )
i , t θ i m i n     θ i , t     θ i m a x
g , t P g m i n     P g , t     P g m a x
g , t R S g m a x     R S g , t     R S g m a x
i , j , t f i j m a x     f i j , t     f i j m a x
i , j , g , t j f i j , t     g P g , i , t   +   P l , i L P t     G s h , i   =   0
i , j , t f i j , t   =   ( θ i , t     θ j , t     δ i j , t ) B i j τ i j
where
  • i , j : Set of buses;
  • g: Set of generators;
  • l: Set of loads;
  • s h : Set of shunt devices;
  • t: Set of time;
  • i j : The elements between Bus i and Bus j;
  • R S : Ramping speed of generators;
  • L P : Load pattern;
  • f: Power flows;
  • B: Susceptance of the line;
  • τ : Transformer turns ratio;
  • δ : Transformer phase-shift angle;
  • G: Conductance of shunt devices.
Furthermore, the renewable generations are widely installed in the modern power system. One of the most identical characteristics of renewable generation is the variable power output. As a result, a number of wind generators are defined as the generation units with varying capacities and are free of charge for operation in this study.
Similarly, wind pattern ( W P ) is introduced, which is akin to the load pattern, to represent the varying wind generation output with respect to time. It is defined as the proportion of the hourly wind generation and maximum wind generation during a selected period, as shown in (8). Additionally, with extra wind generation variables, the nodal power balance Equation (7) can be rewritten in (9).
w , t P w m i n     P w , t     P w m a x W P t
i , j , g , w , t j f i j , t     i P g , i , t   +   w P w , i , t   +   P l , i L P t     G s h , i   =   0
where
  • w: Set of wind generating units;
  • P w m i n , P w m a x : Minimum and maximum wind power output;
  • P w : Wind power output;
  • W P : Wind pattern.
Additionally, the SNSP constraint is necessarily considered in modern power system operation. It limits the level of non-synchronous power generation in the system to ensure the necessary level of inertial reserves in the system, as well as to maintain the secure and stable grid operation. In Ireland, EirGrid, Irish TSO, is striving to improve the level of SNSP to 95% by 2030 to achieve its net-zero target. By April 2022, EirGrid announced that 75% of SNSP has been successfully trailed [40]. As a result, the SNSP constraint is defined as the proportion of total RES generation and the total system demand which is less than 75% in this case, as shown in (10).
w , t , l w P w , t l P l L P t     S N S P

2.1.2. The N-1 Security Constraint

The security constraint is a vital measurement in modern grid planning. The considerations of generation unit and transmission line N-1 contingency constraints in the DCOPF model offer the enhancement of system security.
The generation shift factor ( G S H F g i j ) was introduced to show the impacts of varied generator power output at Bus m, Δ P m , on the power flow, f i j . Similarly, the line outage distribution factor ( L O D F m n i j ) was introduced as the impacts of power flow changes in Line m n , Δ f m n , on power flow in Line i j . Equations (11) and (12) indicate that the post-contingency power flows are within the transmission line operating limit to secure the system during the N-1 events [39].
i , j , g , t     f i j m a x     f i j , t p r e   +   G S H F g i j Δ P g , t     f i j m a x
i , j , t     f i j m a x     f i j , t p r e   +   L O D F m n i j Δ f m n , t     f i j m a x

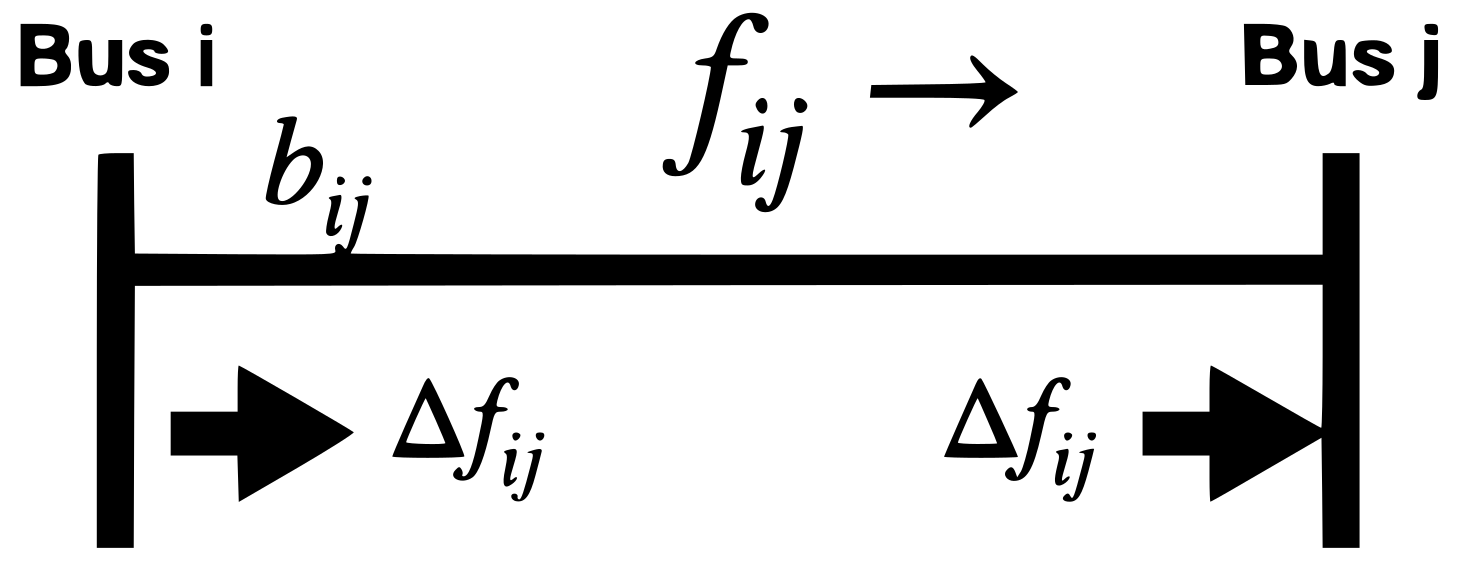
2.1.3. The Mobile MSSSC Model

As previously mentioned, the MSSSC can offer equivalent inductive or capacitive impedance variance of the circuits [1]. The traditional MSSSC model was defined as the fixed reactance injection [34]. However, this approach hardly reflects the flexibility of the devices, and the nonlinearity of the varied reactance injection model can lead to computational issues, As a result, the nodal injection model of MSSSC was utilised in this study.
Figure 1 indicates that the effect of MSSSC can be modelled as power injections at both end buses of each line. Equation (13) shows that the injection-shift-factors-based model is proportional to the reactance changes ( Δ b i j ). Based on the characteristics of the MSSSC, maximum and minimum levels of leading or lagging voltage injection are defined as V i n j m i n and V i n j m a x in (14) [36]. In Figure 2, a deadband for MSSSC operating range during the injection mode was introduced based on the linear MSSSC model [1]. In the DC power flow, the power flow is approximately equal to the line current (15) [36]. Following the derivation, the linear MSSSC model can be re-written as (16). A variable N i j is defined to control the deployment of the devices on Line i j . In this case, N i j is a time-independent real number varying within the boundary of ( 0 , 1 ) . Additionally, it is noted that the MSSSC is only available for installation on the line, not on transformers; thus, the set of i j in the below equations are for transmission line only.
Δ f i j , t   =   Δ b i j , t ( θ i , t     θ j , t )
| V i n j m i n |     | Δ X i n j , t | | I i j , t |     | V i n j m a x |
| I i j , t |     | f i j , t |
i , j , t N i j | V i n j m i n | | b i j |     | Δ f i j , t |     N i j | V i n j m a x | | b i j |
where
  • i j : Sets of transmission lines
  • Δ f i j : Power flow changes in Line i j ;
  • Δ b i j : Susceptance changes of Line i j ;
  • V i n j m i n , V i n j m a x : Minimum and maximum voltage injection of the MSSSC;
  • Δ X i n j : Reactance injection of the MSSSC;
  • I i j : Current flow in Line i j ;
  • N i j : MSSSC deployment controller for Line i j ;
  • b i j : Susceptance of Line i j .
Figure 1. MSSSC nodal injection model [36].
Energies 15 03878 g001
Figure 2. The operating and deadband range of MSSSC for voltage injection.
Energies 15 03878 g002
Practically, two variables were introduced to collaboratively represent positive and negative bound in (16). Two binary variables ( B 1 and B 2 ) control the operation of the mobile MSSSC. This can be expressed as follows:
B 1 , t V i n j m i n b i j     Δ f i j , t +     B 1 , t V i n j m a x b i j
B 2 , t V i n j m a x b i j     Δ f i j , t     B 2 , t V i n j m i n b i j
B 1 , t   +   B 2 , t     N i j
where
  • Δ f i j + , Δ f i j : The positive and negative power flow changes in Line i j ;
  • B 1 , B 2 : Operation controller of MSSSC.
Then, the nodal injection model of MSSSC can be added into (9):
j ( f i j , t   +   Δ f i j , t )     g P g , i , t   +   w P w , i , t   +   P l , i , t L P t     G s h , i   =   0
According to (17), the same signs of f i j and Δ f i j means that the MSSSC is operated in inductive injection mode to push power away from the installed line, otherwise the MSSSC is operated in conductive injection mode to pull power onto the line.
Additionally, the capital cost of the network enhancement approach is an important measurement for the evaluation and decision-making process. The investment cost of mobile MSSSC can be calculated with net present value (NPV) method which is commonly used in grid infrastructure investment evaluations. According to ENTSO-e cost–benefit analysis (CBA) guideline [41], the assumption of 2% per annum of total deployment cost attributed to operation and maintenance (OM) costs, and 40-year lifetimes [42] are determined. The hourly cost of the devices is calculated as EUR 8, and is considered as part of grid operation cost in the objective function (1).
m i n g , t C o s t ( P g , t H W )   +   i j , t C o s t ( N i j ) S W
where
  • H W : Weight of the combination of wind and load pattern in a year;
  • S W : Weight of the season in a year.
The new objective function allows the algorithm to automatically find the optimal deployment locations of mobile MSSSC in the given network. Nonetheless, the automation requires tremendous computations, which may be constrained in large-scale network model applications.

2.2. Architecture of the Tool

The DCOPF tool was developed using Pyomo package, which is a Python-based open-source mathematical modelling and optimisation tool. The Pyomo models can be interacted with a number of built-in Python packages as well as external commercial software via interfaces. Various robust solvers, such as GLPK, IPOPT, GUROBI, etc., can be utilised to solve the Pyomo model [43]. The developed Pyomo-based security-constrained DCOPF (SC-DCOPF) models can facilitate the application of Pyomo package in power system operation and planning studies.
The structure of the proposed tool is shown in Figure 3. There are four modules in the tool, including data input, DCOPF model, results output, and results analysis. The data input module is applied for mobile MSSSC and network data input, as well as preliminary calculation of security constraints. The SC-DCOPF Pyomo model is established in the second model. The raw result data are output in the third module, followed by the analysing and visualising of the results.

2.3. Assumptions

The assumptions are made to gain the analysis result, as well as to evaluate the performance of the tool. The impact of the proposed mobile MSSSC deployment tool was evaluated in the IEEE 118-bus system, as shown in Figure 4. It assumes that wind turbines are installed in the rural area, indicated as blue buses. The test time steps were set as an hour and the test period was set as a year. Load pattern and wind pattern were calculated from real system data extracted from EirGrid’s website [44].
The assumptions for mobile MSSSC and transmission line loading criteria are shown as follows:
  • The mobile MSSSC characteristics are based on SmartValve 10-1800 device [1].
  • The capital cost of mobile MSSSC deployment, including three mobile MSSSC, ancillary devices, and human resources cost, at one location is assumed to be EUR 2 M [46]. The lifetime of the devices is 40 years with 2% of OM cost per annum [42].
  • The C O 2 emission factor of electricity is 295.8 gr/kWh [47].
  • Three mobile MSSSC devices (one device per phase) are deployed at each location, and eighteen mobile MSSSC devices in total are available for six locations.
  • The SNSP is considered as 75% in accordance with Irish system requirements [40].
  • The heavily loaded line is the line whose loading is greater than 50% of its thermal limit during operation.
  • The congested line is the line whose loading is greater than 90% of its thermal limit after N-1 contingency.
  • The underutilised line is the line whose loading is less than 10% of its thermal limit without contingencies.

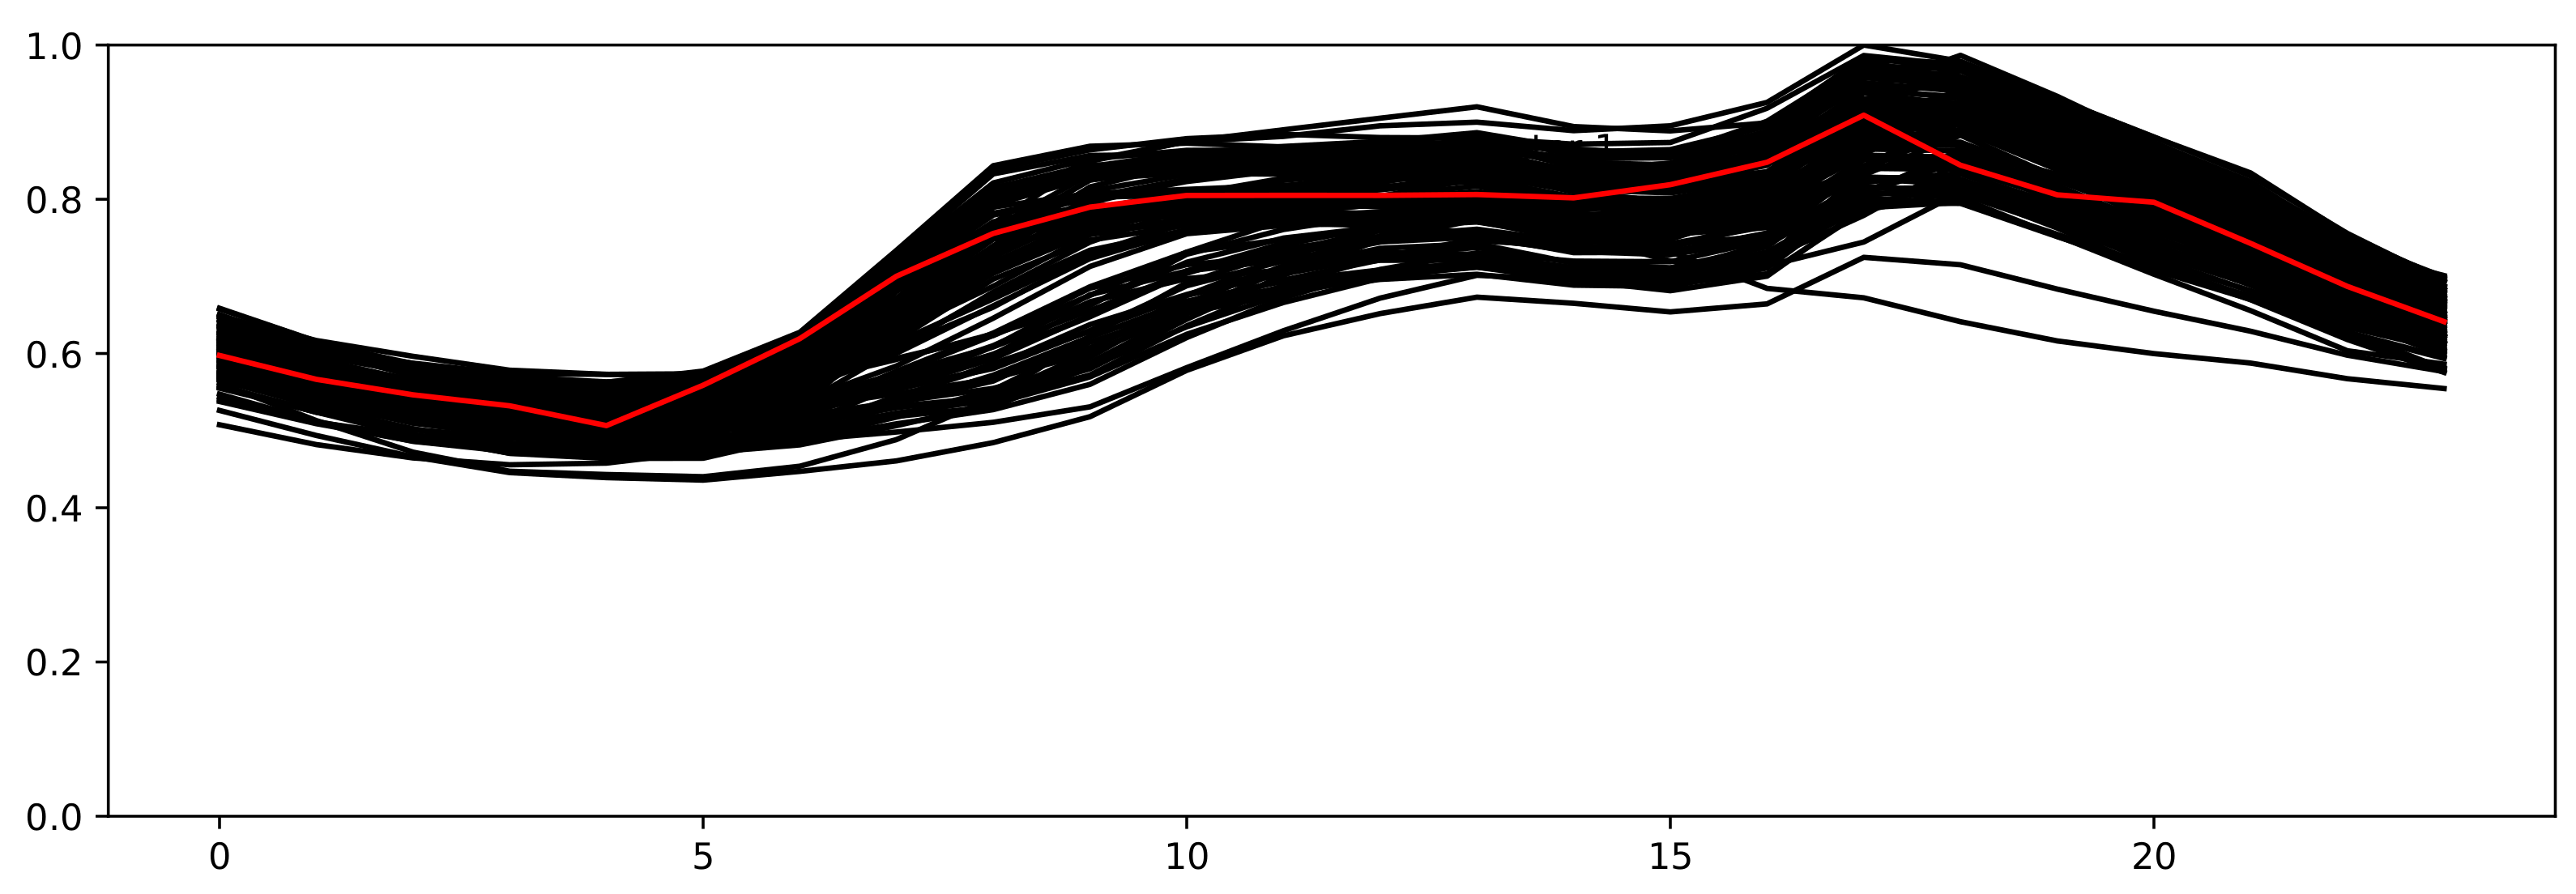
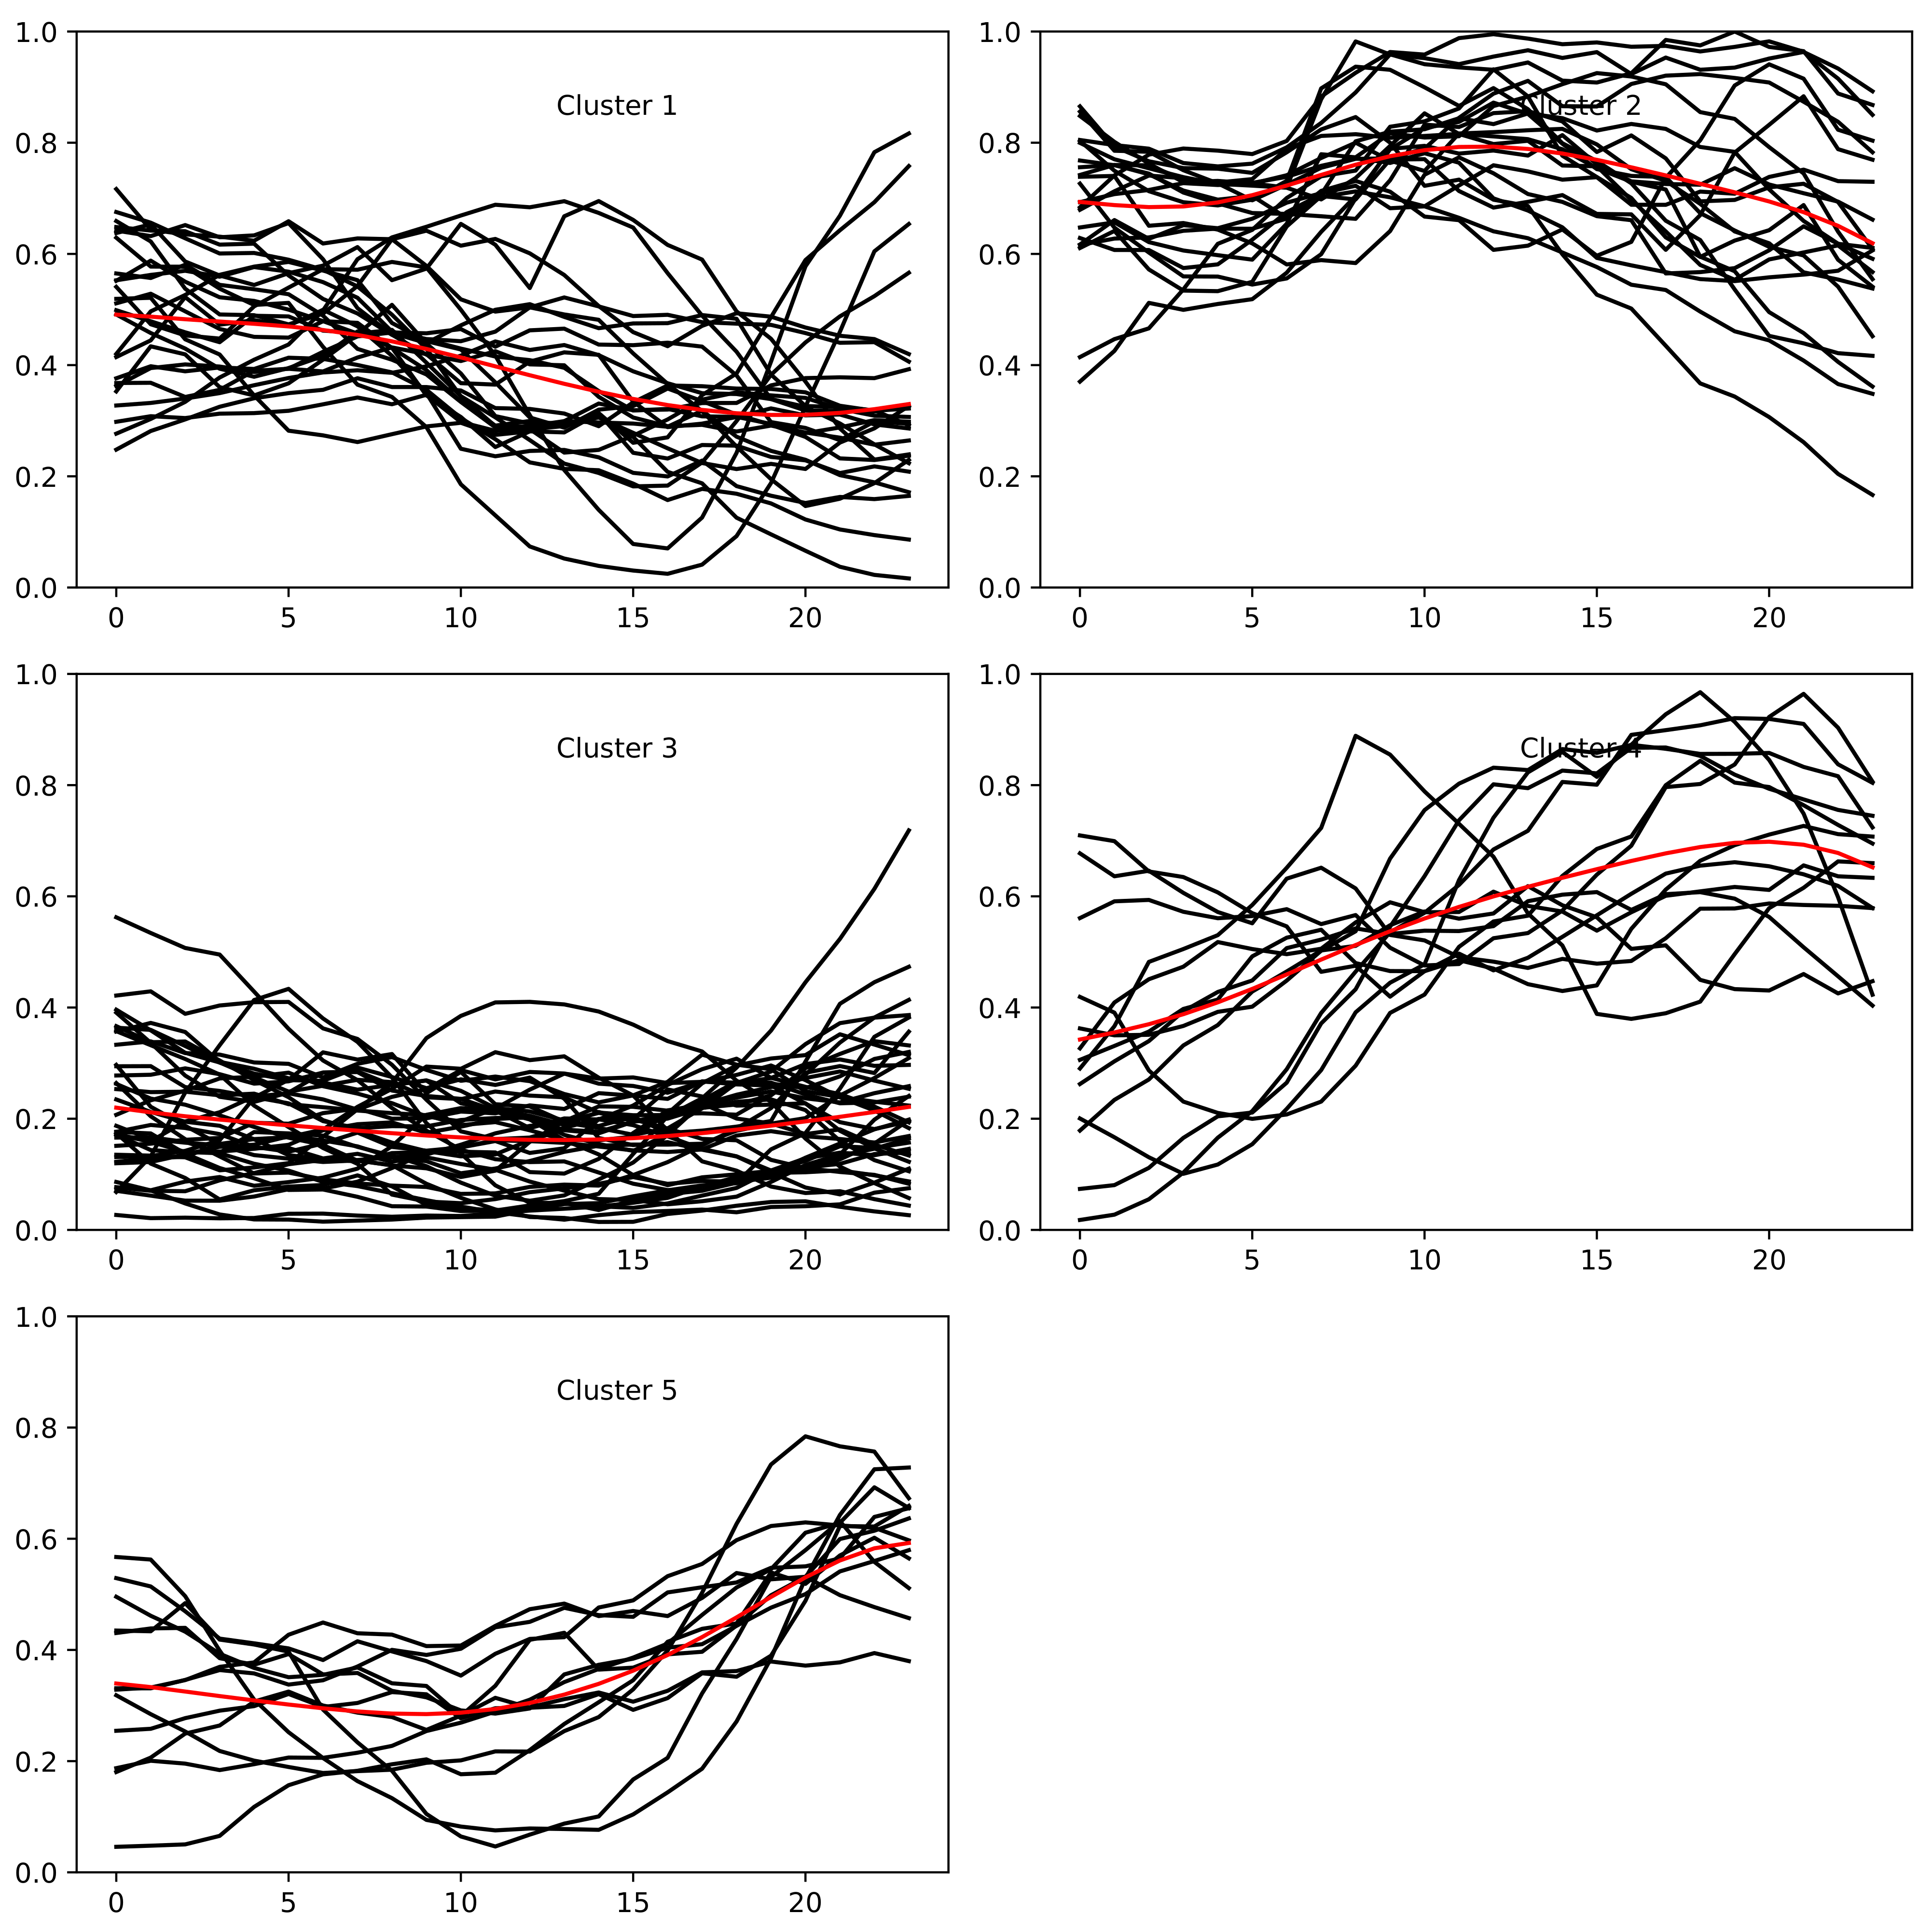
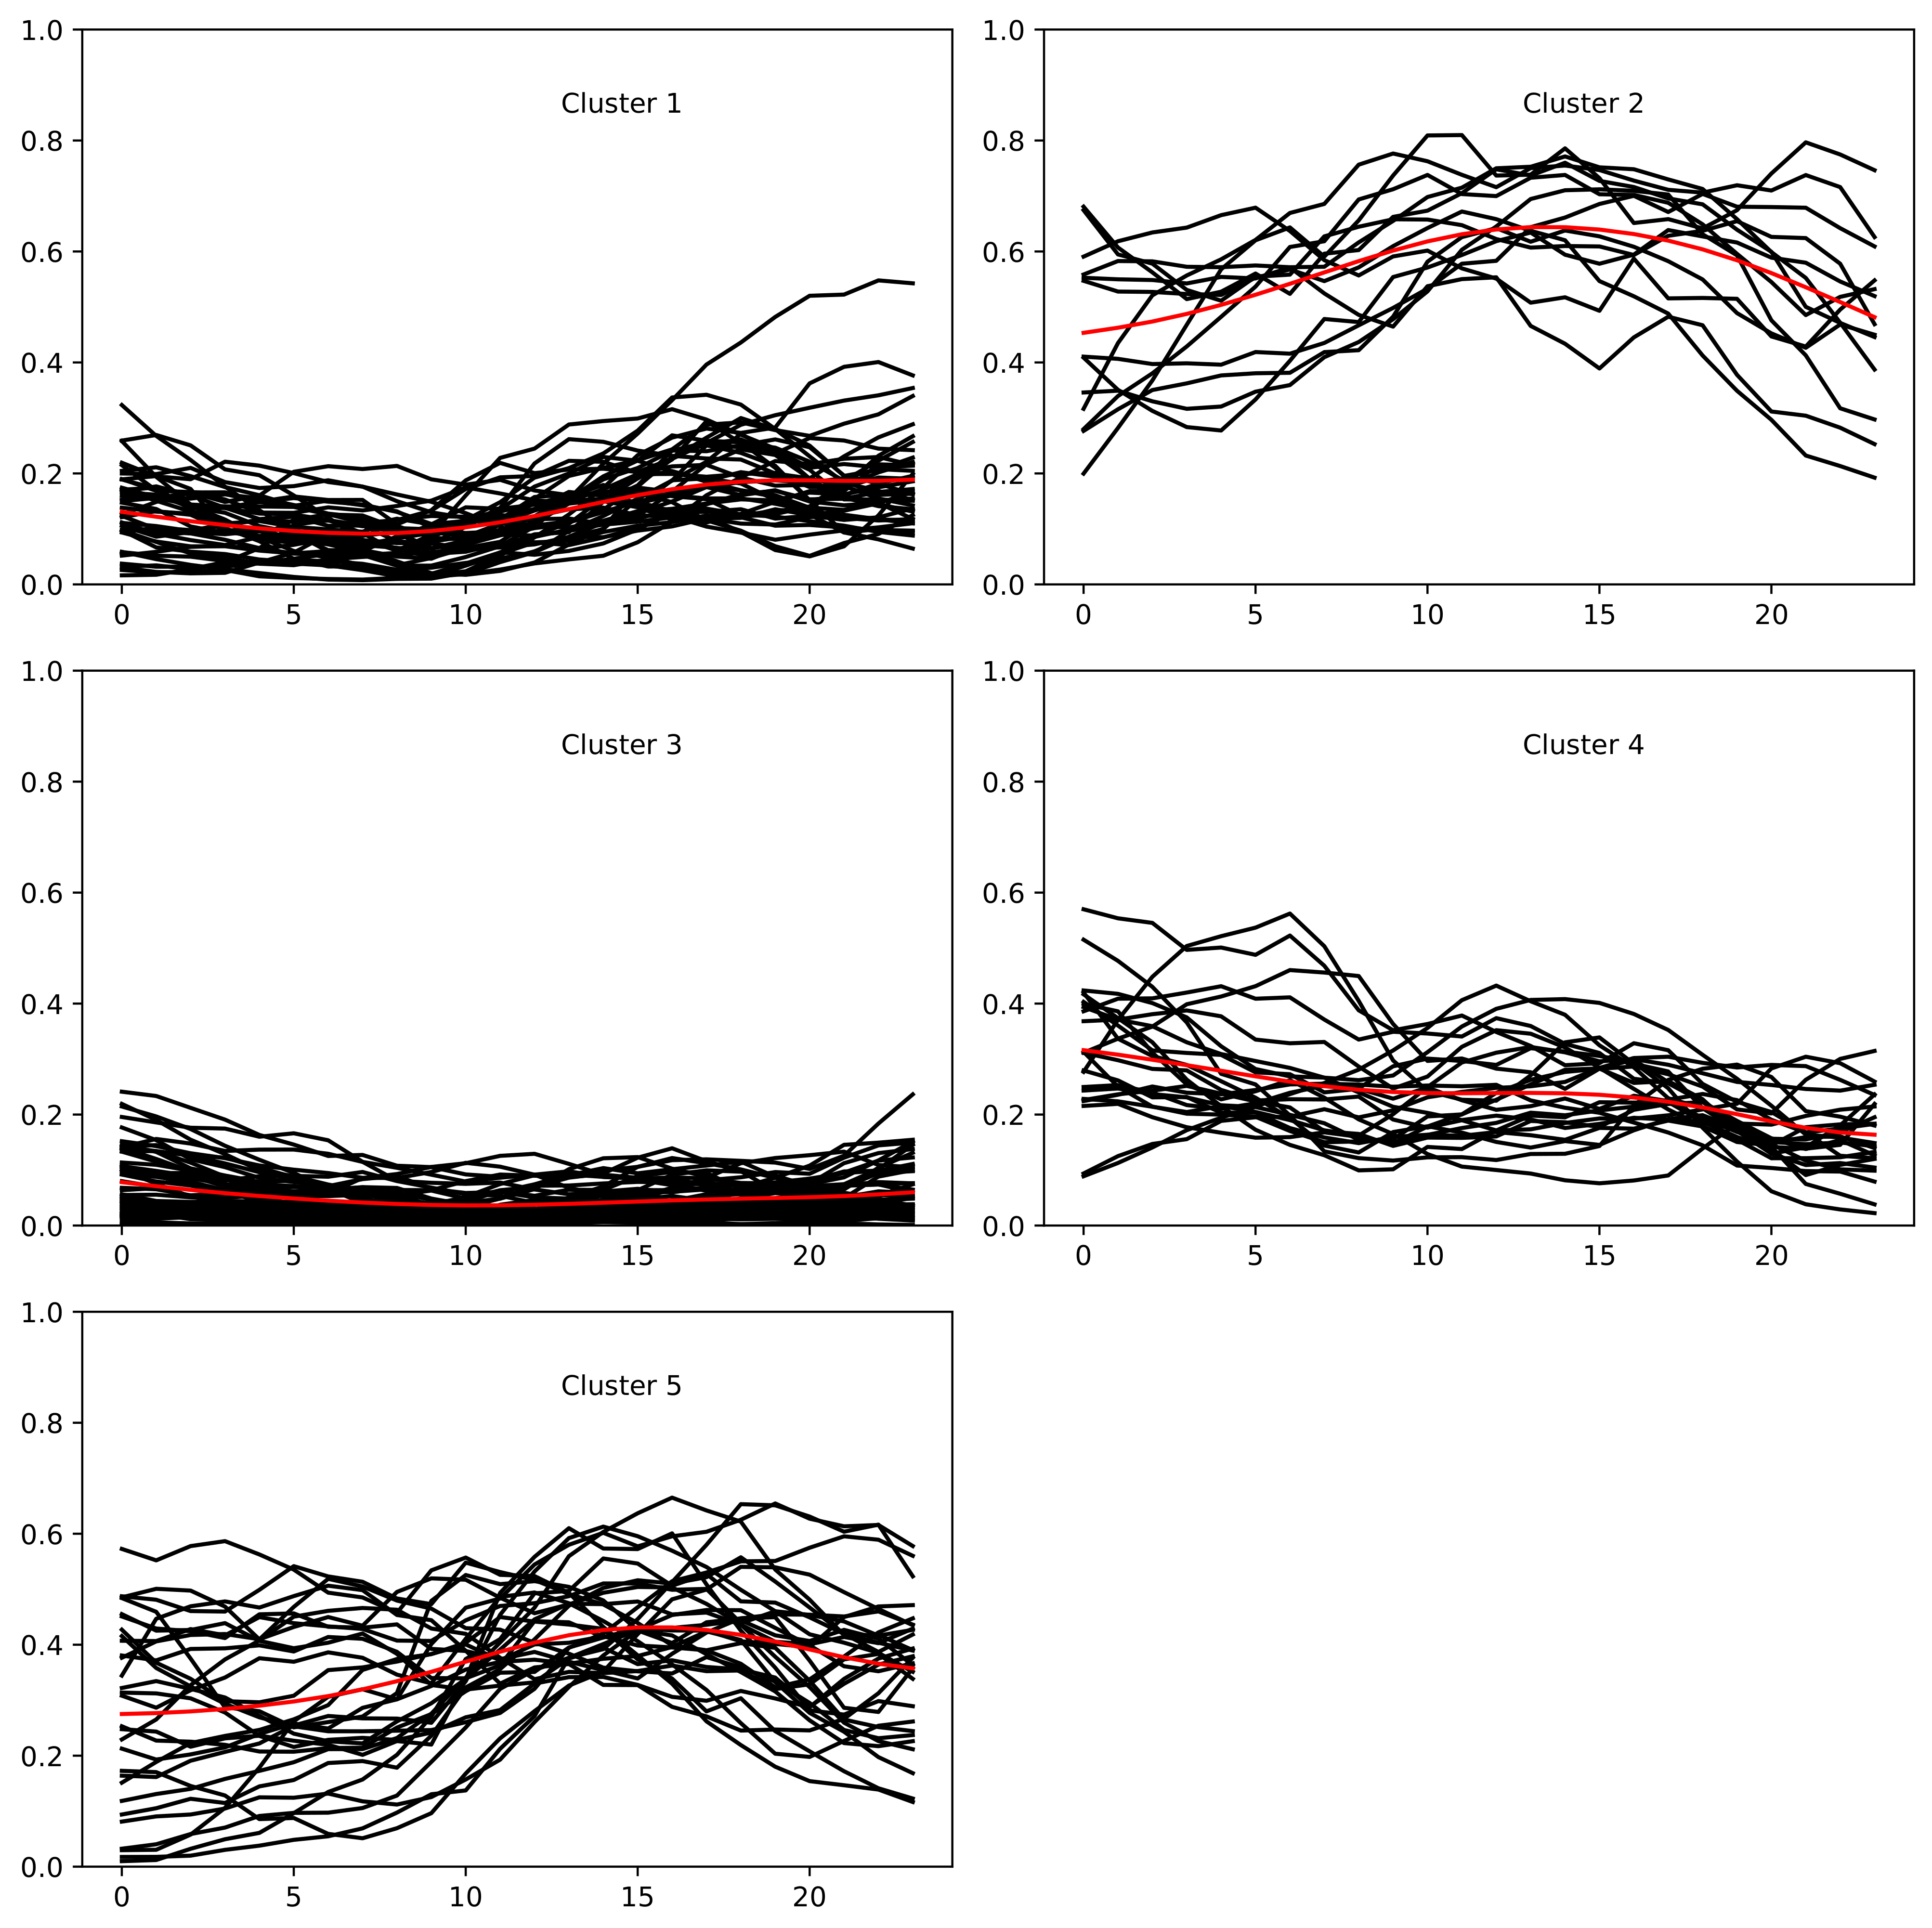
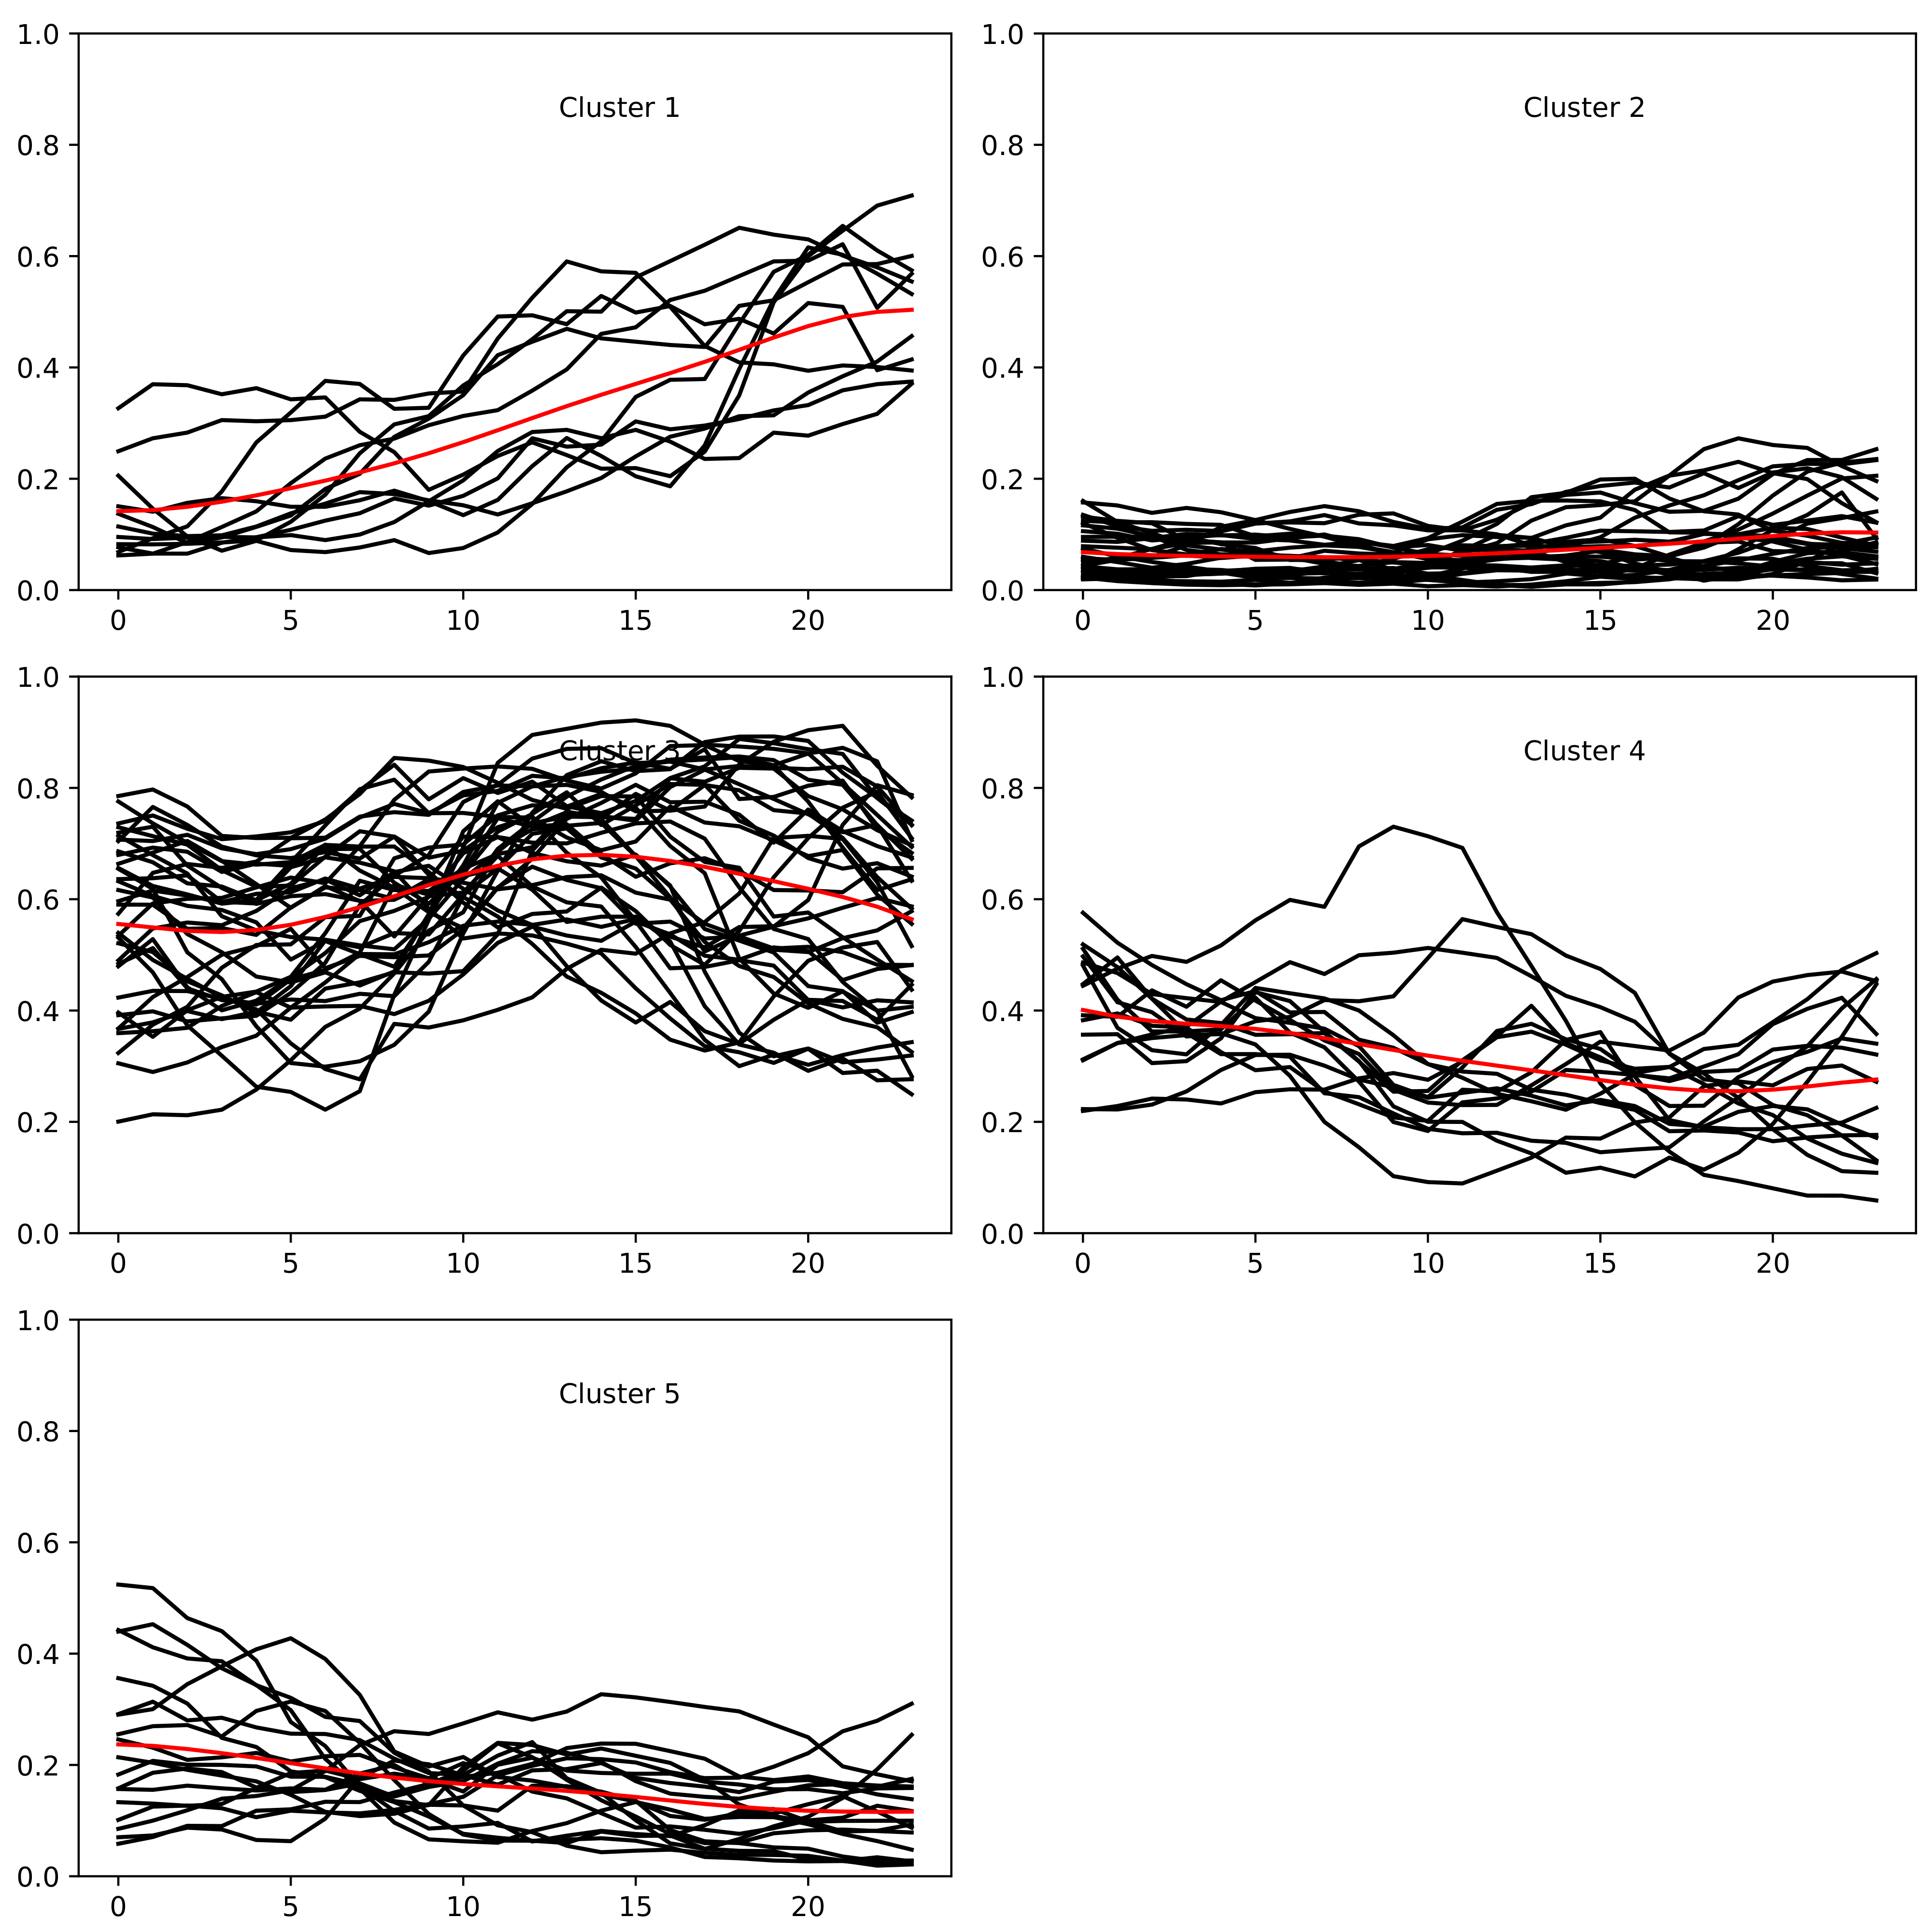
2.4. Data Preprocessing

The IEEE standard 118-bus system data are extracted from Matpower [38]. The transmission line thermal limits and the cost of generating units are justified from Illinois Institute of Technology’s open data [48].
Due to the computation limit of the machine and the solver, the tool is unable to run 1-year real system data. Following the assessment of whole year demand and wind generation data, it is noticed that the demand and wind generation data are decoupled, and seasonal variants of demand are observed in Figure 5. The system peak demand is normally over 6000 MW in the winter, and it is around 5000 MW in the summer. Hence, the system demand data are separated into three groups subjecting to the levels of demand, which can be roughly called winter selection, summer selection, and spring and autumn selection. For the wind power output, it has limited relationship with the demand, but the seasonal variation of that emerges. Hence, the wind generation data are categorised with the corresponding demand data (Please see Appendix A).
The system load and wind generation data are time-series data; thus, the time-series clustering tool of Tslearn was applied in this study. Tslearn is a Python package that provides a time-series data analysis tool based on machine learning algorithms [49]. The d t w tool was used for demand data clustering since the data are concentrated, but the s o f t d t w tool was used for wind generation data clustering due to the nature of the sparsity of data.
The analysis results show that each group of demand can be clustered into a single set of data, as shown in Figure A1, Figure A2 and Figure A3. Note that several low-demand curves appear in the winter selection caused by the Christmas holiday, which can be neglected. The wind generation data are hardly categorised due to their nature of unpredictability. By applying an experimental approach, the wind data can be roughly clustered into five groups per season, as shown in Figure A4, Figure A5 and Figure A6. Therefore, there are one demand cluster and five wind clusters for each selection, leading to 15 combinations of load and wind clusters in total (five sets of that per selection). When merging the wind clusters, it is important to keep the transition between each wind and demand pattern smooth; otherwise, it may result in infeasibility issues during resolving the model.
In order to identify the seasonal data, the names of clustering data are defined as follows:
  • Season 1: Winter. It includes 107 days (2568 h) during 1 January 2021–15 February 2021 and 1 November 2021–31 December 2021.
  • Season 2: Summer. It includes 153 days (3672 h) during 1 April 2021–31 August 2021.
  • Season 3: Spring and autumn. It includes 105 days (2520 h) during 16 February 2021–31 March 2021 and 1 September 2021–31 October 2021.
In addition, the weight of each cluster should be calculated to indicate the number of occurrences of each demand and load pattern in a year period. The weight should be respectively taken into account when calculating the generation cost, MSSSC cost, and wind curtailments, as shown in (21).

3. Results

Following the use cases of mobile MSSSC [50], there are four scenarios presented in this study. They are shown as follows:
  • 118-bus system normal operation study;
  • 1 × 150 MW demand connection study;
  • 2 × 75 MW demands connection study;
  • 1 × 150 MW RES connection study.
For each scenario, it contains three cases to show the impacts of mobile MSSSC, which are as follows:
  • Base case: The results without N-1 contingency constraints and mobile MSSSC deployment.
  • N-1 security: The results with N-1 contingency constraints, but without mobile MSSSC deployment.
  • Automatic method: The final results were obtained by using the proposed tool.

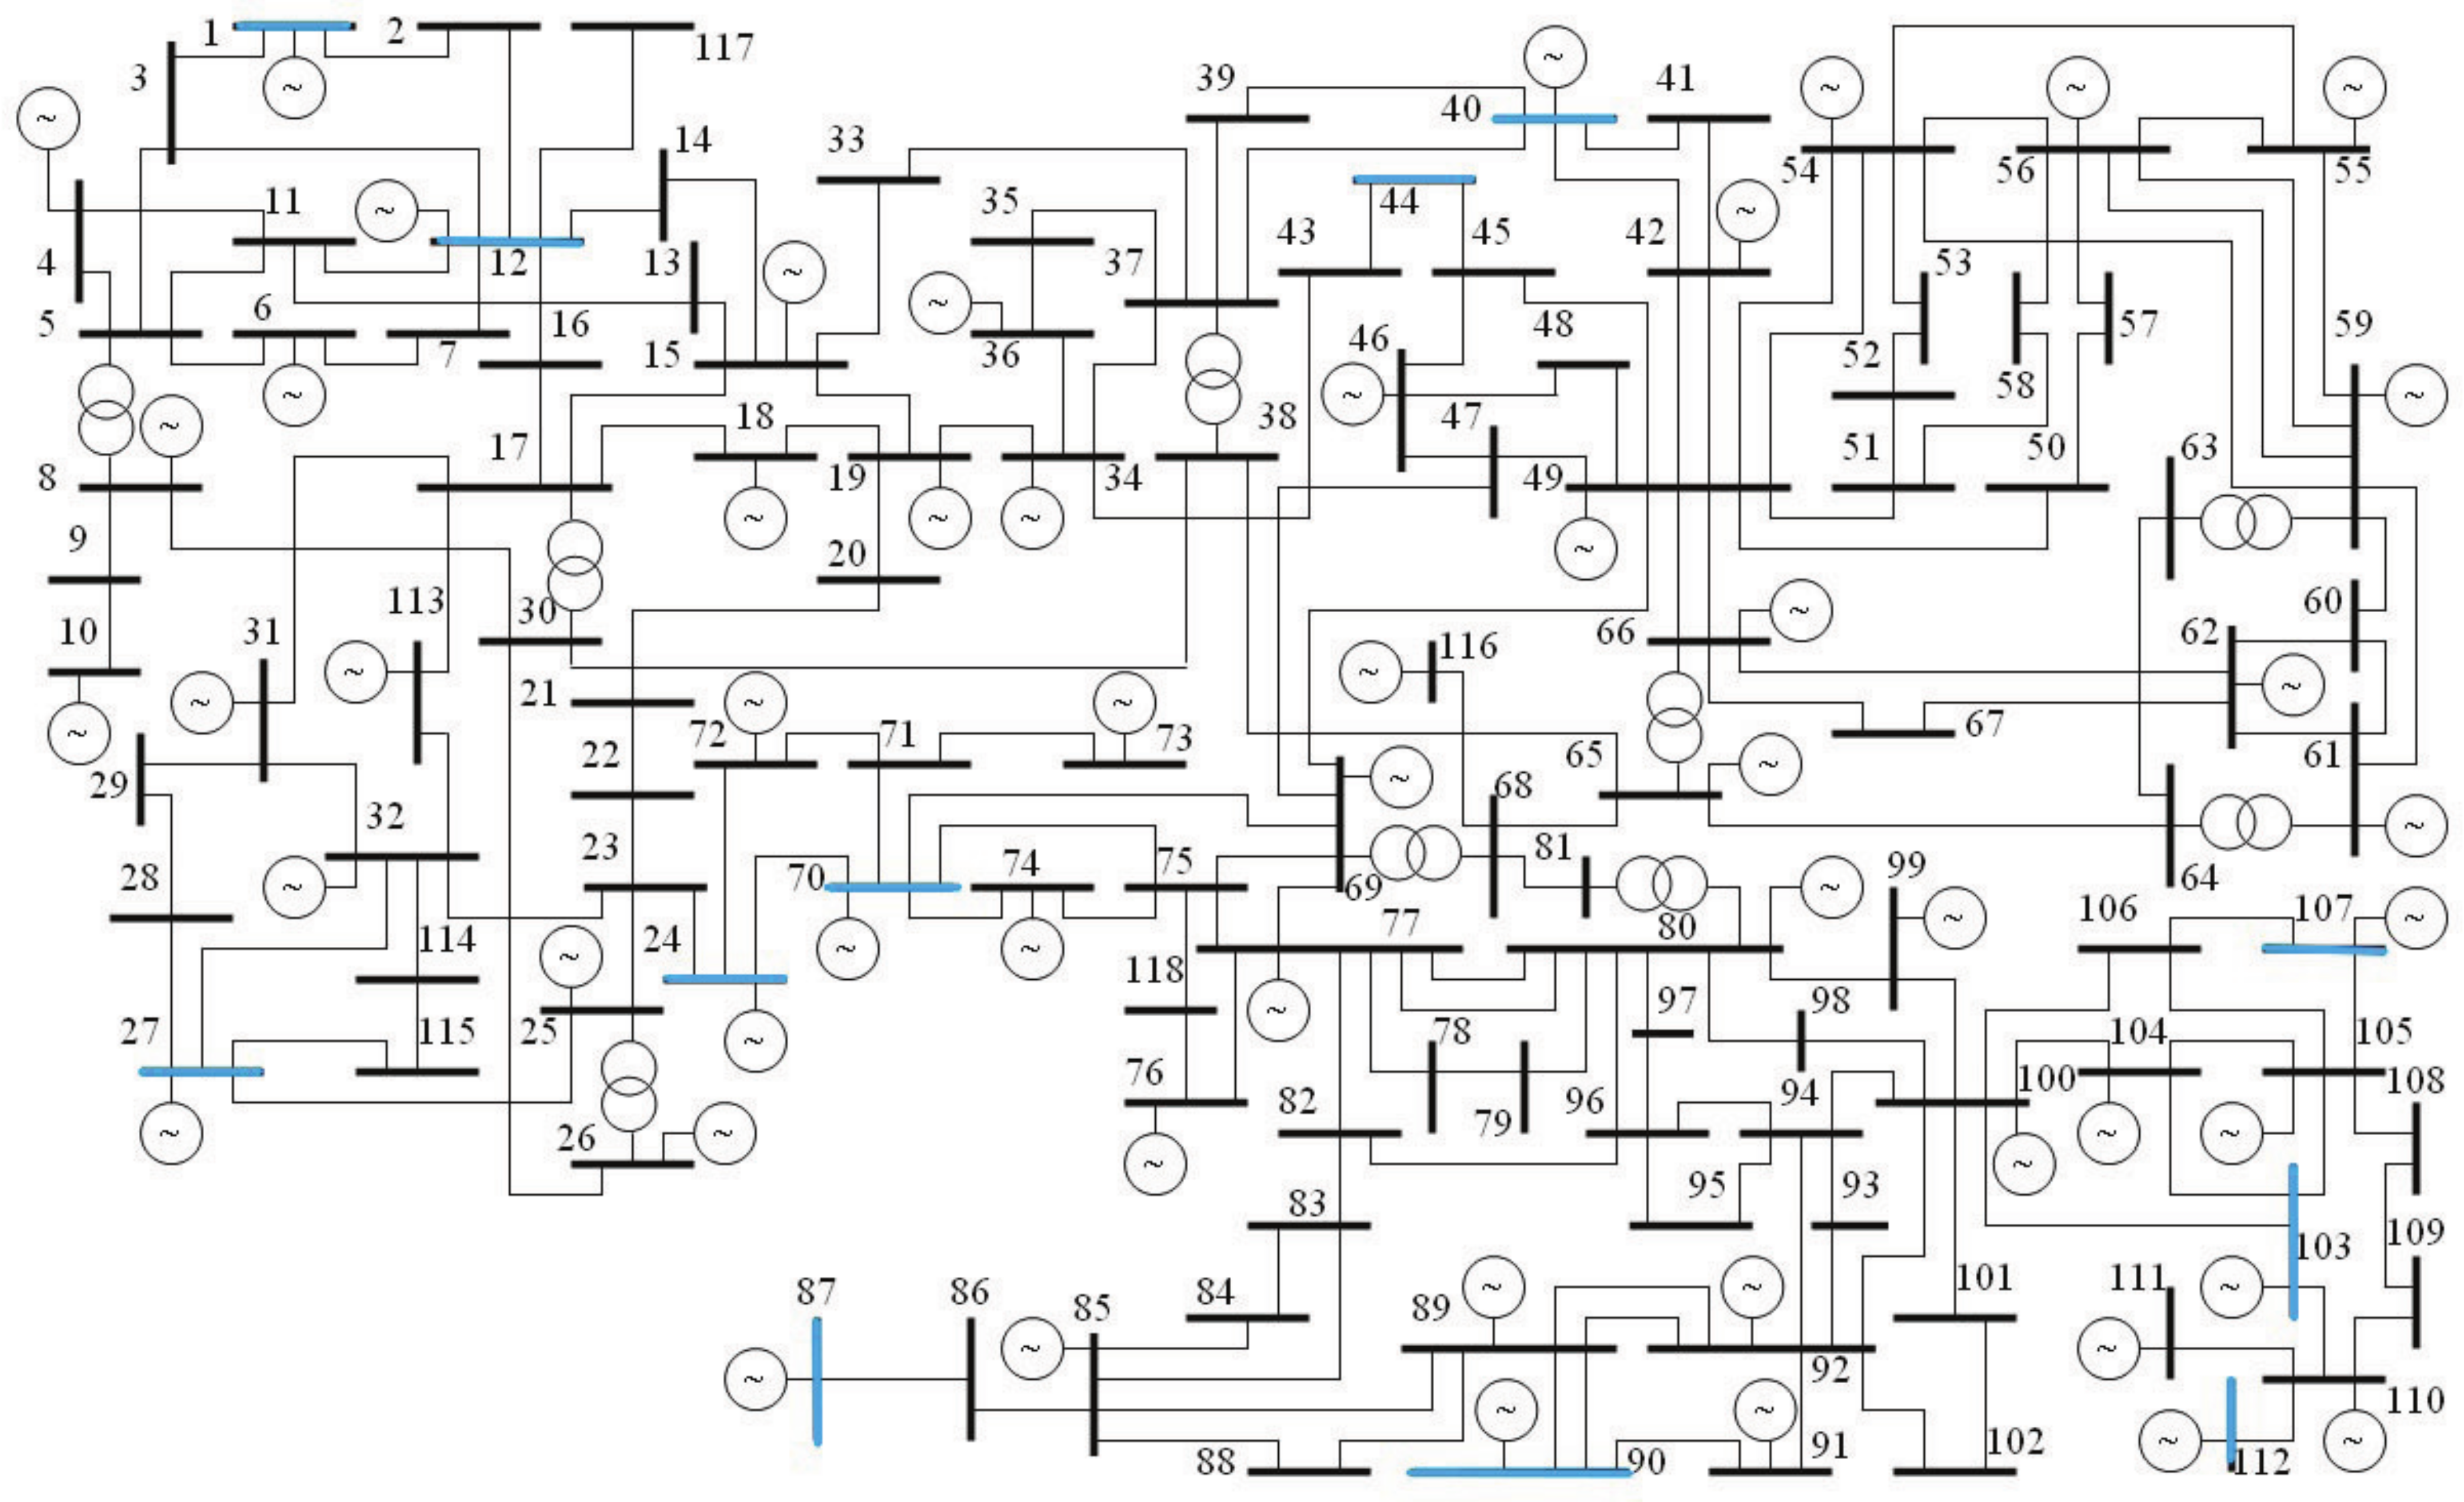
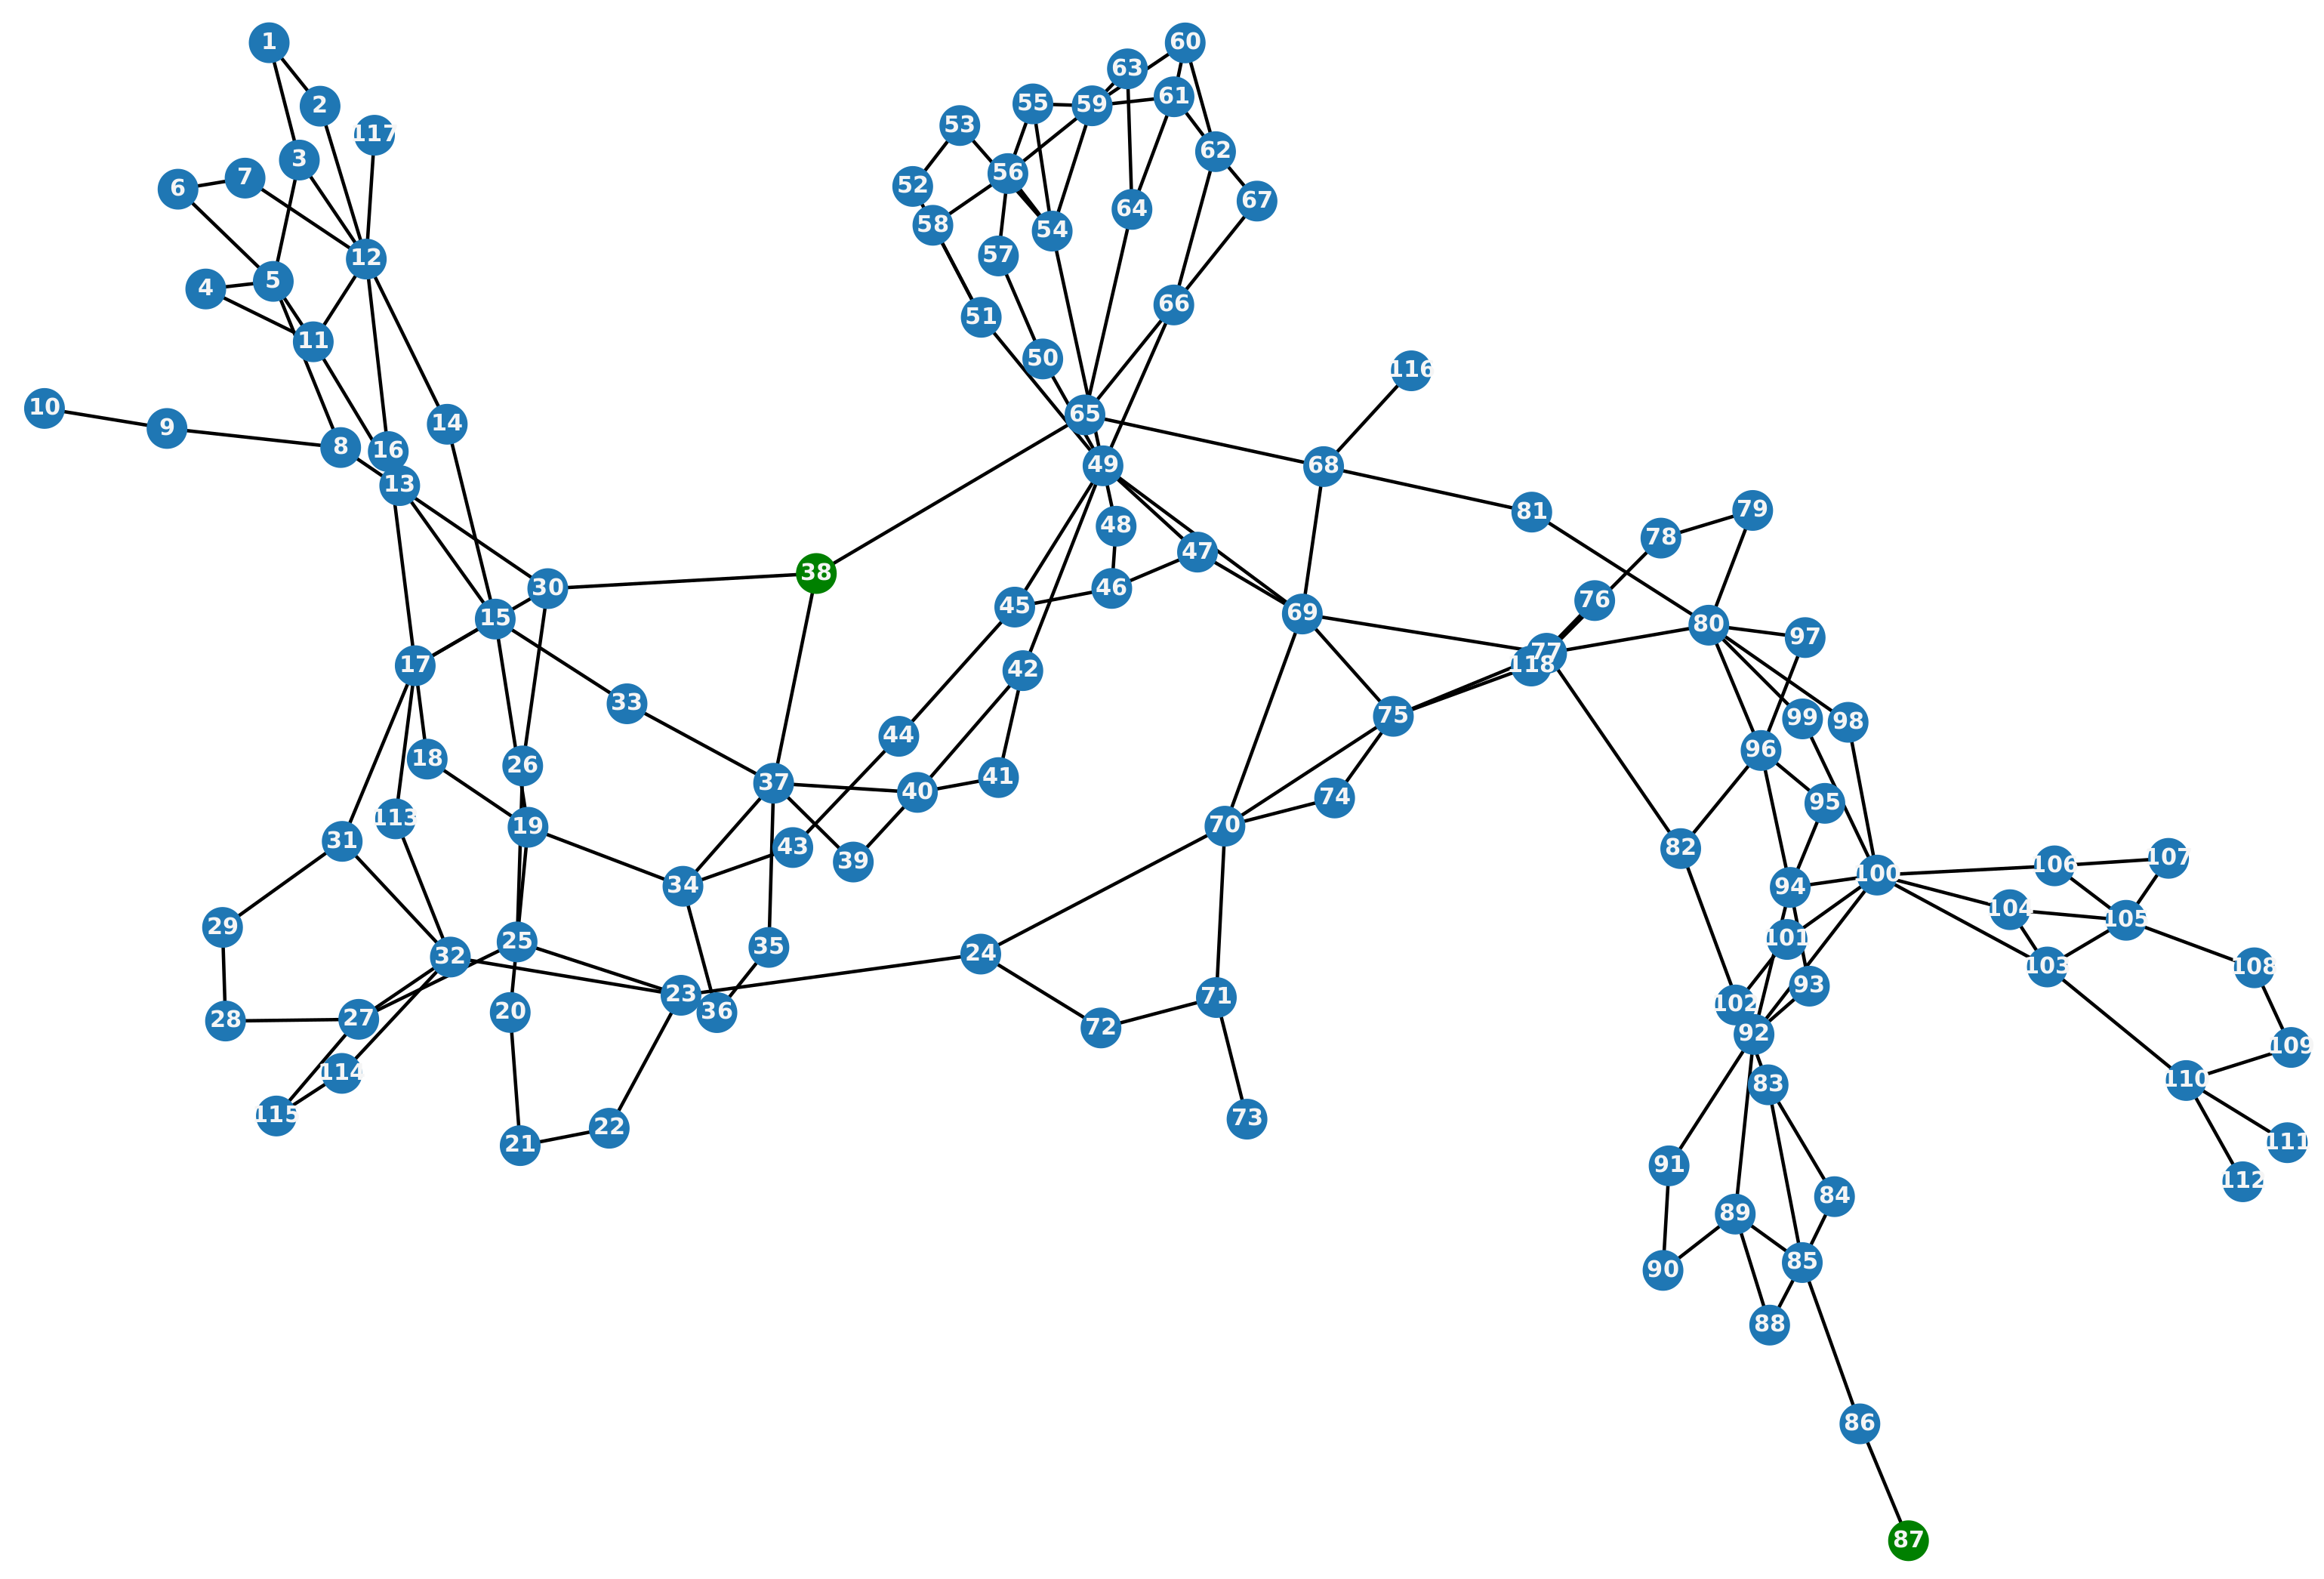
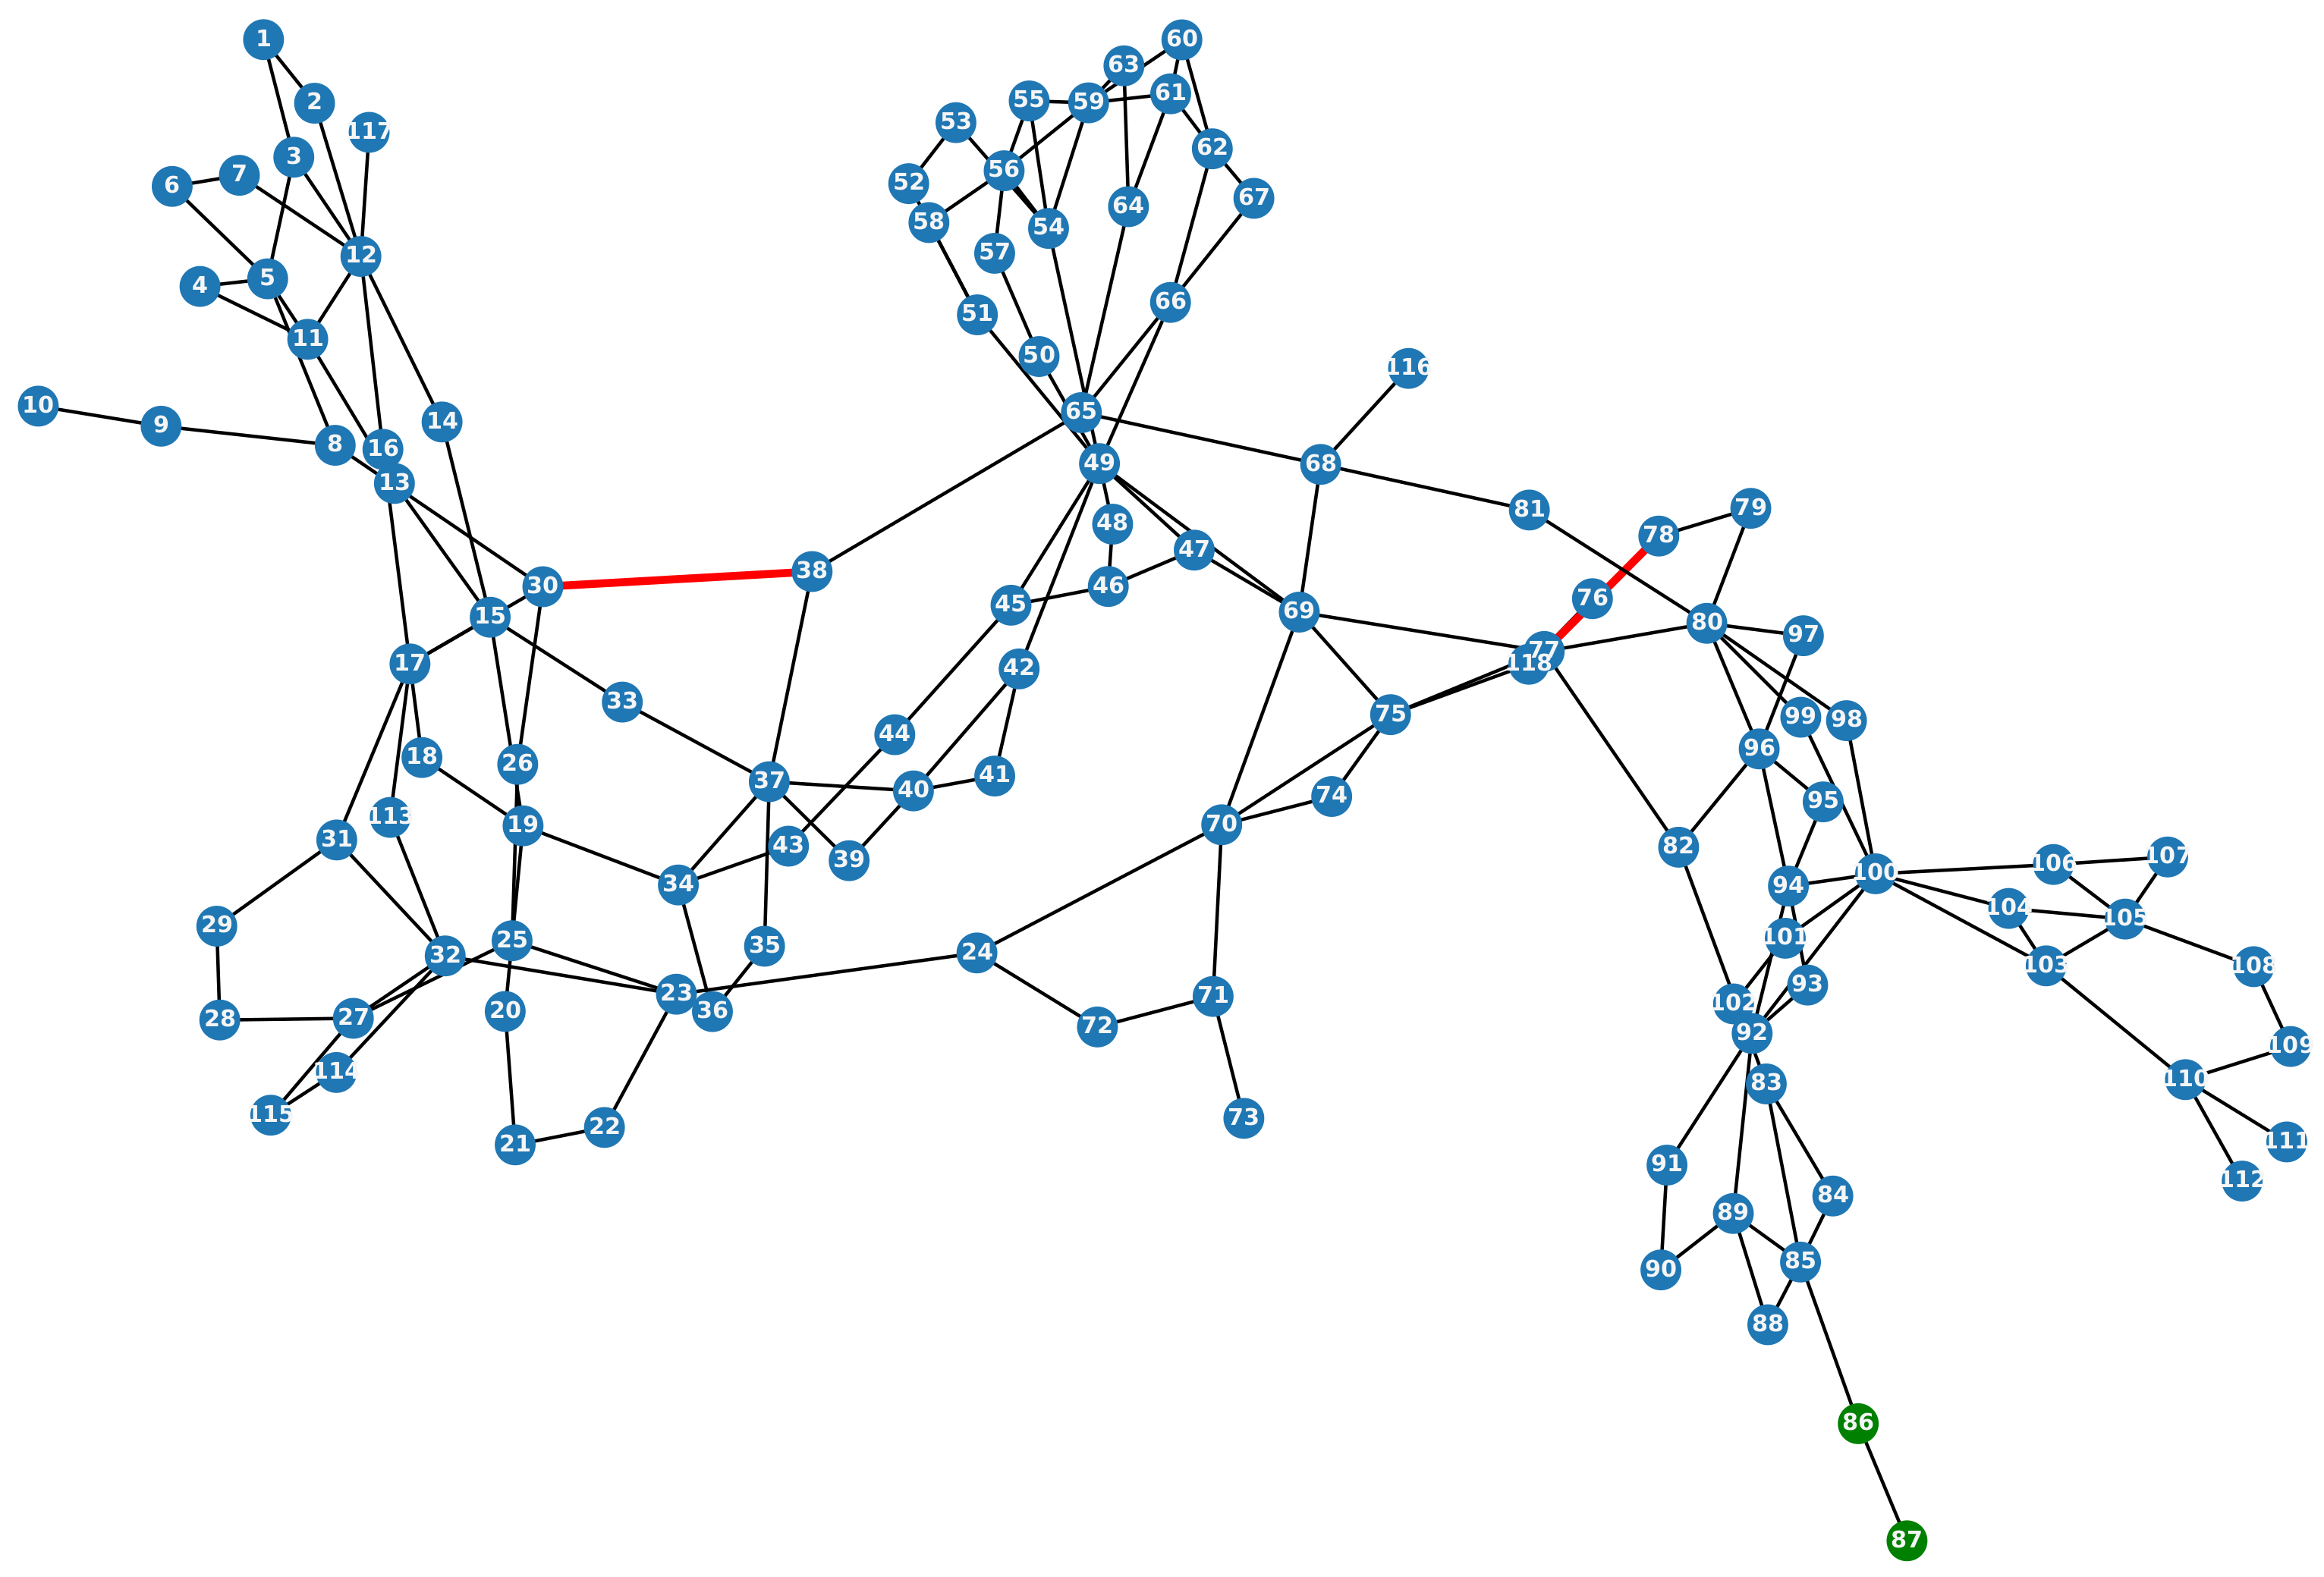
3.1. 118-bus System Normal Operation Study

In the first scenario, the optimal allocation of mobile MSSSC was conducted in the standard 118-bus system under normal operation condition. This illustrates the impacts of mobile MSSSC deployment in the existing networks. As shown in Figure 6 and Figure 7, the mobile MSSSC are installed on Line 30–38, Line 77–78, Line 85–88, Line 85–89, and Line 88–89, which are highlighted in red, during Season 1. It is noted that the deployment of the devices at a triangular shape circuit. The reason is that a power hub is located at Bus 87 that generates a large amount of power, causing network congestion at the bottleneck at Bus 85. By allocating the mobile MSSSC, it allows system operators to redirect the power flows from the right-side-adjacent lines to increase the power transfer capacity. The devices deployed on Line 85–89 can be relocated during Season 2 and Season 3.
The detailed results are shown in Table 2. It indicates that the N-1 security constraints cause a significant increase in the wind curtailments and system costs. With the mobile MSSSC deployment, there was a 42 GWh of wind curtailment reduction achieved in a year. This leads to 12,418 t of C O 2 emission reduction. The reason is that the mobile MSSSC allows operators to rebalance the power flows to increase the network power transfer availability. The total generation cost reduction reaches EUR 941k, which is caused by the increases in wind generation and the redispatching of thermal generating units. The system total cost is calculated from the summation of total generation costs and the mobile MSSSC costs. The deployment of 15 devices (5 locations) in Season 1 and 12 devices (4 locations) in seasons 2 and 3 require EUR 301k. Although the mobile MSSSC requires additional capital investment, there are EUR 640k of system total cost drops observed. The average utilisation of the transmission lines is introduced as the proportion of the number of lines that are over 10% of its capacity and the total number of the lines during a year. It is found that the mobile MSSSC effectively improves the utilisation of the lines, resulting in 0.4% annual utilisation improvement.

3.2. 1 × 150 MW Demand Connection Study

Recently, the large demand connection, such as data centres and green hydrogen facilities, is a huge challenge for power system planners due to the existing network constraints. The transmission line thermal overload issues may result in delays in the demand connection and the inefficiency of demand allocation, leading to financial losses. Specifically in Ireland, the expansion of data centres is a huge challenge for Irish system operators to deliver the power and achieve the 2030 climate target [51].
Therefore, the study results of 1 × 150 MW demand connection at one location are conducted. It envisages that the mobile MSSSC solution can facilitate the large demand allocation planning by balancing the power flows.
For the 150 MW single load connection scenario, Figure 8 shows that the load is located at Bus 87 when no mobile MSSSC is installed in the system. Additionally, it is noticed that no devices are needed in Season 2 and the demand is allocated at Bus 87 as well. In Figure 9, Line 30–38 is identified for mobile MSSSC deployment, and the new load is also placed at Bus 87 during seasons 1 and 3. The unchanged demand location is due to the large wind power output and low-cost thermal units at Bus 87 delivering the power to the new demand.
Table 3 shows the detailed results of 1 × 150 MW load connection study. It is found that the wind curtailment is zero. This means that the wind energy curtailment can be avoided by installing new demands, such as an energy storage system. The deployment of mobile MSSSC can effectively reduce generation costs. With the deployment of mobile MSSSC on Line 30–38, EUR 131.59k of annual generation costs are saved. Although this requires an EUR 41k investment per annum for the devices, this enables total system operation cost to decrease by EUR 90.89k in a year. The redispatch of thermal generators causing slight transmission line utilisation is observed, but it can be neglected compared to its benefits.

3.3. 2 × 75 MW Demand Connection Study

Following the development of flexible energy storage system, mid-scale, movable facilities, such as mobile battery energy storage [52] and magnetic energy storage [53], are expected to provide flexible services to the grid. Considering the mobile energy storage system as system loads, it is understood that the deployment locations of the facilities have notable effects on the grid, Thus, a study was conducted to study the coordination of the optimal placement of mobile MSSSC and multiple demands. In this case, 2 × 75 MW loads were assumed to be connected to the grid at two different locations.
For the new 2 × 75 MW demands connection scenario, Figure 10 shows that the new 2 × 75 MW demands are supposed to be placed at Bus 38 and Bus 87 without any mobile MSSSC deployment. In Figure 11, two devices are installed on Line 30–38 and Line 77–78, and the new demands are located at Bus 86 and Bus 87 during Season 1 and Season 3. In Season 2, the new demands are suggested to be placed at Bus 86 and Bus 87, but the devices are only deployed on Line 77–78, as shown in Figure 12. Similarly, this allows system operators to redeploy the rest of the devices for other applications.
Table 4 shows the detailed results of the 2 × 75 MW load connection study. There are 5389 MWh wind curtailment reduction in a year by using mobile MSSSC, leading to 1594 t of C O 2 avoidance. A reduction of EUR 379k of system annual generation costs can be achieved with EUR 111k annual investment for mobile MSSSC deployment. This results in EUR 268k of annual system total operation costs reduction. While a slight reduction of transmission line utilisation is observed due to the redispatch of generators, it is understood to neglect the negative impacts on the utilisation of the lines compared to the significant benefits of mobile MSSSC.
Furthermore, it is found that the separated allocation of the demand leads to increases of wind curtailments and total generation costs. This means that the best demand connection strategy is to place the large demand close to the RES generators or low-cost generators to avoid network congestion. Additionally, it is understood that the deployment of mobile MSSSC can support system operators to find the optimal placement of new demands, as well as to mitigate the negative effects of new demands connection with low costs.

3.4. New RES Connection Study

According to Ireland’s Climate Action Plan, the proportion of renewable electricity is expected to increase up to 80% of total electricity generation by 2030 [54]. This requires a large amount of RES generation connection to the grid, causing network congestion issues. It envisages that the mobile MSSSC can support the RES connection to mitigate the network congestion. Therefore, the new RES connection case study is conducted to investigate the impact of mobile MSSSC allocation on the new 1 × 150 MW RES connection.
In Figure 13, the new RES generating unit is initially supposed to be deployed at Bus 32, but it is found that Bus 116 is a better location with mobile MSSSC placement in the network during Season 1. There are nine lines needed for mobile MSSSC installation, including Line 30–38, Line 23–24, Line 23–32, Line 77–78, Line 82–83, Line 85–88, Line 85–89, Line 88–89, and Line 89–92. During Season 2, Bus 77 was initially identified for RES generation connection without mobile MSSSC. With four sets of devices (12 devices in total) deployed on Line 77–78, Line 85–88, Line 85–89, and Line 88–89, the RES generation is suggested to be allocated at Bus 116, as shown in Figure 14. Figure 15 shows that the RES generation should be connected at Bus 27 without any device deployment. When mobile MSSSC devices are installed on Line 30–38, Line 77–78, Line 82–83, Line 85–88, Line 85–89, Line 88–89, and Line 89–92, the RES generation is advised to be connected at Bus 116. The rest of the devices can be applied to support short-term network reinforcement and maintenance projects during Season 2 and Season 3. Additionally, it is noted that a number of devices are installed in the southeast region. This is caused by the large amounts of power generated from the power hub at Bus 87. By installing the mobile MSSSC, the system operators can manage the power flows from the south, unlocking the constrained energy transfer capacity.
Table 5 shows the detailed results of the 1 × 150 MW RES generating unit connection study. There are 55,874 MWh wind curtailment avoidances achieved by deploying mobile MSSSC, leading to 16,528 t C O 2 emission avoidance in a year. Additionally, the increases in wind power output and redispatch of generators result in EUR 950k system generation cost saving with EUR 444k of investment cost for mobile MSSSC. Hence, the reduction of system annual operation costs is EUR 507k. Meanwhile, a negligible net negative impact on the utilisation of the lines is observed. This may be caused by the redispatch of generators.
Consequently, the mobile MSSSC can significantly reduce the network wind curtailment, system generation cost, and C O 2 emissions caused by the new RES generator connection. It allows system planners to facilitate the RES connections with a short lead time and low cost.

4. Sensitivity Analysis

Conventional thermal power plants use fossil fuels, such as coal, peat, oil, and natural gas, to generate electricity. The cost parameters of thermal generators are caused by the different fuel types of the generators. Hence, the variants of the fossil fuel prices may affect the generator dispatching, causing various network issues, and mobile MSSSC allocations. Therefore, a sensitivity analysis was conducted to investigate the impacts of the cost of generators on the deployment locations of mobile MSSSC solutions.
It is understood that the power outputs of low-cost generating units are usually at their maximum capacity. Thus, the power cost changes of these units have significant impacts on the system performance. As a result, the generating units at Bus 8, Bus 25, Bus 46, Bus 49, Bus 62, Bus 65, Bus 77, and Bus 99 are targeted. In addition, it is noted that the sensitivity analysis focuses on the Season 2 data, and the results of the 118-bus system normal operation study are considered as the reference.
In Table 6, the effects of generator costs on the system operation and the mobile MSSSC placement are presented. It indicates that 8.02 GWh and 8.05 GWh of wind curtailment reduction are achieved when the targeted generators’ costs are reduced by 10% and 5%, respectively. This results in 2373 t and 2381 t of C O 2 avoidance, as well as EUR 218k and EUR 232k of total generation cost reduction with 10% and 5% of targeted generator cost, drops, respectively. It identified three deployment locations, which are Line 77–78, Line 85–88, and Line 88–89, requiring EUR 88k of investment, This results in EUR 130k and EUR 144k of system operation cost reduction as 10% and 5% of targeted generator cost drops. When the targeted generators’ cost increases by 5%, 9.37 GWh of wind curtailment, 2772 t of C O 2 emission, EUR 365k of total generation cost, and EUR 218k of system operation cost reduction are observed. This needs EUR 147k of investment for 15 devices deployment on Line 77–78, Line 85–88, Line 85–89, and Line 88–89. Moreover, 11.13 GWh of wind energy, 3293 t of C O 2 emission, EUR 417k of total generation cost, and EUR 240k of system cost are saved when 10% of the targeted generator costs increase by deploying 18 devices on Line 6–7, Line 77–78, Line 85–88, Line 85–89, Line 88–89, and Line 114–115. The deployment location changes of the mobile MSSSCs are caused by the system needs and the generating units redispatching. This implies that the mobile MSSSC solution allows system operators to manage the network constraints caused by the variations of the generator cost, as well as to facilitate the RES integration.
Figure 16 shows that the cost reduction of targeted generating units has limited impacts on the wind curtailment reduction. The reason is that the cost reduction of targeted units has limited effects on the power output of these units since they are already at their maximum power output in most periods. When the generator costs increase, the zero-cost wind power is used to replace the power generated from the high-cost generators. It results in significant wind curtailment reductions. The growth of total generation cost is observed with the increasing cost of targeted generators. This is caused by the increasing shares of wind power. Similarly, the system cost increases with the growth of targeted generators’ costs.
In conclusion, the generator cost changes may cause generation redispatching and network congestion which will affect the optimal deployment locations of mobile MSSSC. It indicates that more installation of the devices is suggested to facilitate the RES integration by redirecting the power flows.

5. Conclusions and Future Works

5.1. Conclusions

The proposed tool has been presented in this paper to optimally allocate the mobile MSSSC in transmission networks. The tool is expected to provide effective indicators to TSOs, specifically Irish system operators, in planning the transmission network. The main findings shown in this dissertation are as follows:
  • The deployment of mobile MSSSC can effectively reduce the RES curtailment, C O 2 emissions, system generation cost, and system total cost. It also has positive impacts on the existing asset utilisation improvement.
  • The presence of new demand should be primarily placed close to RES generating units or low-cost generators. The separation of the large demand deployment may have different impacts on the network congestion, compared to a single large demand connection.
  • With optimally allocated mobile MSSSC, the high system operation cost, as well as the growth of wind curtailment caused by new demands connections, can be effectively mitigated.
  • The additional RES connection can result in severe network congestion and significant wind curtailment due to the limited network transfer capacity. The mobile MSSSC can effectively facilitate the RES connections by optimally allocating the RES connection location as well as rebalancing the power flows.
  • The tool can be used to investigate the optimal deployment locations of new demand, such as data centres or power-to-gas facilities, and RES connections, following the coordination with mobile MSSSC deployment.
  • The variations in generating unit cost affect the optimal deployment locations of mobile MSSSC. The more expensive the thermal units are, the more the RES curtailment reduction is economically justifiable.

5.2. Future Work

Based on this study, there are several paths that the proposed mobile MSSSC allocation research can be extended to, as follows:
  • The detailed multiple numbers of mobile MSSSC allocation tool should be investigated. This is important for system planners to avoid extensive civil engineering works by reducing the installation locations.
  • The mobile MSSSC deployment strategy under unit commitment conditions should be investigated since these devices can provide flexibility for the UC problem.
  • An ACOPF model for mobile MSSSC deployment location optimisation tool should be investigated.
  • The investigation of other FACTS allocation strategies adapted with linear operation model methods can be performed [36].
  • The impact of mobile MSSSC transportable constraints, including re-deployment speed and moving range, on the deployment strategy should be investigated. It should be considered as a fast-react force to mitigate sudden risks, enhancing the stability and reliability of the grid.
  • The impacts of mobile MSSSC placement on the extreme weather event management and post-contingency should be investigated. The impact of mobile MSSSC demolishing on the originally installed lines should be considered to prevent additional risks to the system.
  • The impacts of the application of mobile MSSSC for voltage control [26] and uncertain demand mitigation on the deployment location should be investigated [12]. The short-circuit analysis should be considered in MSSSC deployment strategy.
  • The detailed and customised cost–benefits analysis can justify the results of optimal allocation of mobile MSSSC, as well as the best investment decision for system planners.

Author Contributions

Conceptualisation, Z.Z.; data cleaning, Z.Z.; investigation, Z.Z.; methodology, Z.Z. and A.S.; software, Z.Z. and A.S.; validation, Z.Z. and A.S.; visualisation, Z.Z.; writing—original draft preparation, Z.Z.; writing—review and editing, Z.Z. and A.S.; supervision, A.S. All authors have read and agreed to the published version of the manuscript.

Funding

The work of Alireza Soroudi has emanated from research supported (in part) by University College Dublin under the UCD grant number OBRSS-62184.

Institutional Review Board Statement

Not applicable.

Informed Consent Statement

Not applicable.

Data Availability Statement

Any data presented in this paper may be obtained by contacting the authors.

Acknowledgments

The work carried out by Zhehan Zhao was partly supported by Mark Norton and Catherine Winning from Smart Wires Grid Europe who provided the mobile MSSSC use cases guidance.

Conflicts of Interest

The authors declare no conflict of interest.

Abbreviations

The following abbreviations are used in this manuscript:
RESRenewable energy source
TSOTransmission system operator
FACTSFlexible AC transmission systems
MSSSCModular static synchronous series compensator
IGBTIsolated-gate bipolar transistor
SNSPSystem non-synchronous penetration
PFCPower flow controller
NRNewton–Raphson
GSOGroup searcher optimization
OPFOptimal power flow
LPLoad pattern
WPWind pattern
GSHFGeneration shift factor
LODFLine outage distribution factor
NPVNet present value
CBACost–benefit analysis
OMOperation and maintenance
Unit
%Percentage
EUREuro
ggram
kWhKilowatt hour
MWMegawatts
MWhMegawatt hour
GWhGigawatt hour
MMillion
kThousand
tTonne

Appendix A

The LD and WD analysis results that are described in Section 2.4 are presented in this section.The red line is the centre of the cluster in the following figures.
Figure A1. Season 1 demand data clustering.
Energies 15 03878 g0a1
Figure A2. Season 2 demand data clustering.
Energies 15 03878 g0a2
Figure A3. Season 3 demand data clustering.
Energies 15 03878 g0a3
Figure A4. Season 1 wind generation data clustering.
Energies 15 03878 g0a4
Figure A5. Season 2 wind generation data clustering.
Energies 15 03878 g0a5
Figure A6. Season 3 wind generation data clustering.
Energies 15 03878 g0a6

References

  1. Smart Wires Inc. SmartValve™. Available online: https://www.smartwires.com/smartvalve/ (accessed on 25 April 2022).
  2. Bojorquez, B.; Santos Lopez, E.; Longoria, M.; Babaei, S. Advantages of M-SSSC Devices over Traditional Series Compensation. In Proceedings of the 30th CIGRE Greece National Conference “e-Session 2020”, Athens, Greece, 26–30 November 2020. [Google Scholar]
  3. Zavadil, R. Comparative Performance of Smart Wires SmartValve with EHV Series Capacitor: Implications for Sub-Synchronous Resonance (SSR). 2018. Available online: https://www.smartwires.com/tag/sub-synchronous-resonance/ (accessed on 25 April 2022).
  4. Bie, Z.; Lin, Y.; Li, G.; Li, F. Battling the extreme: A study on the power system resilience. Proc. IEEE 2017, 105, 1253–1266. [Google Scholar] [CrossRef]
  5. Kreikebaum, F.; Das, D.; Yang, Y.; Lambert, F.; Divan, D. Smart Wires—A distributed, low-cost solution for controlling power flows and monitoring transmission lines. In Proceedings of the 2010 IEEE PES Innovative Smart Grid Technologies Conference Europe (ISGT Europe), Gothenburg, Sweden, 11–13 October 2010; pp. 1–8. [Google Scholar]
  6. INEA. Flexitranstore. Available online: https://ec.europa.eu/inea/en/horizon-2020/projects/h2020-energy/grids-storage/flexitranstore (accessed on 25 April 2022).
  7. Flexitranstore. Demonstration 4: Power Flow Control Devices—Power Guardian. Available online: http://www.flexitranstore.eu/Demo-4 (accessed on 25 April 2022).
  8. Khan, S.; Henein, S.; Brunner, H. Optimal Energy Interruption Planning and Generation Re-dispatch for Improving Reliability during Contingencies. In Proceedings of the 2020 IEEE Power & Energy Society Innovative Smart Grid Technologies Conference (ISGT), Washington, DC, USA, 17–20 February 2020; pp. 1–5. [Google Scholar]
  9. Ma, J.; Venkatesh, B. Integrating Net Benefits Test for Demand Response Into Optimal Power Flow Formulation. IEEE Trans. Power Syst. 2021, 36, 1362–1372. [Google Scholar] [CrossRef]
  10. Schneider, M.; Hoffrichter, A.; Puffer, R. Theoretical Potential of Dynamic Line Ratings for Congestion Management in Large-Scale Power Systems. In Proceedings of the 2019 IEEE Milan PowerTech, Milan, Italy, 23–27 June 2019; pp. 1–6. [Google Scholar] [CrossRef]
  11. Saavedra, R.; Street, A.; Arroyo, J.M. Day-Ahead Contingency-Constrained Unit Commitment With Co-Optimized Post-Contingency Transmission Switching. IEEE Trans. Power Syst. 2020, 35, 4408–4420. [Google Scholar] [CrossRef]
  12. Soroudi, A. Controllable transmission networks under demand uncertainty with modular FACTS. Int. J. Electr. Power Energy Syst. 2021, 130, 106978. [Google Scholar] [CrossRef]
  13. Kreikebaum, F.; Wang, A.; Broad, S. Integration of Series FACTS into Interconnect-scale Production Cost and Long-term Planning Tools. In Proceedings of the CIGRE, Paris, France, 22–26 August 2016. [Google Scholar]
  14. Fenlon, R. An Application of Modular FACTS Devices to Relieve Transmission Constraints and Accelerate Wind Farm Connections and Firm Access. In Proceedings of the 3rd E-Mobility Integration Symposium, 9th Solar & 18th Wind Integration Workshops, Dublin, Ireland, 14–18 October 2019; Available online: https://www.semanticscholar.org/paper/An-application-of-modular-FACTS-devices-to-relieve-Fenlon/9652973854949886a6c89381b64d31e6c0ff13d5 (accessed on 20 May 2022).
  15. Del Rosso, A.; Drewry, G.; Herman, J.; Green, B.; McGuiness, S. Evaluation of SmartValveTM Devices Installation at Central Hudson; Technical Report; Electric Power Research Institute (EPRI): Washington, DC, USA, 2020. [Google Scholar]
  16. Pungaliya, R.P. Assessing Transmission Bottlenecks for Renewable Energy Development in North Carolina. Master’s Thesis, Duke University, Durham, NC, USA, 2021. [Google Scholar]
  17. EirGrid. SmartValve Pilot Project. 2016. Available online: http://www.eirgridgroup.com/site-files/library/EirGrid/SmartWires-EirGrid-SmartValve-Pilot-Report.pdf (accessed on 25 April 2022).
  18. Transgrid. Victoria-NSW Interconnector Technology Will Unlock Additional Energy for 30,000 Homes. Available online: https://www.transgrid.com.au/media-publications/news-articles/victoria-nsw-interconnector-technology-will-unlock-additional-energy-for-30-000-homes (accessed on 25 April 2022).
  19. TÉCNICO, D. ASPECTOS TÉCNICOS, REGULATORIOS Y ECONÓMICOS DE LOS SISTEMAS FACTS DISTRIBUIDOS-JWG B4.C2.3. 2021. Available online: http://www.cigrecolombia.org/Documents/Memorias/Reporte%20t%C3%A9cnico%20B4.C2.3%20FACTS%20distribuidos%20SWs43.pdf (accessed on 25 April 2022).
  20. Abido, M. Power system stability enhancement using FACTS controllers: A review. Arab. J. Sci. Eng. 2009, 34, 153–172. [Google Scholar]
  21. Perez, R.; Oliveira, G.; Pereira, M.; Falcão, D.; Kreikebaum, F.; Ramsay, S. FACTS and D-FACTS: The Operational Flexibility Demanded by the Transmission Expansion Planning Task with Increasing RES. In Proceedings of the CIGRE, Paris, France, 24–29 August 2014; p. 1. [Google Scholar]
  22. Adepoju, G.; Sanusi, M.; Tijani, M. Application of SSSC to the 330kV Nigerian transmission network for voltage control. Niger. J. Technol. 2017, 36, 1258–1264. [Google Scholar] [CrossRef] [Green Version]
  23. Bekkala, A.C. Analysis and Synthesis of Smart Wires in an Electric Power System. Ph.D. Thesis, University of Minnesota, Minneapolis, MN, USA, 2018. [Google Scholar]
  24. APG. APG AND Smart Wires Sign Cooperation Agreement for Innovation Projects to Optimize the Load Flow in the Transmission Grid. Available online: https://www.apg.at/en/media-center/presse/2022/01/27/apg-und-smart-wires (accessed on 25 April 2022).
  25. Pourbabak, H.; Nudell, T.R.; Su, W. An Efficient Algorithm for Dispatch of Modular FACTS Devices in Transmission Planning. In Proceedings of the 2019 IEEE Power & Energy Society General Meeting (PESGM), Atlanta, GA, USA, 4–8 August 2019; pp. 1–5. [Google Scholar]
  26. Fenlon, R.; Norton, M. Planning of An Efficient Power System with The Use of Modular Static Synchronous Series Compensation to Enable Flexible Operational Services. In Proceedings of the CIRED 2020 Berlin Workshop (CIRED 2020), Online, 22–23 September 2020; pp. 270–273. [Google Scholar]
  27. Yan, P.; Sekar, A. Steady-state analysis of power system having multiple FACTS devices using line-flow-based equations. IEE Proc. Gener. Transm. Distrib. 2005, 152, 31–39. [Google Scholar] [CrossRef]
  28. Gerbex, S.; Cherkaoui, R.; Germond, A.J. Optimal Location of Multi-type FACTS Devices in A Power System by Means of Genetic Algorithms. IEEE Trans. Power Syst. 2001, 16, 537–544. [Google Scholar] [CrossRef]
  29. Ghahremani, E.; Kamwa, I. Optimal placement of multiple-type FACTS devices to maximize power system loadability using a generic graphical user interface. IEEE Trans. Power Syst. 2012, 28, 764–778. [Google Scholar] [CrossRef]
  30. Li, C.; Xiao, L.; Cao, Y.; Zhu, Q.; Fang, B.; Tan, Y.; Zeng, L. Optimal allocation of multi-type FACTS devices in power systems based on power flow entropy. J. Mod. Power Syst. Clean Energy 2014, 2, 173–180. [Google Scholar] [CrossRef] [Green Version]
  31. Lu, Z.; Li, M.; Tang, W.; Wu, Q. Optimal location of FACTS devices by a bacterial swarming algorithm for reactive power planning. In Proceedings of the 2007 IEEE Congress on Evolutionary Computation, Singapore, 25–28 September 2007; pp. 2344–2349. [Google Scholar]
  32. Marouani, I.; Guesmi, T.; Abdallah, H.H.; Ouali, A. Application of a multiobjective evolutionary algorithm for optimal location and parameters of FACTS devices considering the real power loss in transmission lines and voltage deviation buses. In Proceedings of the 2009 6th International Multi-Conference on Systems, Signals and Devices, Djerba, Tunisia, 23–March 2009; pp. 1–6. [Google Scholar]
  33. Jafarzadeh, J.; Haq, M.T.; Mahaei, S.M.; Farhadi, P. Optimal Placement of FACTS Devices Based on Network Security. In Proceedings of the 2011 3rd International Conference on Computer Research and Development, Shanghai, China, 11–13 March 2011; Volume 3, pp. 345–349. [Google Scholar]
  34. Soroudi, A.; Oconnell, B.; Kelliher, J.; Osullivan, J.; Kelly, B.; Walsh, M.; Kreikebaum, F.; Meyer, Y. Use of Power Flow Controllers to Enhance Transmission Network Utilisation on the Irish Transmission Network. arXiv 2019, arXiv:1911.06677. [Google Scholar]
  35. Sahraei-Ardakani, M.; Hedman, K.W. Computationally efficient adjustment of FACTS set points in DC optimal power flow with shift factor structure. IEEE Trans. Power Syst. 2016, 32, 1733–1740. [Google Scholar] [CrossRef]
  36. Rui, X.; Sahraei-Ardakani, M.; Nudell, T.R. Linear modelling of series FACTS devices in power system operation models. IET Gener. Transm. Distrib. 2021, 16, 1047–1063. [Google Scholar] [CrossRef]
  37. Sadat, S.A.; Rui, X. Computational Impacts of SVCs on Optimal Power Flow using Approximated Active-Set Interior Point Algorithm. In Proceedings of the 2021 North American Power Symposium (NAPS), College Station, TX, USA, 14–16 November 2021. [Google Scholar] [CrossRef]
  38. Zimmerman, R.D.; Murillo-S’anchez, C.E. MATPOWER User’s Manual, Version 7.1; Power Systems Engineering Research Center (PSerc): Tempe, AZ, USA, 2020. [Google Scholar] [CrossRef]
  39. Soroudi, A. Power System Optimization Modeling in GAMS; Springer: Cham, Switzerland, 2017; Volume 78. [Google Scholar]
  40. EirGrid Inc. Electricity Grid to Run on 75% Variable Renewable Generation Following Successful Trial. Available online: https://www.eirgridgroup.com/newsroom/electricity-grid-to-run-o/index.xml (accessed on 25 April 2022).
  41. ENTSO-E. 3rd ENTSO-E Guideline for Cost Benefit Analysis of Grid Development Projects; Report; ENTSO-E: Brussels, Belgium, 2021. [Google Scholar]
  42. Smart Wires Inc. Cost Benefit Analysis of SmartValve Projects. Available online: https://www.smartwires.com/webinars/cba-webinar/ (accessed on 25 April 2022).
  43. Hart, W.E.; Laird, C.D.; Watson, J.P.; Woodruff, D.L.; Hackebeil, G.A.; Nicholson, B.L.; Siirola, J.D. Pyomo-Optimization Modeling in Python; Springer: Cham, Switzerland, 2017; Volume 67. [Google Scholar]
  44. EirGrid Plc. System Data Qtr Hourly 2020. 2021. Available online: https://www.eirgridgroup.com/site-files/library/EirGrid/System-Data-Qtr-Hourly-2020-2021.xlsx (accessed on 25 April 2022).
  45. Al-Roomi, A.R. Power Flow Test Systems Repository. Available online: https://al-roomi.org/power-flow (accessed on 25 April 2022).
  46. Tsuchida, T.B.; Gramlich, R. Improving Transmission Operation with Advanced Technologies: A Review of Deployment Experience and Analysis of Incentives; Technical Report; The Brattle Group: Boston, MA, USA, 2019. [Google Scholar]
  47. SEAI. Conversion Factors: Emission Factor. Available online: https://www.seai.ie/data-and-insights/seai-statistics/conversion-factors/ (accessed on 25 April 2022).
  48. Illinois Institute of Technology. JEAS IEEE118. Available online: http://motor.ece.iit.edu/data/JEAS_IEEE118.doc (accessed on 25 April 2022).
  49. Tavenard, R.; Faouzi, J.; Vandewiele, G.; Divo, F.; Androz, G.; Holtz, C.; Payne, M.; Yurchak, R.; Rußwurm, M.; Kolar, K.; et al. Tslearn, A Machine Learning Toolkit for Time Series Data. J. Mach. Learn. Res. 2020, 21, 1–6. [Google Scholar]
  50. Smart Wires Inc. Use Cases. Available online: https://www.smartwires.com/case-studies/ (accessed on 25 April 2022).
  51. Government of Ireland. Government Statement on The Role of Data Centres in Ireland’s Enterprise Strategy. Available online: https://enterprise.gov.ie/en/Publications/Publication-files/Government-Statement-Data-Centres-Enterprise-Strategy.pdf (accessed on 25 April 2022).
  52. Saboori, H.; Jadid, S.; Savaghebi, M. Optimal management of mobile battery energy storage as a self-driving, self-powered and movable charging station to promote electric vehicle adoption. Energies 2021, 14, 736. [Google Scholar] [CrossRef]
  53. Ren, L.; Xu, Y.; Zuo, W.; Shi, X.; Jiao, F.; Liu, Y.; Deng, J.; Li, J.; Shi, J.; Wang, S.; et al. Development of a movable HTS SMES system. IEEE Trans. Appl. Supercond. 2015, 25, 1–9. [Google Scholar] [CrossRef]
  54. Government of Ireland. Climate Action Plan 2021. Available online: https://www.gov.ie/en/publication/6223e-climate-action-plan-2021/ (accessed on 25 April 2022).
Figure 3. The architecture of the DCOPF tool.
Energies 15 03878 g003
Figure 4. EEE 118-bus test system; blue buses indicate the added wind generation location [45].
Energies 15 03878 g004
Figure 5. 2021 Ireland’s all-island demand and wind generation data.
Energies 15 03878 g005
Figure 6. The optimal mobile MSSSC allocation during Season 1. Red lines indicate the mobile MSSSC deployment locations.
Energies 15 03878 g006
Figure 7. The optimal mobile MSSSC allocation during Season 2 and Season 3. Red lines indicate the mobile MSSSC deployment locations.
Energies 15 03878 g007
Figure 8. The 1 × 150 MW demand location during seasons 1, 2, and 3 without mobile MSSSC. Green node indicates the load connection location.
Energies 15 03878 g008
Figure 9. The optimal 1 × 150 MW demand and mobile MSSSC allocation during seasons 1 and 3. Red lines indicate the mobile MSSSC deployment locations; green node indicates the load connection location.
Energies 15 03878 g009
Figure 10. The 2 × 75 MW demand location during seasons 1, 2, and 3 without mobile MSSSC. Green node indicates the load connection location.
Energies 15 03878 g010
Figure 11. The optimal 2 × 75 MW demand and mobile MSSSC allocation during seasons 1 and 3. Red lines indicate the mobile MSSSC deployment locations; green node indicates the load connection location.
Energies 15 03878 g011
Figure 12. The optimal 2 × 75 MW demand and mobile MSSSC allocation during Season 2. Red lines indicate the mobile MSSSC deployment locations; green node indicates the load connection location.
Energies 15 03878 g012
Figure 13. The optimal 1 × 150 MW RES and mobile MSSSC allocation during Season 1. Red lines indicate the mobile MSSSC deployment locations; light green node indicates the RES location without devices, and orange node indicates the RES location with devices.
Energies 15 03878 g013
Figure 14. The optimal new 1 × 150 MW RES and mobile MSSSC allocation during Season 2. Red lines indicate the mobile MSSSC deployment locations; light green node indicates the RES location without devices, and orange node indicates the RES location with devices.
Energies 15 03878 g014
Figure 15. The optimal new 1 × 150 MW RES and mobile MSSSC allocation during Season 3. Red lines indicate the mobile MSSSC deployment locations; the light green node indicates the RES location without devices, and the orange node indicates the RES location with devices.
Energies 15 03878 g015
Figure 16. The generator costs sensitivity analysis results.
Energies 15 03878 g016
Table 1. Summary of optimal FACTS allocation tool.
AC ToolDC ToolObjectives
Line-flow-based model with NR Algorithm [27]GAMS-based tool [34]Power system loadability maximisation [28]
Genetic algorithms [28] Reactive power planning [31]
Generic graphical-user-interface-based tool [28] Power flow entropy minimisation [30]
Bacterial swarming algorithm [31] Real power loss minimisation [32]
GSO Algorithm [30] Voltage deviation minimisation [32]
Non-dominated sorting genetic algorithm [32] Network security maximisation [33]
Economic function [34]
Table 2. Mobile MSSSC allocation simulation results.
SeasonCaseWind Curtailment (MWh)Gen Cost (EUR M)Devices Cost (EUR k)Total Cost (EUR M)Network Utilisation (%)
Season 1 (Winter)Base Case19,26758.68058.6856.8
N-1 Security70,18259.72059.7254.2
Automatic Method51,89159.3610359.4655.6
Season 2 (Summer)Base Case104384.77084.7752.2
N-1 Security18,15385.36085.3655.5
Automatic Method10,44885.1011885.2152.0
Season 3 (Spring and Autumn)Base Case353854.98054.9854.3
N-1 Security54,68155.89055.8952.7
Automatic Method38,69455.578155.6553.6
Table 3. Mobile MSSSC allocation simulation results with 1 × 150 MW demand.
SeasonCaseWind Curtailment (MWh)Gen Cost (EUR M)Devices Cost (EUR k)Total Cost (EUR M)Network Utilisation (%)
Season 1 (Winter)Base Case063.17063.1758.2
N-1 Security063.36063.3655.3
Automatic Method063.282163.3055.2
Season 2 (Summer)Base Case091.73091.7354.8
N-1 Security091.77091.7750.5
Automatic Method091.77091.7750.5
Season 3 (Spring and Autumn)Base Case059.58059.5857.8
N-1 Security059.69059.6952.8
Automatic Method059.632059.6552.3
Table 4. Mobile MSSSC allocation simulation results with 2 × 75 MW demand.
SeasonCaseWind Curtailment (MWh)Gen Cost (EUR M)Devices Cost (EUR k)Total Cost (EUR M)Network Utilisation (%)
Season 1 (Winter)Base Case88563.19063.1958.2
N-1 Security623563.57063.5756.0
Automatic Method107763.354163.3955.5
Season 2 (Summer)Base Case091.73091.7354.7
N-1 Security091.83091.8351.9
Automatic Method091.792991.8250.9
Season 3 (Spring and Autumn)Base Case059.58059.5858.1
N-1 Security23159.80059.8053.6
Automatic Method059.684059.7253.4
Table 5. Mobile MSSSC allocation simulation results with 1 × 150 MW RES.
SeasonCaseWind Curtailment (MWh)Gen Cost (EUR M)Devices Cost (EUR k)Total Cost (EUR M)Network Utilisation (%)
Season 1 (Winter)Base Case24,98153.86053.8656.1
N-1 Security75,00154.75054.7552.7
Automatic Method5061854.3718554.5654.3
Season 2 (Summer)Base Case76477.74077.7453.6
N-1 Security17,50278.26078.2651.7
Automatic Method919078.0411878.1650.6
Season 3 (Spring and Autumn)Base Case189250.21050.2155.7
N-1 Security54,69451.03051.0353.4
Automatic Method31,51550.6814150.8252.4
Table 6. Mobile MSSSC allocation sensitivity analysis results.
The % Change of Targeted Gen CostWind Curtailment Reduction (MWh) CO 2 Avoidance (t)Gen Cost Reduction (EUR k)Devices Cost (EUR k)Total Cost Reduction (EUR k)MSSSC Allocations
−10%8023237321888130 L 77 78 , L 85 88 , and L 88 89
−5%8049238123288144 L 77 78 , L 85 88 , and L 88 89
0%77052279258118141 L 30 38 , L 77 78 , L 85 88 , and L 88 89
5%93732772365147218 L 30 38 , L 77 78 , L 85 88 , L 85 89 , and L 88 89
10%11,1343293417176240 L 6 7 , L 77 78 , L 85 88 , L 85 89 , L 88 89 , and L 114 115
Publisher’s Note: MDPI stays neutral with regard to jurisdictional claims in published maps and institutional affiliations.

