Article

Effects of Heating on the Binding of Rare Earth Elements to Humic Acids

1
Key Laboratory of Tectonics and Petroleum Resources of Ministry of Education, School of Earth Resources, China University of Geosciences, Wuhan 430074, China
2
China National Administration of Coal Geology (CNACG), Beijing 100038, China
3
Key Laboratory of Marine Geology and Environment, Institute of Oceanology, Chinese Academy of Sciences, Qingdao 266071, China
*
Author to whom correspondence should be addressed.
Energies 2022, 15(19), 7362; https://doi.org/10.3390/en15197362
Submission received: 16 September 2022 / Revised: 4 October 2022 / Accepted: 5 October 2022 / Published: 7 October 2022
(This article belongs to the Section H: Geo-Energy)

Abstract

:
In deep underground environments, temperature is one of the key factors affecting the geochemistry behaviors of rare earth elements (REE) in organic-rich fluid. However, the influence of temperature on the interaction between humic acids (HA) and REE is not well known. In the present study, the influence of temperature on the HA–REE-binding behavior was evaluated based on heating experiments of REE-doped HA solution. Lignite-extracted HA and REE-binding experiments were conducted over a temperature range of 20 to 200 °C to quantify HA–REE complexation and the influence of temperature on HA binding sites. Results showed that increasing temperature and decreasing [REE]/[HA] ratio cause an increase of Kd value (the partition coefficient of REE between HA and aqueous solution). During heating K d REE   K d REE patterns gradually change from middle REE-enriched-type (M-type) at 20 °C to light and middle REE-enriched-type (L-M-type) at 50 and 100 °C, and to light REE-enriched-type (L-type) at 150 °C and 200 °C. The increase of REE bonded with HA and modifications of K d REE patterns during the thermal treatment may be attributed to the increase of REE-binding sites, especially carboxylic sites, as a consequent of HA decomposition. This study provides a glimpse into the HA–REE-binding behaviors in the deep underground environment, which may shed light on the geochemical characteristics of REE in some organic-bearing rocks, and their changes during the coalification process.

1. Introduction

Rare earth elements (REE), defined as a group of 14 elements with atomic number 57 (La) through 71 (Lu), are a highly coherent series of elements typically having an ionic charge of +3 and with chemical properties varying regularly along the series [1,2,3,4,5]. REE can be subdivided into light REE (LREE, La-Nd), medium REE (MREE, Nd-Tb) and heavy REE (HREE, Dy-Lu), based on their atomic masses [6,7]. Their similar charge combined with their systematic decrease in ionic radius with increasing atomic number allow them to be excellent probes for petrogenetic sources and fractionation processes [1,2], as well as depositional environment and regional tectonic history [8]. They can also provide information on chemical processes in aquatic environments [9,10].
Humic substances comprise complex polydisperse molecules formed in natural waters, soils, sediments, peat, and other chemically and biologically transformed materials, as well as in lignite and oxidized bituminous coal [11,12]. Humic substances can be divided into three main fractions according to their water solubility [13,14,15]: the humic acid (HA) faction, which is insoluble below pH ~2 but becomes soluble under higher pH values; the fulvic acid (FA) fraction, which is soluble at all pH values; the humin fraction, which is insoluble in water under any pH conditions. From these definitions, the extractable humic substance consists of the HA and FA fractions that are the most studied humic substances [16].
Studies on REE–HA interactions are sparse [3,4,5,7,15,17,18,19,20,21,22,23,24,25,26,27,28]. Humic acids are complex macro-molecules that contain a large variety of functional groups allowing them to be potent ligands of metal cations such as REE [2,3]. There is now ample evidence that HA controls REE speciation in natural organic-rich waters [4,11,26]. When HA are ubiquitous in natural waters, most of the REE occur as REE–HA complexes [3,9,23,29]. The predominant HA–REE-binding sites are deduced to be the carboxylic and phenolic groups [3,21]; however, less abundant softer Lewis bases (e.g., N- and S-containing groups) [23,30] also contribute to HA–REE complexation. The relative affinity of REE with HA functional sites can be visualized in plots of the intrinsic stability constants (Kc) or the partition coefficient between two phases (Kd) versus the REE atomic number [3,21,22]. Plots of REE Kd or Kc versus atomic number (the so-called REE partition-coefficient/stability-constant pattern), which are highly sensitive to the heterogeneity of HA binding sites, can be used to quantify the HA–REE complexation processes [3,4,22].
Modeling and experimental studies have revealed that HA–REE complexation is largely affected by the metal loading (REE/HA ratio) and pH condition [3,20,23,30], as well as presence of competitor ions [4,7,22]. The REE–HA complexation constants (Kc) obtained by Pourret et al. [17] show a general middle-REE (MREE) downward pattern in a high REE loading complexation experiment. By contrast, the Kc patterns exhibit a regular and progressive increase from La to Lu (so-called lanthanide contraction effect) under low REE loading condition [5,27]. The effect of metal loading on the binding of REE to HA was systemically investigated by Marsac et al. [21]. The results highlighted that under acidic conditions (pH = 3), the relative amount of REE bound to HA strongly increases with decreasing REE loading, and the K d REE patterns (the partition coefficient of REE between HA and aqueous solution versus atomic number) change from a MREE downward concave distribution to a pattern displaying the lanthanide contraction effect with a decrease of REE loading [21]. Similar experiment results are also obtained by Yamamoto et al. [19]. One possible explanation for this difference is that the binding of the REE with HA occurs on multiple binding sites [21]. At high REE loading, REEs are mainly bound to low affinity but high density sites such as carboxylic groups [3,19,31]. These sites would complex the MREE much more efficiently [21]. The preferential binding of MREE to monocarboxylic ligands is mainly due to the large outer-sphere contribution in LREE- and MREE- ligand complexation [7]. At low REE loading, REEs are bound to functional groups with strong affinity but low density such as phenolic sites [3,19,31], whose binding strength regularly increases with the REE atomic number [21].
The pH condition is also one of the factors that could influence HA–REE interaction. The amount of REE bound to HA commonly increases with increasing pH [3,4,17,25], which likely owes to deprotonation of the functional group (e.g., carboxylic), making them available for REE sorption [25]. The carboxylate contribution increases with increasing pH [32]. Modeling calculations have revealed that LREE are mainly bound by weak carboxylic sites at pHs ranging between 3 and 6, while HREE are preferentially bound to strong multidentate sites (which can be carboxylic, phenolic or carboxy-phenolic) at pH = 3 and to phenolic groups at pH = 6 [3,4,25]. By contrast to metal loading, the pH condition appeared to have a less effect on HA–REE complexation. For instance, in REE–HA binding experiments performed under high REE/HA conditions, all patterns exhibit a MREE downward concavity, whatever the pH value [4,17,33].
The presence of competitor ions would influence the REE–HA complexation as well. The partition coefficients of REE between HA and aqueous solution (Kd) are highly sensitive to the heterogeneity of HA binding sites, which can generate partition coefficient ( K d REE ) patterns with specific shapes depending on the nature of the functional group involved [4,22]. The ability of the K d REE patterns to elucidate the REE–HA binding processes has been used to investigate the cation competitive effect of Al(III) and Fe(III) on REE–HA complexation, through combining laboratory experiments and modeling calculations [4,22]. The results showed that at pH 3, Fe(III) competes more efficiently with HREE than with LREE, indicating that Fe(III) is bound to the few strong HA multidentate sites; while at pH 6, Fe (III) shows a similar competitive effect for every REE, suggesting that Fe(III) has the same relative affinity for HA carboxylic and phenolic sites [4,7]. As for Al, Al(III) is more competitive for HREE under acidic (pH = 3) and low [REE]/[HA] concentration ratio conditions, indicating that Al(III) has a high affinity for the HA multidentate sites; while under pH 5-6 and high [REE]/[HA] conditions, Al(III) is a stronger competitor for LREE, indicating that Al(III) is held by carboxylic HA sites [22]. Furthermore, an advanced humic ion binding model (Model VII) calculation shows that Cu displays no competitive effect on HA–REE-binding at pH 3, and weak and similar competition with all REE at pH 6 [7]. This model calculation also reveals that Ca might have a very limited effect on HA–REE complexation [7].
Temperature may also be an important factor affecting HA–REE complexation. However, the exact role of temperature plays in the HA–REE-binding process has not been fully explored. Under deep underground conditions, temperature may be one of the vital factors that would influence the stability and transport of REE in organic-rich fluids, which may be of significance for understanding the REE geochemical characteristics of organic-rich rocks. In the present study, HA (extracted from lignite) and REE-binding experiments were performed over a range of heating conditions (from 20 to 200 °C). The aim is to experimentally reveal the HA–REE complexation behaviors observed at different heating stages, while attempting to use REE as a fingerprint to identify the changes of HA binding sites involved in the heating processes. This study may provide insight into modifications of organic-associated REE during the coalification process.

2. Materials and Methods

Deionized water was obtained from a Milli-Q (Millipore) purification apparatus. All reagents used were of analytical grade or better. All experimental solutions were prepared with deionized water. Synthetic REE solution was prepared from a nitrate REE standard solution (100 mg/L, Reference Standard GSB04-1789-2004) and diluted to a REE concentration of 10 mg/L.

2.1. Lignite Samples

The raw materials used in the extraction of HA were lignite samples collected from the Miocene Xiaolongtan Formation of the Puyang Mine, Yunnan, southwestern China. Approximately 24 lignite samples (6 from the M2 coal seam and 18 from the M3 coal seam) were collected from the coal outcrop. From top to bottom, the lignite samples obtained from M2 and M3 coal seams were numbered as M2-1 to M2-6, and M3-1 to M3-18, respectively. Each lignite sample was collected from every 50 cm thick coal section. In the present study, the lignites used for HA extraction includes 2-2, 2-4, 3-2, 3-4, 3-6, 3-7, 3-8, 3-10, 3-12, and 3-14, which are all demineralized to reduce the influence of minerals before suffering from HA extraction. The detailed demineralization procedures were as follows. About 15 g of the lignite powder (about 200 mesh) was weighed, placed into a beaker, and wetted with 5 mL anhydrous ethanol before the addition of 80 mL of hydrochloric acid (HCl, 12 mol/L). The mixture was left to react for 3 h at 60 °C with occasional stirring. This was followed by centrifugal separation, during which the supernatant was decanted. The residue was then reacted with 80 mL of hydrofluoric acid (HF, 28.9 mol/L) for 3 h at 60 °C with occasional stirring, and then re-centrifuged. The lignite residue was then washed to a neutral pH value using deionized water. The final resultant sample (demineralized lignite) was dried at 75 °C overnight to a constant weight (Figure 1).

2.2. Humic Acid Extraction

The extraction of HA from the demineralized lignite was carried out using sodium hydroxide solution in the present study. About 5g of each demineralized lignite sample was treated with 1 mol/L NaOH in a proportion of 1: 20 (coal: extractor). The mixture was shaken for 2 h at a temperature of 80 °C. The non-dissolved fraction was separated. The supernatant was acidified using HCl (6 mol/L) with constant stirring to pH = 1 and the suspension was allowed to settle for 12 to 16 h before centrifuging and discarding the supernatant. The HA precipitate was next suspended in HCl (0.1 mol/L) and HF (0.3 mol/L) solution and shaken overnight at room temperature to remove minerals. The precipitated HA was washed several times with deionized water until it was free of chlorine (Cl). The purified HA was then freeze-dried, weighed, and stored in a glass container (Figure 1).

2.3. Complexation Experiment

Each purified HA sample was dissolved overnight with 0.01 mol/L NaOH solution to obtain a 1000 mg/L HA solution. A REE solution with a concentration of 10 mg/L was used in this experiment. Four batches of experiments (named as experiments 1, 2, 3, and 4, respectively) were carried out under different REE loading (REE to HA concentration ratio [REE]/[HA] ranging from 2 * 10−3 to 3 * 10−2). Portions of 50 mL of solutions were prepared with 0.25, 0.25, 2.5, and 2.5 mL of HA solution, mixed with 0.75, 0.25, 1.25, and 0.5 mL of REE solution for experiments 1 2, 3, and 4, respectively. Concentrations of HA and REE in the final solution are 5 and 0.15, 5 and 0.05, 50 and 0.25, 50 and 0.1 mg/L for experiments 1, 2, 3, and 4, respectively (Figure 1). This concentration range is similar to that reported in the previous study of HA-REE complexation at high metal loading [17]. The solution pH was adjusted to 3 using 0.1 mol/L HCl/NaOH. This acidic pH was chosen to avoid total complexation of REE with HA, and to prevent complexation of the REE inorganic fraction by OH and CO32− [21]. Experimental solutions were stirred for at least 48 h to allow equilibrium distribution of REE between the aqueous solution and HA; 48 h is the equilibrium time determined from preliminary kinetic experiments [9,17,21,24,26].
The heating effects on the HA–REE-binding were experimentally evaluated. For each batch of experiments, about 10 mL of the above REE-doped HA solution was taken and heated at temperatures 50, 100, 150, and 200 °C, respectively (Figure 1), in a high- pressure vessel for 48 h. After cooling and standing for at least 12 h, the solution was put into a 15 mL ultrafiltrate tube with a 5 kDa (kilodalton) membrane, which was then followed by centrifugation at a high speed of 4000 rpm for 0.5 h. HA has a mean molecular weight of 23 kDa [9,17,24], and is considered to be impossible to pass through the 5 kDa membrane. All the retentate REE caught up by the 5 kDa membrane are assumed to have been complexed by HA [17], while the <5 kDa ultrafiltrates contain the free inorganic REE [17].
The ultrafiltrates were collected for REE concentration determination. The REE measurements were performed with a Perkin–Elmer SCIEX ELAN DRC II inductively coupled plasma mass spectrometry (ICP-MS). The ICP-MS instrumental operating conditions are as follows: RF power, 1250W; nebulizer gas flow, 0.80 L/min; auxiliary gas flow, 1.20 L/min; plasma gas flow, 15 L/min; sampler cone (platinum), 1.10 mm; skimmer cone (platinum), 0.90 mm. The interferences of Ba on Sm and Eu, more specifically, the interferences of 136Ba16O on 152Sm and 135Ba16O on 151Eu, were corrected through BaO+/Ba+ coefficient, which was obtained from the Ba standard solution (10 mg/L). The selected REE isotopes and detection limit of each REE are listed in Table 1. For quality control, multi-element standards (GBW07315, GBW07316, GSR-1, BHVO-2, AGV-2, and GSP-2) were used. Furthermore, one duplicate sample was analyzed every 10 samples, in order to check the stability during REY determination by ICP-MS. The analytical precision for all REE in filtrate samples was better than 5% relative standard deviation (RSD).
The amount of REE complexed with aqueous HA corresponds to the difference between the initial amount of REE and the remaining amount of REE in the <5 kDa filtrate. The complexation behavior of REE with HA is described using the apparent partition coefficient Kd (in L/g) [9,22,25,34], expressed as follows:
Kd (REEi) = (μg REEi sorbed/g HA)/(μg/L REEi in filtrate)
where REEi refers to an REE from La to Lu.

3. Results

All the experimental data can be found in the Supplementary File (Tables S1–S4, Supplementary Electronic File 1). REE complexation by HA is examined by considering variation of the REE distribution coefficient ( K d REE ) patterns formed at various temperatures and [REE]/[HA] ratios.

3.1. HA–REE Complexation Characteristics at Room Temperature (about 20 °C)

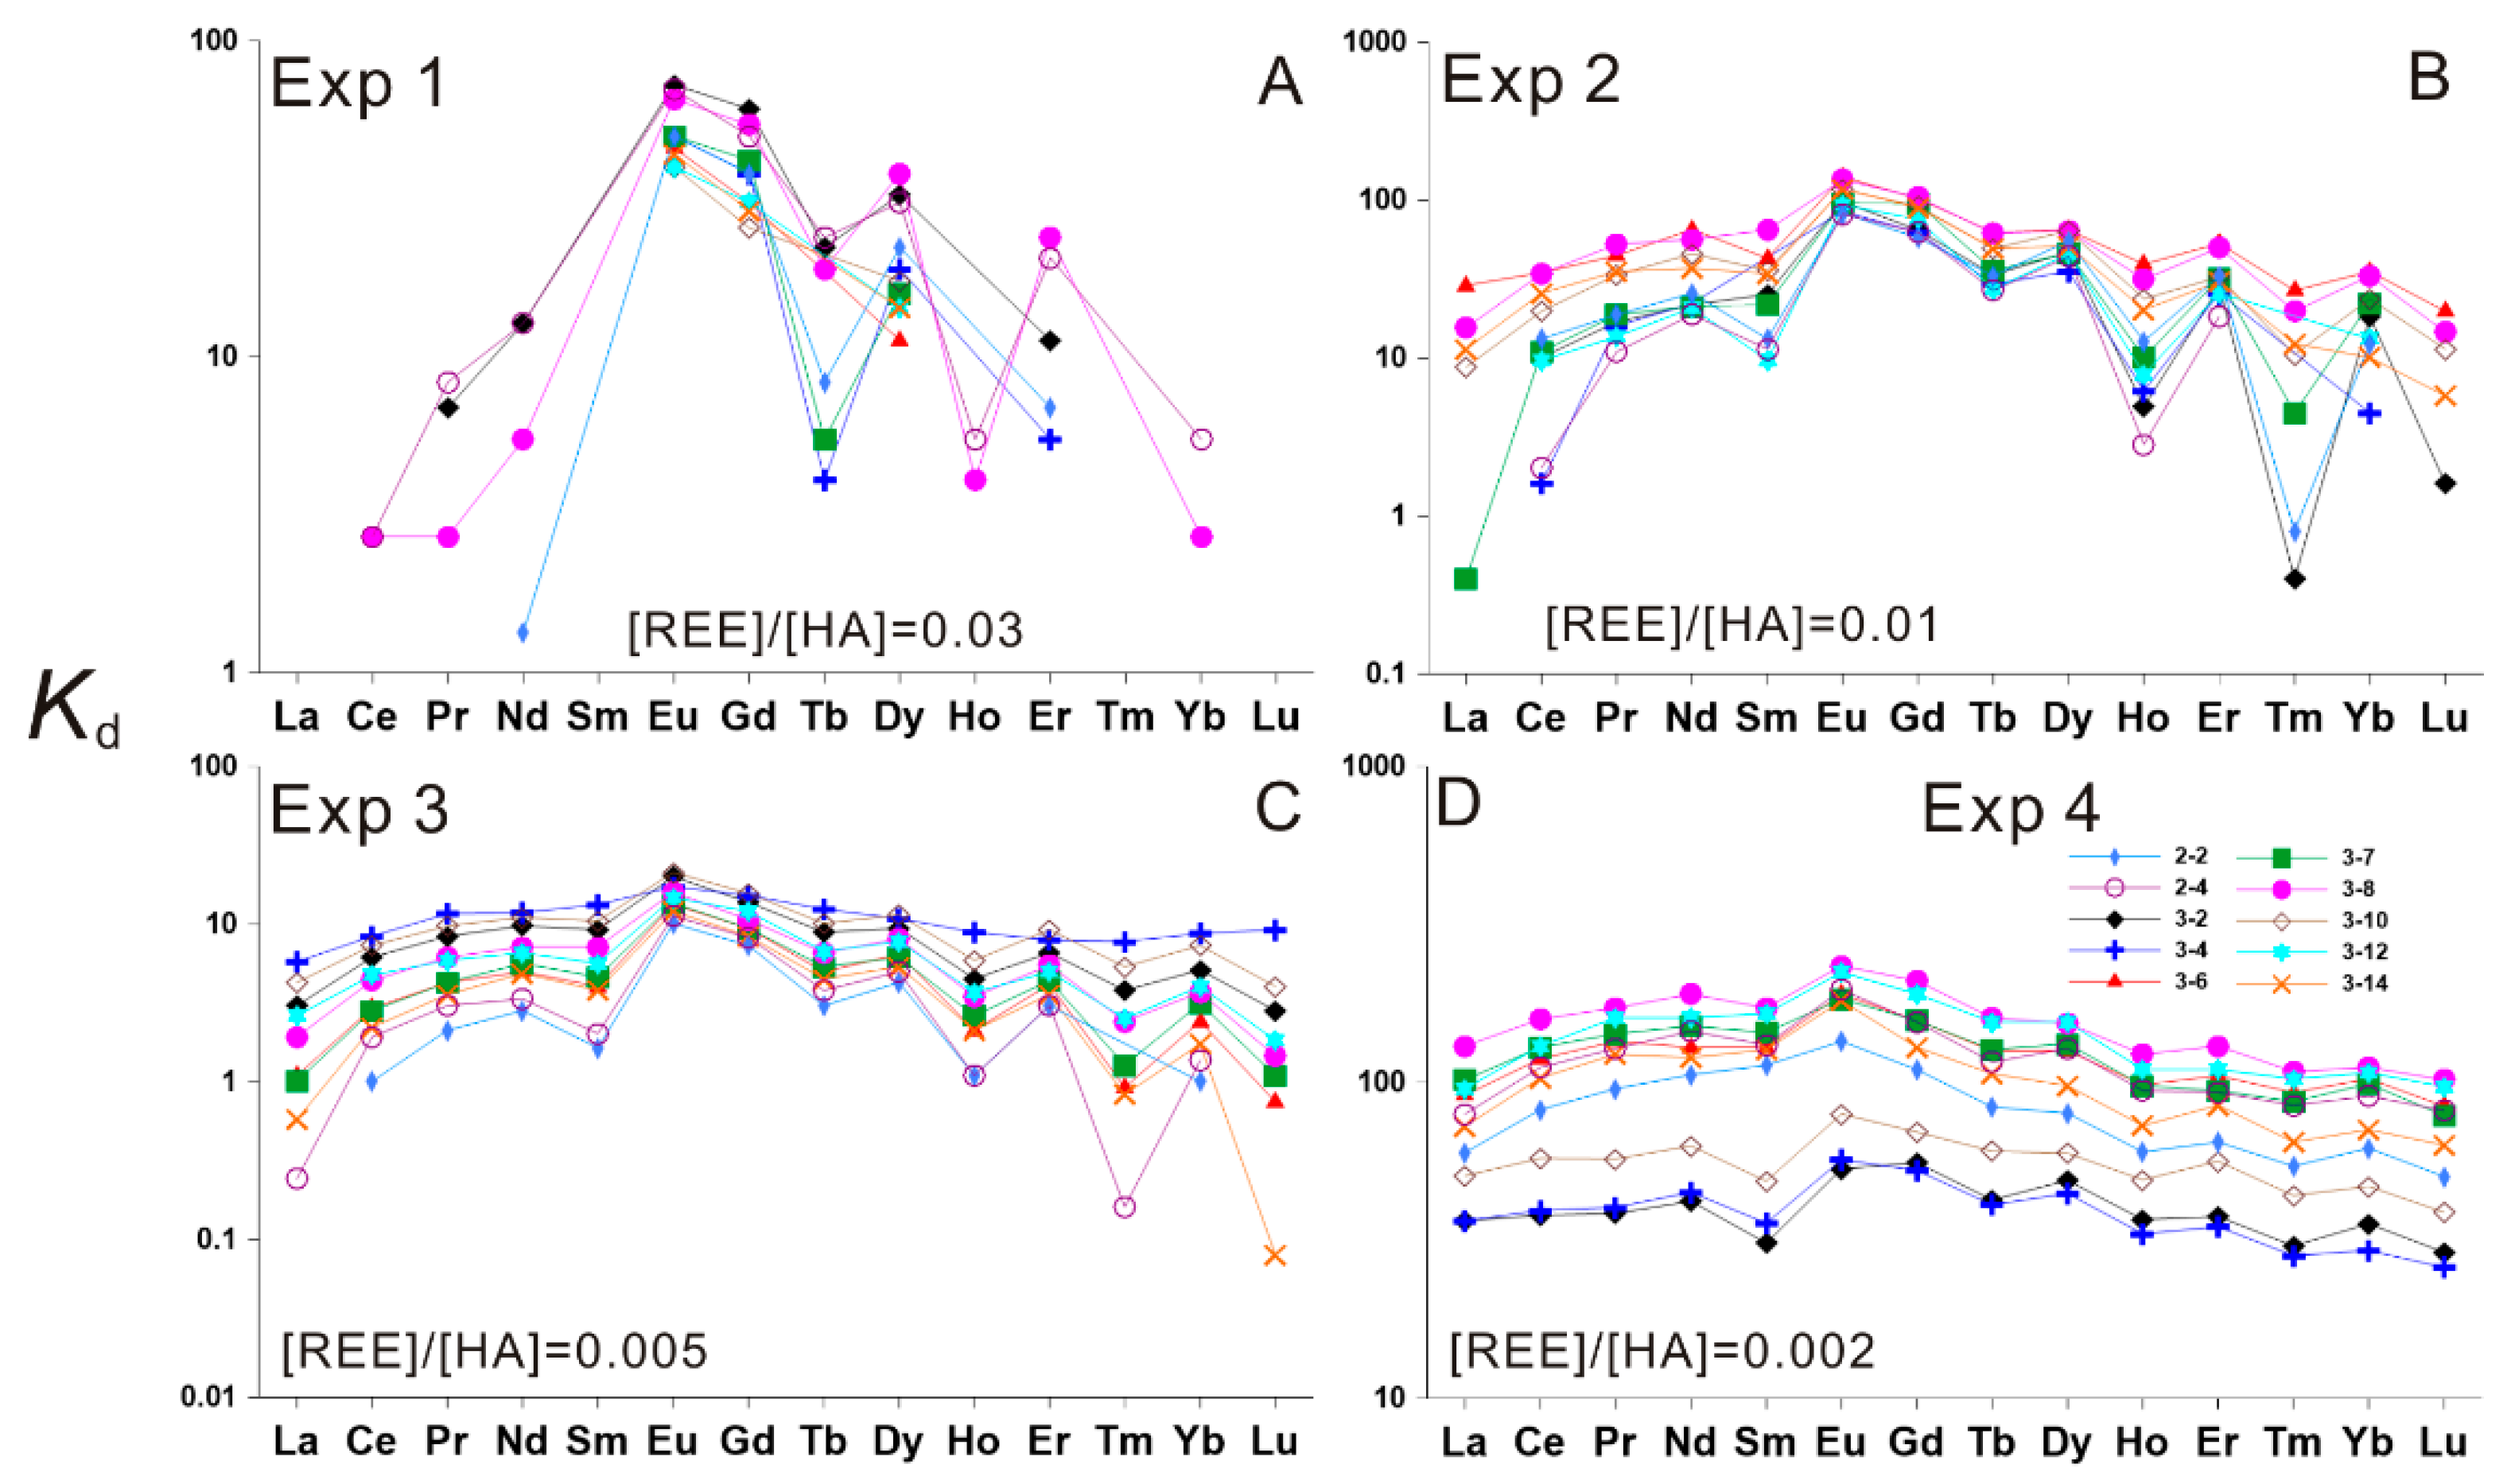
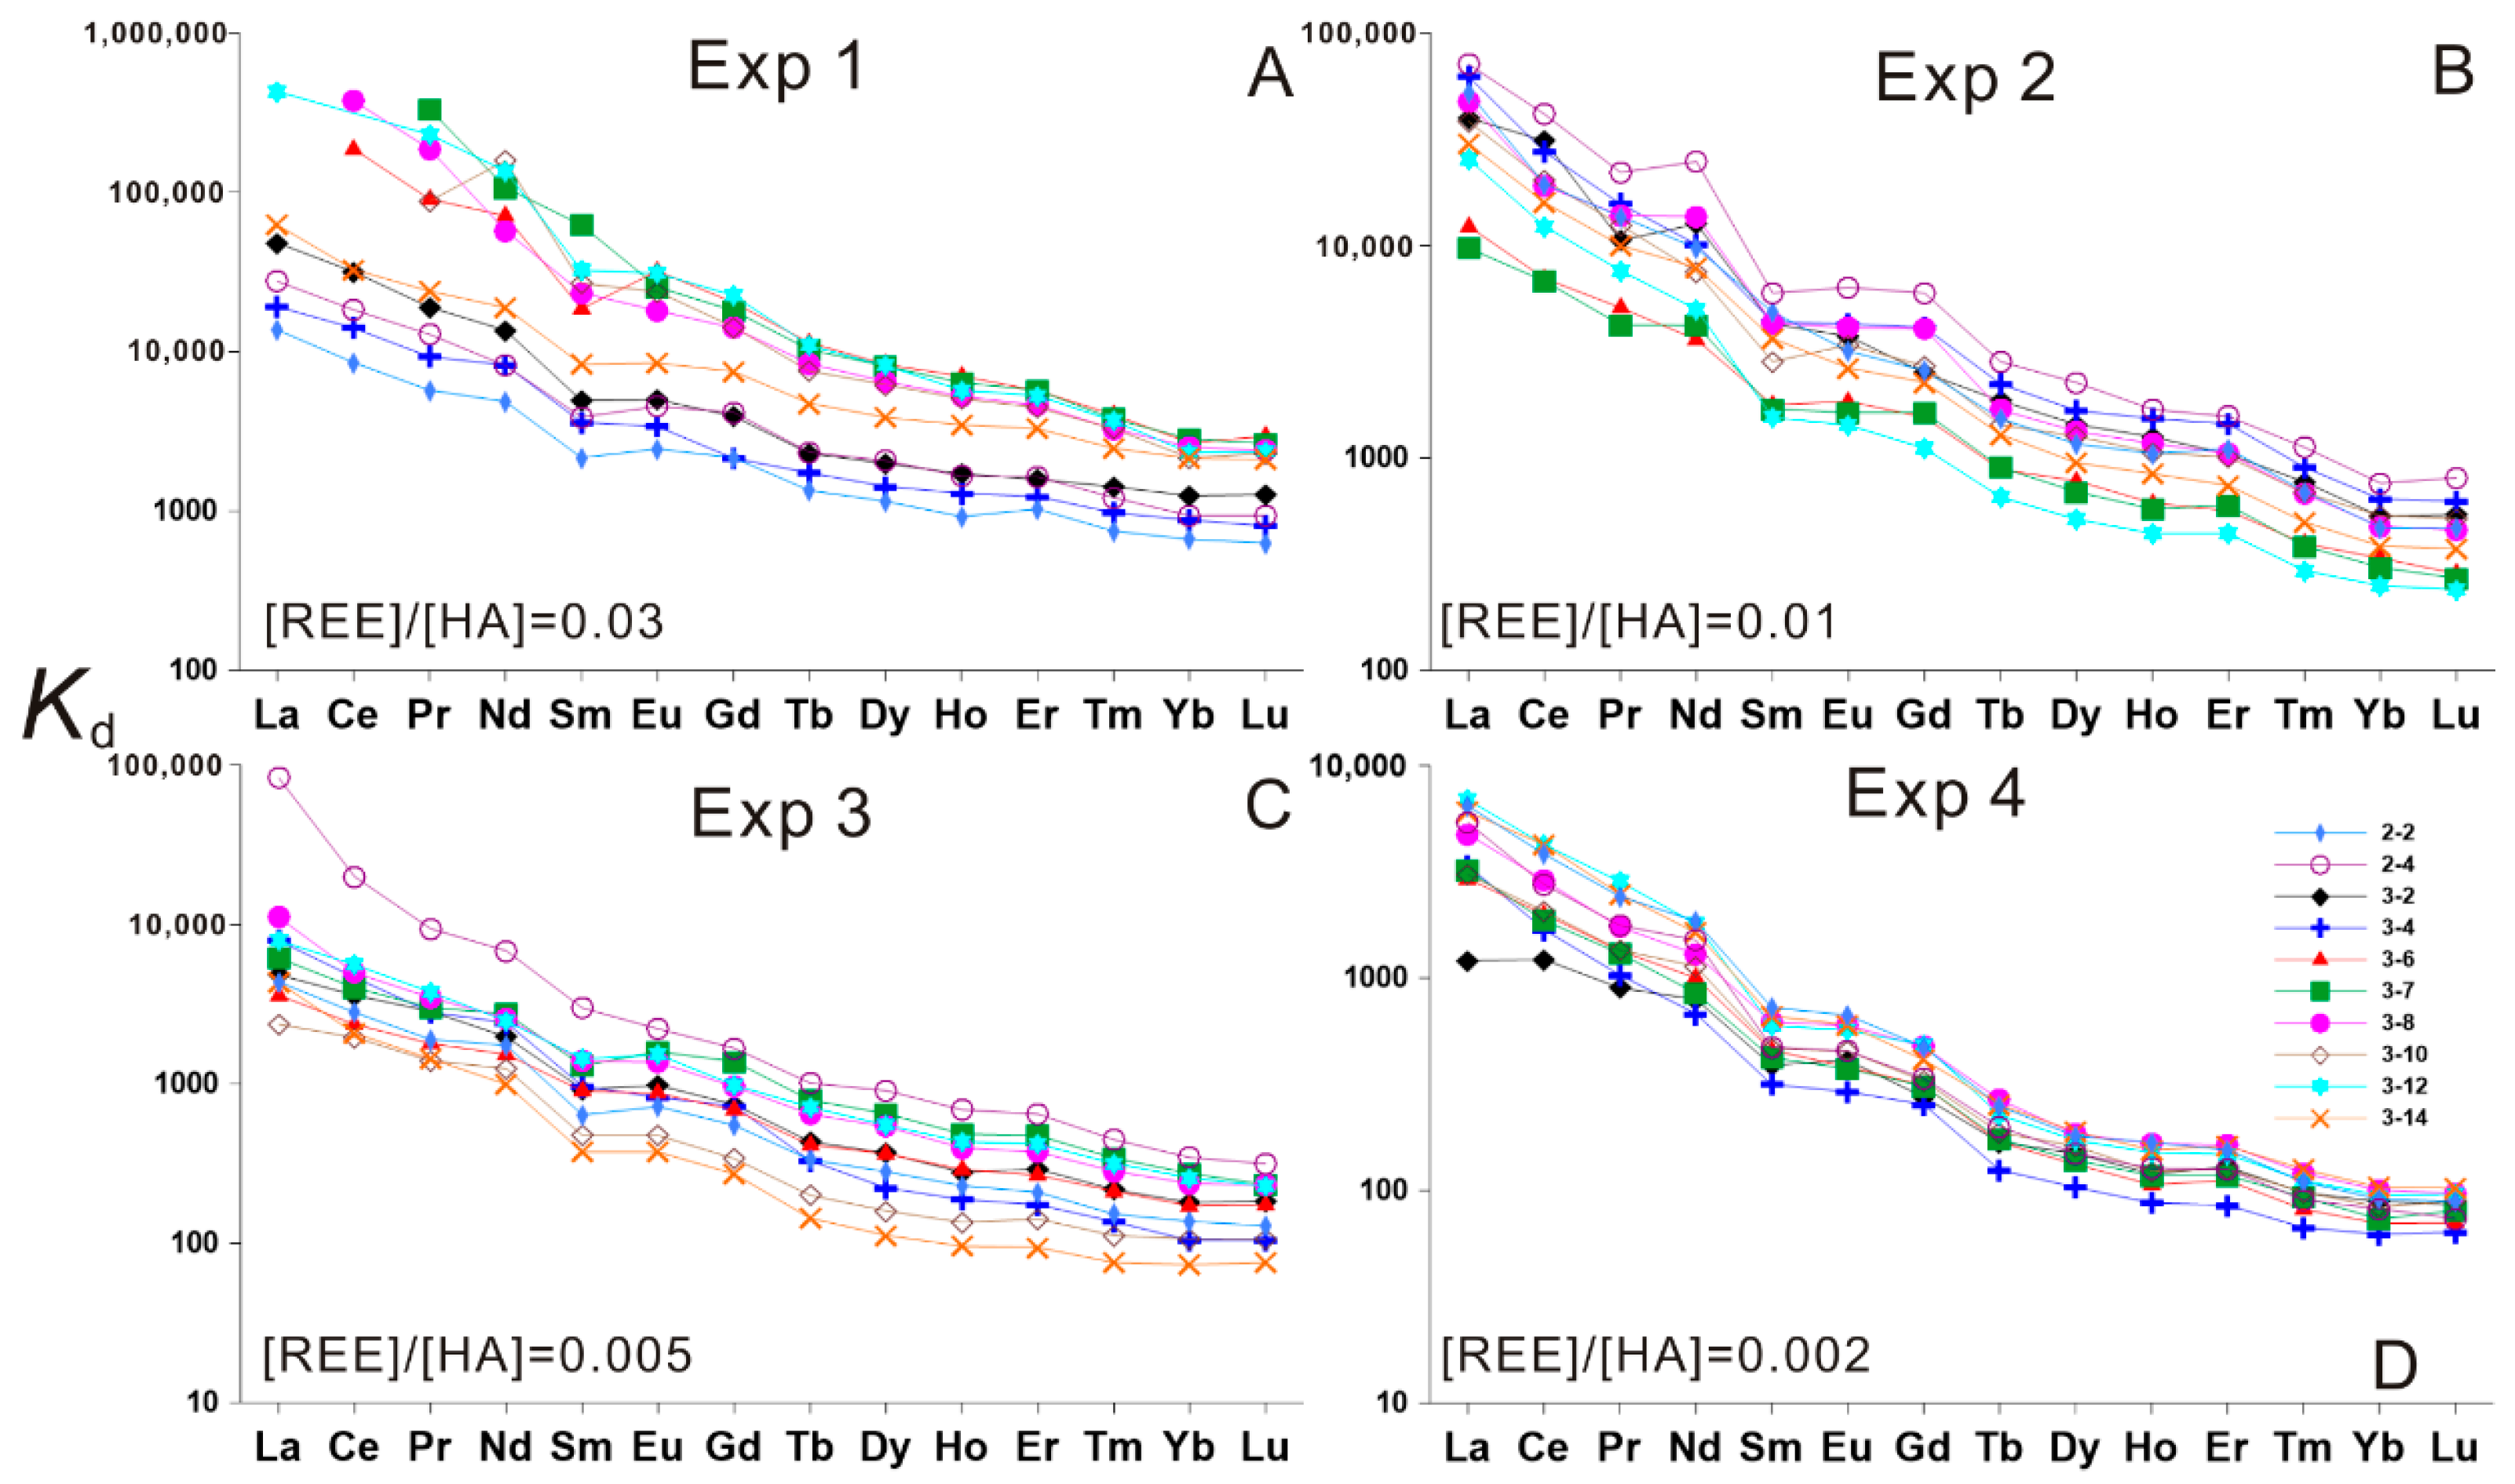
Results of HA–REE-binding at room temperature (about 20 °C) are shown in Figure 2. For experiment 1 ([REE]/[HA] = 0.03, concentrations of REE and HA are 0.15 and 5 mg/L, respectively), the whole K d REE pattern shows a MREE-enriched type (M-type; Figure 2A). Some Kd data for LREE and HREE are missing, probably indicating that the [REE]/[HA] ratio of 0.03 is too high for some LREE and HREE to complex with HA.
In comparison to experiment 1, the distribution coefficient value Kd for each sample in experiment 2 ([REE]/[HA] = 0.01, concentrations of REE and HA are 0.05 and 5 mg/L, respectively) becomes greater (Figure 2A,B), indicating that the fraction of REE bound to HA increases with decreasing [REE]/[HA] ratios, and the K d REE patterns are characterized by a MREE enrichment (Figure 2B), which is consistent with the previous results [4,5,19,21,34].
Experiments 3 and 4 ([REE]/[HA] = 0.005 and 0.002, with concentrations for REE and HA of 0.25 and 50 mg/L, and 0.1 and 50 mg/L, respectively), both display a M-type K d REE pattern as well (Figure 2C,D). Compared with experiment 3, there is also a common increase of Kd value for experiment 4 (Figure 2C,D), further suggesting that decreasing metal loading could lead to an increase of complexing ability of REE to HA.
It is important to note that the [REE]/[HA] ratio is not the only factor that would influence the REE–HA complexation behavior; the absolute concentration of REE should also be taken into consideration. For instance, although experiment 3 has a lower [REE]/[HA] ratio (0.005) than experiments 2 (0.01) and 1 (0.03), the Kd values for experiments 1 and 2 are commonly greater than that for experiment 3 (Figure 2). It may be due to the higher REE concentration (0.25 mg/L) for experiment 3 than for experiments 1 (0.15) and 2 (0.05 mg/L).
Overall, the K d REE patterns exhibit a MREE downward concavity shape (M-type) for experiments 1 to 4 (Figure 2), with K d La / K d Sm and K d Gd / K d Yb ratios <1 and >1, respectively. These results are consistent with previously published data. The K d REE patterns at high metal loading show typical MREE downward concavity [17,21].

3.2. HA–REE Complexation Characteristics during Heating

During the heating processes, the Kd value and the K d REE pattern change with various [REE]/[HA] ratio. The increase of temperature and decrease of [REE]/[HA] (referring mostly to a constant concentration of HA accompanied by decreasing concentration of REE, for instance, experiments 1 vs. 2, experiments 3 vs. 4) commonly lead to an increase of Kd value (there are some differences at the heating temperatures 150 and 200 °C; see the following text for more details), and generally promote the K d REE pattern to change from a M-type to a LREE and MREE-enriched type (L-M-type) and LREE-enriched type (L-type) (Figure 2, Figure 3, Figure 4, Figure 5 and Figure 6).

3.2.1. HA–REE Complexation Characteristics at 50 and 100 °C

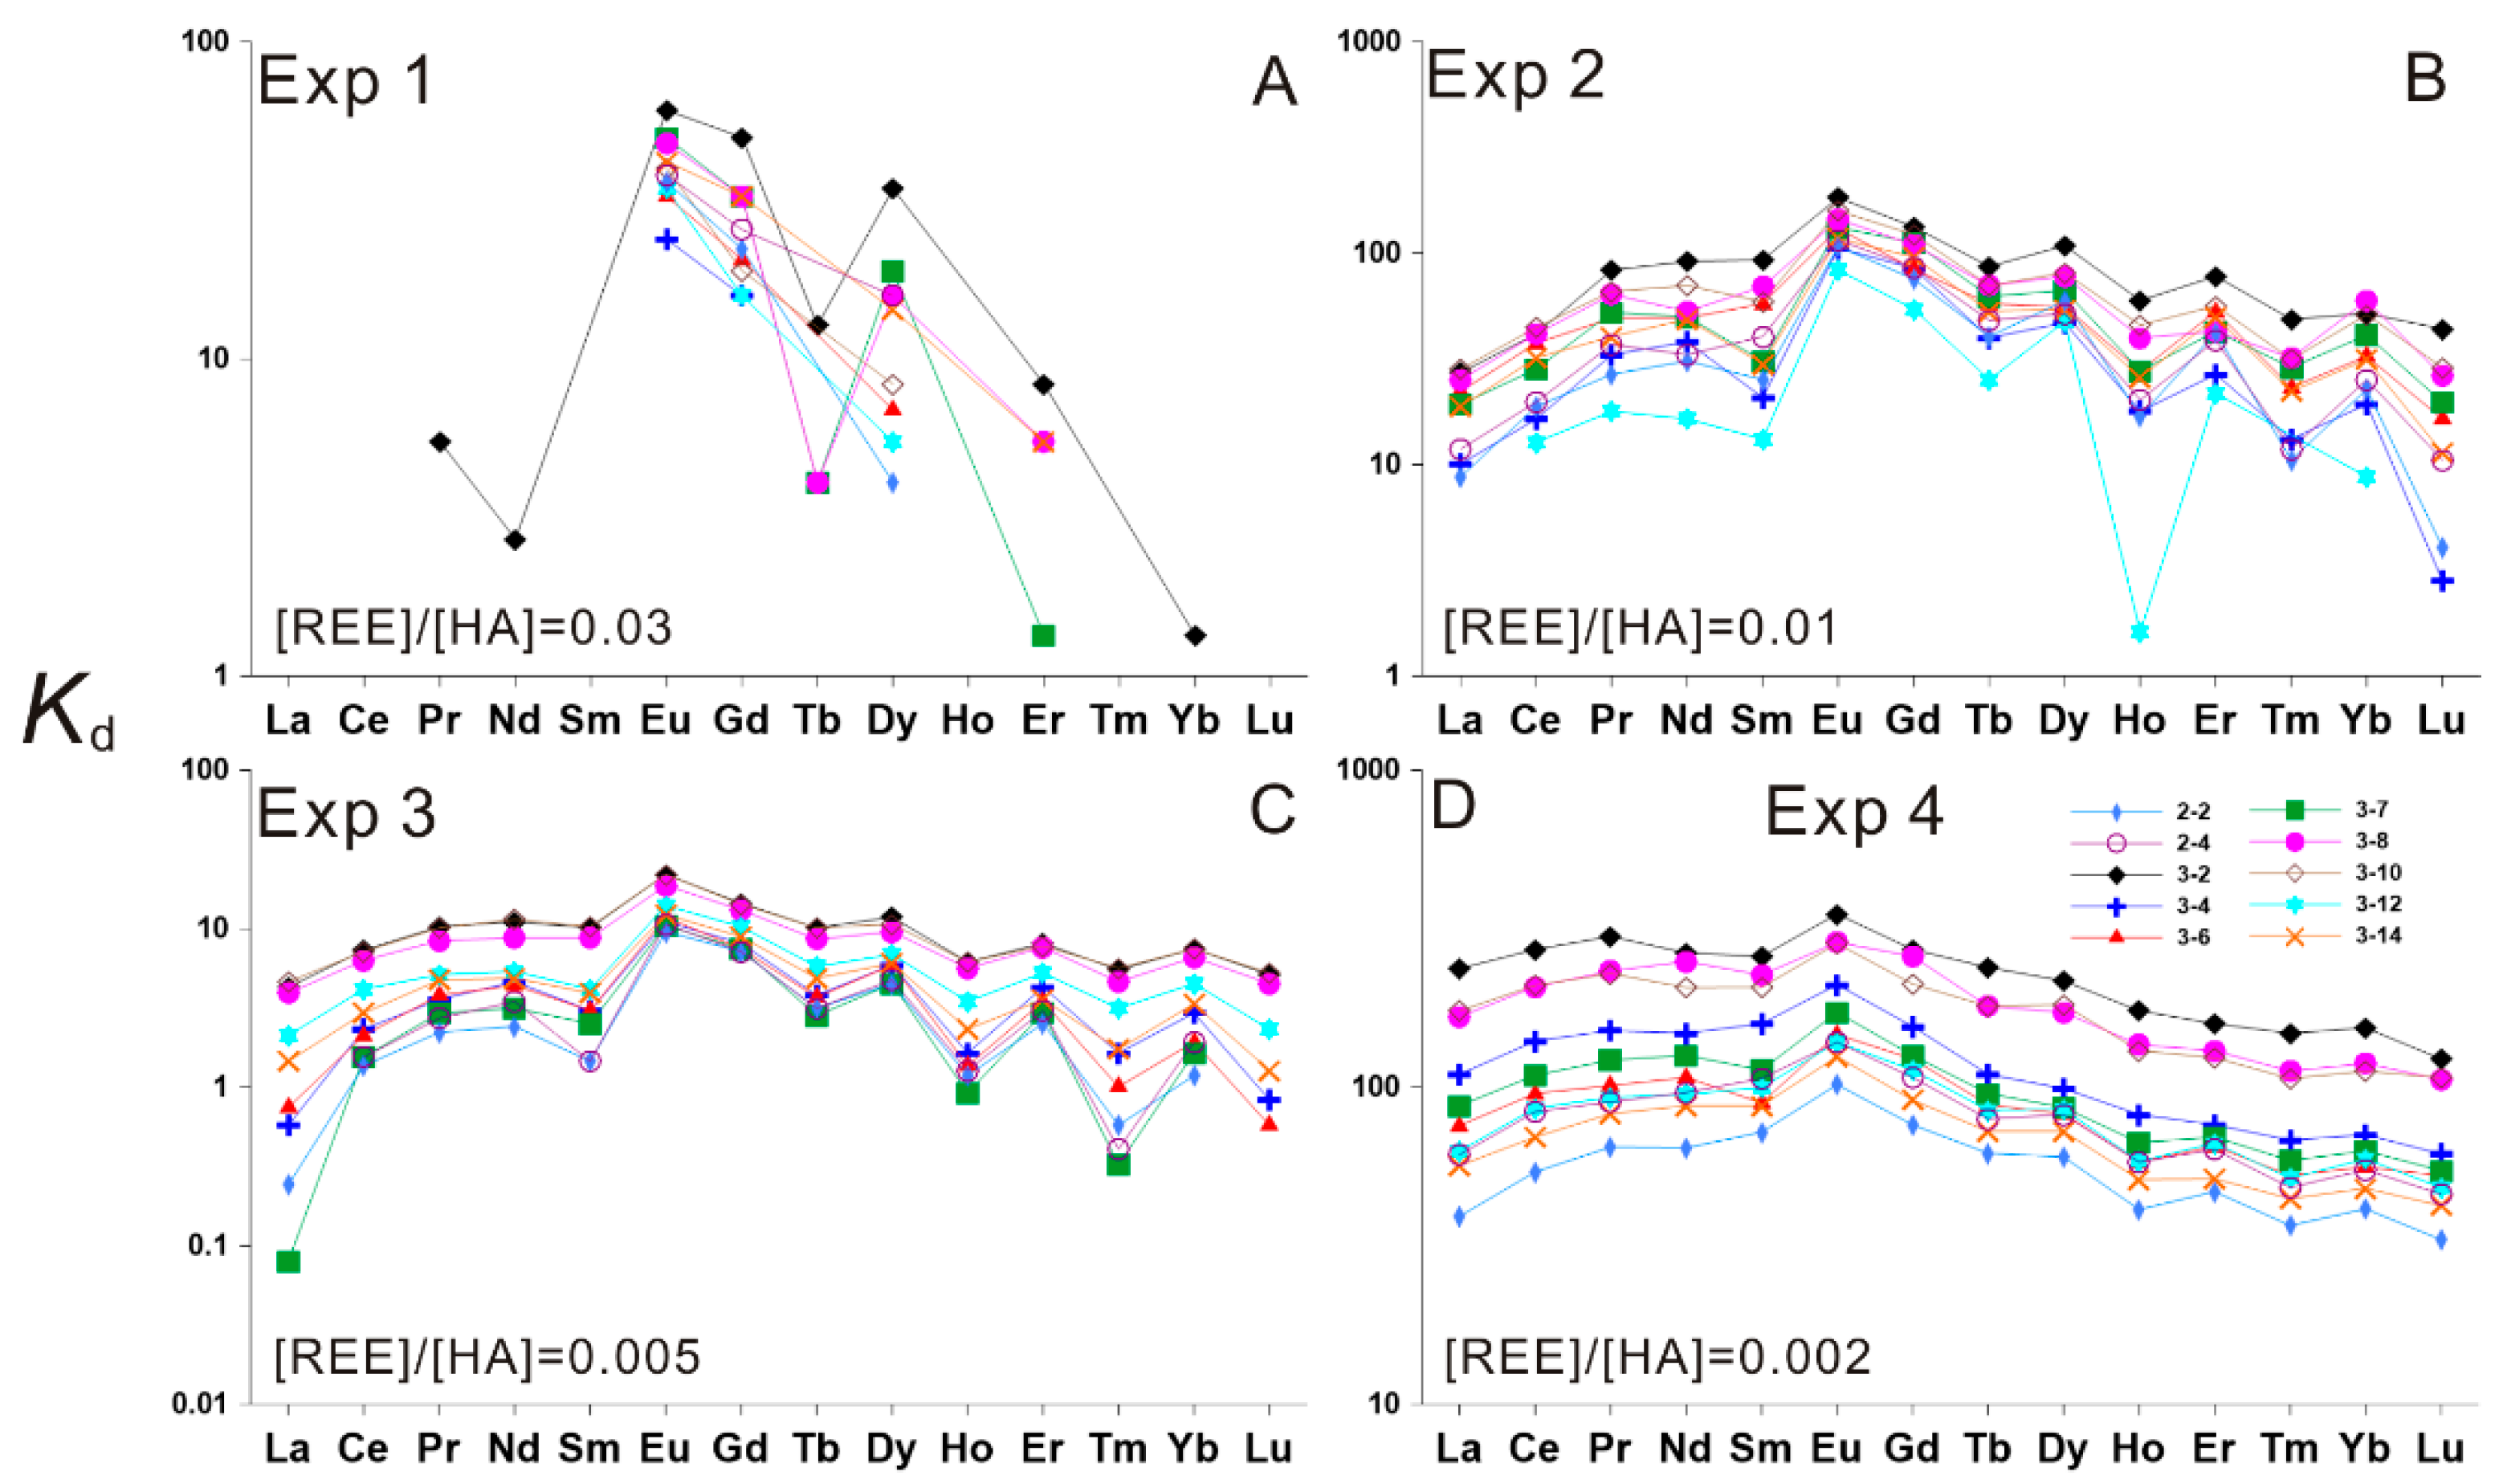
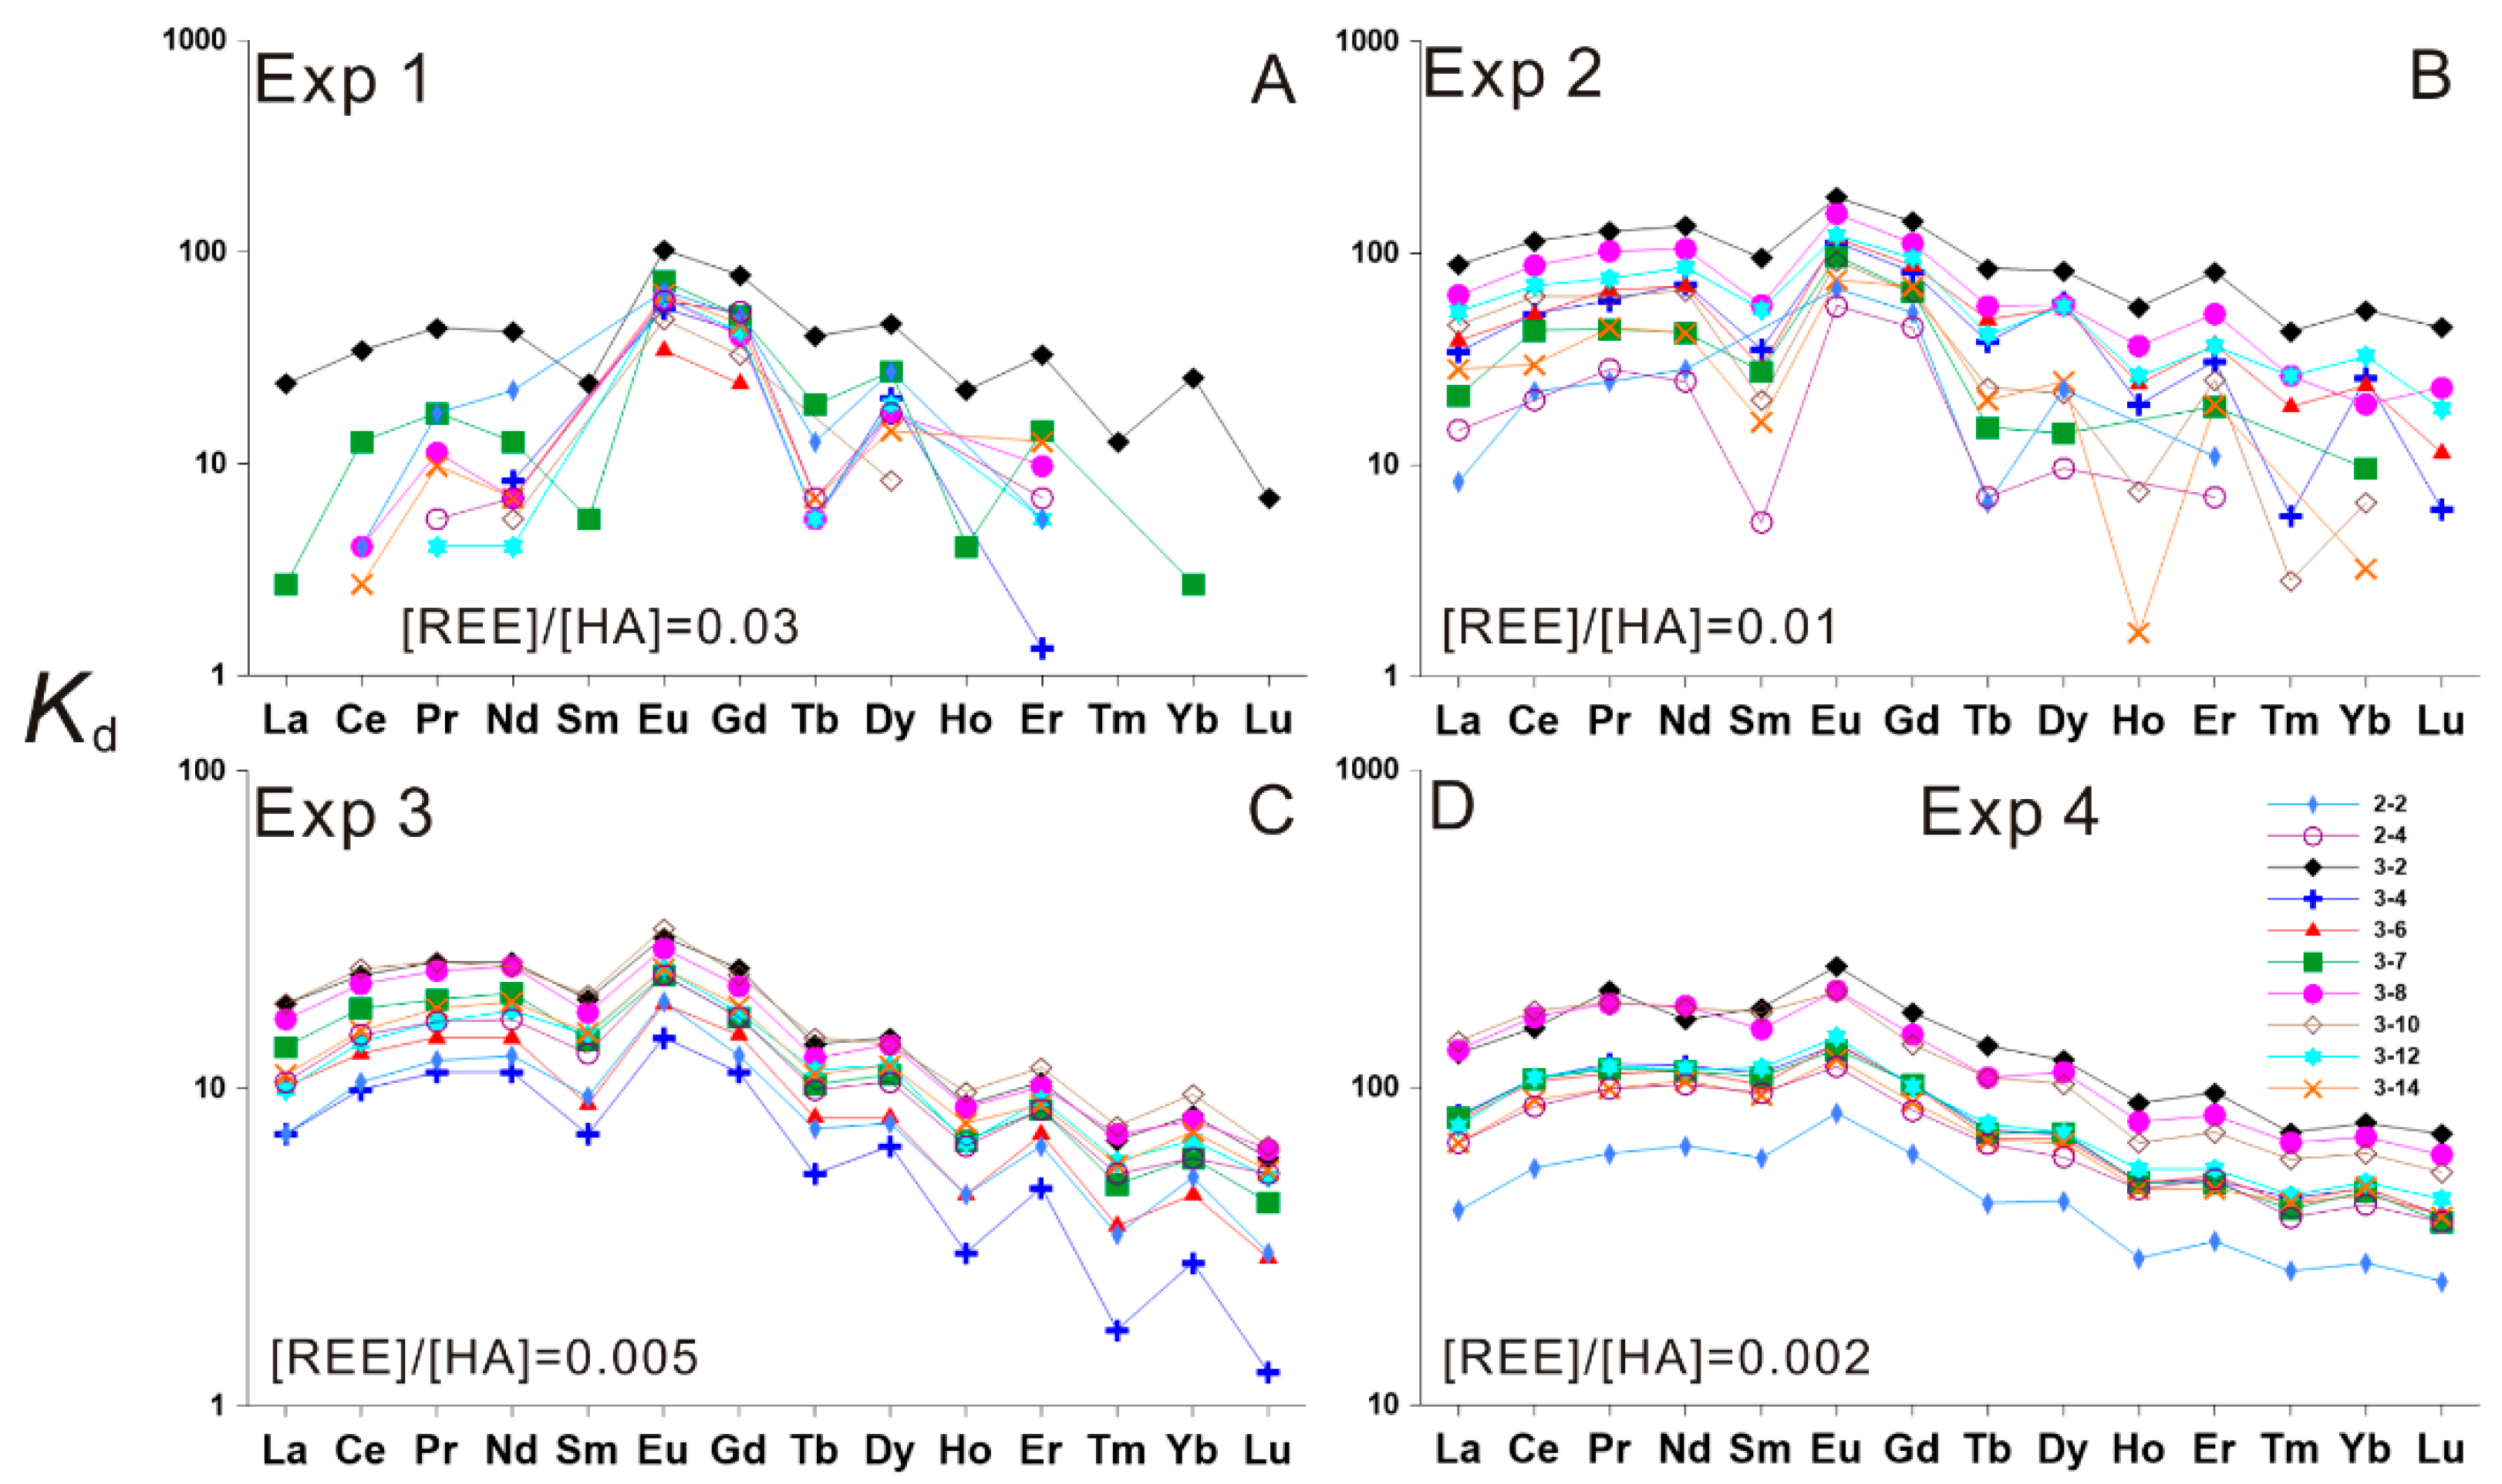
At both the heating temperatures 50 and 100 °C, the Kd value generally increases as the [REE]/[HA] decreases. More specifically, experiment 2 has greater Kd value than experiment 1 (Figure 3 and Figure 4), and experiment 4 has greater Kd value than experiment 3 (Figure 3 and Figure 4), which are consistent with the results obtained at 20 °C.
The K d REE pattern also changes during the heating processes. At 50 °C, the K d REE pattern for experiments 1–3 is MREE-shape (M-type; Figure 3A–C). However, the K d REE pattern becomes L-M-type for experiment 4 (Figure 3D). At 100 °C, the K d REE pattern for experiments 1 and 2 is mainly M-type (Figure 4A,B), and become L-M-type for experiments 3 and 4 (Figure 4C,D). It seems that both high temperature and low [REE]/[HA] favor the change of K d REE pattern from M-type to L-M-type.

3.2.2. HA–REE Complexation Characteristics at 150 and 200 °C

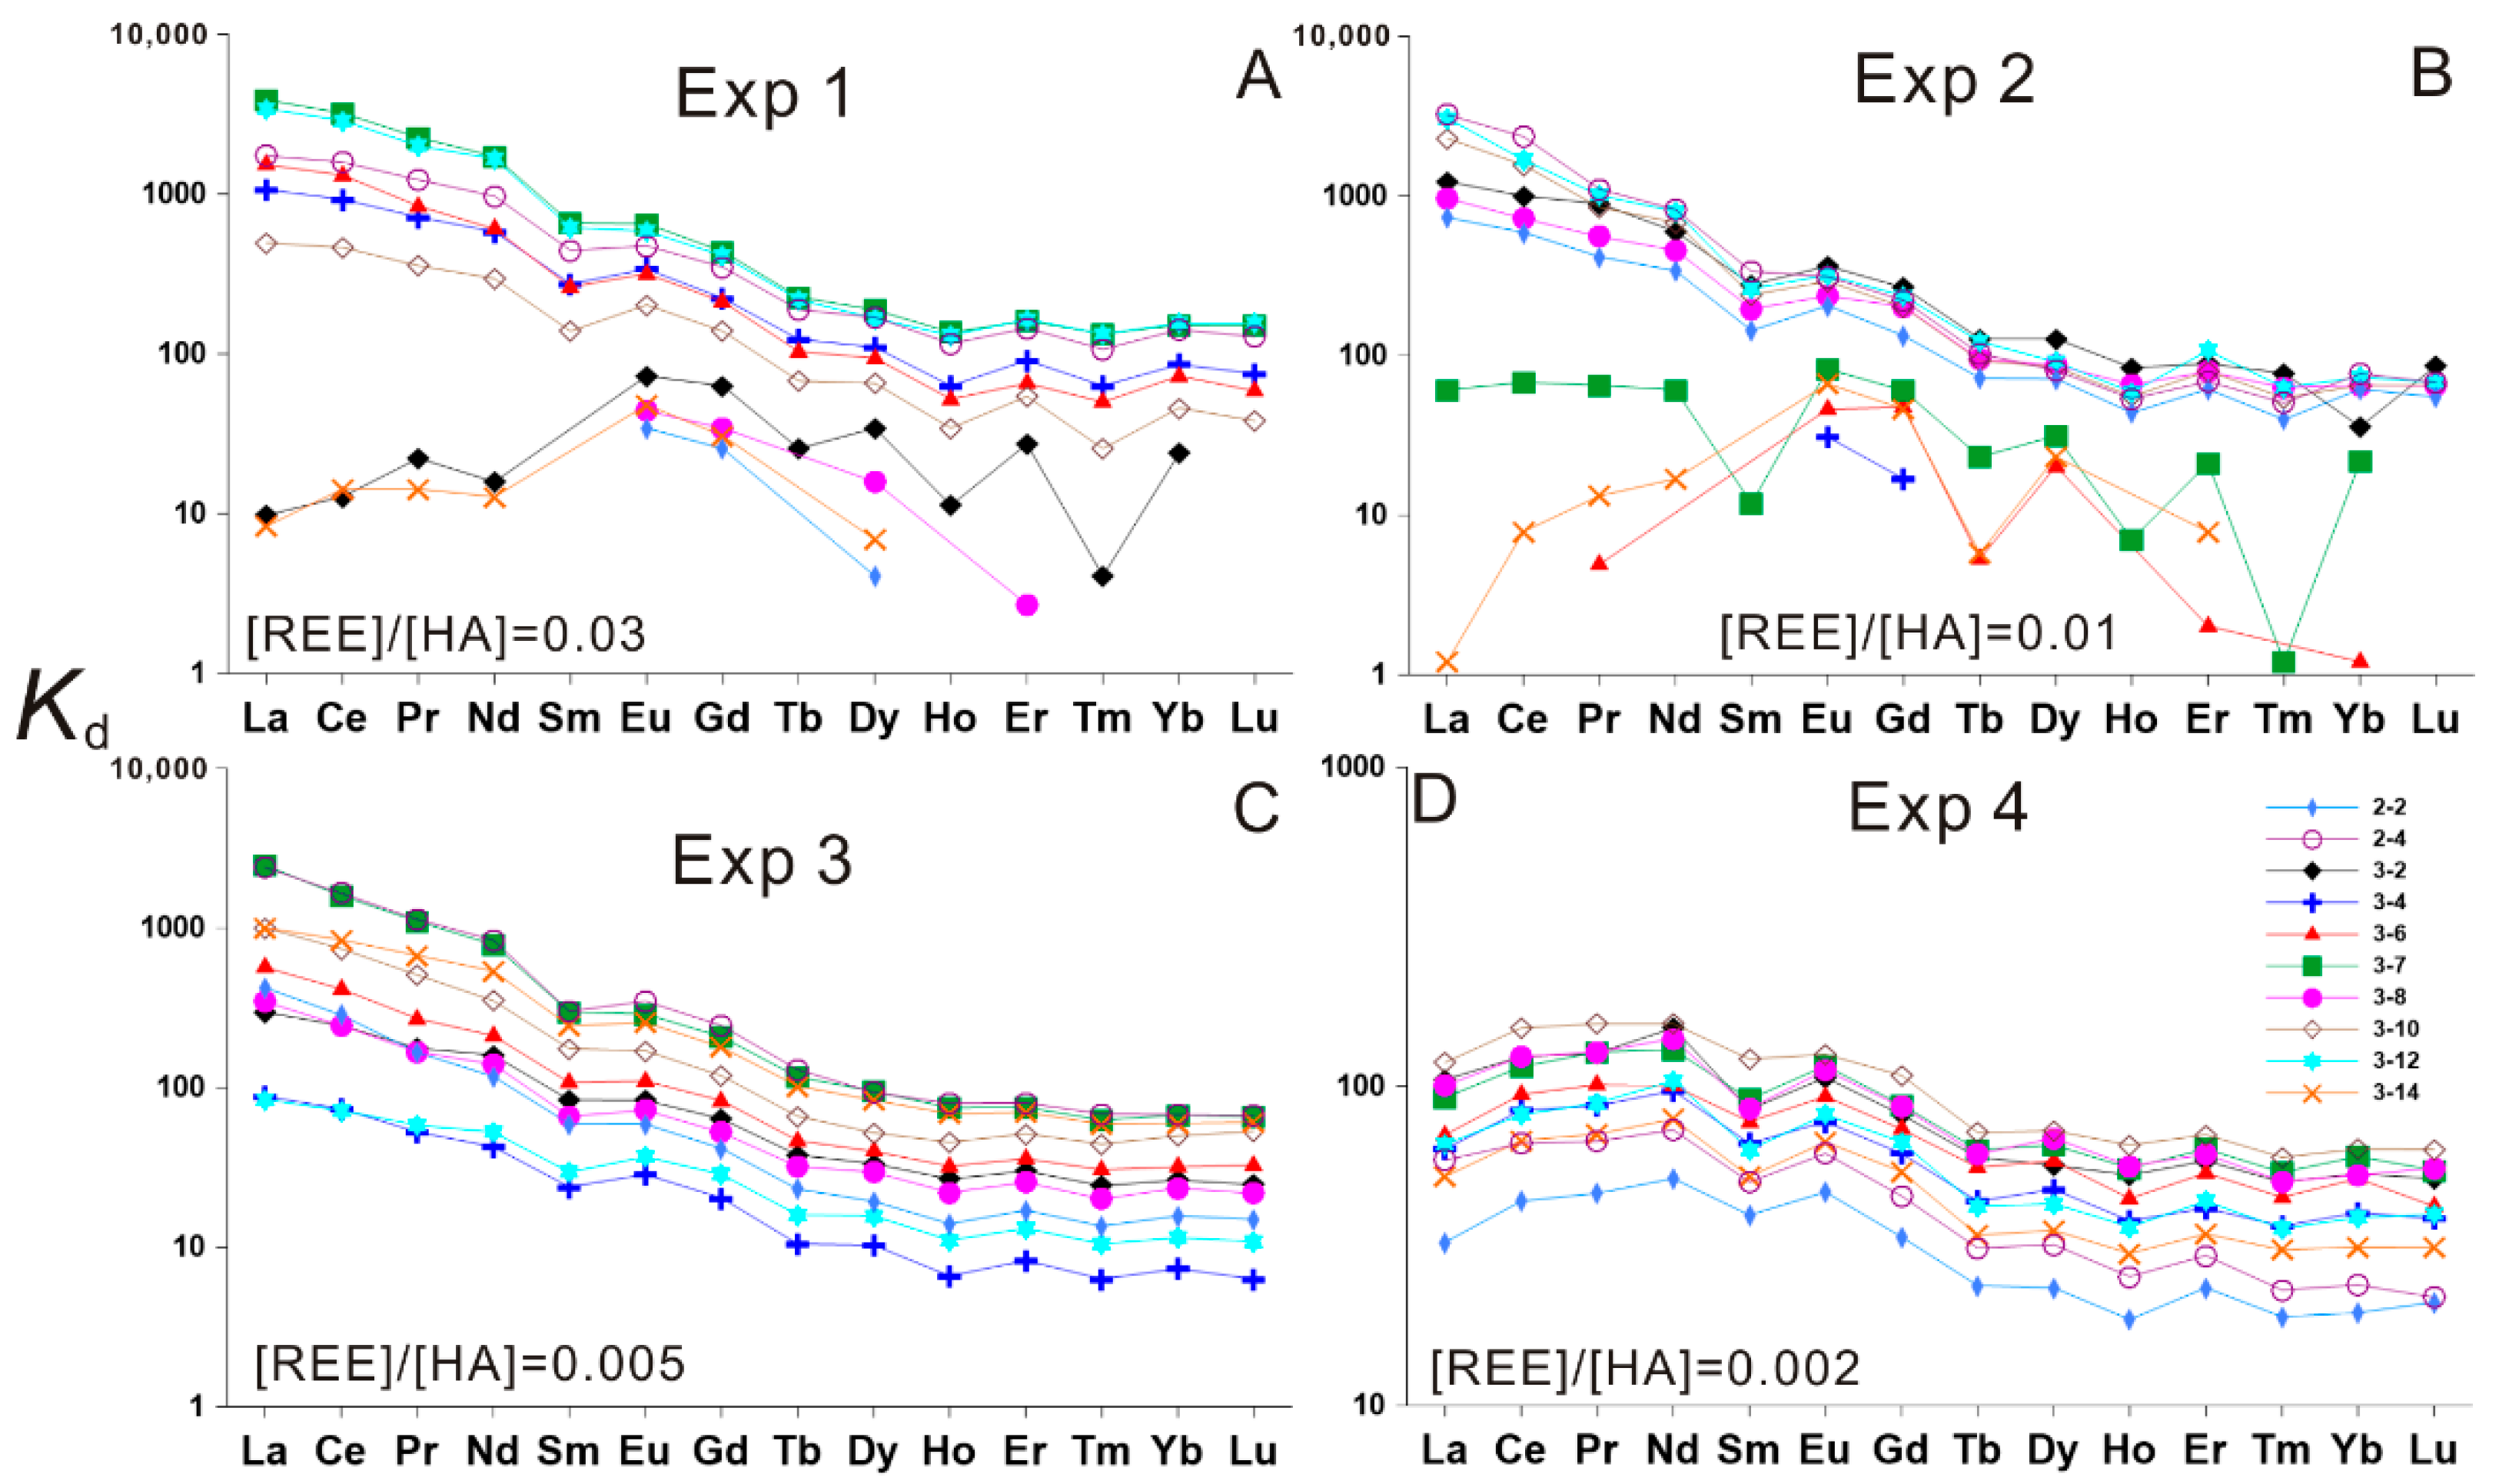
At 150 °C and 200 °C, the Kd values do not show a uniform increase or decrease trend varying with [REE]/[HA] for experiments 1 to 4. Moreover, the Kd values obtained at higher temperatures are generally greater than those at lower temperatures (Figure 2, Figure 3, Figure 4, Figure 5 and Figure 6).
As for K d REE pattern, at 150 °C, a small proportion of samples display a M-type pattern, while most samples show a L-type pattern for experiments 1 and 2 (Figure 5A,B). The studied samples are characterized by L-type and L-M-type K d REE patterns for experiments 3 and 4 (Figure 5C,D), respectively. At 200 °C, the K d REE patterns for the experiments 1–4 are all typical L-type shapes, with a very steep slope (Figure 6).

4. Discussion

The present study demonstrates that with increasing temperature K d REE patterns shift from M-type to L-M- to L-types, commonly accompanied by increases of Kd values (Figure 2, Figure 3, Figure 4, Figure 5 and Figure 6).
Previous studies have confirmed that changes in the binding capacity of HA are expected to result in modifications in the REE patterns [4], which can be used as a fingerprint of the dominant HA binding sites in given conditions [22]. The different effects on HA–REE complexation are anticipated depending on the variations of two kinds of binding sites, carboxylic groups and carboxy–phenolic groups [25]. At acidic pH, La is mainly bonded with carboxylic sites, while Lu is bound to both carboxylic sites and strong multidentate sites [4]. The increase of Kd values and modifications of K d REE patterns probably indicate that there are more HA binding sites for REE, especially for LREE, during heating.
The HA structural modifications during heating may involve changes of the functional groups and REE-binding sites, which may regulate the behaviors of HA–REE complexation. Based on electron spin resonance (ESR) and infrared spectroscopy (IR) spectra, an early study about the structural modifications of soil HA during heating showed that heating led to partial dehydroxylation and/or decarboxylation, vaporization of low-boiling volatiles, oxidation, and solid state transition, as well as an increase of the free radical content [35]. However, the maximum weight loss was 20% after heating to 200 °C, while heating HA from 200 to 400 °C caused great structural changes and a loss of weight of about 90% [35]. Similarly, Francioso et al. [36] also noted that HA samples extracted from peat, leonardite, and lignite all showed obvious structural changes at temperatures > 200 °C during the thermal treatment from 30 to 700 °C. A study carried out by treatment of HA samples at different temperatures under nitrogen atmosphere indicated a decomposition of the different functional groups with increase in temperature with carboxylic acids decomposing at lower temperatures (200–400 °C), and phenolic groups at much higher temperatures (about 600 °C and above) [37].
In contrast, some studies revealed that decomposition of HA could occur at temperature below 200 °C. Yang et al. [38] reported that thermal treatment of HA at 180 °C for about 30 min led to reduction in HA molecular size, with the median value of the molecular weights decreasing from 81 to 41 kDa. Prado et al. [39] highlighted that the HA samples showed a single characteristic decomposition stage starting at around 160 °C, which is assigned to the decomposition of the chain end-groups of HA (including carboxylic acid, aldehyde, amide, amine, alcohol, and phenol groups). Fekete et al. [40] revealed that progressive decomposition of organic matter in water resulted in an increase of dissolved aromatic compounds with an increase in water temperature. Aromatic hydrocarbons appeared at a threshold temperature of ∼80 °C, then phenols at ∼90 °C, and fatty acids in the hottest waters (>90 °C).
It seems that the understandings about the chemical structure modifications of HA during thermal treatment are not consistent, which is also true for the understandings about the behaviors of some organic binding elements during heating. Some researchers stated that thermal treatment would lead to the release of the organic binding elements. For instance, Schwieger et al. [41] reported that thermal treatment of the lignite shows a loss of mercury of 87% up to 200 °C. Mercury is assumed to bind with functional groups like the carboxyl group, hydroxyl group and thiol group in lignite, and the thermally treated lignite (at 200 °C) shows a marked loss of thiol group [41]. Nakada et al. [42] found that heating from 40 to 160 °C increased the release of REEs from HA, which was associated with a decreased concentration of carboxyl groups in HA. Other studies found that some organic binding elements bound more strongly to HA during heating. For instance, Prado et al. [39] revealed that HA gains additional thermal stability when complexed with metal ions. Cornu et al. [43] reported that heating could increase the aromaticity of soil dissolved organic matter (DOM), which exhibited a higher Cd complexation affinity.
The above inconsistent understandings may depend on the variability of organics (HA) to some extent. Katsumi et al. [15] noticed that the heat-induced changes in the HA chemical structure depended on the source plant. Francioso et al. [36] found that there were structural differences between HA samples in relation to their coalification rank, and in comparison to peat HA and leonardite HA, lignite HA was characterized by a more stable chemical composition during heating (>200 °C).
In the present study, the HA–REE complexation experiments show that during the thermal treatment the Kd values commonly increase, suggesting that the amount of REE complexing with HA increase with increasing temperature. One possible explanation for the increased amount of REE bound to HA during heating may be HA decomposition. During thermal treatment HA may decompose into smaller molecules that may have more binding sites for REE. These newly formed REE-binding sites are assumed to be dominated by carboxylic sites, which have a stronger complexation capacity for LREE, causing the K d REE patterns shifting from M-type to L-M- to L-types during heating. However, to address this problem clearly, in-depth research work is required to figure out the exact binding sites of REE complexing with HA at different heating stages.
The results obtained provide valuable information for the geochemical behavior of REE during their interaction with lignite HA in the deep underground environment. This may shed light on the study of interaction between REE and organic matter during the coalification process. Great care should be taken when predicting the complexation behavior of ions with HA during heating, since the binding capacity of HA mixtures may vary substantially.

5. Conclusions

Experimental studies of the influence of thermal treatment on HA–REE complexation were carried out for the 14 REE simultaneously at temperatures 20, 50, 100, 150, and 200 °C. The results showed that at 20 °C the fraction of REE bound to HA enhances with decreasing [REE]/[HA] ratios. MREE have a stronger binding capacity than LREE and HREE, with the K d REE pattern exhibiting a MREE downward concavity shape. The increase of temperature and decrease of [REE]/[HA] generally result in an increase of Kd value. During heating, the K d REE patterns gradually change from M-type at 20 °C to L-M-type at 50 and 100 °C. High temperature and low [REE]/[HA] are both in favor of this change. At 150 °C the K d REE patterns show diverse shapes of M-, L-, and L-M-types. At 200 °C, the K d REE patterns are all typical L-types, displaying a very steep slope. The increasing amount of REE bound to HA and changes of K d REE patterns during heating may be due to HA decomposition. REE-binding sites are assumed to be dominated by carboxylic sites. However, further in-depth studies are required to confirm the accuracy of these predictions.

Supplementary Materials

The following supporting information can be downloaded at: https://www.mdpi.com/article/10.3390/en15197362/s1; Tables S1–S4: title REE concentration (μg/L) in the filtrate for experiments 1–4.

Author Contributions

X.W.: concept, analyses, original draft preparation, data interpretation, editing; F.D.: sample pretreatment, data interpretation; H.C.: conducting HA–REE complexation experiment; S.N.: draft preparation; B.L.: draft preparation; S.P.: sampling; X.Y.: REE determination. All authors have read and agreed to the published version of the manuscript.

Funding

This research was funded by the National Key Research and Development Program of China (No. 2021YFC2902000), the National Natural Science Foundation of China (Nos. 42172194 and 41972181), the Key Project of Coal-based Low-carbon Joint Research Foundation of NSFC and Shanxi Province (No. U1910204), and Fund of Outstanding Talents in Discipline of China University of Geosciences (Wuhan) (No. 102-162301192664).

Acknowledgments

This paper is completed in memory of Fangui Zeng (Taiyuan University of Technology, China), who passed away on 27 October 2021. The significant ideas about the HA–REE thermal experiments are derived from him. It is really a pity that he did not see this work published. His scientific rigor, open-mindedness, and generosity are the precious treasures he left to us. We are grateful to John C. Ayers from Vanderbilt University for his valuable help with the English writing and his comments on this paper.

Conflicts of Interest

The authors declare no conflict of interest. The funders had no role in the design of the study; in the collection, analyses, or interpretation of data; in the writing of the manuscript; or in the decision to publish the results.

References

  1. Schatzel, S.J.; Stewart, B.W. Rare earth element sources and modification in the Lower Kittanning coal bed, Pennsylvania: Implications for the origin of coal mineral matter and rare earth element exposure in underground mines. Int. J. Coal Geol. 2003, 54, 223–251. [Google Scholar] [CrossRef]
  2. Pourret, O.; Martinez, R.E. Modeling lanthanide series binding sites on humic acid. J. Colloid Interface Sci. 2009, 330, 45–50. [Google Scholar] [CrossRef] [PubMed] [Green Version]
  3. Marsac, R.; Davranche, M.; Gruau, G.; Bouhnik-Le Coz, M.; Dia, A. An improved description of the interactions between rare earth elements and humic acids by modeling: PHREEQC-Model VI coupling. Geochim. Cosmochim. Acta 2011, 75, 5625–5637. [Google Scholar] [CrossRef]
  4. Marsac, R.; Davranche, M.; Gruau, G.; Dia, A.; Pédrot, M.; Le Coz-Bouhnik, M.; Briant, N. Effects of Fe competition on REE binding to humic acid: Origin of REE pattern variability in organic waters. Chem. Geol. 2013, 342, 119–127. [Google Scholar] [CrossRef] [Green Version]
  5. Stern, J.C.; Sonke, J.E.; Salters, V.J.M. A capillary electrophoresis-ICP-MS study of rare earth element complexation by humic acids. Chem. Geol. 2007, 246, 170–180. [Google Scholar] [CrossRef]
  6. Stolpe, B.; Guo, L.; Shiller, A.M. Binding and transport of rare earth elements by organic and iron-rich nanocolloids in alaskan rivers, as revealed by field-flow fractionation and ICP-MS. Geochim. Cosmochim. Acta 2013, 106, 446–462. [Google Scholar] [CrossRef]
  7. Marsac, R.; Catrouillet, C.; Davranche, M.; Bouhnik-Le Coz, M.; Briant, N.; Janot, N.; Otero-Fariña, A.; Groenenberg, J.E.; Pédrot, M.; Dia, A. Modeling rare earth elements binding to humic acids with model VII. Chem. Geol. 2021, 567, 120099. [Google Scholar] [CrossRef]
  8. Khan, K.F.; Dar, S.A.; Khan, S.A. Rare earth element (REE) geochemistry of phosphorites of the Sonrai area of Paleoproterozoic Bijawar basin, Uttar Pradesh, India. J. Rare Earths 2012, 30, 507–514. [Google Scholar] [CrossRef]
  9. Davranche, M.; Pourret, O.; Gruau, G.; Dia, A.; Jin, D.; Gaertner, D. Competitive binding of REE to humic acid and manganese oxide: Impact of reaction kinetics on development of cerium anomaly and REE adsorption. Chem. Geol. 2008, 247, 154–170. [Google Scholar] [CrossRef]
  10. Madhavaraju, J.; Löser, H.; Lee, Y.I.L.; Santacruz, R.L.; Pi-Puig, T. Geochemistry of Lower Cretaceous limestones of the Alisitos Formation, Baja California, México: Implications for REE source and paleo-redox conditions. J. S. Am. Earth Sci. 2016, 66, 149–165. [Google Scholar] [CrossRef]
  11. Chen, Y.; Fabbricino, M.; Benedetti, M.F.; Korshin, G.V. Spectroscopic in situ examination of interactions of rare earth ions with humic substances. Water Res. 2015, 68, 273–281. [Google Scholar] [CrossRef] [PubMed]
  12. Alvarez-Puebla, R.A.; Aroca, R.F.; Valenzuela-Calahorro, C.; Garrido, J.J. Retention of cobalt on a humin derived from brown coal. J. Hazard. Mater. 2006, 135, 122–128. [Google Scholar] [CrossRef]
  13. Ghabbour, E.A.; Scheinost, A.C.; Davies, G. XAFS studies of cobalt(II) binding by solid peat and soil-derived humic acids and plant-derived humic acid-like substances. Chemosphere 2007, 67, 285–291. [Google Scholar] [CrossRef]
  14. Bu, G.J.; He, X.S.; Li, T.T.; Wang, Z.X. Insight into indicators related to the humification and distribution of humic substances in Sphagnum and peat at different depths in the Qi Zimei Mountains. Ecol. Indic. 2019, 98, 430–441. [Google Scholar] [CrossRef]
  15. Katsumi, N.; Yonebayashi, K.; Okazaki, M. Effects of heating on composition, degree of darkness, and stacking nanostructure of soil humic acids. Sci. Total Environ. 2016, 541, 23–32. [Google Scholar] [CrossRef]
  16. Moreda-Piñeiro, A.; Bermejo-Barrera, A.; Bermejo-Barrera, P. New trends involving the use of ultrasound energy for the extraction of humic substances from marine sediments. Anal. Chim. Acta 2004, 524, 97–107. [Google Scholar] [CrossRef]
  17. Pourret, O.; Davranche, M.; Gruau, G.; Dia, A. Rare earth elements complexation with humic acid. Chem. Geol. 2007, 243, 128–141. [Google Scholar] [CrossRef] [Green Version]
  18. Yamamoto, Y.; Takahashi, Y.; Shimizu, H. Interpretation of REE patterns in natural water based on the stability constants. Geochim. Cosmochim. Acta 2006, 70, A717. [Google Scholar] [CrossRef]
  19. Yamamoto, Y.; Takahashi, Y.; Shimizu, H. Systematic change in relative stabilities of REE-humic complexes at various metal loading levels. Geochem. J. 2010, 44, 39–63. [Google Scholar] [CrossRef] [Green Version]
  20. Jerzykiewicz, M. Humic and hymatomelanic acids interaction with lanthanide ions. Spectrochim. Acta Part A Mol. Biomol. Spectrosc. 2012, 96, 127–131. [Google Scholar] [CrossRef]
  21. Marsac, R.; Davranche, M.; Gruau, G.; Dia, A. Metal loading effect on rare earth element binding to humic acid: Experimental and modelling evidence. Geochim. Cosmochim. Acta 2010, 74, 1749–1761. [Google Scholar] [CrossRef]
  22. Marsac, R.; Davranche, M.; Gruau, G.; Dia, A.; Bouhnik-Le Coz, M. Aluminium competitive effect on rare earth elements binding to humic acid. Geochim. Cosmochim. Acta 2012, 89, 1–9. [Google Scholar] [CrossRef]
  23. Marsac, R.; Davranche, M.; Morin, G.; Takahashi, Y.; Gruau, G.; Briant, N.; Dia, A. Effect of loading on the nature of the REE-humate complexes as determined by Yb3+and Sm3+LIII-edge EXAFS analysis. Chem. Geol. 2015, 396, 218–227. [Google Scholar] [CrossRef] [Green Version]
  24. Pourret, O.; Davranche, M.; Gruau, G.; Dia, A. Competition between humic acid and carbonates for rare earth elements complexation. J. Colloid Interface Sci. 2007, 305, 25–31. [Google Scholar] [CrossRef] [Green Version]
  25. Pourret, O.; Houben, D. Characterization of metal binding sites onto biochar using rare earth elements as a fingerprint. Heliyon 2018, 4, e00543. [Google Scholar] [CrossRef] [PubMed] [Green Version]
  26. Stern, J.C.; Foustoukos, D.I.; Sonke, J.E.; Salters, V.J.M. Humic acid complexation of Th, Hf and Zr in ligand competition experiments: Metal loading and pH effects. Chem. Geol. 2014, 363, 241–249. [Google Scholar] [CrossRef]
  27. Sonke, J.E.; Salters, V.J.M. Lanthanide-humic substances complexation. I. Experimental evidence for a lanthanide contraction effect. Geochim. Cosmochim. Acta 2006, 70, 1495–1506. [Google Scholar] [CrossRef]
  28. Sonke, J.E. Lanthanide—Humic substances complexation. II. Calibration of humic ion-binding model V. Environ. Sci. Technol. 2006, 40, 7481–7487. [Google Scholar] [CrossRef]
  29. Pédrot, M.; Dia, A.; Davranche, M. Dynamic structure of humic substances: Rare earth elements as a fingerprint. J. Colloid Interface Sci. 2010, 345, 206–213. [Google Scholar] [CrossRef]
  30. Marsac, R.; Banik, N.L.; Lützenkirchen, J.; Catrouillet, C.; Marquardt, C.M.; Johannesson, K.H. Modeling metal ion-humic substances complexation in highly saline conditions. Appl Geochemistry 2017, 79, 52–64. [Google Scholar] [CrossRef]
  31. Catrouillet, C.; Guenet, H.; Pierson-Wickmann, A.C.; Dia, A.; Lecoz, M.B.; Deville, S.; Lenne, Q.; Suko, Y.; Davranche, M. Rare earth elements as tracers of active colloidal organic matter composition. Environ. Chem. 2020, 17, 133–139. [Google Scholar] [CrossRef]
  32. Takahashi, Y.; Yamamoto, M.; Yamamoto, Y.; Tanaka, K. EXAFS study on the cause of enrichment of heavy REEs on bacterial cell surfaces. Geochim. Cosmochim. Acta 2010, 74, 5443–5462. [Google Scholar] [CrossRef]
  33. Tang, J.; Johannesson, K.H. Speciation of rare earth elements in natural terrestrial waters: Assessing the role of dissolved organic matter from the modeling approach. Geochim. Cosmochim. Acta 2003, 67, 2321–2339. [Google Scholar] [CrossRef]
  34. Tang, J.; Johannesson, K.H. Ligand extraction of rare earth elements from aquifer sediments: Implications for rare earth element complexation with organic matter in natural waters. Geochim. Cosmochim. Acta 2010, 74, 6690–6705. [Google Scholar] [CrossRef]
  35. Eltantawy, I.M. The Effect of Heating on Humic Acid Structure and Electronic Spin Resonance Signal. Soil Sci. Soc. Am. J. 1980, 44, 512–514. [Google Scholar] [CrossRef]
  36. Francioso, O.; Montecchio, D.; Gioacchini, P.; Ciavatta, C. Thermal analysis (TG-DTA) and isotopic characterization ( 13C-15N) of humic acids from different origins. Appl. Geochem. 2005, 20, 537–544. [Google Scholar] [CrossRef]
  37. Skhonde, M.P.; Herod, A.A.; van der Walt, T.J.; Tsatsi, W.L.; Mokoena, K. The effect of thermal treatment on the compositional structure of humic acids extracted from South African bituminous coal. Int. J. Miner. Process. 2006, 81, 51–57. [Google Scholar] [CrossRef]
  38. Yang, Y.; Li, H.; Li, J. Variation in humic and fulvic acids during thermal sludge treatment assessed by size fractionation, elementary analysis, and spectroscopic methods. Front. Environ. Sci. Eng. 2014, 8, 854–862. [Google Scholar] [CrossRef]
  39. Prado, A.G.S.; Torres, J.D.; Martins, P.C.; Pertusatti, J.; Bolzon, L.B.; Faria, E.A. Studies on copper(II)- and zinc(II)-mixed ligand complexes of humic acid. J. Hazard. Mater. 2006, 136, 585–588. [Google Scholar] [CrossRef]
  40. Fekete, J.; Sajgó, C.; Kramarics, Á.; Eke, Z.; Kovács, K.; Kárpáti, Z. Aquathermolysis of humic and fulvic acids: Simulation of organic matter maturation in hot thermal waters. Org. Geochem. 2012, 53, 109–118. [Google Scholar] [CrossRef]
  41. Schwieger, A.C.; Gebauer, K.; Ohle, A.; Beckmann, M. Determination of mercury binding forms in humic substances of lignite. Fuel 2020, 274, 117800. [Google Scholar] [CrossRef]
  42. Nakada, R.; Waseda, A.; Okumura, F.; Takahashi, Y. Impact of the decarboxylation reaction on rare earth elements binding to organic matter: From humic substances to crude oil. Chem. Geol. 2016, 420, 231–239. [Google Scholar] [CrossRef]
  43. Cornu, J.Y.; Schneider, A.; Jezequel, K.; Denaix, L. Modelling the complexation of Cd in soil solution at different temperatures using the UV-absorbance of dissolved organic matter. Geoderma 2011, 162, 65–70. [Google Scholar] [CrossRef]
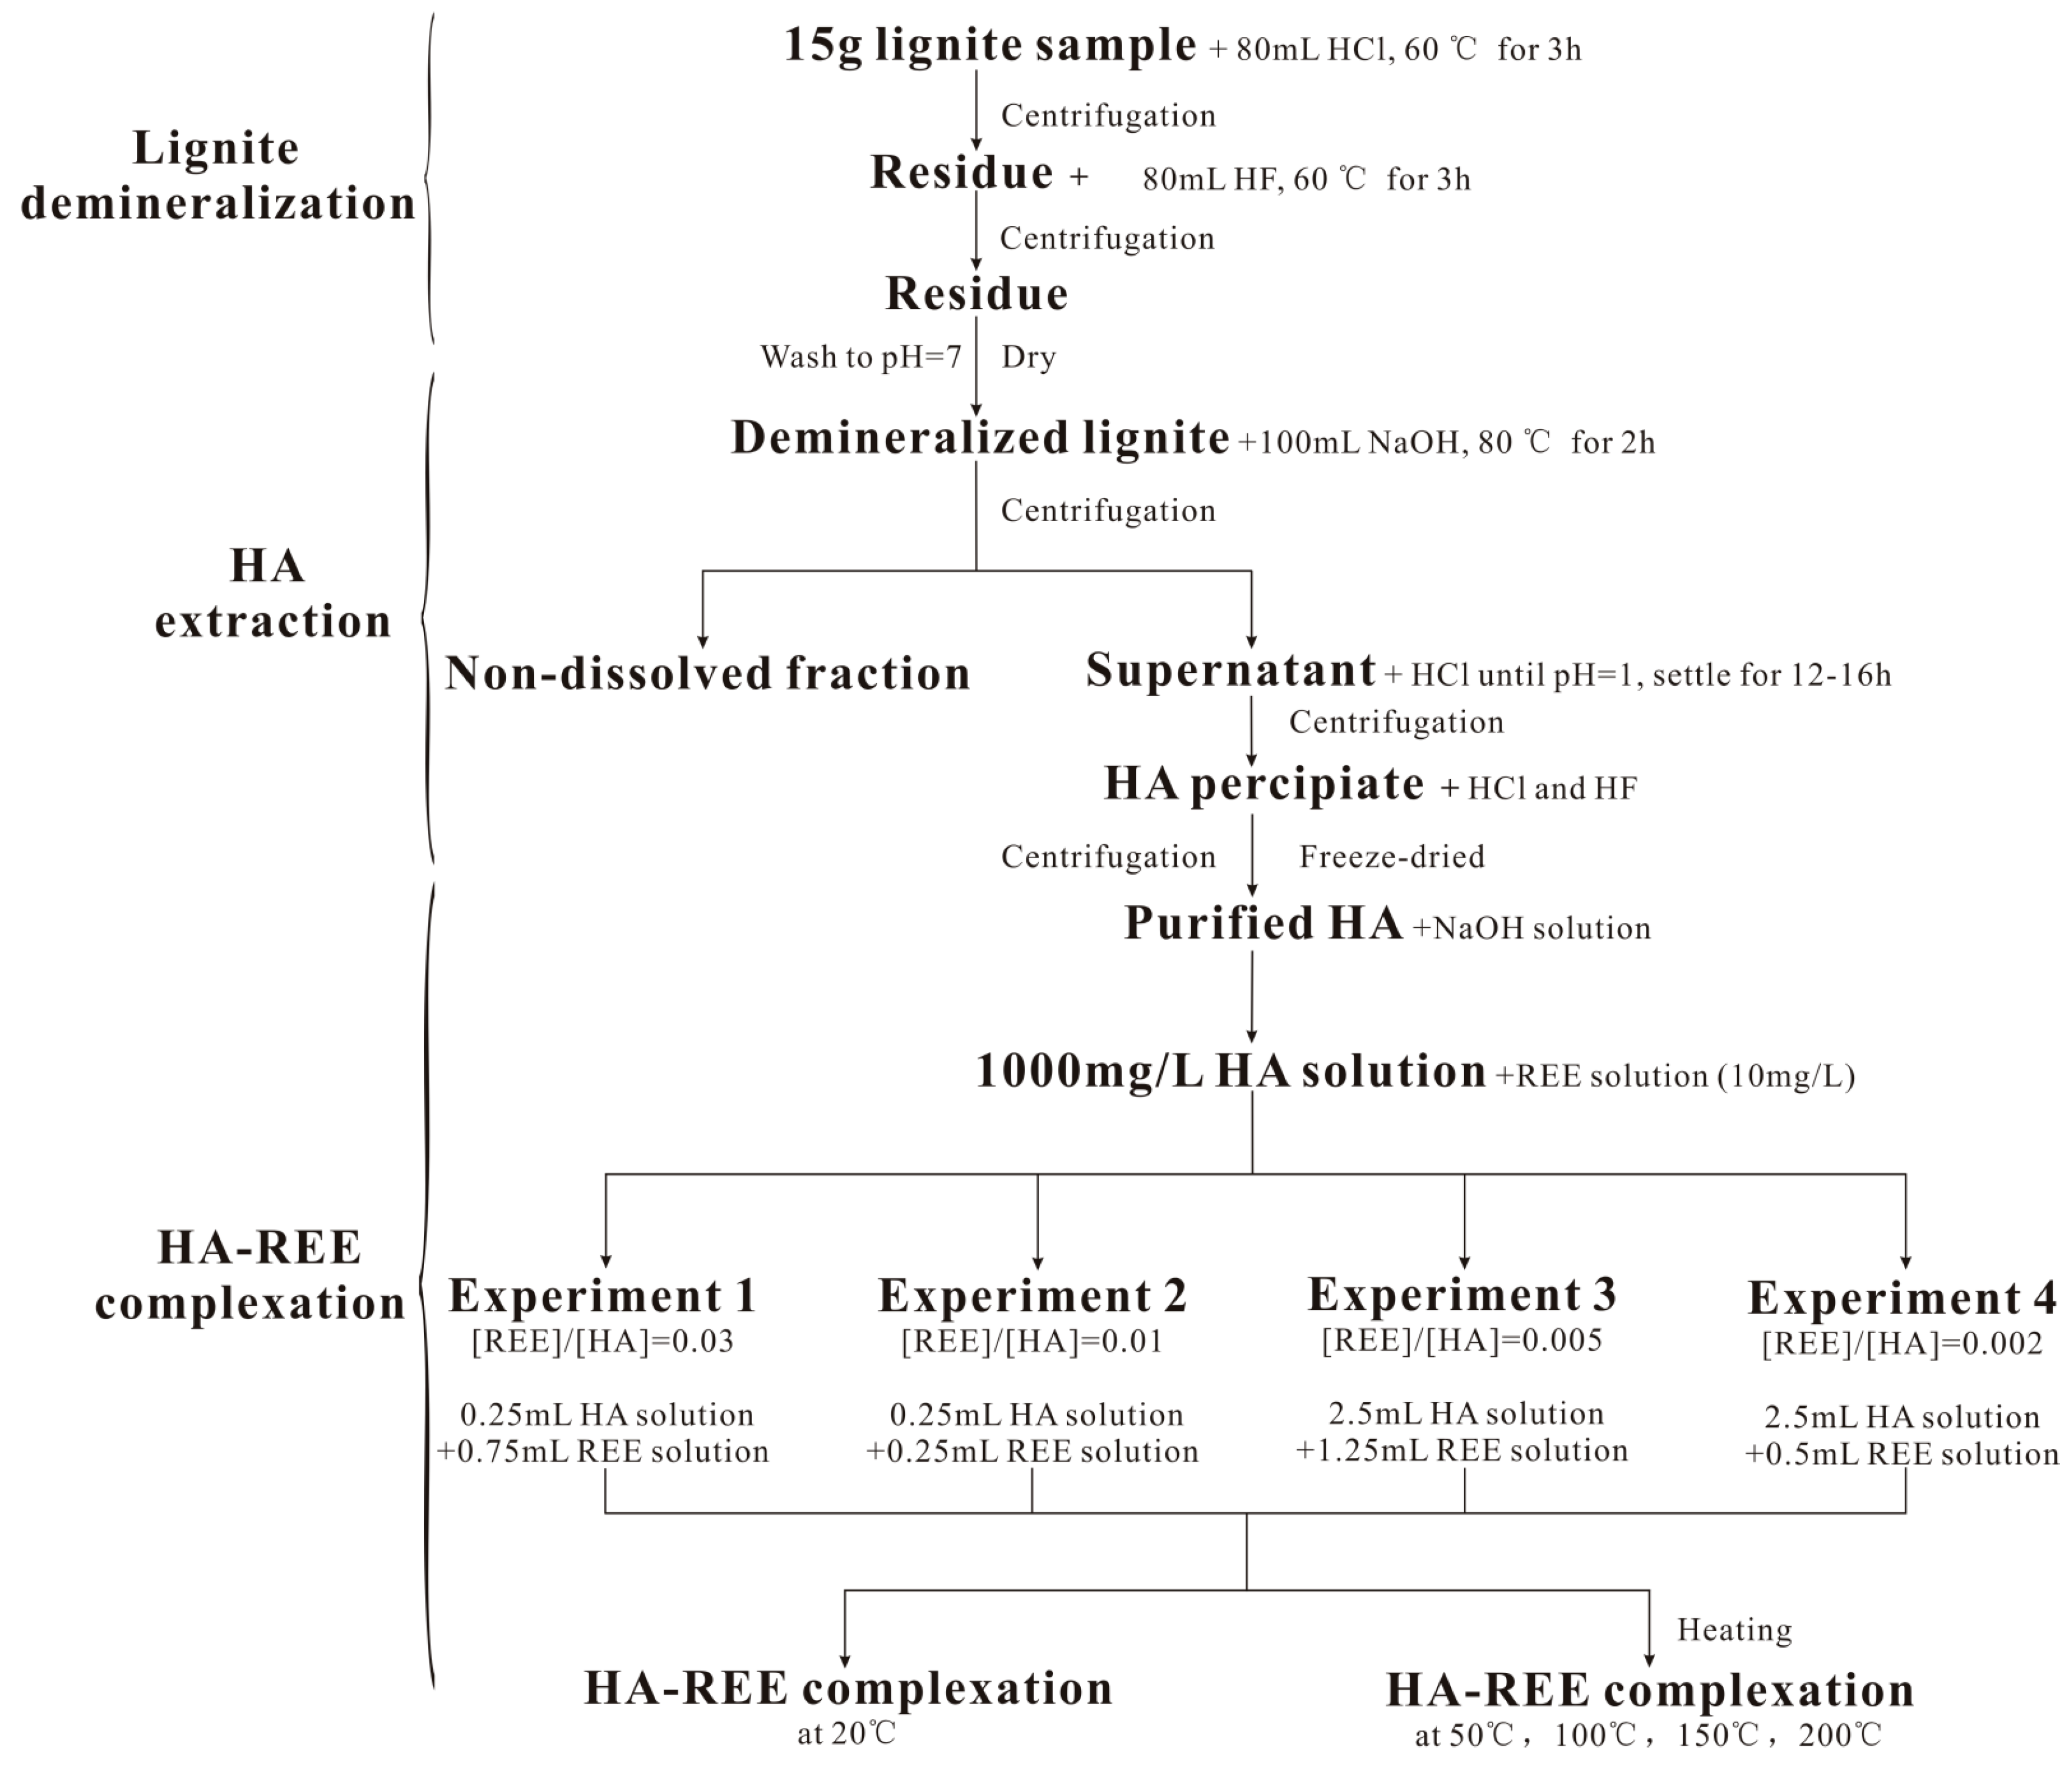
Figure 1. Diagram showing the lignite demineralization, HA extraction, and HA–REE complexation procedures.
Energies 15 07362 g001
Figure 2. REE distribution pattern of Kd obtained at 20 °C and various [REE]/[HA] ratios. (A), Experiment 1, performed at a [REE]/[HA] concentration ratio of 0.03 ([REE]/[HA] = 0.03); (B), Experiment 2, performed at [REE]/[HA] = 0.01; (C), Experiment 3, performed at [REE]/[HA] = 0.005; (D), Experiment 4, performed at [REE]/[HA] = 0.002.
Energies 15 07362 g002
Figure 3. REE distribution pattern of Kd obtained at 50 °C and various [REE]/[HA] ratios. (A), Experiment 1, performed at a [REE]/[HA] concentration ratio of 0.03 ([REE]/[HA] = 0.03); (B), Experiment 2, performed at [REE]/[HA] = 0.01; (C), Experiment 3, performed at [REE]/[HA] = 0.005; (D), Experiment 4, performed at [REE]/[HA] = 0.002.
Energies 15 07362 g003
Figure 4. REE distribution pattern of Kd obtained at 100 °C and various [REE]/[HA] ratios. (A), Experiment 1, performed at a [REE]/[HA] concentration ratio of 0.03 ([REE]/[HA] = 0.03); (B), Experiment 2, performed at [REE]/[HA] = 0.01; (C), Experiment 3, performed at [REE]/[HA] = 0.005; (D), Experiment 4, performed at [REE]/[HA] = 0.002.
Energies 15 07362 g004
Figure 5. REE distribution pattern of Kd obtained at 150 °C and various [REE]/[HA] ratios. (A), Experiment 1, performed at a [REE]/[HA] concentration ratio of 0.03 ([REE]/[HA] = 0.03); (B), Experiment 2, performed at [REE]/[HA] = 0.01; (C), Experiment 3, performed at [REE]/[HA] = 0.005; (D), Experiment 4, performed at [REE]/[HA] = 0.002.
Energies 15 07362 g005
Figure 6. REE distribution pattern of Kd obtained at 200 °C and various [REE]/[HA] ratios. (A), Experiment 1, performed at a [REE]/[HA] concentration ratio of 0.03 ([REE]/[HA] = 0.03); (B), Experiment 2, performed at [REE]/[HA] = 0.01; (C), Experiment 3, performed at [REE]/[HA] = 0.005; (D), Experiment 4, performed at [REE]/[HA] = 0.002.
Energies 15 07362 g006
Table 1. Selected REE isotopes and their detection limits (μg/g).
IsotopeDetection Limit
La1390.002
Ce1400.004
Pr1410.001
Nd1460.004
Sm1470.001
Eu1510.001
Gd1570.001
Tb1590.001
Dy1630.001
Ho1650.001
Er1660.001
Tm1690.001
Yb1720.001
Lu1750.001
Publisher’s Note: MDPI stays neutral with regard to jurisdictional claims in published maps and institutional affiliations.