Abstract
Horizontal axis wind turbines are used for energy generation at domestic as well as industrial levels. In the wind turbines, a reduction in drag force and an increase in lift force are desired to increase the energy efficiency. In this research work, computational fluid dynamics (CFD) analysis has been performed on a turbine blade’s frontal section with an NACA S814 profile. The drag force has been reduced by introducing an array of dimpled structures at the blade surface. The dimpled structures generate a turbulent boundary layer flow on its surface that reduces the drag force and modifies the lift force because it has greater momentum than the laminar flow. The simulation results are verified by the experimental results performed in a wind tunnel and are in close harmony with the simulated results. For accurate results, CFD is performed on the blade’s frontal section at the angle of attack (AOA) with a domain of 0° to 80° and at multiple Reynolds numbers. The local attributes, lift force, drag force and pressure coefficient are numerically computed by using the three models on Ansys fluent: the Spalart-Allmaras, the k-epsilon (RNG) and the k-omega shear stress transport (SST).
1. Introduction
Horizontal axis turbines are the turbines in which the blade rotates perpendicular to the direction of wind such that energy can be generated through the entire revolution. As a result, these turbines achieve better power and output efficiency and are used in large-scale power plants for electricity generation. A horizontal axis wind turbine consists of three blades [1]. Blades are the most important component of a turbine [2] because they are responsible for corkscrewing the energy from the high-temperature and high-pressure gas coming from the burning chamber or the atmosphere [3]. Turbine blades are also responsible for transforming the kinetic energy into the mechanical energy and are often termed as the building blocks of a turbine [4].
The efficiency of a turbine blade [5] depends upon the forces acting on it. The two major forces that act upon the turbine blade as it rotates are the lift force and the drag force [6]. The lift force is the force that acts perpendicular to the direction of a fluid flow, and, due to lift force, the turbine rotates as the flow passes through it. The drag force is the resistive force that acts relative to the direction of a flow. Lift and drag [7] forces are in continuous agreement with each other. To optimize the turbine blade, i.e., increase its efficiency [8], the aim is to maximize the lift and to minimize the drag force. By creating the extruded dimples at the blade surface [9], it creates a turbulent boundary layer flow that has more momentum than a laminar flow, and it also reduces the separation point of a fluid [10] from the blade surface, due to which the laminar flow continues longer around the blade surface. These factors reduce the drag force [11,12] acting on a blade.
By the use of CFD, different aerodynamic [13] properties of a blade are studied, which are very crucial to analyze. The aerodynamic flow around the turbine blade is complex in nature, and it is difficult to analyze through experiments. However, it allows for the observation of flow properties at a location that is inaccessible and not easy to measure by measuring instruments [14]. Different methods are used in Computational Fluid dynamics to simulate the wind turbine. These models are actuator disks, actuator lines and fully resolved rotors [15]. An actuator disk is the least accurate method, whereas the fully resolved rotor is the most accurate method. The actuator line method lies in between these two scales.
Due to different environmental conditions, turbine blade properties may deteriorate. Oxidations and hot corrosions cause the blade to be more inferior day by day. Introducing extruded dimples on its surface reduces the temperature by distributing gradients of equal temperature over its surface. As extruded dimples increase the surface area, as a result, more temperature is distributed, and the risk of damage is reduced [16].
Different studies are available in which the aerodynamic properties of a blade are studied by using a CFD, but there are much fewer studies that explain the flows at a low Reynolds number. Many researchers are working on the improvement of a turbine blade to pull out the maximum kinetic energy from the wind. The effect of the modification of an airfoil on vertical axis wind turbine interpretation is demonstrated by Vijayaraghavan et al. [17]. The consideration of the airfoils in these studies helps in improving the understanding of a low-Reynolds-number flow. Under this domain, some experimental studies are reported, e.g., Schmitz Sunada et al. [18], Sunada et al. [19] and Nazmul [20], whereas numerical studies for the analysis, creation and experimental validation of airfoils at a low Reynolds number have been conducted by Kroo and Kunz, 2000 [21,22]. The influence of a blockage of wind tunnel measurements for an NACA S814 at a very high AOA was studied by Ranbird [23]. From the literature, it is clear that the investigation of an airfoil at very low Reynolds numbers has not been carried out, and there is no trend in improving the efficiency of a blade or optimizing the design intent of a blade. This research work covers both concepts and proceeds further in these domains.
The current research need is to investigate the turbine blades [24] numerically and experimentally at low Reynolds numbers and to introduce a structural design modification at the blade due to which the blade drag is reduced. In this way, the aerodynamic attributes of an airfoil can be modified to maximize the efficiency [25] of a turbine: This research work fulfills the current need of research in both domains of the research gaps. It presents the numerical and experimental investigation of the drag and lift forces at low Reynolds numbers and at different angles of attack, presenting a novel concept to optimize the design of a turbine blade. Creating extruded dimples on the blade’s surface reduces the drag force acting on it and increases the lift force because of the creation of a turbulent boundary layer at the surface. The numerical and experimental results were conducted at varying angles of attack, ranging from 0° to 50° in increments.
2. Design of the Turbine Blade
A horizontal axis wind turbine is a turbine that uses the blades fitted to the rotor that are positioned either upward or downward. These turbines are typically three-bladed or two-bladed turbines operated at very high speeds. In this research work, to perform the numerical and experimental investigations, the turbine blade is designed on the SOLIDWORKS with the help of an NACAS814, as shown in Figure 1.
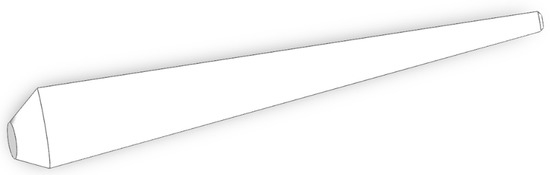
Figure 1.
CAD design of a horizontal axis turbine blade.
As the wind falls on the frontal section of a blade, the turbine revolves, and the forces, due to air, mainly act on the frontal section. So, to obtain more precise values, and for more accurate results, numerical and experimental investigations are performed only at its frontal section.
2.1. Original Frontal Section
Figure 2 shows that the frontal section is detached from the blade or is created by using the numerical software SOLIDWORKS. Table 1 depicts the conditions for the normal and extruded dimpled section of the Turbine blade.
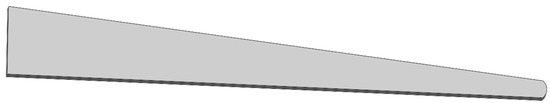
Figure 2.
Normal/Plane section of a turbine blade.

Table 1.
Conditions for the normal section of the turbine blade.
2.2. Proposed Frontal Section
Figure 3 illustrates the frontal section of a turbine blade with a plain surface. The air flow that occurs on it generates a laminar boundary layer flow. The frontal section of a turbine blade with extruded dimples is shown. The air flow that occurs on it creates a turbulent boundary layer flow that has more momentum than a laminar flow, due to which less drag force acts on it.
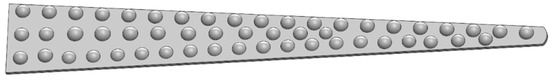
Figure 3.
Dimpled section of a turbine blade.
2.3. Experimental Investigation
Experimental testing prototypes of both dimpled and normal sections of a turbine blade are fabricated, as shown in Figure 4. These parts are manufactured by using a 3D printer [26]. To improve the surface finish, these parts are coated with epoxy resin and aerodur.
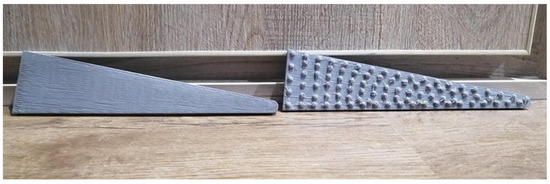
Figure 4.
Prototypes of a normal and dimpled section of a turbine blade.
2.4. Numerical Simulation Models
The mathematical equations and principles that are required in the computation of the lift and drag coefficients of a turbine blade are described briefly. The total force that acts at a single segment of a turbine blade is calculated from the following equation.
F1 = P × AProjected
AProjected is calculated by using SOLIDWORKS modeling, whereas the pressure acting at the tapping is calculated from the following equation
P = Dhkρkg
- Dhk = value of manometer;
- ρk = air density;
- g = acceleration due to gravity;
- P = pressure.
The total force acting on the projectile when the projectile is not tilted on any angle is derived from the following equation.
F = F1 + F2 + F3
The above case of a blade section is a case in which the air entering is not on any angle, but when the blade section has some AOA, the total force also divides into a horizontal direction as the drag force and in a vertical direction as the lift force because the coming air also has some angle. The horizontal and vertical forces are calculated from the following equation.
FD = Fcos (a)
FL = Fsin (a)
From the above forces, the coefficient of pressure CP, coefficient of lift CL and coefficient of drag CD for the blade section are calculated from the equations given below.
where
- FL = lift force;
- FD = drag force;
- V = free stream velocity;
- ρ = density of air;
- dP = difference between ambient and static pressure;
- ATotal = Total Present Projected Area (A1 + A2 + A3 +………+ An).
The surface area of both sections of a turbine blade is calculated by performing a numerical simulation on SOLIDWORKS, as shown in Figure 5. The blade section is divided into 40 stripes, and a three-dimensional drawing is drawn to fasten the peak and base faces of the blade’s frontal section. As all the sections are not visible at the frontal plane facing the wind, its area is not considered. As a result, the pressure that varies in those areas is not dependable and varies due to turbulence.
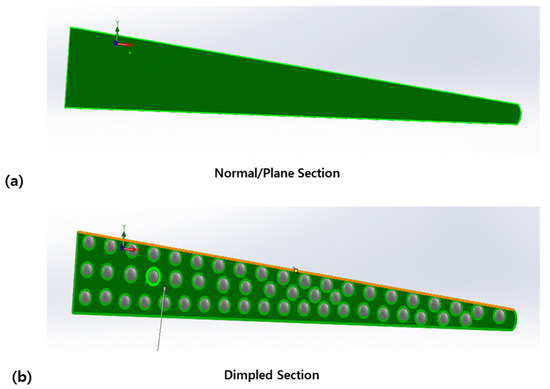
Figure 5.
(a) Projected Area of the normal section of a turbine blade by SOLIDWORKS. (b) Projected Area of the dimpled section of a turbine blade by SOLIDWORKS.
The governing equations for the rotating frame of reference with the blade are the continuity and Navier–Stokes equations. These equations eliminate the usage of moving mesh to account for the rotation of a blade. These equations can be expressed as:
Mass conservation equation:
∂p/∂t + ∇·pvr = 0
Momentum conservation equation (Navier–Stokes):
∇·(pvr) + p(2ω × vr × ω × ω × r) = −∇ρ + V·τv
Ansys Fluent software is used for performing the numerical simulations, and for the analysis of our problem, three turbulent models from Ansys Fluent have been used: Spallart-Allmaras, k-omega SST, and K-epsilon RNG.
All the numerical simulations are performed with the same conditions implemented in the experimental testing, with the air inlet velocity at 0.17 m/s at a Reynolds number of 10,000, whereas the outlet is at an atmospheric condition. For the numerical model, initially, the 16.0 unstructured grid is selected, but to improve the precision, the sphere influence approach is adopted to congeal the grid around the model. The surface is termed as the boundaries that are at the left, right, bottom, top and rears, up to 10D, 10D, 10D, 10D and 15D, respectively, from the surface of a model, where D is the radius of a downstream.
Figure 6a shows the computational domain which comprises an inlet where the flow enters into the domain and an outlet where the flows leave the domain after flowing around the blade, while the remaining boundaries are the walls and symmetry at which the symmetrical blade section is placed. Figure 6b shows the mesh sample for the dimpled case. Initially, for the numerical investigation, the mesh generated is at 2,143,029 elements and 2,871,030 nodes, but the results are obtained in a grid dependency test as a finer mesh made of 2,143,029 elements and 2,871,030 nodes, as compared to the coarse mesh, with 192,994 elements and 64,318 nodes. Figure 6c shows the grid independence test for the lift and drag forces. In numerical simulations, the pressure coefficient for the finer mesh varies in relation to the coarse mesh by 0.52%, which is consistent with the dependency test [27]. In this research study, a finite volume approach is adopted to achieve a system of linear equations for the computation.
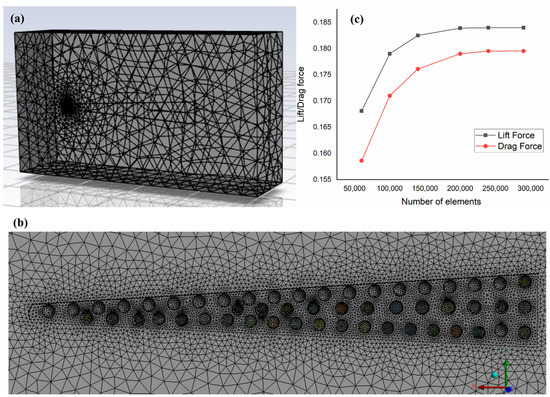
Figure 6.
(a) Computational domain. (b) Mesh diagram of a dimpled section of the turbine blade. (c) Mesh independence test for lift and drag.
In the numerical analysis [28], the flow is considered as steady and incompressible, where the outlet pressure condition is also applied. The air that enters into the computational domain has a velocity of 0.17 m/s and a Reynolds number [29] of 10,000. The density of air is 1.225 kg/m3, whereas the viscosity of air is 1.78 × 10⁻⁵ kg/m·s. To solve a numerical CFD simulation, a finite solver approach is applied with the following properties.
- An upwind-based multidimensional linear construction approach is used.
- Settings are in a default solver mode to solve a steady state problem.
- For the solution of equations of pressure, kinetic energy and turbulence dissipation, the upwind discretization scheme is utilized.
Figure 7 shows the control volume for the normal and dimpled sections of the turbine blade. By proceeding with a finite volume method once these conditions are accomplished in a control volume at a particular mesh, a system of linear equations are achieved, which is required for computation.
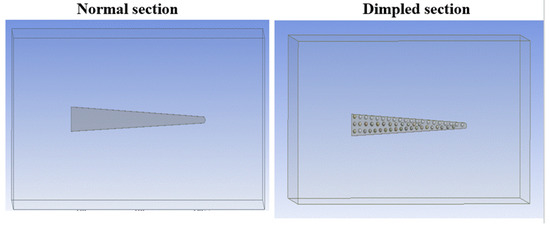
Figure 7.
Geometric enclosure on the normal and dimpled sections of a turbine blade.
3. Results and Discussion
In this research work, numerical and experimental investigations are performed on both the original and dimpled sections of a turbine blade at a Reynolds number of 10,000 [30], whereas the entrance velocity is 0.17 m/s. This presents a novel idea that introducing dimpled structures on a blade surface increases the lift force of the blade and decreases the drag force of the blade. A novel structural variation with dimpled structures has been introduced, which tends to increase the lift force of the blade and decrease the drag force of the blade.
3.1. Single Reference Frame (SRF) Approach
The following assumptions and simplifications are considered for conducting the SRF approach. The study is conducted at a low Reynold number (low velocity). In this approach, one boundary is static and one boundary is moving, whereas the eddies are also not crossing the interface. The numerical studies are performed under these conditions. For better results, the averages of the values are taken.
3.2. Lift and Drag Curves
Figure 8a shows the lift force for both sections of the turbine blade. The lift force is increased by maximizing the AOA, and the conduct of a curve is repetitive. However, it is seen that more lift force is generated in the case of the dimpled section of a turbine blade as compared to the original one. Due to the introduction of the dimpled structures at the turbine blade surface, the air at the top surface of the turbine blade tends to move faster as compared to the lower surface; hence, a lift force acts on the blade due to the pressure difference according to Bernoulli’s equation. Figure 8b shows that the drag force acting on both the dimpled and normal sections of a turbine blade is directly proportional to the angle, and it is seen that most of the values exist about the mean value.
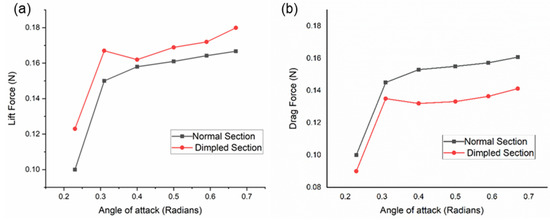
Figure 8.
(a) Lift and (b) drag forces of the normal and dimpled sections with various AOAs.
By introducing the dimpled structures on the blade’s surface, the air flows more smoothly along the blade surface, decreasing the wake and creating a low-pressure area behind the wall. As a result, less drag force acts on it. A dimple also reduces the drag. Decreasing the separation point of a fluid on a blade allows a laminar flow to continue longer around the blade’s surface.
Figure 9a,b show the lift and drag forces with the blade velocity, respectively. The lift and drag forces are directly proportional to the rotating speed of a blade because increasing speed enhances the pressure difference, which increases the lift force, the air resistance and the drag force. As a result, the overall L/D ratio increases. Table 2 shows the CFD coefficients for both sections of the turbine blade.
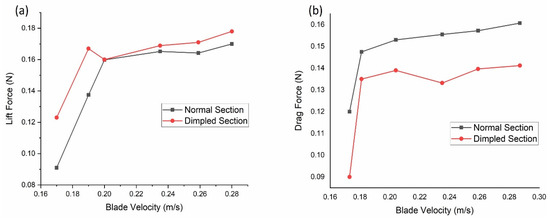
Figure 9.
Variation of (a) lift force and (b) drag force due to blade velocity.
Table 2.
CFD coefficients of both sections of the turbine blade at an optimum AOA for SRF.
Figure 10a,b show the velocity contours for the normal and dimpled sections, respectively. Similarly, Figure 10c,d illustrate the pressure contours for the normal and dimpled sections. For showing the fully developed flow, the lift and drag convergences are shown in Figure 11.
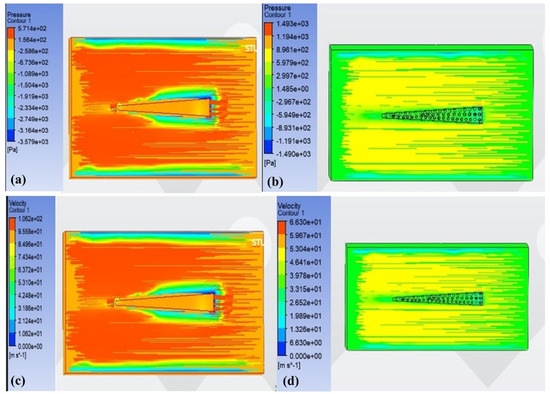
Figure 10.
Velocity contours of the (a) normal and (b) dimpled sections of the turbine blade. Pressure contours of the (c) normal and (d) dimpled sections of the turbine blade.
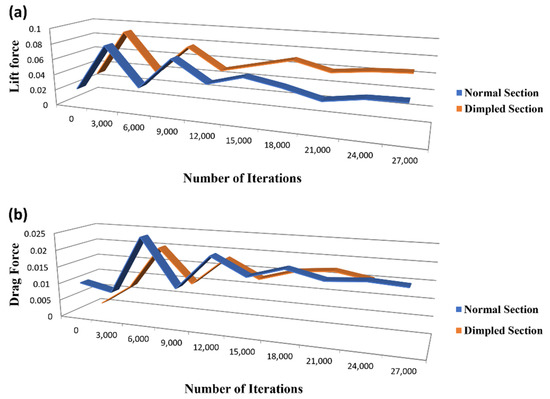
Figure 11.
(a) Lift Convergence Plot. (b) Drag Convergence Plot.
3.3. Uncertainty Calculation for Lift and Drag Forces
The above experimental and numerical results show that the efficiency of a turbine can be increased by introducing the dimpled structure on the turbine blade surface because it minimizes the drag force and maximizes the lift force. Extrusion dimples on a blade surface induce a turbulent boundary layer on its surface. This is because a turbulent boundary layer flow has a larger momentum than a laminar boundary layer flow and thus delays separation. The dimples extrusion increases lift by causing the air to move faster at the top of the blade surface, creating lower pressure there. From the results, it is concluded that the values of lift and drag coefficients are very small for both sections of a turbine blade, and they have a moderate effect on the gas flow, whereas they have major effect on supporting the turbine weight. The blade sections are rotated 360° numerically and experimentally, and it is found that the maximum efficiency of a blade section is achieved at a 25° AOA. Table 3 shows the uncertainty calculations for both sections of a turbine blade at an optimum AOA for SRF.
Table 3.
Uncertainty calculations of both sections of a turbine blade at an optimum AOA for SRF.
3.4. Moving Reference Frame (MRF) Approach
To further confirm the accuracy of the SRF approach, the simulations are carried out using the MRF approach. In a Multiple Reference Frame (MRF), the governing equations are switched between frames, enabling the simulation of two or more domains that may either be stationary or in motion. The MRF approach showed a close agreement with the SRF approach. Figure 12 represents the L/D ratio from the SRF and MRF approaches with different blade velocities.
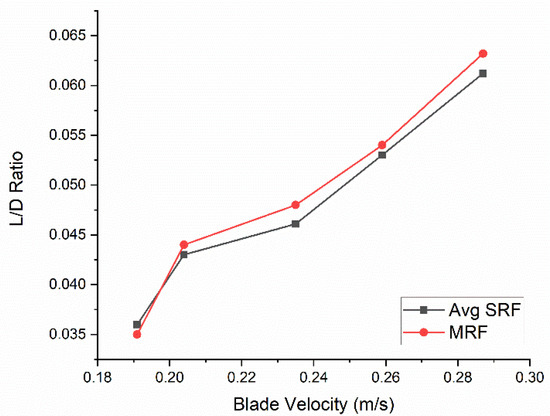
Figure 12.
L/D ratio deduced from the SRF and MRF approaches.
3.5. Lift and Drag Curves
Figure 13 shows the lift and drag curves using the MRF approach. Like the SRF results shown in Figure 8, the lift force for both sections of a turbine blade increases by maximizing the AOA. However, the drag force is reduced in MRF, which increases the L/D ratio.
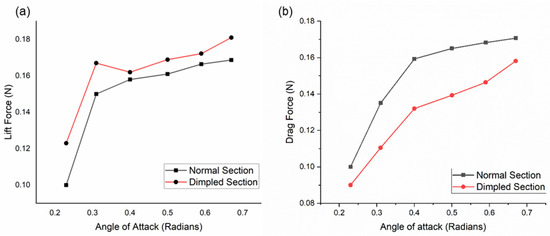
Figure 13.
(a) Lift and (b) drag forces with changing AOA for the MRF approach.
Figure 14a,b show the lift and drag forces with blade velocity, respectively, for the MRF approach. The lift and drag forces are directly proportional to the rotating speed of a blade because increasing speed enhances the pressure difference, which increases the lift force, the air resistance and the drag force. As a result, the overall L/D ratio increases. Table 2 shows the CFD coefficients for both sections of a turbine blade.
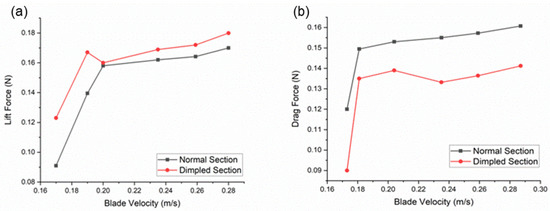
Figure 14.
Variation of (a) lift and (b) drag force due to blade velocity for the MRF case.
For the calculation of uncertainty in lift and drag forces, a similar method to that adopted in SRF is used in MRF, as presented in Table 4. For the normal section, the lift coefficient uncertainty is decreased from 12 to 10%, whereas, for the dimpled section, it is decreased from 8.5 to 8.2%. Similarly, for the normal section, the drag coefficient uncertainty remains the same, whereas, for the dimpled section, it is increased from 5 to 5.8%. The results have uncertainty due to the following reasons.
Table 4.
Uncertainty calculations of both sections of the turbine blade at an optimum AOA for MRF.
- The difference between the constant boundary conditions in CFD and the actual (variable) boundary conditions in the experiments. These boundary conditions are assumed to be constant in CFD and the experiments.
- The wind tunnel may have some systematic errors that cause the difference between the CL (EXP) and CL (CFD).
- The wind tunnel may have blockage effects at the inlet or exit that cause the difference between the experimental and CFD coefficients.
3.6. Experimental Investigation of Lift and Drag Coefficients
Wind tunnel tests help in understanding the nature of a flow around and over a blade; they also help in analyzing the aerodynamic forces that acts upon the body. The TA 300/300 C subsonic wind tunnel as shown in Figure 15, is used to analyze the aerodynamic effects around the blade. Aerodynamic properties are performed in a steady state mode of a wind tunnel, in which the fluid properties remain same. To analyze the behavior of a flow around a blade at a low Reynolds number, the velocity of air is properly adjusted and calibrated. The turbine blade is clamped in a wind tunnel with the help of a thin aluminum road inserted along the axis of a blade in the same way as in a real framework. The wind tunnel test helps in verifying the numerical results in relation to the experimental ones and identifies the areas where improvement is required.
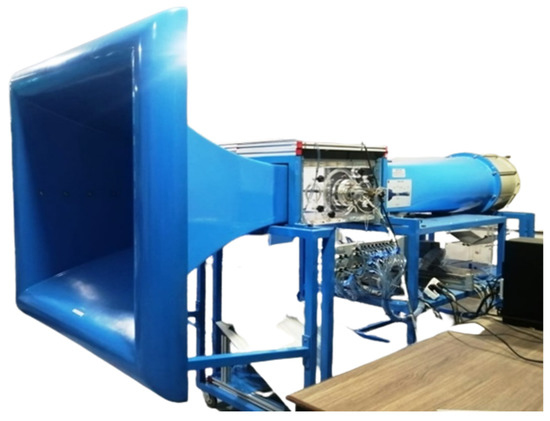
Figure 15.
Experimental testing performed at a wind tunnel.
The above numerical and experimental results verify that the efficiency of a horizontal axis wind turbine can be increased by increasing the L/D ratio of a turbine blade. Arrays of dimples on a turbine blade surface decrease the fluid separation point of a fluid on the blade and allow the laminar flow to continue longer around the blade surface, thus reducing the drag force, whereas, by increasing the pressure and the difference and by decreasing the wake region around the blade surface, more lift force is generated. The L/D ratio of a turbine blade can be increased by optimizing the geometry of a blade, introducing arrays of a dimple. As a result, the efficiency of the wind turbine is enhanced. This research study can be further developed by investigating it numerically and experimentally under the supersonic region to obtain more accurate and precise results. The ways in which the L/D ratio of a blade can be increased should be discovered in order to ensure that the real phenomenon turbine can be investigated at the multiple angular velocities to obtain more precise results. A turbine blade can be investigated experimentally and numerically at multiple points along its surface during its working. Investigations are conducted with perfection and try to minimize the difference between numerical and experimental results.
4. Conclusions
In this research work, numerical and experimental investigations were performed on the turbine blade section. Similar conditions were applied in numerical and experimental testing to analyze the factors that are not possible to visualize in real time, and efforts are also made to analyze the factors on which the drag coefficient is dependent and how it should be minimized. The following are some important conclusions drawn from the study.
- In this research work, the investigation is carried out at angles of attack from 0° to 360°, at a Reynolds number 10,000 and at an inlet velocity 0.17 m/s.
- The lift force and drag force acting on a turbine blade section are directly proportional to the AOA, whereas the optimum AOA where the maximum L/D ratio is attained is 25°.
- The efficiency of a turbine blade can be increased by optimizing the design of a turbine blade and by increasing the L/D ratio.
- The number of velocity streamlines is inversely proportional to the drag coefficient, as a smaller number of velocity streamlines appear in the dimpled section of a turbine blade as compared to the original section of a turbine blade.
- Dimpled structures on the turbine blade surface cause the air to flow more smoothly; thus, a wake region is decreased, creating a low-pressure area behind the blade surface due to which less drag is generated there. Dimpled structures on the turbine blade surface cause the air to flow smoother, reducing the wake region and creating a low-pressure area behind the blade surface, hence reducing the drag force acting on the blade. They also cause the air on the top surface of the turbine blade to move faster; as a result, the pressure decreases, and more lift force is generated.
- The results from SRF and MRF are in good agreement with the experimental results.
Author Contributions
Conceptualization, A.K. and I.S.; methodology, A.K. and S.A.; software, M.U.S. and B.R., writing—original draft preparation, A.K. and S.A.; writing—review and editing, T.A.K. and Y.A.; visualization, S.A.; supervision, D.W.J.; funding acquisition, S.A. and D.W.J. All authors have read and agreed to the published version of the manuscript.
Funding
This research was funded by the Brain Pool program of the Ministry of Science and by ICT through the National Research Foundation of Korea (2021H1D3A2A01100014).
Conflicts of Interest
The authors declare that there is no conflict of interest.
References
- Adeyeye, K.A.; Ijumba, N.; Colton, J. The Effect of the Number of Blades on the Efficiency of A Wind Turbine. IOP Conf. Ser. Earth Environ. Sci. 2021, 801, 012020. [Google Scholar] [CrossRef]
- Kamalasree, H.; Rao, A.V.L. Design & Manufacturing ofsteam turbine blade. Int. J. Sci. Eng. Res. 2017, 8, 373–384. [Google Scholar]
- Pigott, R. Turbine blade vibration due to partial admission. Int. J. Mech. Sci. 1980, 22, 247–264. [Google Scholar] [CrossRef]
- Najar, F.A.; Harmain, G.A. Blade Design and Performance Analysis of Wind Turbine. Int. J. ChemTech Res. 2013, 5, 1054–1061. [Google Scholar] [CrossRef]
- Rehman, S.; Mahbub Alam, M.; Alhems, L.M.; Mujahid Rafique, M. Horizontal Axis Wind Turbine Blade Design Methodologies for Efficiency Enhancement A Review. Energies 2018, 11, 506. [Google Scholar] [CrossRef]
- Abid, M.A.R.; Sarwar, M.I.; Tahir, A.; Shah, S.M.; Shehryar, M. Gas Turbine Blade Flow Analysis Comparison Using CFD and Wind Tunnel. In Proceedings of the 9th International Bhurban Conference on Applied Sciences & Technology (IBCAST), Islamabad, Pakistan, 9–12 January 2012; pp. 203–207. [Google Scholar] [CrossRef]
- Oukassou, K.; El Mouhsine, S.; El Hajjaji, A.; Kharbouch, B. Comparison of the Power, Lift and Drag Coefficients of Wind Turbine Blade from Aerodynamics Characteristics of Naca0012 and Naca2412. Procedia Manuf. 2019, 32, 983–990. [Google Scholar] [CrossRef]
- Sakthivel, P.; Rajamani, G.P. Design and Analysis of Modified Wind Turbine Blades. Asian J. Res. Soc. Sci. Humanit. 2017, 7, 166. [Google Scholar] [CrossRef]
- Saraf, A.K.; Singh, D.M.P.; Chouhan, D.T.S. Effect of Dimple on Aerodynamic Behaviour of Airfoil. Int. J. Eng. Technol. 2017, 9, 2268–2277. [Google Scholar] [CrossRef]
- Sourav, A.P.; Koly, F.A. A review of different shaped dimple effects on aerofoil surfaces. In Proceeding of the International Conference on Mechanical Engineering and Renewable Energy 2019 (ICMERE 2019), Chittagong, Bangladesh, 11–13 December 2019. [Google Scholar]
- Kumar Shaw, K.; Kesarwani, Y.; Chakravarty, P. Study of Dimple Effect on Aerodynamic Drag Characteristics of a Car. Prepr. Int. J. Innov. Res. Sci. Eng. Technol. 2020, 9, 4628–4637. [Google Scholar] [CrossRef]
- Zhou, D.; Wu, L.; Tan, C.; Hu, T. Study on the Effect of Dimple Position on Drag Reduction of High-Speed Maglev Train. Transp. Saf. Environ. 2021, 3, tdab027. [Google Scholar] [CrossRef]
- Thabet, S.; Thabit, T.H. Computational Fluid Dynamics: Science of the Future. Int. J. Res. Eng. 2018, 5, 430–433. [Google Scholar] [CrossRef]
- Settar, A.N.; Sarip, S.; Kaidi, H.M. Computational Fluid Dynamics Model of Wells Turbine for Oscillating Water Column System: A Review. J. Phys. Conf. Ser. 2021, 2053, 012013. [Google Scholar] [CrossRef]
- Kalvig, S.; Manger, E.; Hjertager, B. Comparing Different CFD Wind Turbine Modelling Approaches with Wind Tunnel Measurements. J. Phys. Conf. Ser. 2014, 555, 012056. [Google Scholar] [CrossRef]
- Li, Q.; Jia, H.; Qiu, Q.; Lu, Y.; Zhang, J.; Mao, J.; Fan, W.; Huang, M. Typhoon-Induced Fragility Analysis of Transmission Tower in Ningbo Area Considering the Effect of Long-Term Corrosion. Appl. Sci. 2022, 12, 4774. [Google Scholar] [CrossRef]
- Ismail, M.F.; Vijayaraghavan, K. The Effects of Aerofoil Profile Modification on a Vertical Axis Wind Turbine Performance. Energy 2015, 80, 20–31. [Google Scholar] [CrossRef]
- Sunada, S.; Sakaguchi, A.; Kawachi, K. Airfoil Section Characteristics at a Low Reynolds Number. J. Fluids Eng. Trans. ASME 1997, 119, 129–135. [Google Scholar] [CrossRef]
- Sunada, S.; Yasuda, T.; Yasuda, K.; Kawachi, K. Comparison of Wing Characteristics at an Ultralow Reynolds Number. J. Aircr. 2002, 39, 331–338. [Google Scholar] [CrossRef]
- Haque, M.N.; Ali, M.; Ara, I. Experimental Investigation on the Performance of NACA 4412 Aerofoil with Curved Leading Edge Planform. Procedia Eng. 2015, 105, 232–240. [Google Scholar] [CrossRef]
- Kroo, I.; Prinz, F.; Shantz, M.; Kunz, P.; Fay, G.; Cheng, S.; Fabian, T.; Partridge, C. The Mesicopter: A Miniature Rotorcraft Concept; Stanford University: Stanford, CA, USA, 2000. [Google Scholar]
- Viieru, D.; Tang, J.; Lian, Y.; Liu, H.; Shyy, W. Flapping and Flexible Wing Aerodynamics of Low Reynolds Number Flight Vehicles. In Proceedings of the 44th AIAA Aerospace Sciences Meeting and Exhibit 2006, Reno, Nevada, 9–12 January 2006; Volume 9, pp. 6087–6104, Collected Technical Paper. [Google Scholar] [CrossRef]
- Rainbird, J.M.; Peiró, J.; Graham, J.M.R. Blockage-Tolerant Wind Tunnel Measurements for a NACA 0012 at High Angles of Attack. J. Wind Eng. Ind. Aerodyn. 2015, 145, 209–218. [Google Scholar] [CrossRef]
- Schubel, P.J.; Crossley, R.J. Wind Turbine Blade Design. Energies 2012, 5, 3425–3449. [Google Scholar] [CrossRef]
- Bardakjian, A.T.; Mandadakis, P.P.; Tingle, A. Efficiency Comparison of Horizontal Axis Wind Turbines and Bladeless Turbines. PAM Rev. Energy Sci. Technol. 2017, 4, 59–75. [Google Scholar] [CrossRef]
- Ahmed, Z.U.; Mashud, M.; Joty, S.M. Assessment of Viscous Models on the Simulation of Low Cut-Off Wind Turbine Blade. ARPN J. Eng. Appl. Sci. 2021, 16, 1954–1966. [Google Scholar]
- Ciappi, L.; Stebel, M.; Smolka, J.; Cappietti, L.; Manfrida, G. Analytical and Computational Fluid Dynamics Models of Wells Turbines for Oscillating Water Column Systems. J. Energy Resour. Technol. Trans. ASME 2022, 144, 050903. [Google Scholar] [CrossRef]
- Zongheng, H.; Tao, Y.; Guanyu, C.; Xiangrui, L.; Yu, H. Simulation Analysis on the Blade Airfoil of Small Wind Turbine. IOP Conf. Ser. Earth Environ. Sci. 2019, 295, 012079. [Google Scholar] [CrossRef]
- Uruba, V. Reynolds Number in Laminar Flows and in Turbulence. AIP Conf. Proc. 2019, 2118, 020003. [Google Scholar] [CrossRef]
- Michna, J.; Rogowski, K. Numerical Study of the Effect of the Reynolds Number and the Turbulence Intensity on the Performance of the NACA 0018 Airfoil at the Low Reynolds Number Regime. Processes 2022, 10, 1004. [Google Scholar] [CrossRef]
Publisher’s Note: MDPI stays neutral with regard to jurisdictional claims in published maps and institutional affiliations. |
© 2022 by the authors. Licensee MDPI, Basel, Switzerland. This article is an open access article distributed under the terms and conditions of the Creative Commons Attribution (CC BY) license (https://creativecommons.org/licenses/by/4.0/).