Review

The Study for Technical Analysis on the Development Potential of Multi-Zone Oil, Gas in Crossfield, Canada

1
MKS Investments Ltd., Calgary, AB T2G 0H5, Canada
2
Korea Institute of Geoscience & Mineral Resources (KIGAM), Pohang 37559, Korea
3
Department of Mineral Resources and Energy Engineering, Jeonbuk National University, Jeonju 54896, Korea
*
Author to whom correspondence should be addressed.
Energies 2022, 15(18), 6860; https://doi.org/10.3390/en15186860
Submission received: 19 August 2022 / Revised: 10 September 2022 / Accepted: 13 September 2022 / Published: 19 September 2022
(This article belongs to the Section H1: Petroleum Engineering)

Abstract

:
Crossfield is located in the province of Alberta in Canada and is one of the most well-known reservoirs of hydrocarbons. Since the 1950s, there has been continuous exploitation of more than 10 formations such as Cardium, Viking, Ellerslie, Elkton, Shunda, and Wabamun. Because of its location near the Foothills, the southwestern part of the Western Canada Sedimentary Basin, the Crossfield area has a complex geology and relatively deeper reservoirs, therefore requiring an in-depth examination of each formation. In this study, geological, technical, and economic analyses were performed on each formation within the 10 sections of the study lands in the Crossfield area. As the result of the study, there was potential for drilling 48 horizontal wells in the Cardium A zone and the Viking formation. In addition, it turned out to be economically feasible even at the WTI price of 60 dollars per barrel considering Alberta’s Royalty Framework, which is determined by the production rate and the price of oil, and the Horizontal Oil New Well Royalty Rate feature. A further study is required to investigate the exploitation potential of the Cardium B zone, the Ellerslie, and the Elkton formations in this area.

1. Introduction

Located in the southwestern part of Alberta, Crossfield is approximately 70 km north of Calgary and produces oil and gas from several formations of the Cretaceous, Mississippian, and Devonian ages. Starting with the exploitation of Elkton reservoirs in the mid-1950s followed by continuous exploitations and long-term productions from the Cardium, Wabamun, Viking, Ellerslie, and Shunda formations, it became one of the most important oilfields in Canada. Currently, there are companies such as ExxonMobil, TAQA North, Harvest Operations, TransGlobe Energy, and Steelhead Petroleum, that are actively exploiting oil and gas reservoirs in the area.
The target land of this study is 10 sections located at Township 28–31, Range 1–4 of Meridian 5 (T28-31, R1-4W5). In Alberta Township Survey (ATS) System, a section is a one-by-one mile square with an area of 256 hectares; therefore, the total area is equal to 2560 hectares (25.6 km2). The Western Canada Sedimentary Basin (WCSB) extends from the east thrust belt region of the Rocky Mountains called the Foothills, to the province of Manitoba where the basin becomes shallower and eventually disappears [1]. The study area is located to the east of Southern Foothills, or the southwestern part of the WCSB. Therefore, this area has deeper reservoirs compared to other WCSB areas and has more than 10 formations that contain hydrocarbons, requiring in-depth investigation for evaluating its exploitation potential.
The area of study contains several hydrocarbon reservoirs formed in different periods; thus it is essential to understand the geological history and structure, and to analyze the production potential in each formation. Correspondingly, the exploitation can be performed in several ways; selective, sequential, or integrative method, which makes the analysis of its production potential more crucial. Additionally, to determine the optimal placement of the horizontal wells which are commonly used in North America, a petrophysical analysis along with a prediction of production potential are required. An analysis of hydrocarbon exploitation potential includes the analyses of the geological structure of the reservoir, petrophysical logging, reservoir properties based on the core analysis data, and lastly, the evaluation of the accessibility by examining the infrastructure in the vicinity. Based on these analyses, the drilling location of the vertical or horizontal wells, and the production and economics of each well can be determined.
Hence, in this study, the characteristics of each reservoir in the Crossfield area were investigated from the historical exploration, exploitation, and production data. Based on these investigations, the reservoir properties were estimated. The Cardium and Viking formations that are found to have hydrocarbon potential from the study, and also Ellerslie and Elkton formations were analyzed for their exploitation potential and then evaluated for the economics.

2. Exploitation Review
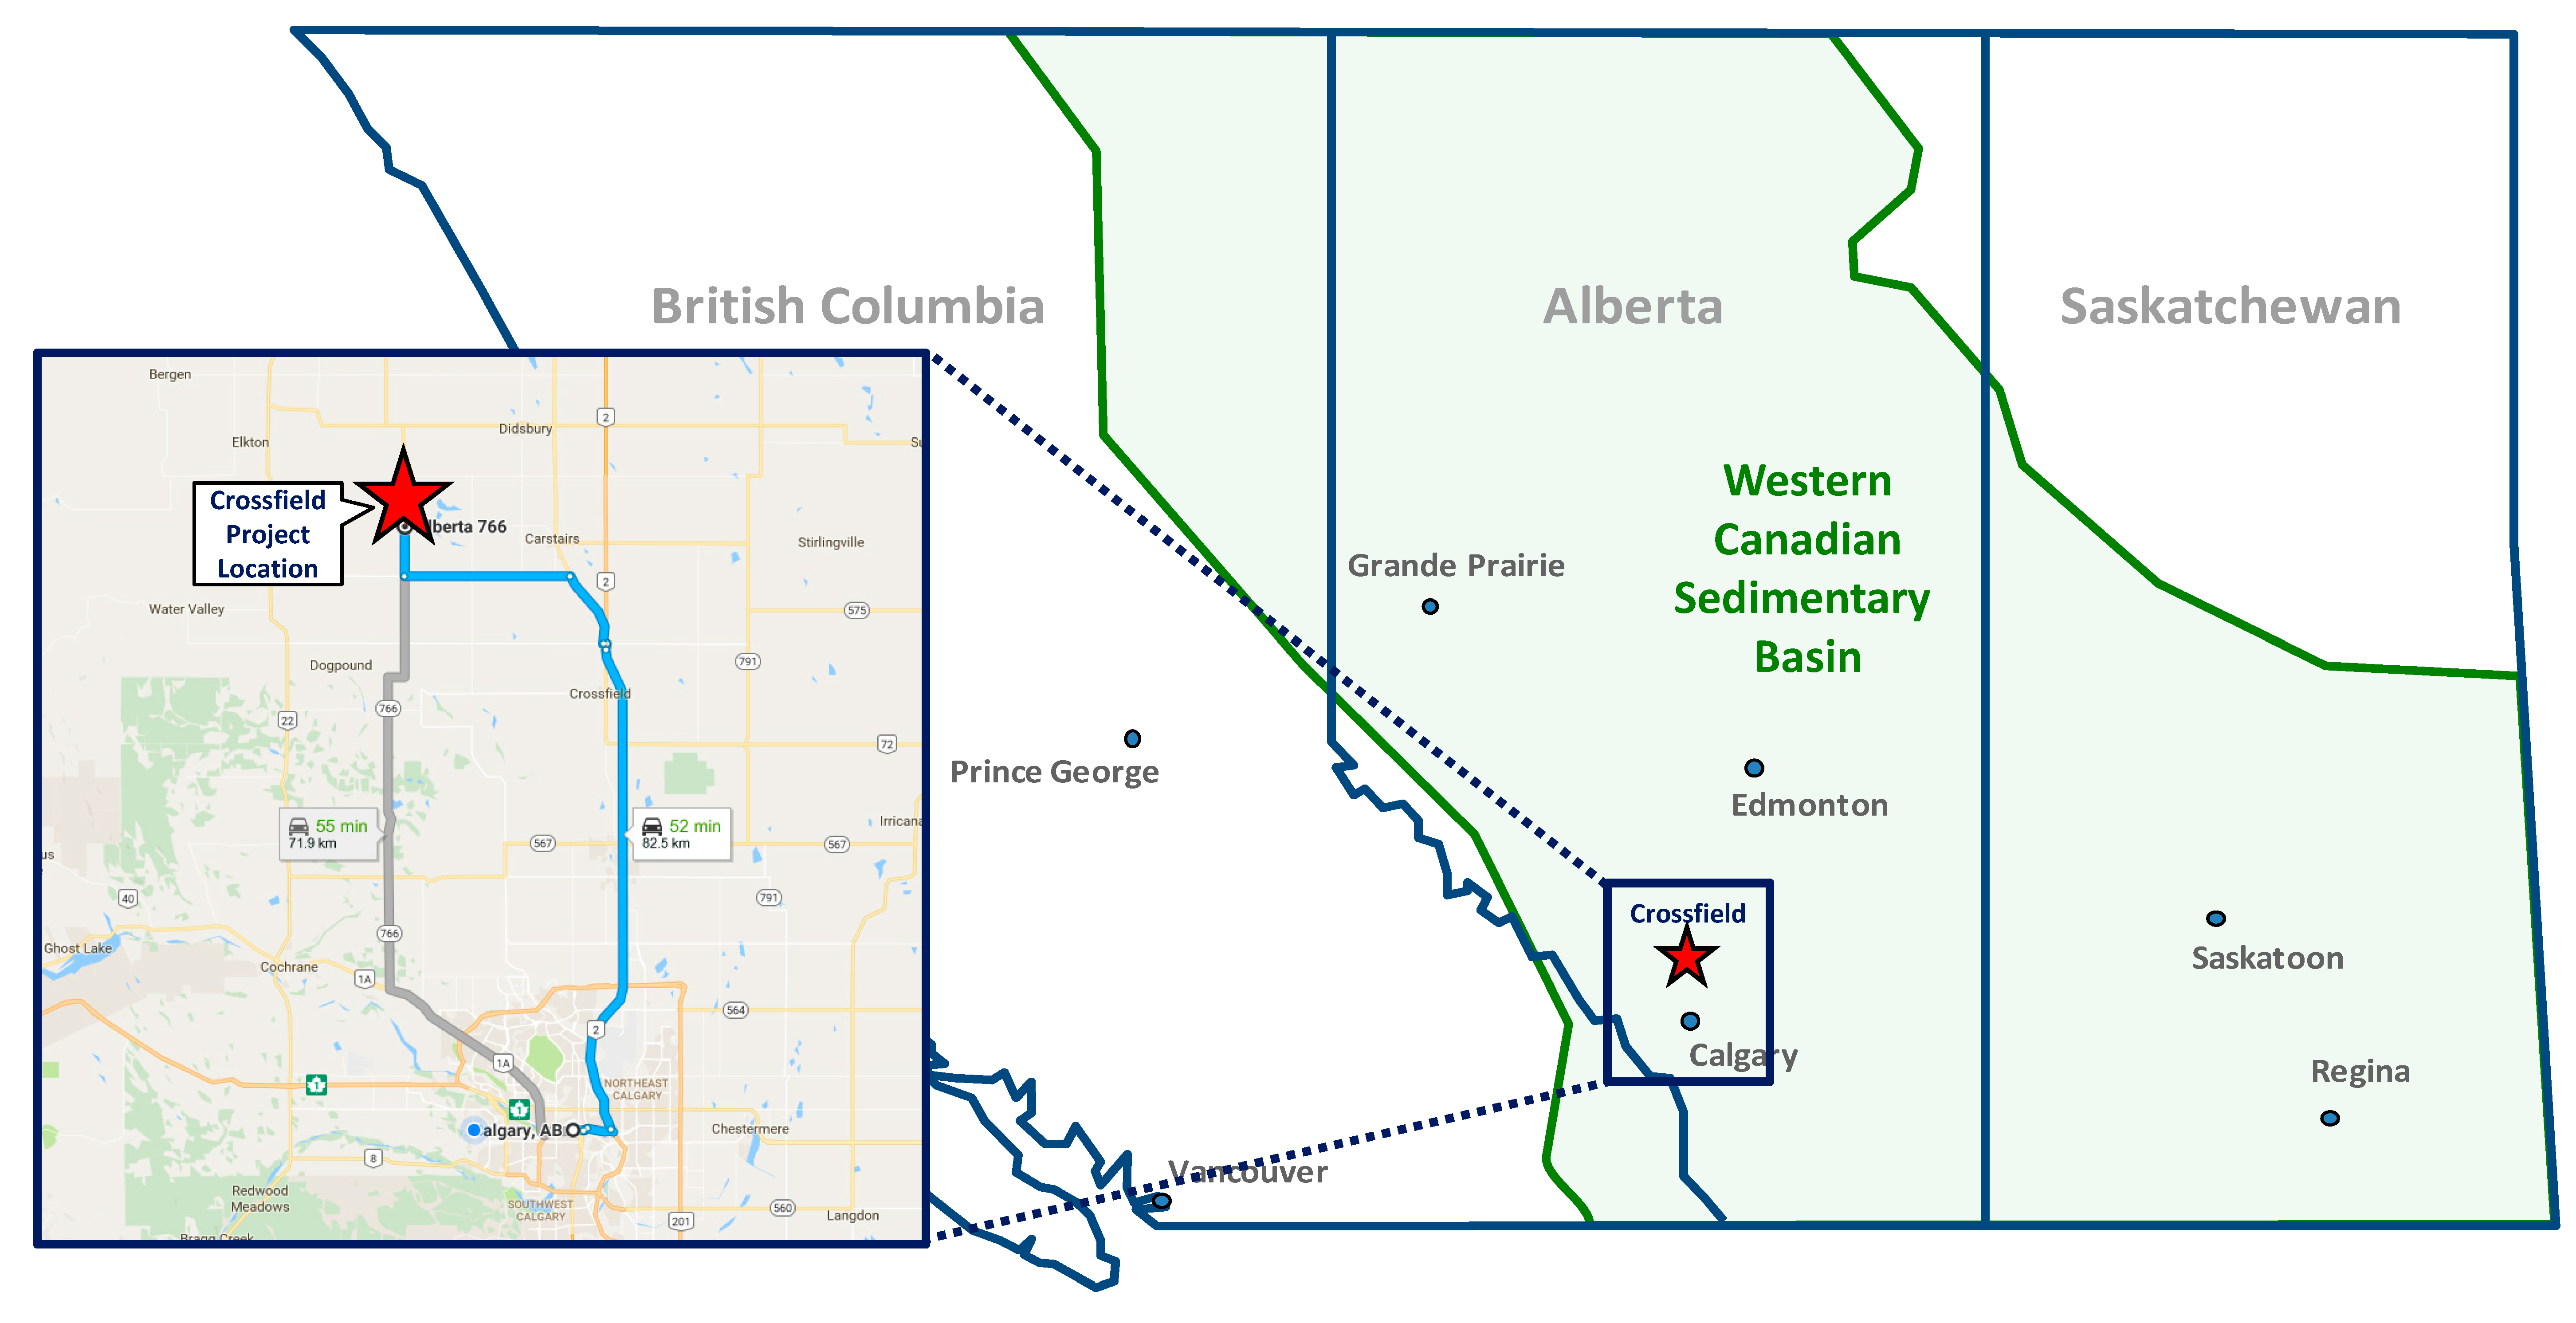
2.1. Crossfield

Most of the oil and gas in Canada is produced from the WCSB. Crossfield is a plain located in Southern Alberta, in the southwestern part of WCSB, approximately 70 km north of Calgary as in Figure 1.
There has been oil and gas production in Crossfield since the 1950s, especially from the major formations such as the Cardium, Viking, and Ellerslie formations from the Cretaceous period, the Elkton, Shunda, Pekisko formations from the Mississippian period, and the Wabamun formation from the Devonian period. The major drilling activities in each formation occurred in the early-1960s, the mid-1980s and early-2010s for the Cardium, early-1980s and early-2010s for the Viking, and late-2000s for the Ellerslie. The Elkton was drilled in the mid-1950s and late-1990s, and the Wabamun in the late-1960s [2]. Figure 2 shows the current state of drilling to the major formations, the stratigraphy, and the location of the study area.
Examination of the production in the Crossfield area (T28-31, R1-4W5) indicates the Cardium is the most drilled formation and has the best production, followed by the Elkton, Shunda, and Pekisko. The Viking and Ellerslie are also major producers of the area. Within the area, the well with the best production history is the 10-5-T30-R2W5 well that has been abandoned in 1958, after total production of 14.3 MMboe (Barrel of Oil Equivalent) including 480 Mbbls of condensates. The Cardium wells adjacent to the target land also have excellent productions, especially 6-35-T29-R3W5, 14-35-T29-R3W5, 8-9-T30-R3W5, 14-9-T30-R3W5, and 16-9-T30-R3W5 wells which have combined production of more than 500Mboe [3].
Table 1 is the summary of the major formations, their drilling activities, and production history. The wells with decent production close to the study area are producing from the Cardium and Viking. The target land is located south of the Ellerslie and Elkton well with the best production, and to the west of the best producing Elkton well.
There are several oil and gas pools in Crossfield, and one of the main pools is the Crossfield Cardium A pool that has 153.5 MMbbls of original oil in place (OOIP) with the production of 24 MMbbls of oil (38° API) until today, which is a recovery factor of 15.6%. The Harmattan East Viking pool has produced 15.6 MMbbls of oil (37° API) out of 51.5 MMbbls of OOIP, and 30.1% of oil is recovered. There are also many gas pools in the Crossfield area; the Crossfield Elkton A pool has 1099 Bcf (billion cubic feet) of total natural gas production and the Crossfield Rock Creek A pool has a total of 1126 Bcf production.

2.2. Cardium Exploitation Review

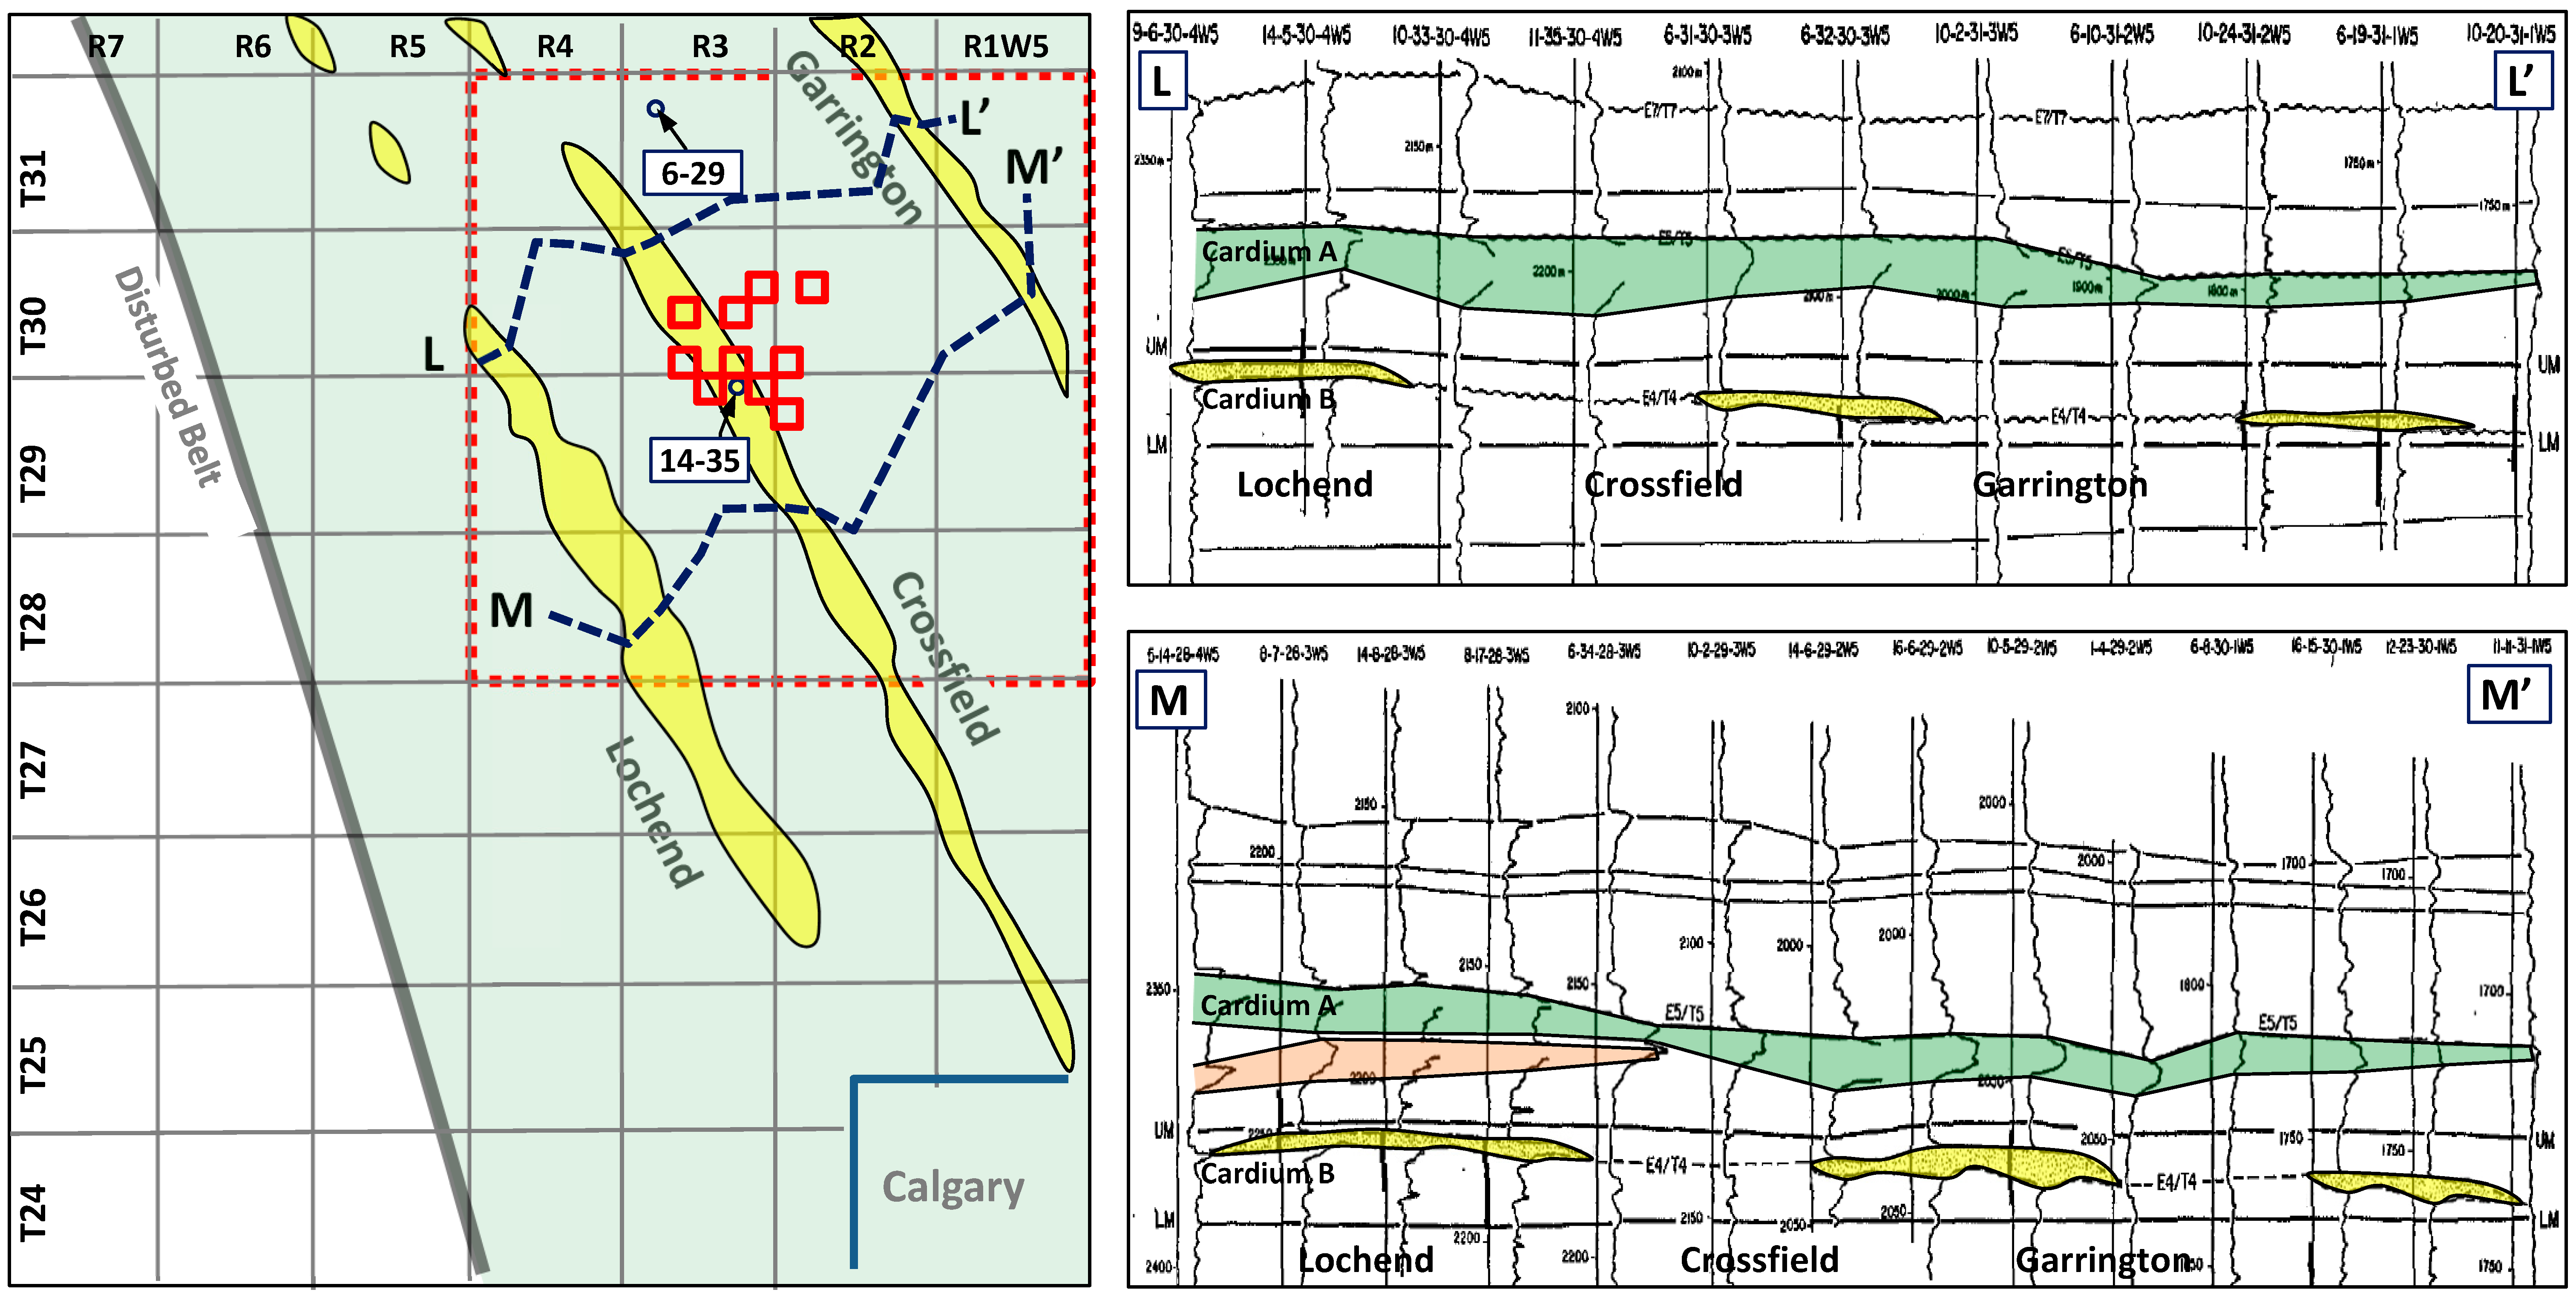
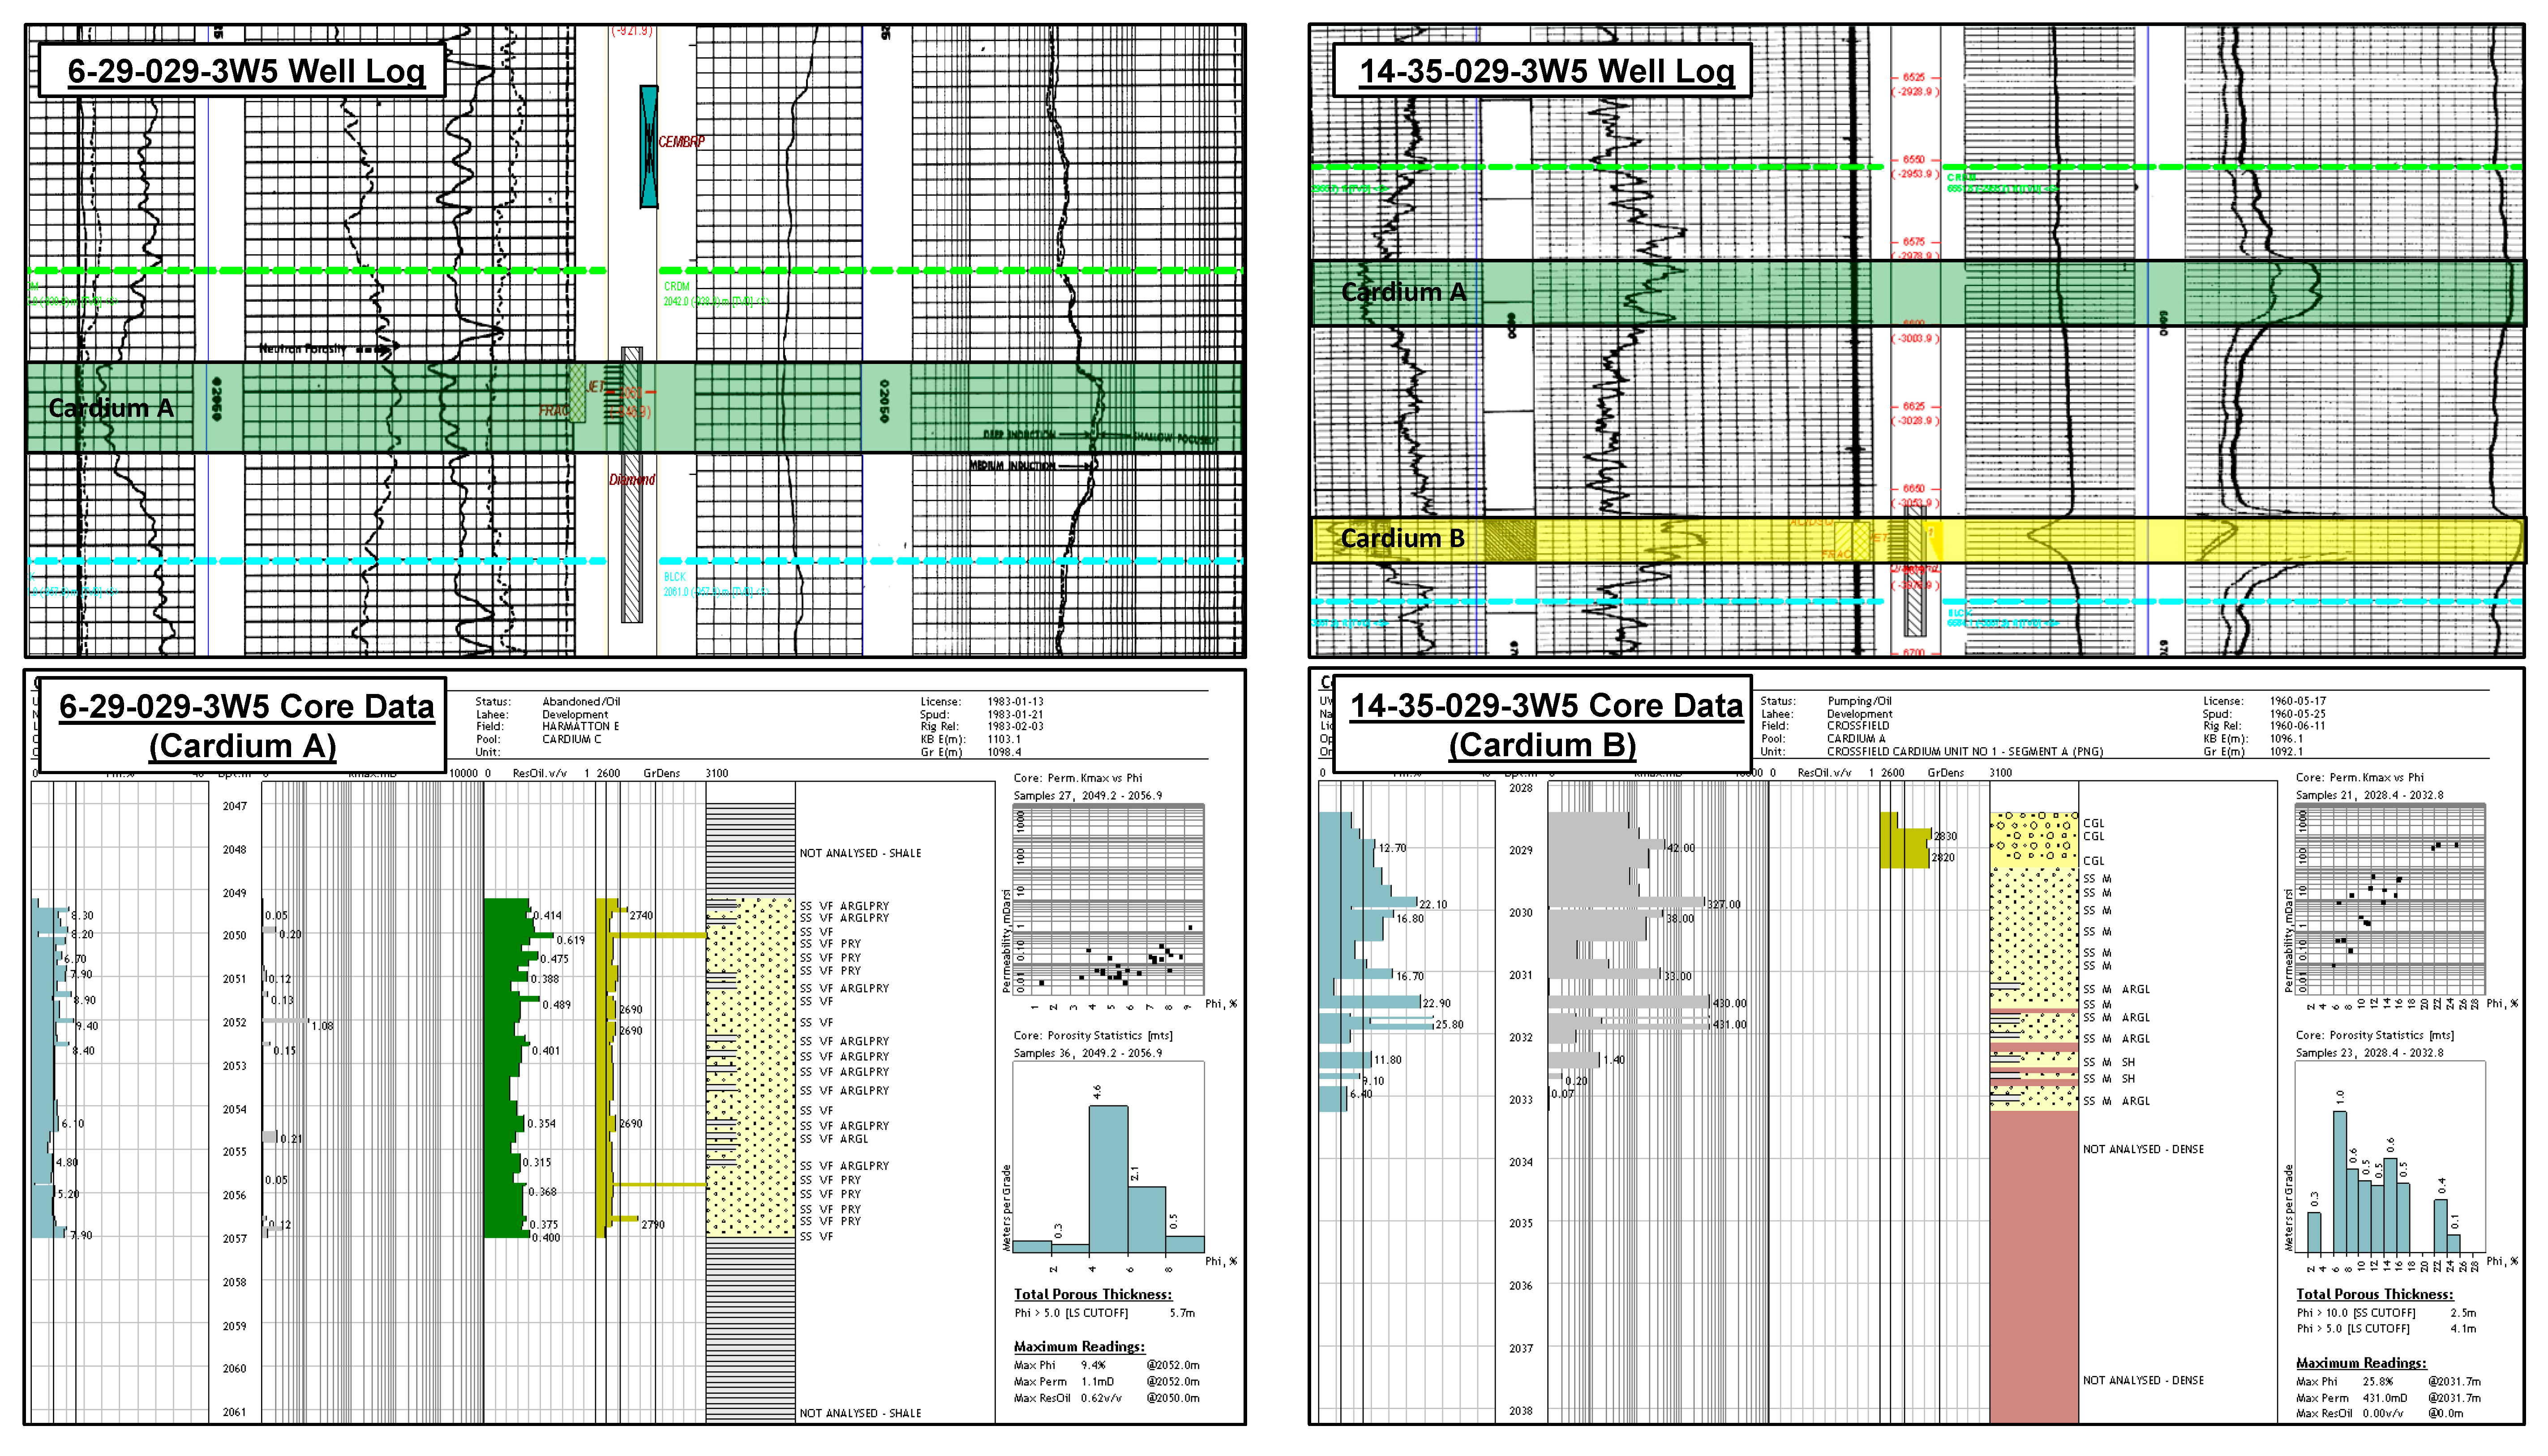
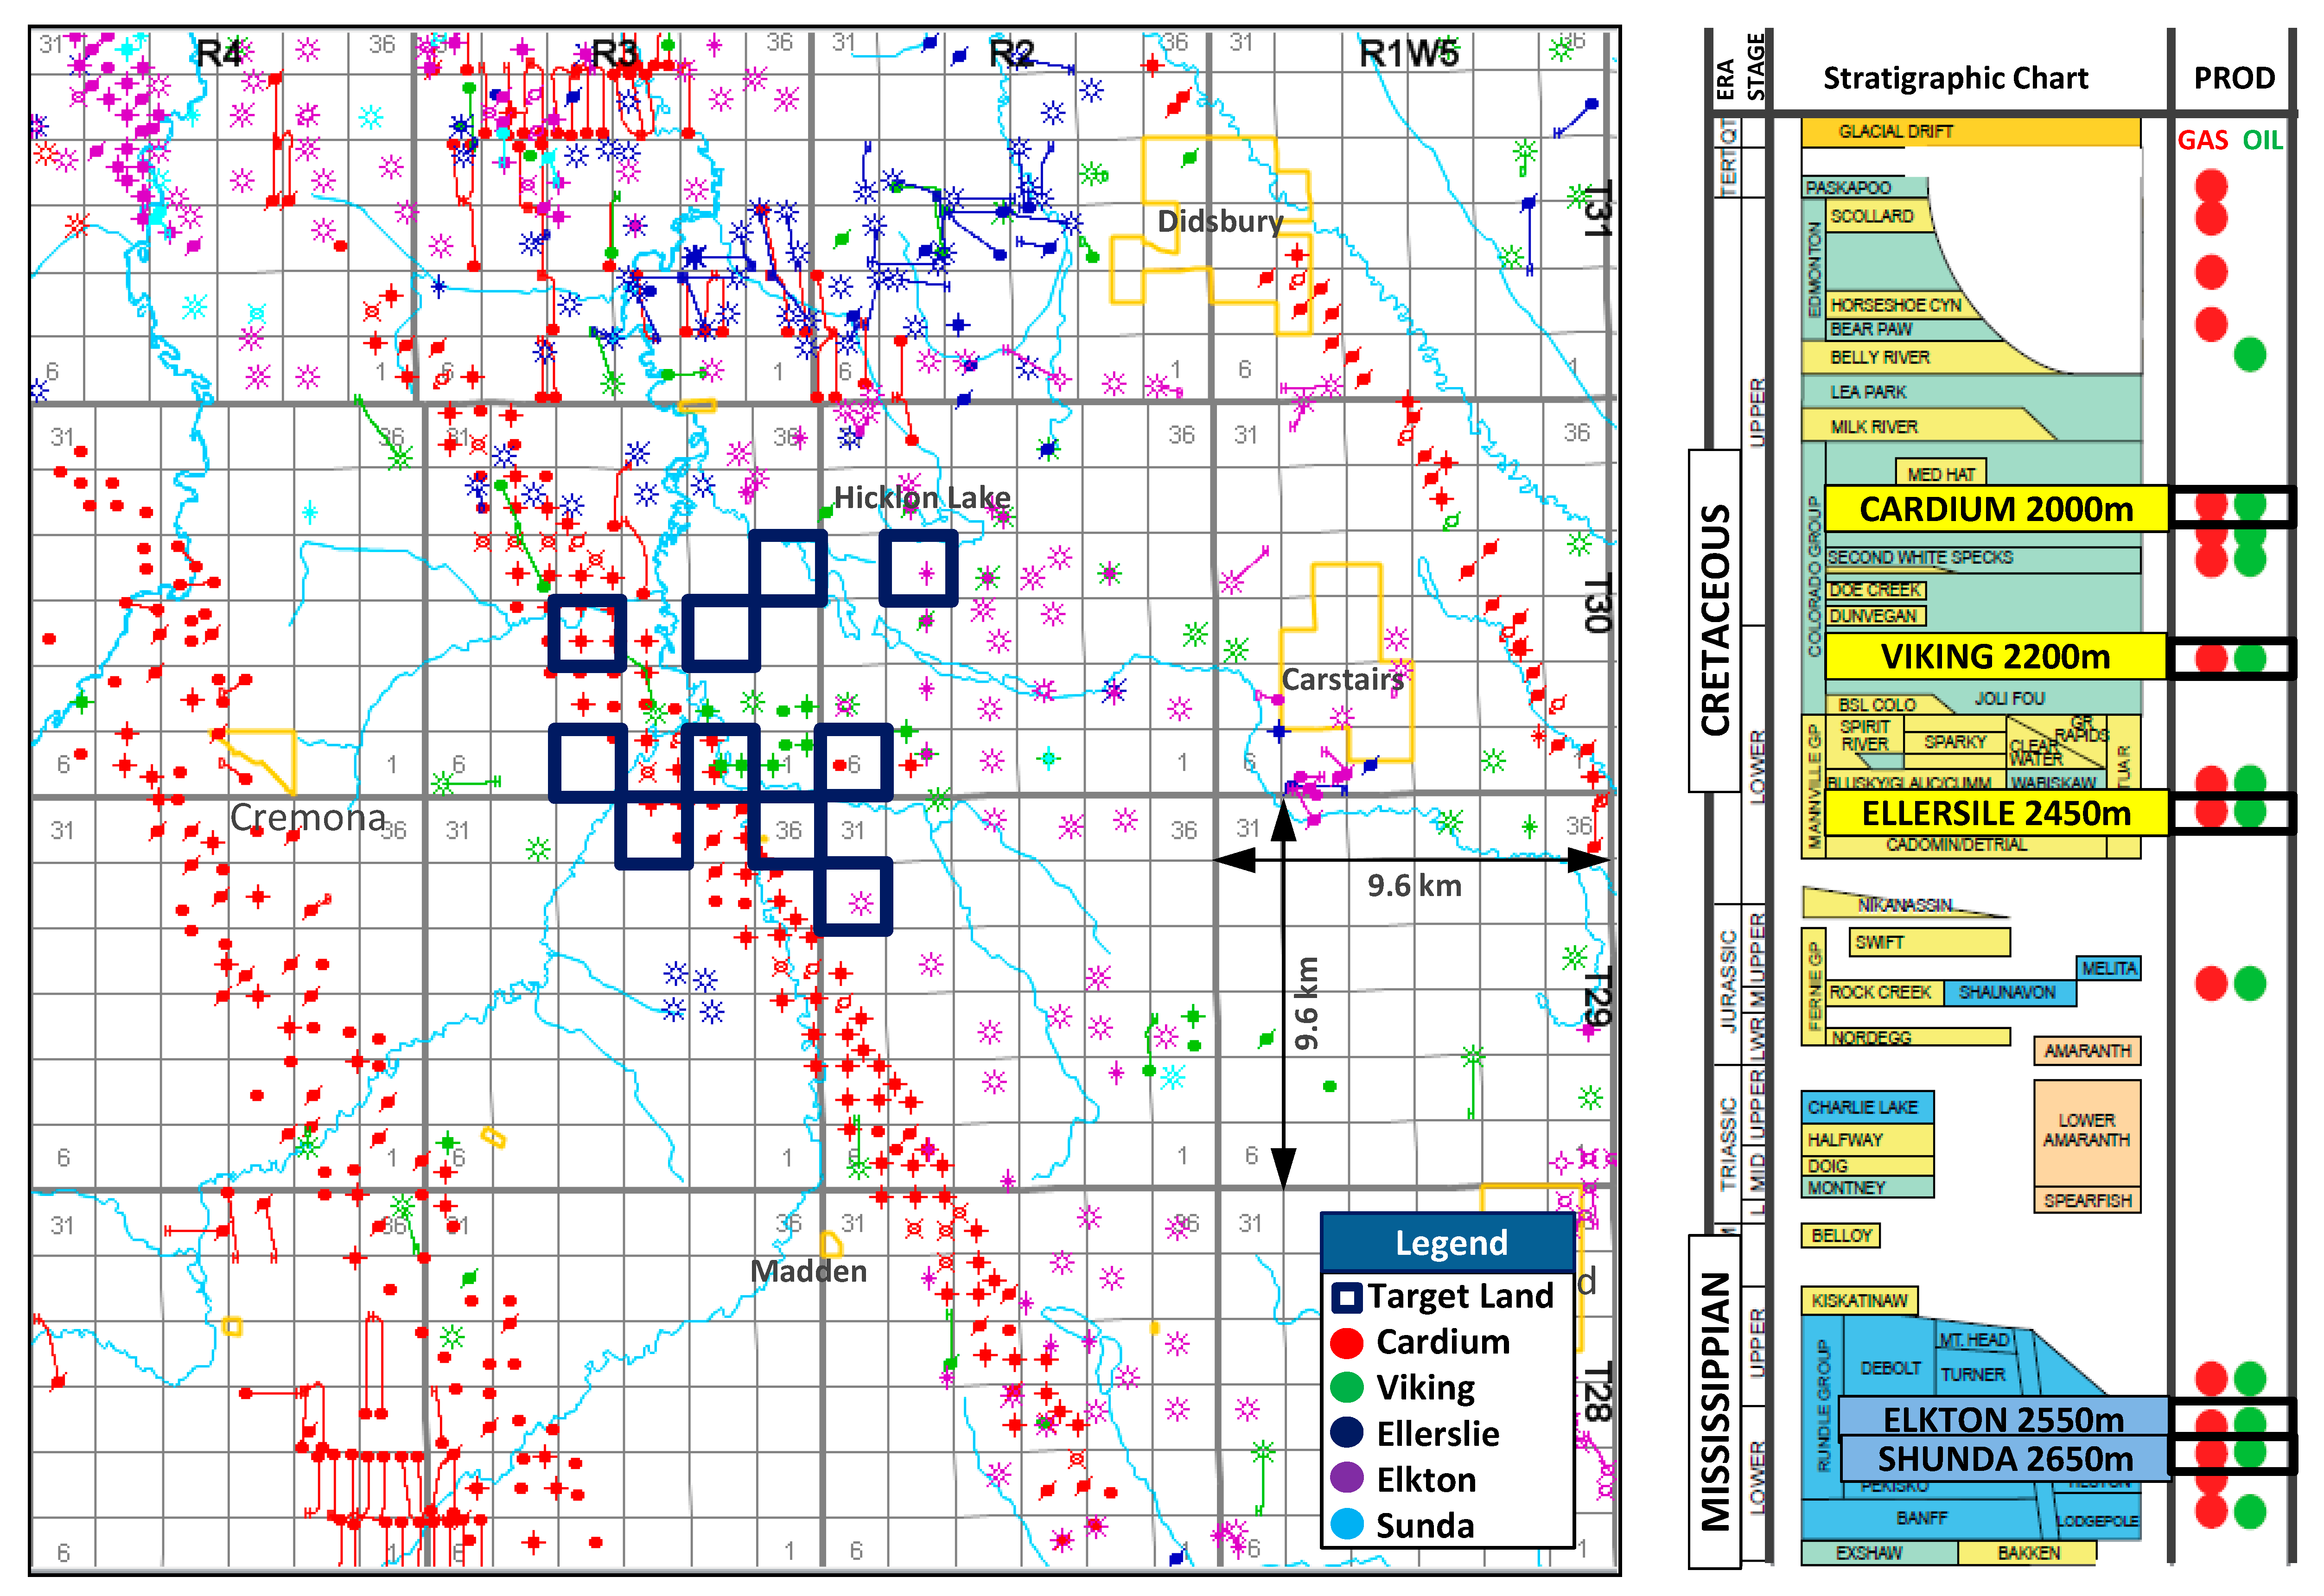
2.2.1. Geology of Cardium

The Cardium formation is from the Late Cretaceous age (approximately 88 million years ago) made up of clastic wedge that is mainly sandstone. It gradually thins from 150 m of thickness in the Foothills to 50 m in central Alberta, then disappearing into mudstone formations. The Cardium is relatively complicated because of the diverse conditions of deposition. The depositional environment varies from the shallow marine shelf, shoreface complexes, and tidal environments to estuarine and fluvial coastal plains, which resulted in varying rock characteristics from mudstone and siltstone to sandstone and thin intervals of the conglomerate.
The trapping mechanism of the hydrocarbons in the Cardium is a primarily stratigraphic trap, that results in the collection of abundant pools, and allows for horizontal development. The hydrocarbons in the Cardium are thought to be derived from neighboring rocks, such as the underlying shale members of the Cretaceous Colorado group. A main source of the drive energy in the Cardium hydrocarbon system is the associated gas in the reservoirs, which may require additional infrastructure. However, the water content in the system is low, which indicates more oil in place and less risk of unwanted aquifer fracturing. The gas content tends to decrease in the eastern margin where the formation is shallower, and the source rocks are less thermally mature [4].
Figure 3 shows the distribution of the Cardium A and Cardium B zones from the cross-sections of the study area, and Figure 4 is the well log and the core analysis data showing the reservoir characteristics of the Cardium A and B [5]. In Figure 4, each column of the well log represents the collected gamma ray, neutron porosity, spontaneous potential, and resistivity at each depth. Cardium A and B zones show different characteristics compared to the rest of the formation and are, therefore, easily identified with the knowledge of the regional geology. The core data shows the porosity, permeability, residual oil, grain density, and lithology at each depth. For the purpose of the analysis, the porosity cutoff of 6% was used.
The thickness of the Cardium formation is around 20~30 m in the study area [6]. There exist so-called Cardium A and Cardium B zones within the Cardium formation throughout. The Cardium B is a long linear barrier bar consisting of highly-porous conglomerates, and sandstones. It has been drilled with vertical wells from the 1960s to 1980s, and after the primary recovery was completed, the secondary recovery is ongoing with water injection in most of the pools. There has been a 9~39% recovery using the water injection in the study area [7]. Cardium A is one of the typical reservoirs in the WCSB that has been exploited with horizontal drilling. It has a high content of hydrocarbons but relatively low porosity and permeability which requires maximizing the production with horizontal wells and multi-stage fracturing. The main components of the Cardium A are intensely bioturbated, offshore, and muddy sandstones.

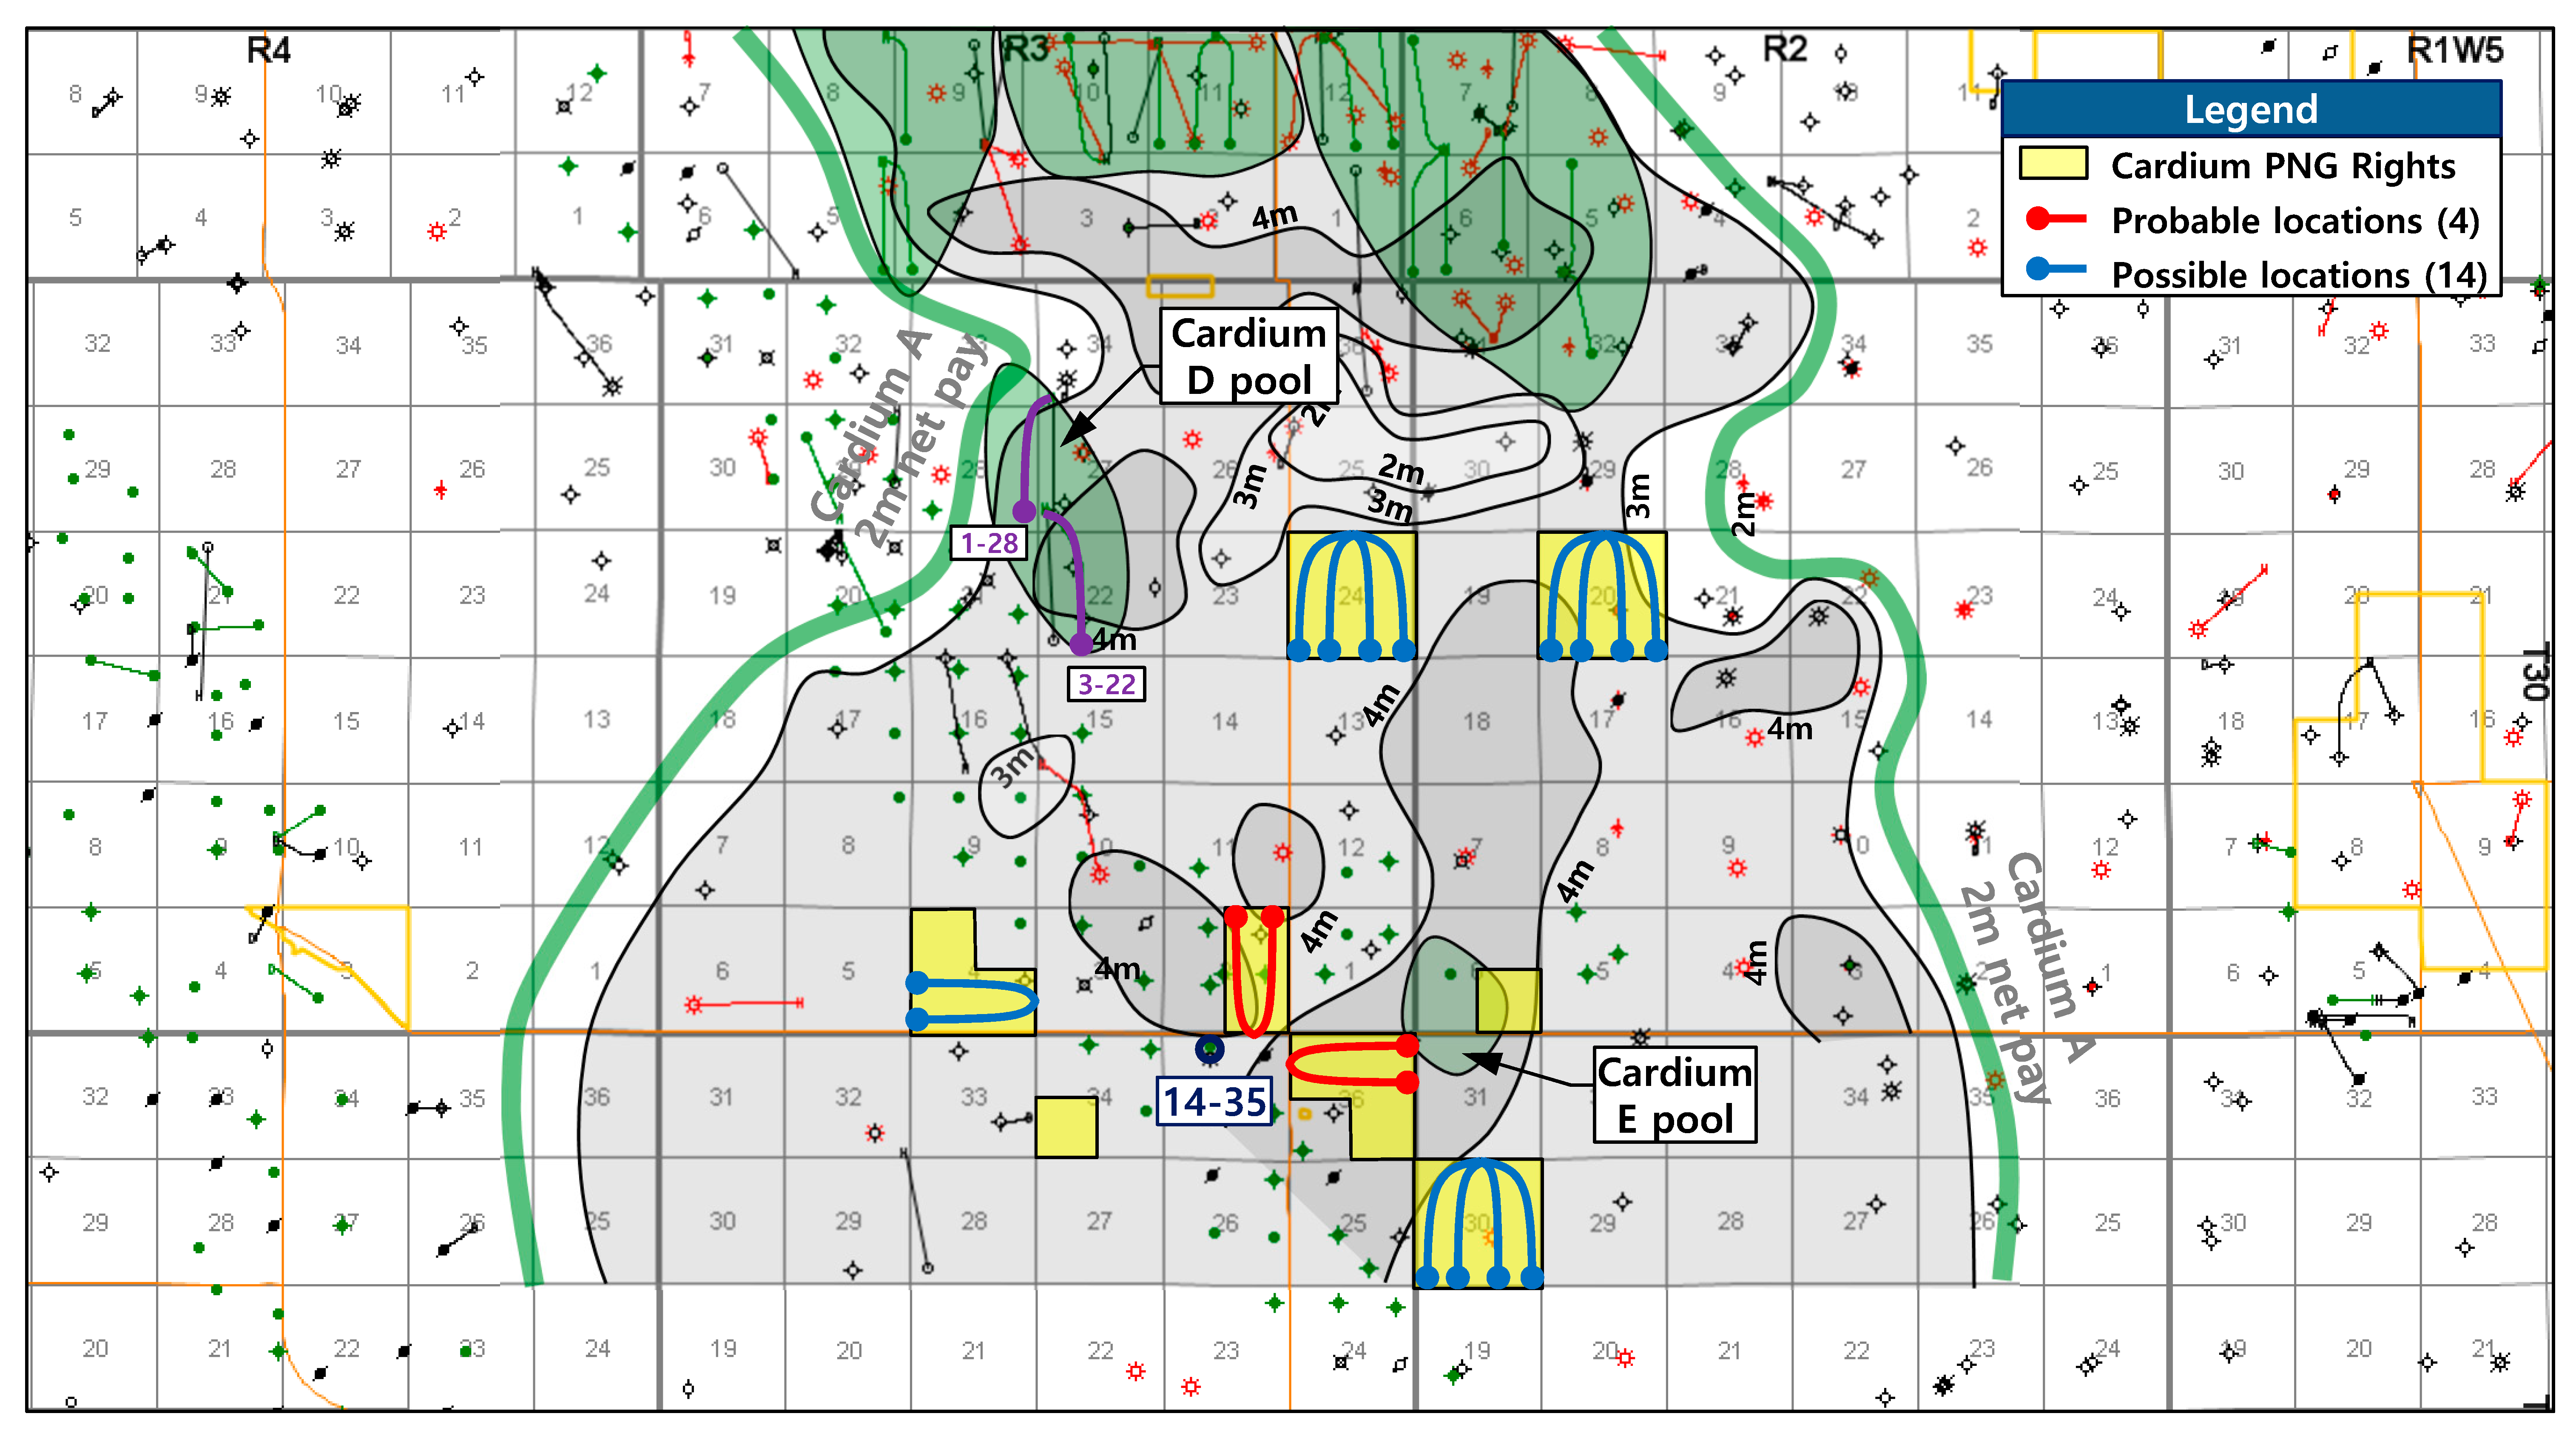
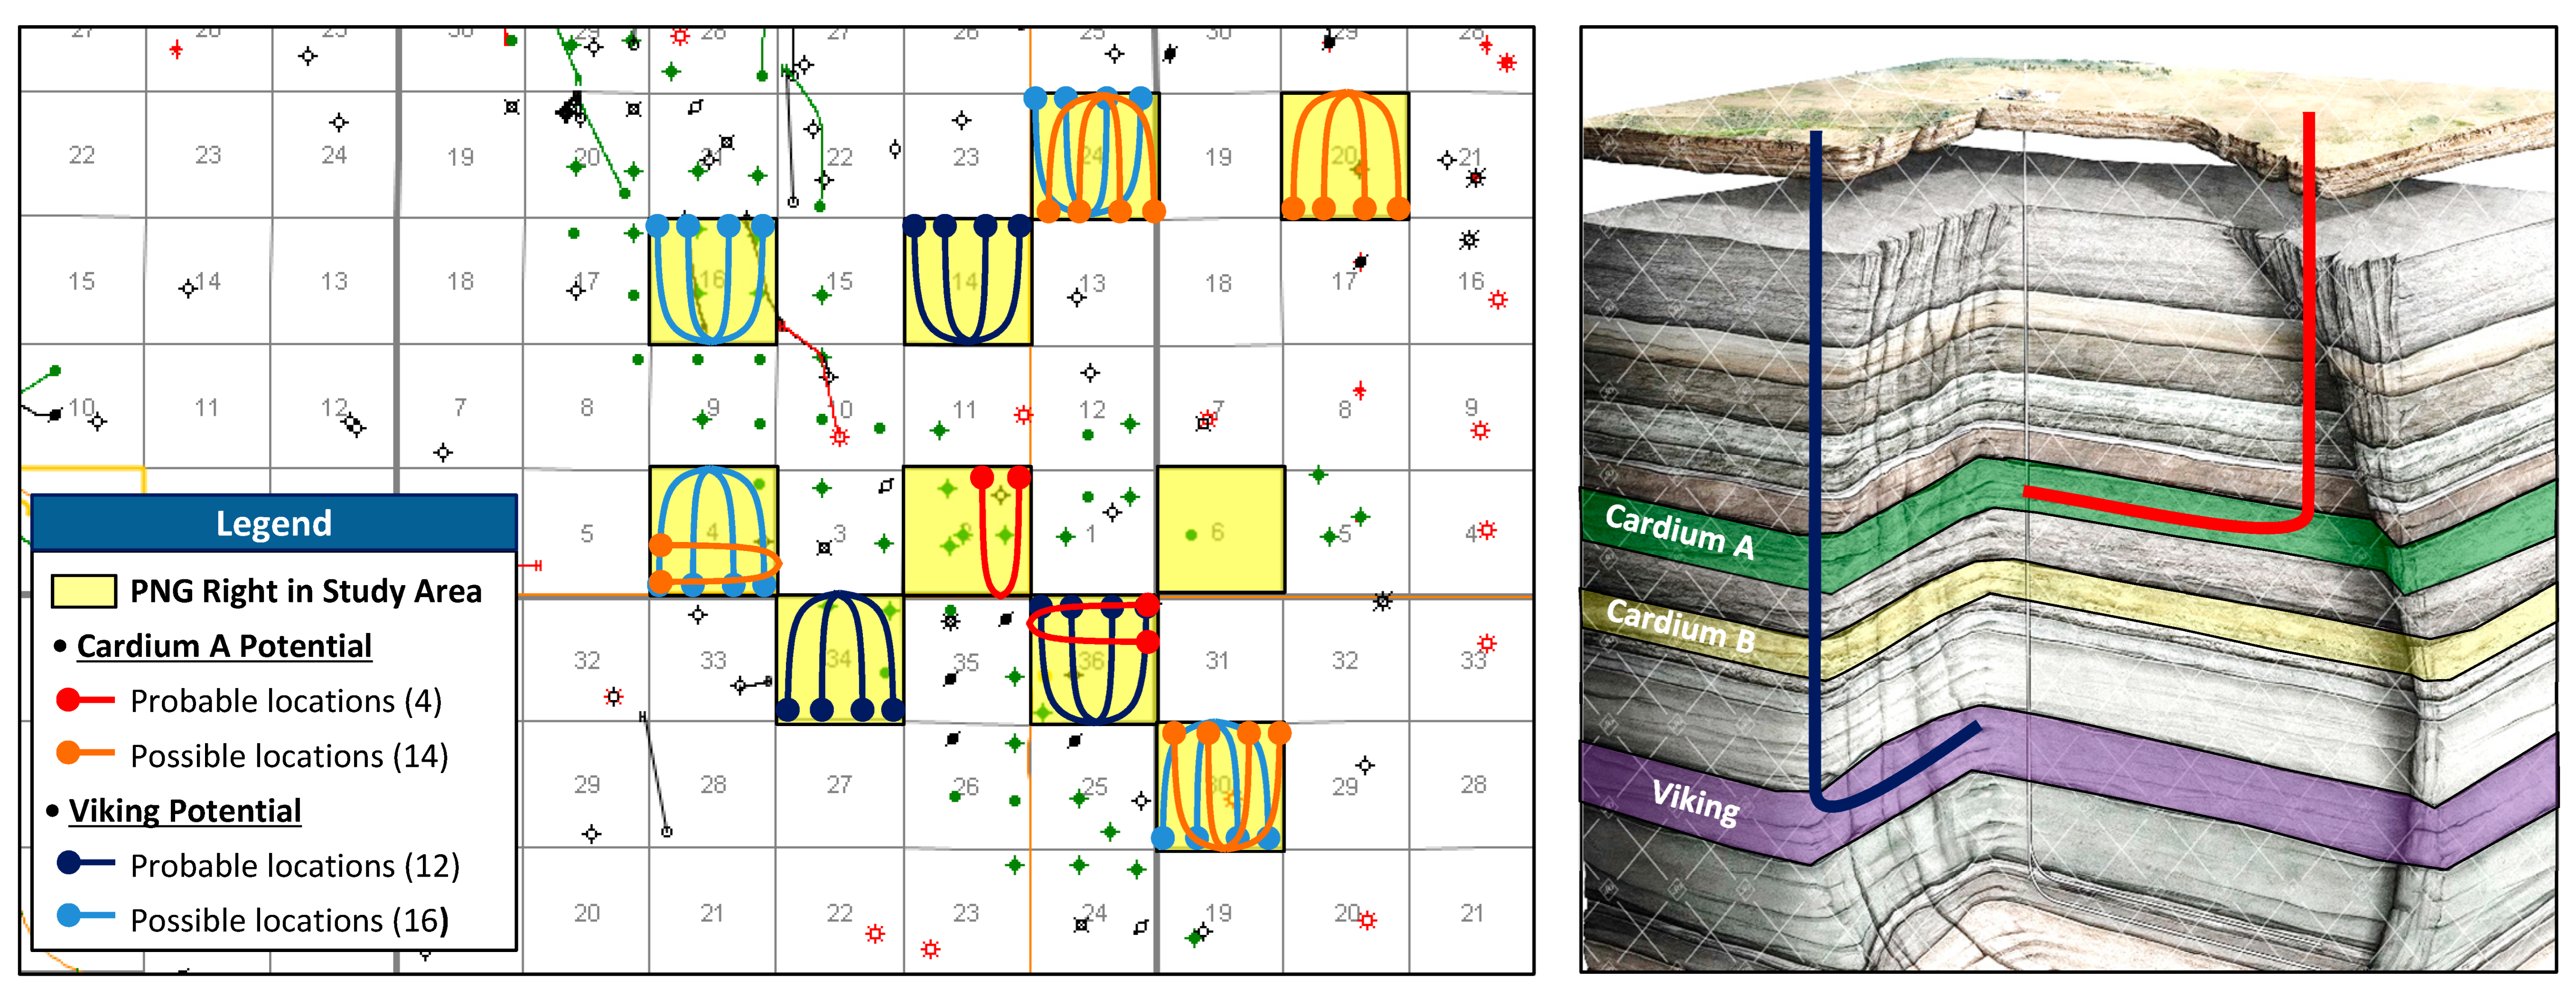
2.2.2. Cardium Exploitation Potential Analysis

The exploitation potential of the Cardium formation in the study area was investigated by analyzing the regional geological data. First, the Cardium B zone has vertical wells that have been producing for an extended period of time, which decreased the reservoir pressure and the production, so some projects utilize water injection to maximize the recovery factor instead of infill drilling. To determine the potential of the Cardium A zone, the well logs and core analysis data from more than 50 wells around the study area were analyzed. The maximum net pay of the target land was found to be 5 m with a 6% porosity cut, and based on this finding, the area with net pay between 3 m and 4 m has been classified as a “possible location” and the area with more than 4 m of net pay was marked as “probable location” (Figure 5). Assuming 4 horizontal wells with multiple fractures are drilled in each section, which is typical in Canada, it is possible to drill 14 wells in the possible locations and 4 wells in the probable locations.

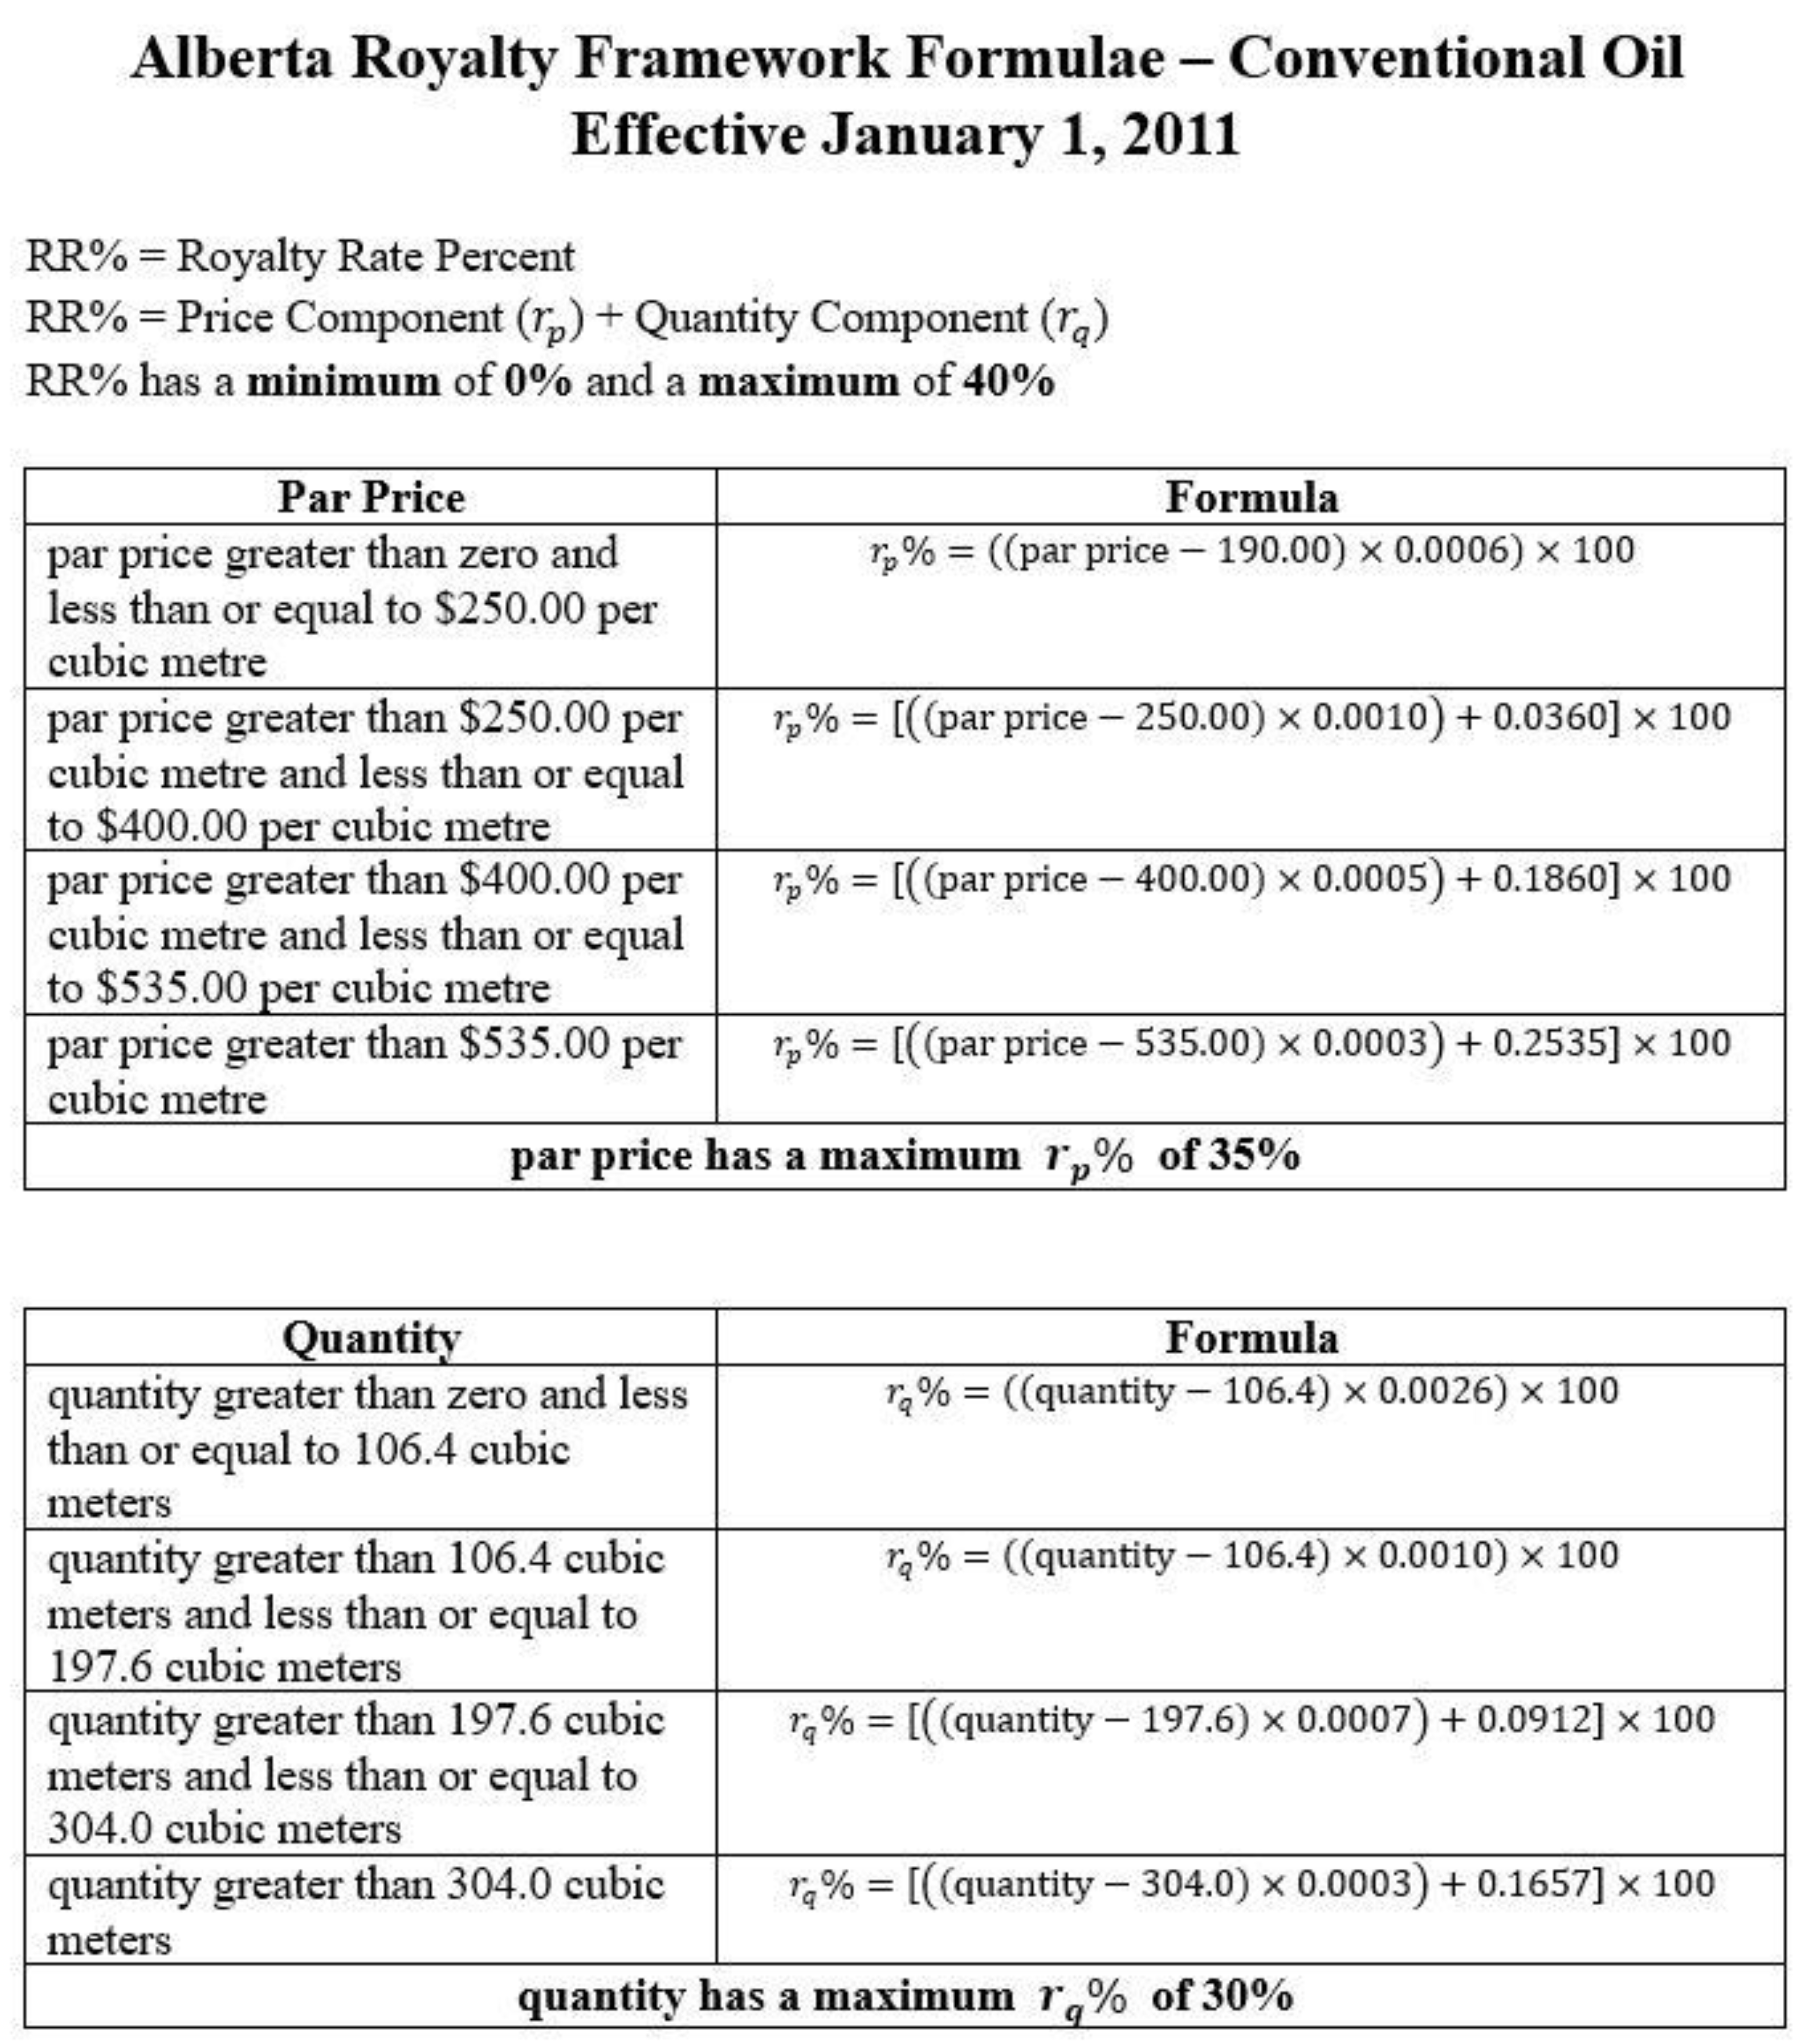
2.2.3. Cardium Economics

To investigate the economics of drilling a well, the existing multi-fractured horizontal wells in the study area were analyzed. The reference well was chosen as 01-28-T30-R3W5 well (EUR of 80 Mbbls) within the Cardium D pool (3 m net pay area at 6% porosity cut) northwest of the target land.
The drilling, completion, equipment, and tie-in (DCET) cost was chosen as 3.5 MMCAD (Canadian Dollars) for a well with a true vertical depth (TVD) of 2 km and the measured depth (MD) of 3.4 km using the example from TransGlobe Energy, which is an operator in the area [8]. The operating expenses (OPEX) are based on the operation data of the Harmattan area [9], where the fixed cost is 5000 CAD/month/well and the variable cost is 10 CAD/bbl. The royalty paid to the provincial government was calculated from the Alberta Royalty Framework in Appendix A and the Horizontal Oil New Well Royalty Rate (HONWRR) incentive in Table 2 [10]. The cap volume of oil and timeframe for the incentive is determined by the measured depth.
As the result of the analysis is based on these assumptions, the rate of return was 23.3%, and the net present value at a 10% discount rate (NPV@10) of 1.6 MMCAD at the WTI 70 USD/bbl (2% annual increase) and CAD/USD exchange rate at 1.33 (Figure 5). This analysis was based on the 01-28-T30-R3W5 in the area with 3 m net pay at a 6% porosity cut; therefore, any area over 4 m net pay is expected to have better economics.
A sensitivity analysis was performed with respect to the oil price and DCET cost as in Table 3. In the analysis, the oil price varied from 60 to 80 USD/bbl, and DCET cost varied from 3.0 to 4.0 million CAD.

2.3. Viking Exploitation Evaluation

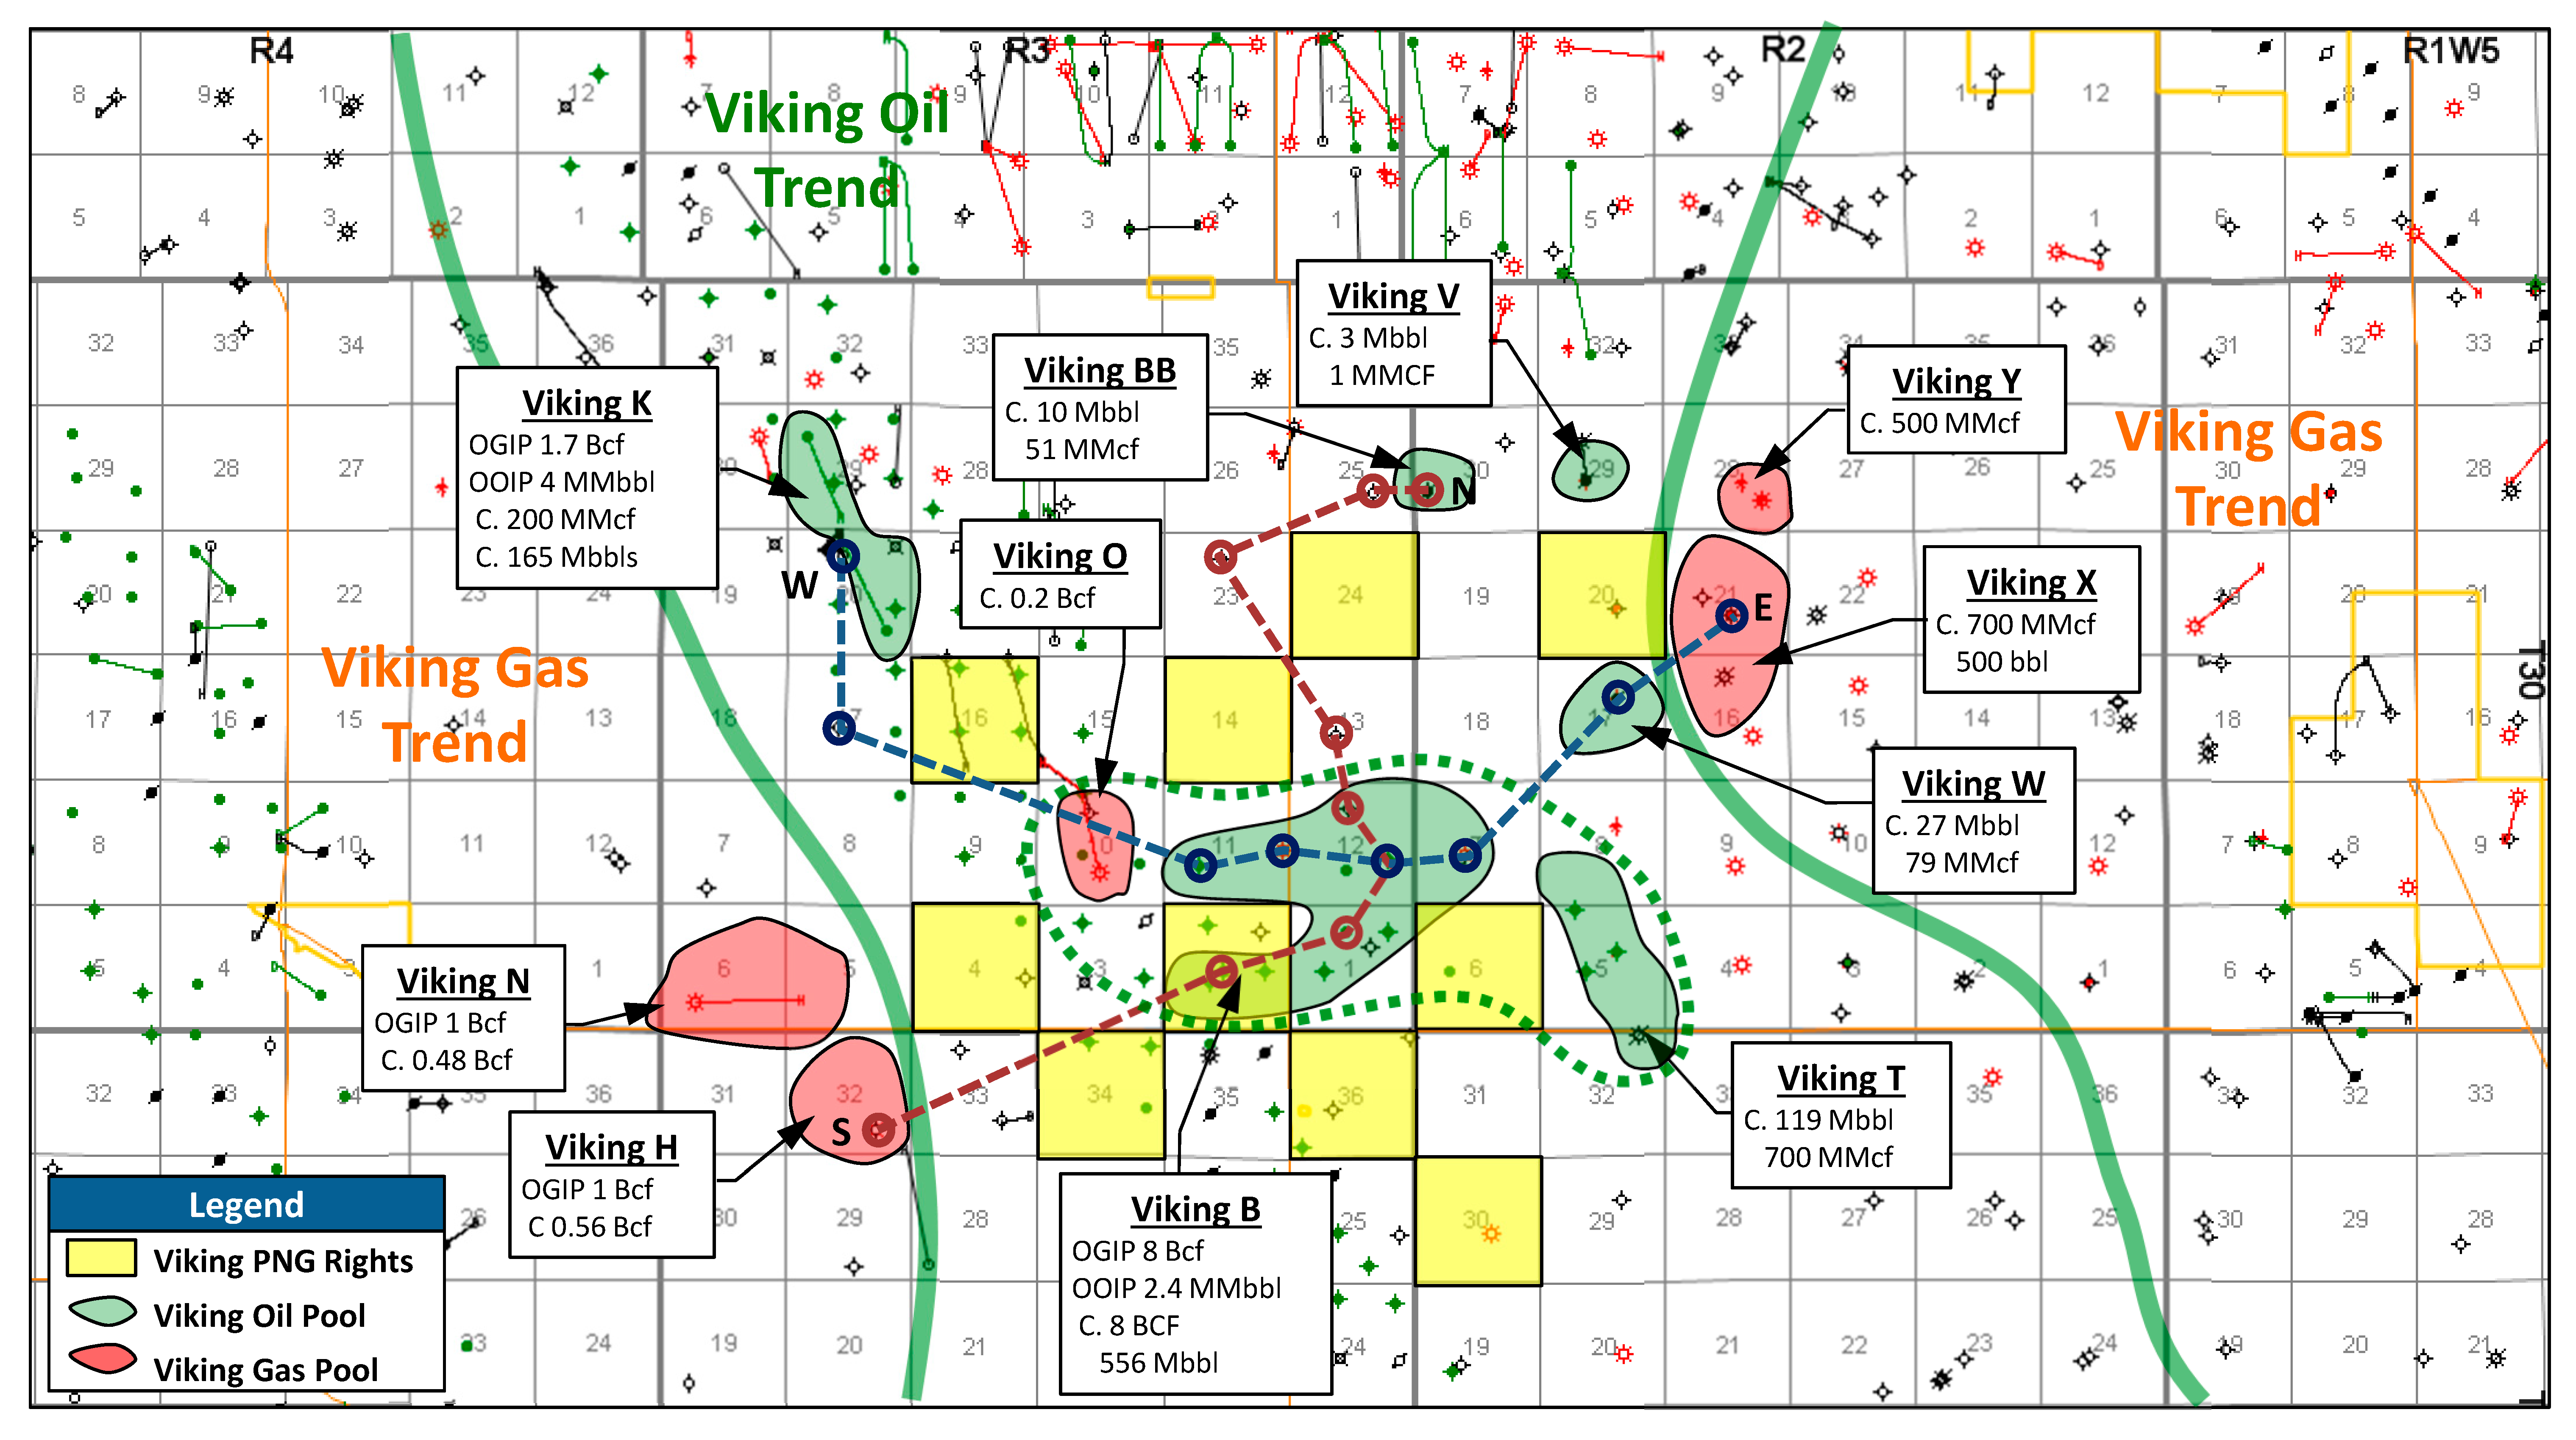
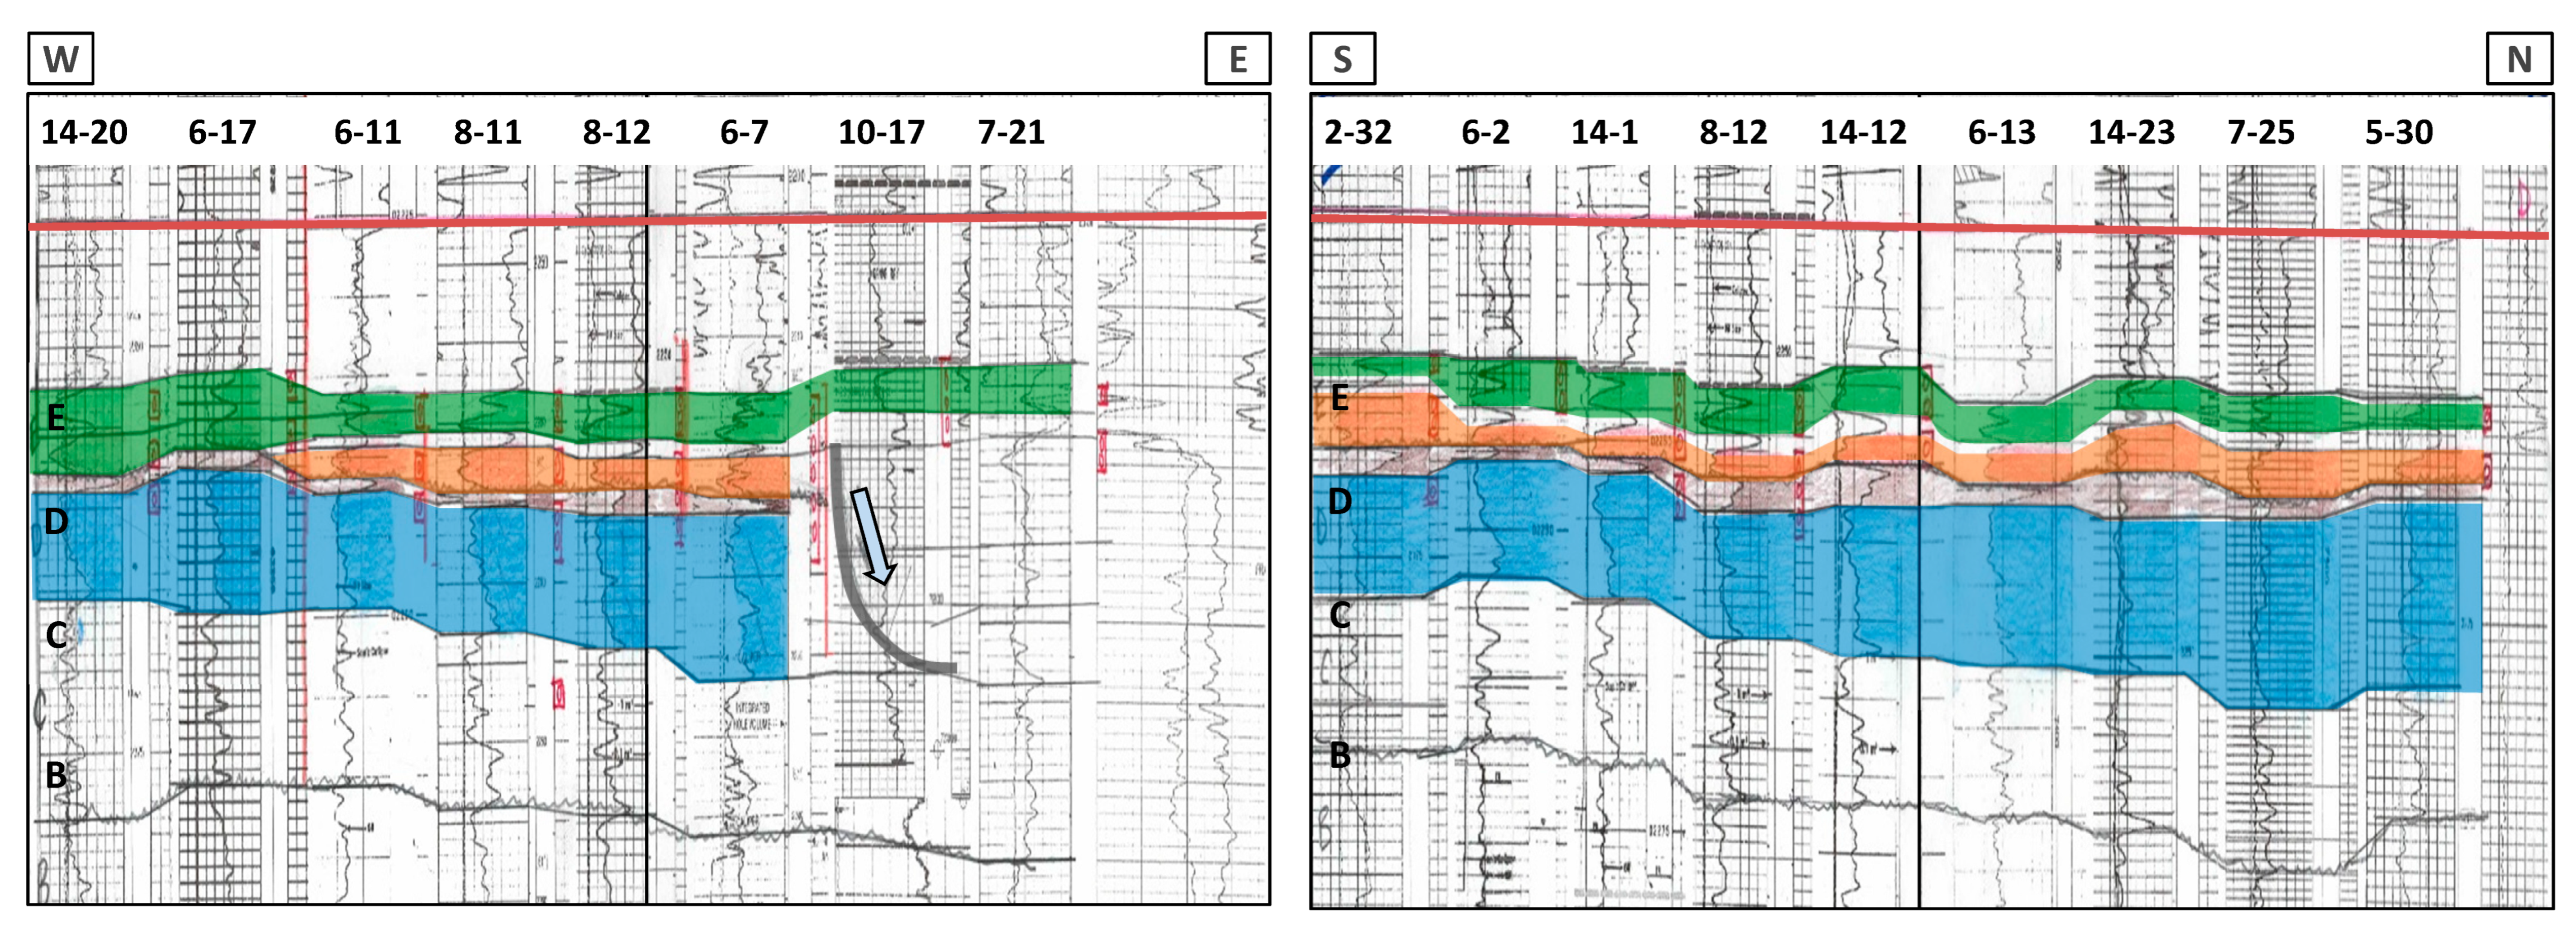
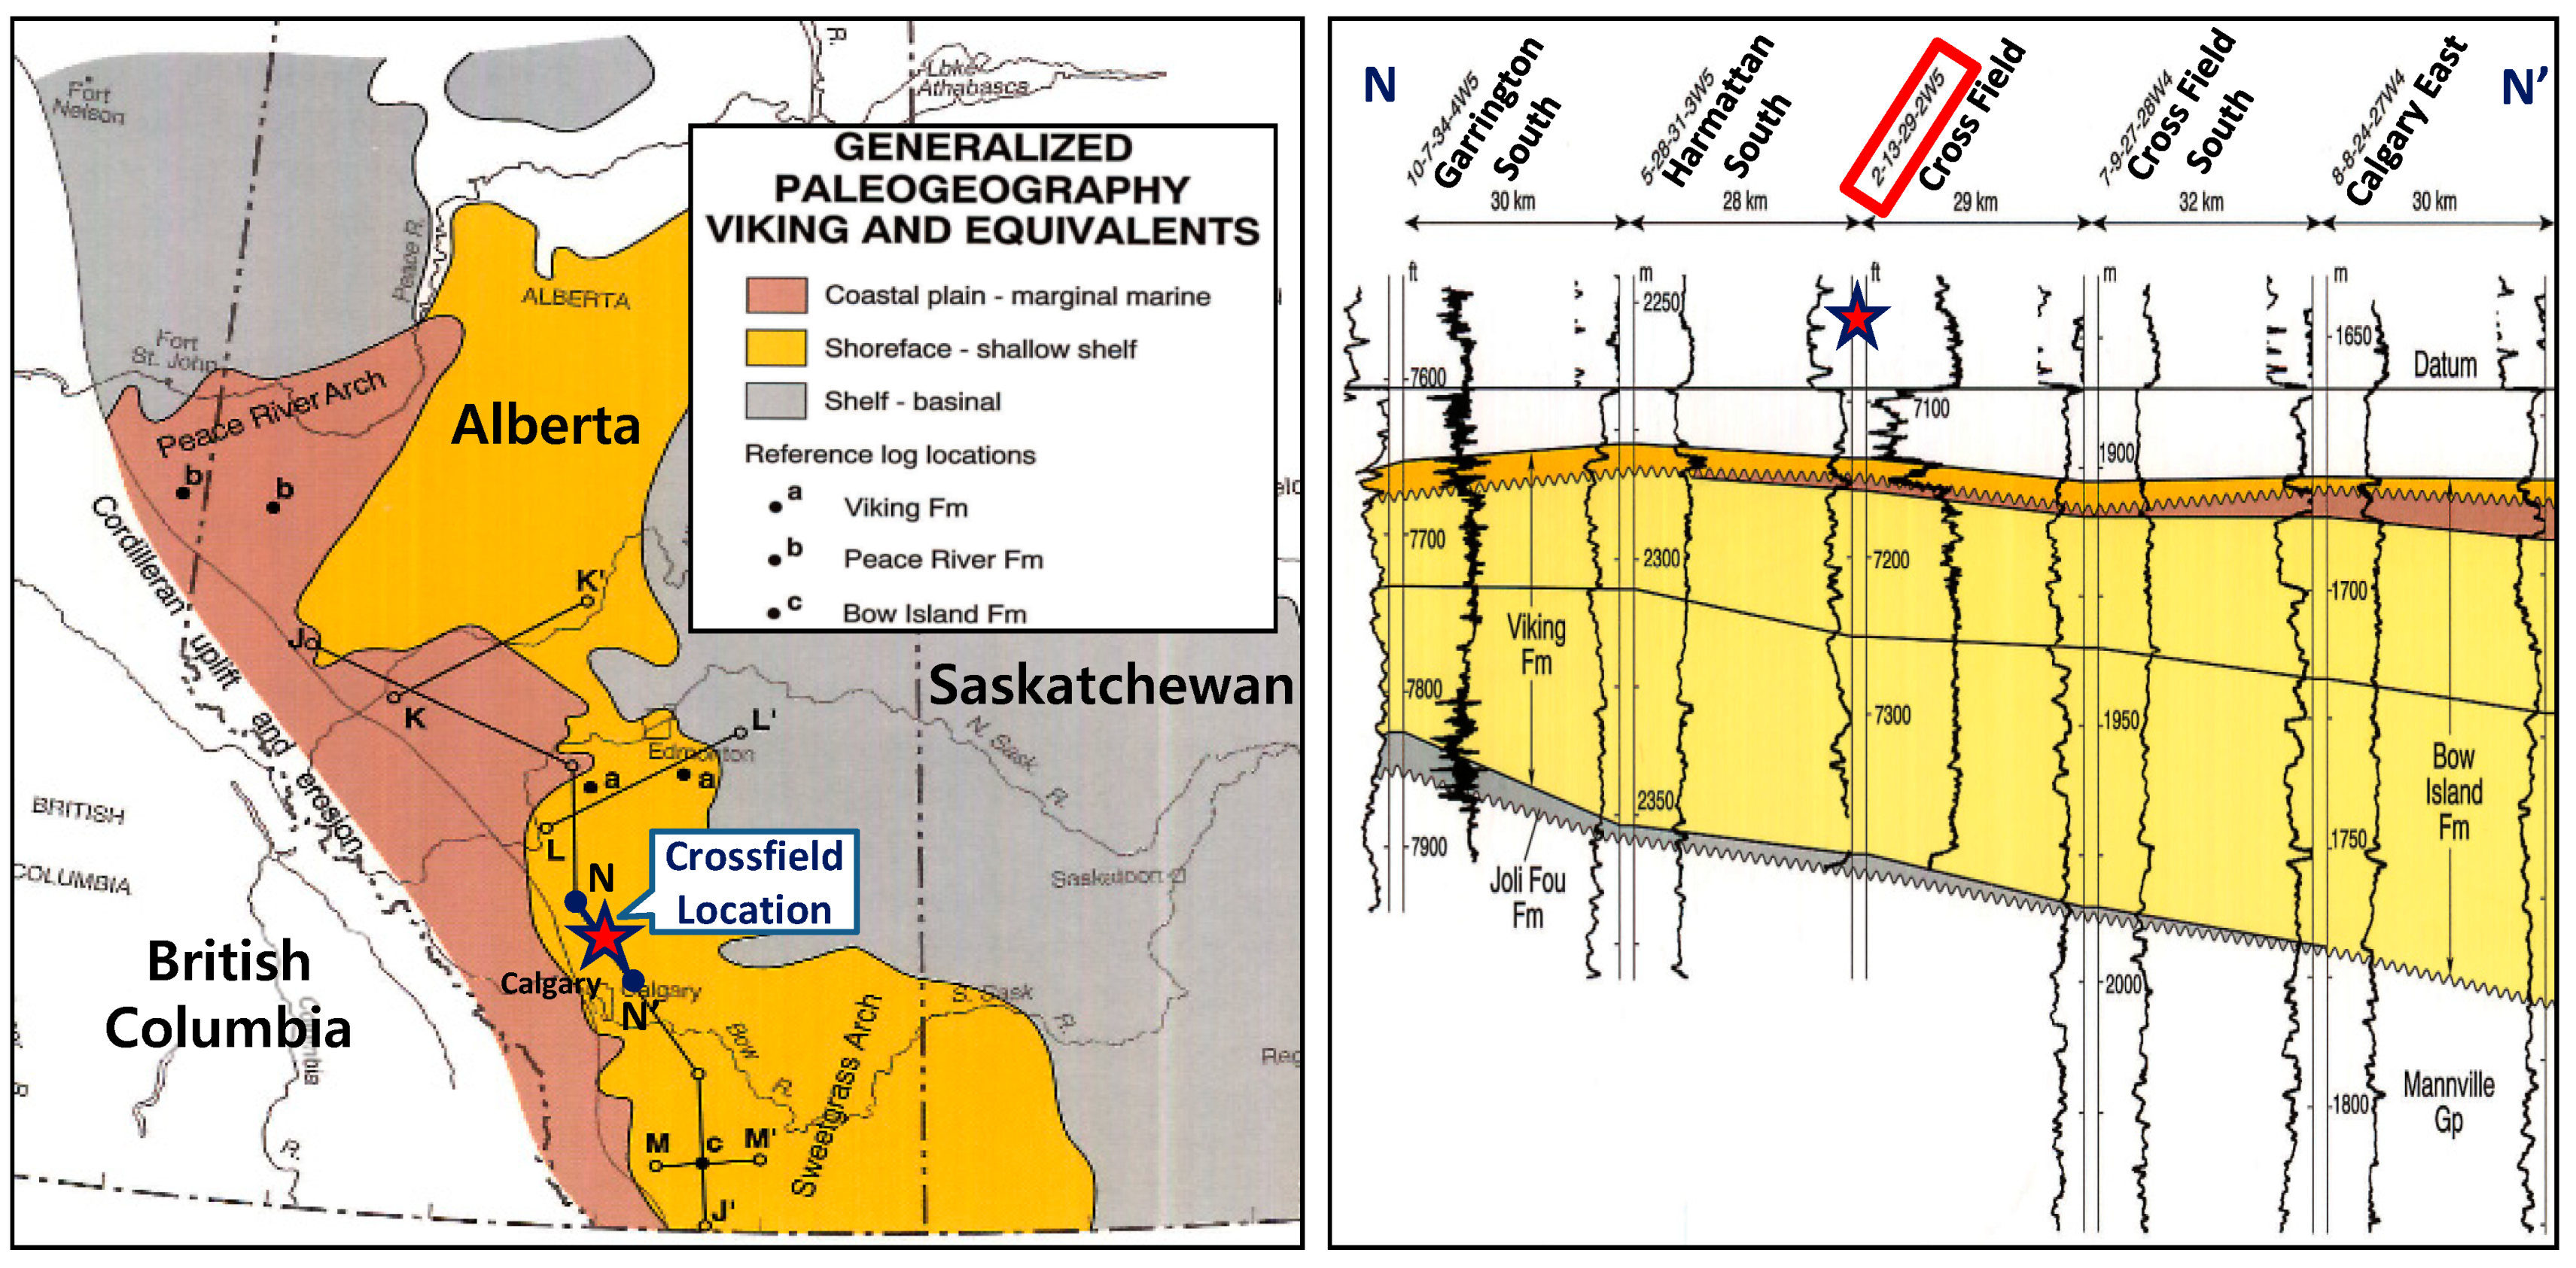
2.3.1. Geology of Viking Formation

The Viking formation and its equivalent strata occur within the Cretaceous Colorado Group and are Albian in age and extend over nearly the entire WCSB. They are a coarse clastic interval that prograde from the Cordilleran orogenic belt into the foreland basin in a wedge shape. Interbedded sandstones and shales of marine influence mainly make up the Viking units that range from just a few meters in the east to over 175 m in southwestern Alberta. The Viking and Bow Island formations and the Paddy Member have been the target for exploratory drilling for several decades as they were proven to be good reservoirs of oil and gas. The Viking is estimated to contain 5% of the oil and gas reserves in Alberta, and its equivalent strata are estimated to contain 8% [11]. The paleogeography of the Viking formation and the cross-section of the Viking in the Crossfield area is shown in Figure 6.
The most actively producing Viking pools near Crossfield are Harmattan (T32-3W5), Lone Pine (T31-27W4), Ricinus (T32-6W5), and Wildcat Hills (T28-6W5). The Harmattan pool is the most exploited pool, and it is located just 20 km north of the target land. The Viking formation in the Harmattan pool has an average thickness of 3 m, porosity of 6%, and water saturation of 40%, and produced 13 MMbbls of oil and 7 Bcf of gas up to now. Near the target land, Angle Energy was the company who has been most actively exploiting the Viking formation and possesses 61.5 sections of land with 45 wells, and Triaxon Oil drilled 5 wells in 20 sections of land [5].

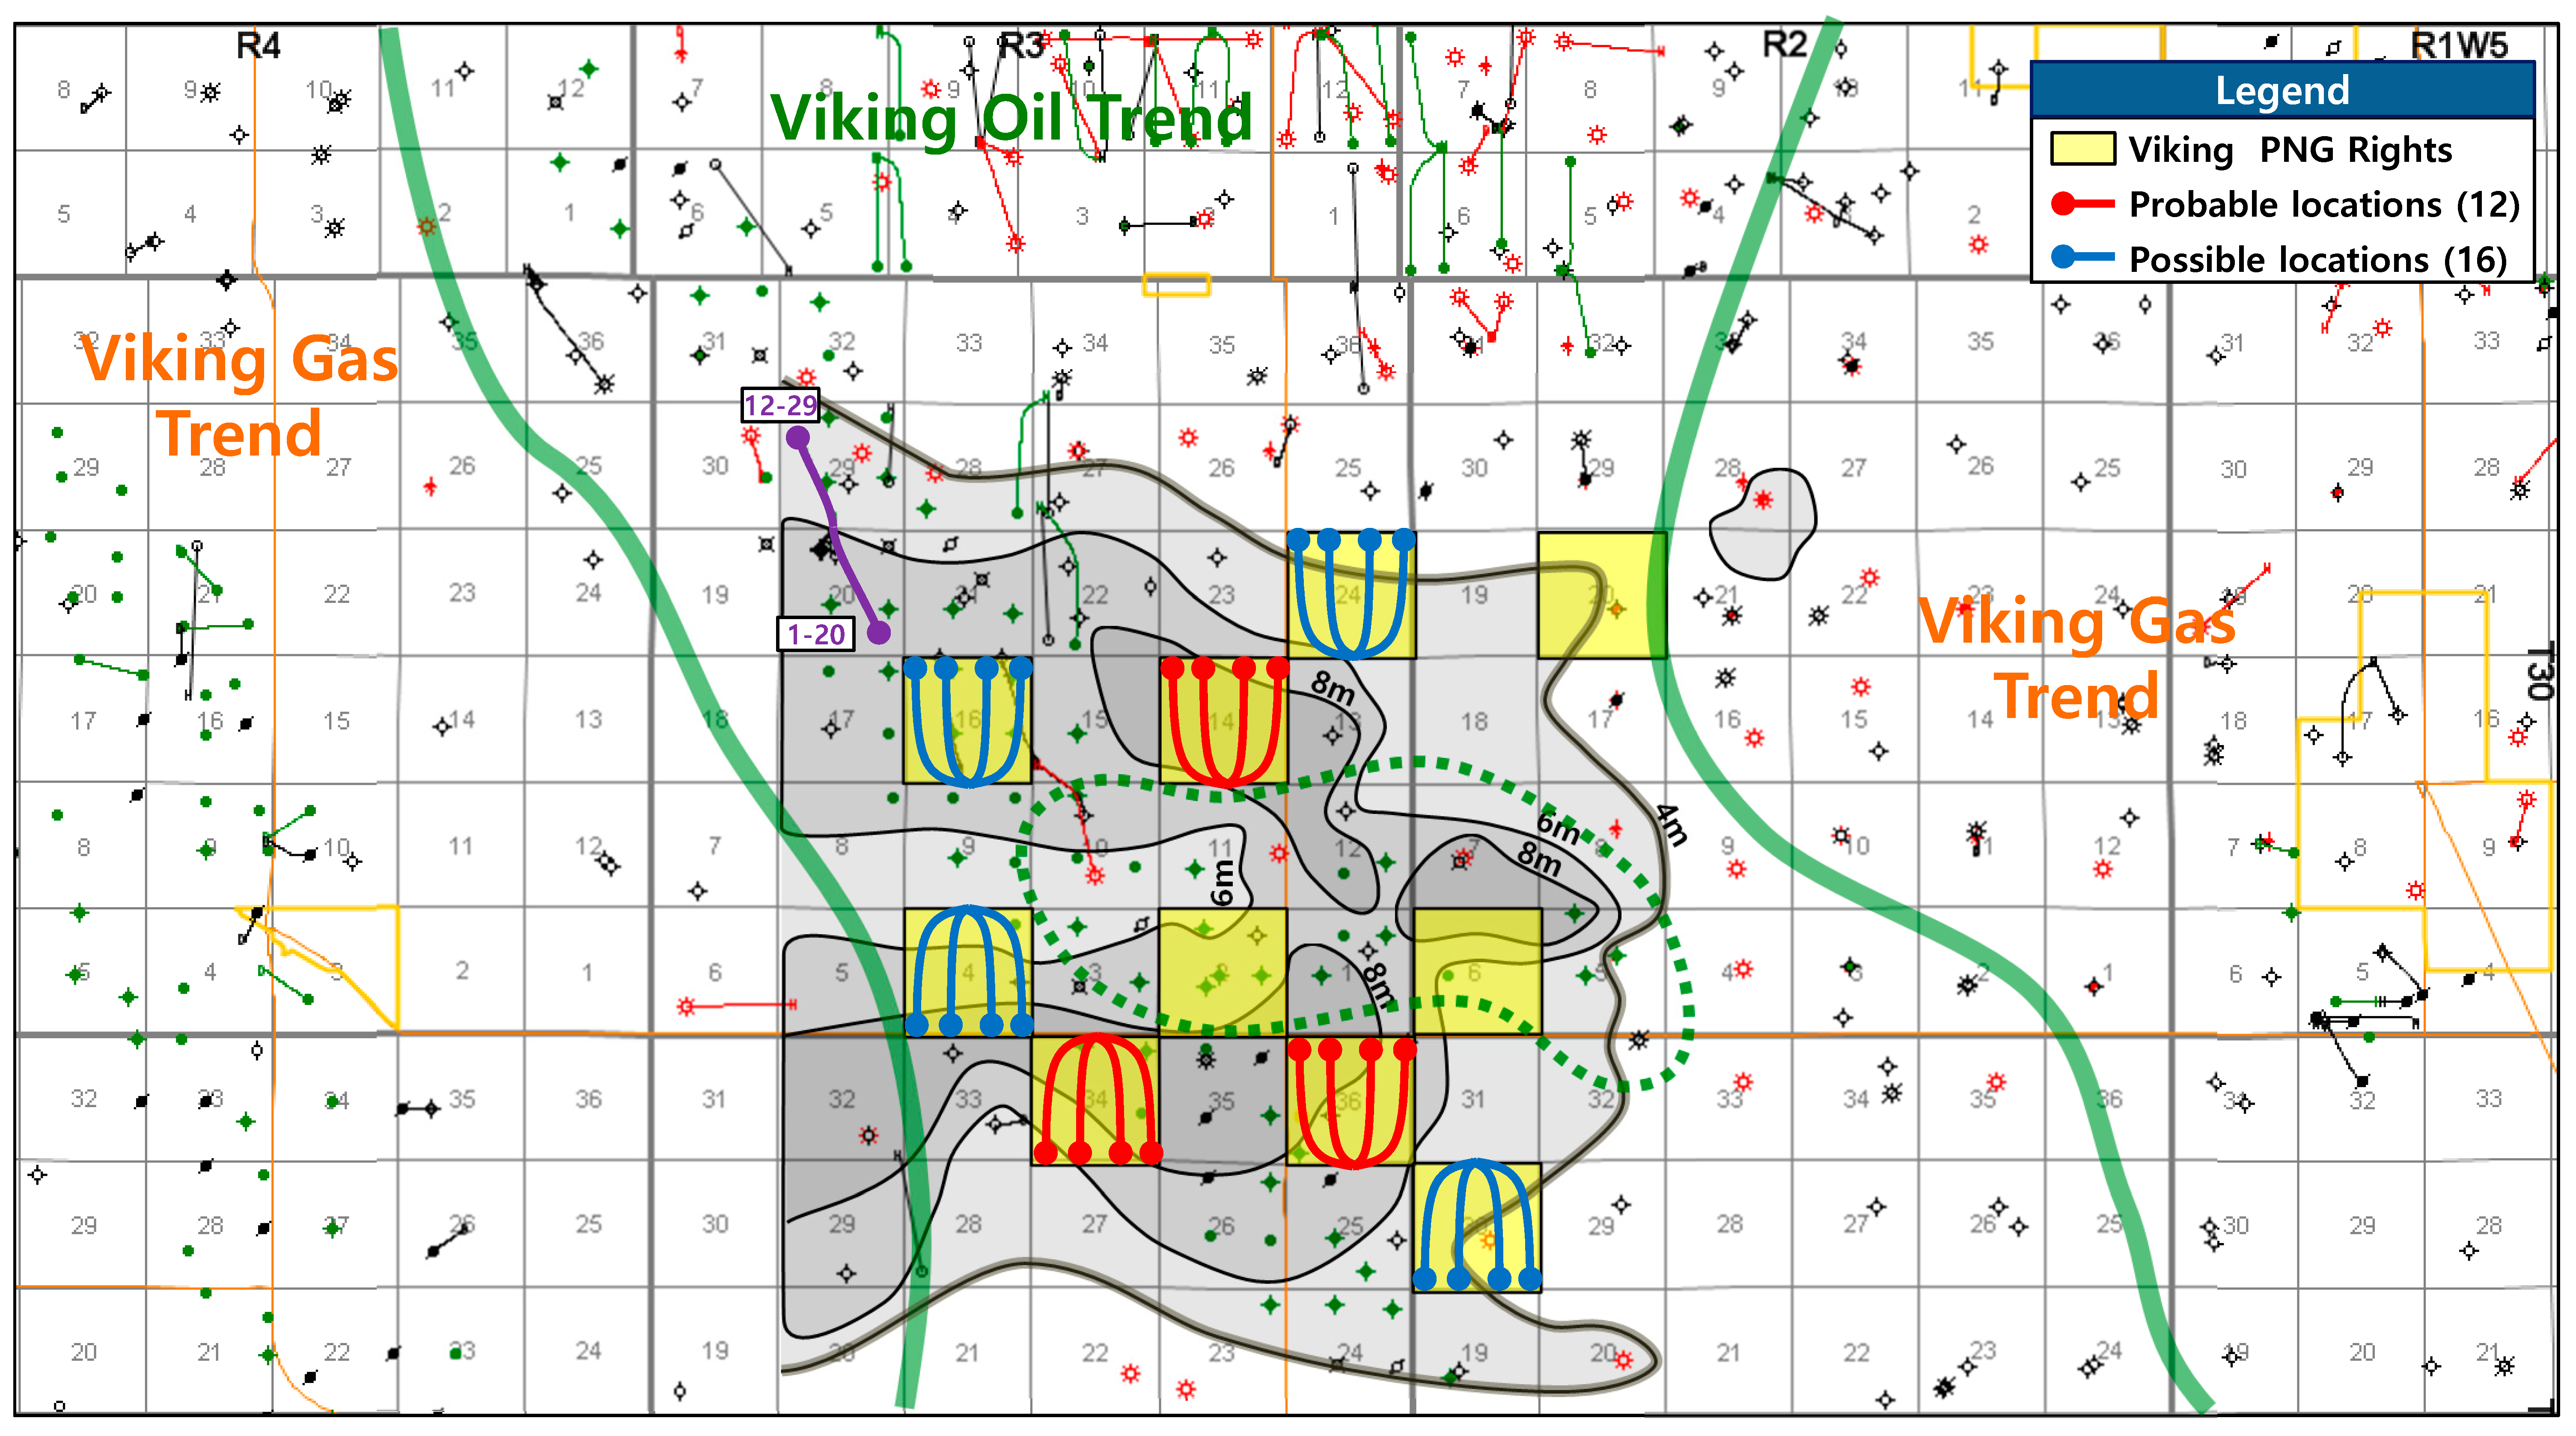
2.3.2. Viking Exploitation Potential Analysis

After analyzing over 30 wells located within the study area, it is found that the Viking E and Viking D zones would provide the best hydrocarbon production. Moreover, there are several small Viking pools in the vicinity (Figure 7), and the cross-section (Figure 8) tells us that the main reservoirs, Viking E and D zones, are spread out over most of the study area.
The maximum net pay of Viking E and D in the target land at 6% porosity cut is determined to be 8 m from the well logs. Based on this, the area with net pay between 4 m and 6 m is classified as “possible location”, and “probable location” for the area with net pay between 6 m and 8 m. Assuming 4 horizontal wells per section as in the case of the Cardium exploitation, there is potential for 16 wells in the possible locations area and 12 wells in the probable locations (Figure 9).

2.3.3. Viking Economics

To analyze the economics of exploiting the Viking formation, 01-20-T30-R3W5 well (EUR 134 Mbbls) was chosen as the reference well. This well is located northwest of the target land, in the area with a 3 m net pay at 6% porosity cut.
The case history from Triaxon Energy, which was an operator in the neighboring field, was used to calculate the DCET cost which is determined to be 4 MMCAD for the TVD of 2.2 km and the MD of 3.6 km [12]. The operating expenses were set equal to that of the Cardium example, the fixed cost at 5000 CAD/month/well, and the variable cost at 10 CAD/bbl. The Alberta Royalty Framework and the incentive for new horizontal wells were also applied as in the aforementioned example. Based on these assumptions, the rate of return is 50.6%, and NPV@10 is 1.7 MMCAD at the WTI price of 70 USD/bbl (2% increase annually) and CAD/USD exchange ratio of 1.33.
A sensitivity analysis was performed with respect to the oil price and DCET cost as in Table 4. In the analysis, the oil price varied from 60 to 80 USD/bbl, and DCET cost varied from 3.0 to 4.0 million CAD.

2.4. Other Formations

There are exploitation potentials in the formations other than the Cardium and Viking as mentioned previously, such as the Ellerslie, Elkton, Shunda, and Wabamun formations. Out of these, the Ellerslie and Elkton were analyzed because of their relatively higher potential. The Ellerslie formation in the study area has an excellent liquid-rich gas production (Figure 10) and large-scale drilling activities had begun in the north of the land and then towards the south. The formation has 1~3 m of net pay with a 6% porosity cut in the study area, which causes difficulties in investigating the existence of reservoirs using outdated well logs and seismic exploration analysis. Therefore, the Ellerslie requires drilling to confirm the presence of the reservoirs, preventing any large-scale development although there are high exploitation potentials.
To the east of the study area, there is a vast Elkton pool that has cumulative production of 1.0 Tcf, and other small pools with excellent gas production, such as Rundle A, Rundle L, and Rundle H pools. Because of these pools, there is a high possibility of development, but not many wells have been drilled to the Elkton formation (Figure 11), and lacks in geological data, causing complications for the evaluation of the exploitation potential. Thus, the Elkton formation requires additional seismic exploration and analysis to further investigate its potential.

2.5. Summary of the Crossfield Exploitation Potential Analysis

As the result of the analysis of the five formations in the Crossfield area, there is a total of 48 probable and possible horizontal well locations targeting the Cardium A zone and the Viking formation, and it is concluded that the evaluation of the exploitation potential of Cardium B, Ellerslie, and Elkton require additional research. The result of the study for each formation is summarized in Table 5 and Figure 12.

3. Conclusions

In this study, the reservoir characteristics of the formations in the Crossfield area were investigated through geological analysis and petrophysical interpretation, and the estimation of the reservoir property was performed. Moreover, the exploitation potential and the economics were determined for the main formations, the Cardium and the Viking, and the other formations, the Ellerslie and Elkton. The result of the investigation is as follows.

3.1. Cardium Formation

The Cardium A zone is one of the most typical reservoirs for horizontal wells in the WCSB; it is rich in hydrocarbon but has relatively low porosity and permeability and therefore requires horizontal drilling and multi-stage fracturing to maximize the production. In the study area, the maximum net pay of the Cardium A is 5 m at a 6% porosity cut, resulting in the prospective drilling of 14 horizontal wells in the possible location (net pay 3~4 m) and 4 wells in the probable location (net pay over 4 m). Based on the production data of the wells and the case histories from the operators in the area, the rate of return would be 12.4%, payout in 5.3 years, NPV@10 of 0.8 MMCAD at the WTI price of 55 USD/bbl.

3.2. Viking Formation

The Harmattan pool, located north of the study area, is the most actively produced pool with an average thickness of 3 m at porosity cut of 6%, water saturation of 40%, and has produced 13 MMbbls of oil and 7 Bcf of gas. From the analysis of the well logs, the maximum net pay of the Viking E and D is 8 m at 6% porosity cut. A total of 14 horizontal wells can be drilled in the possible location (net pay 4~6 m) and 12 horizontal wells in the probable location (net pay 6~8 m). Following the same procedure and the conditions for determining the economics of the Cardium, the rate of return is 58.0%, the payout is 1.9 years, and NPV@10 is 2.5 MMCAD.

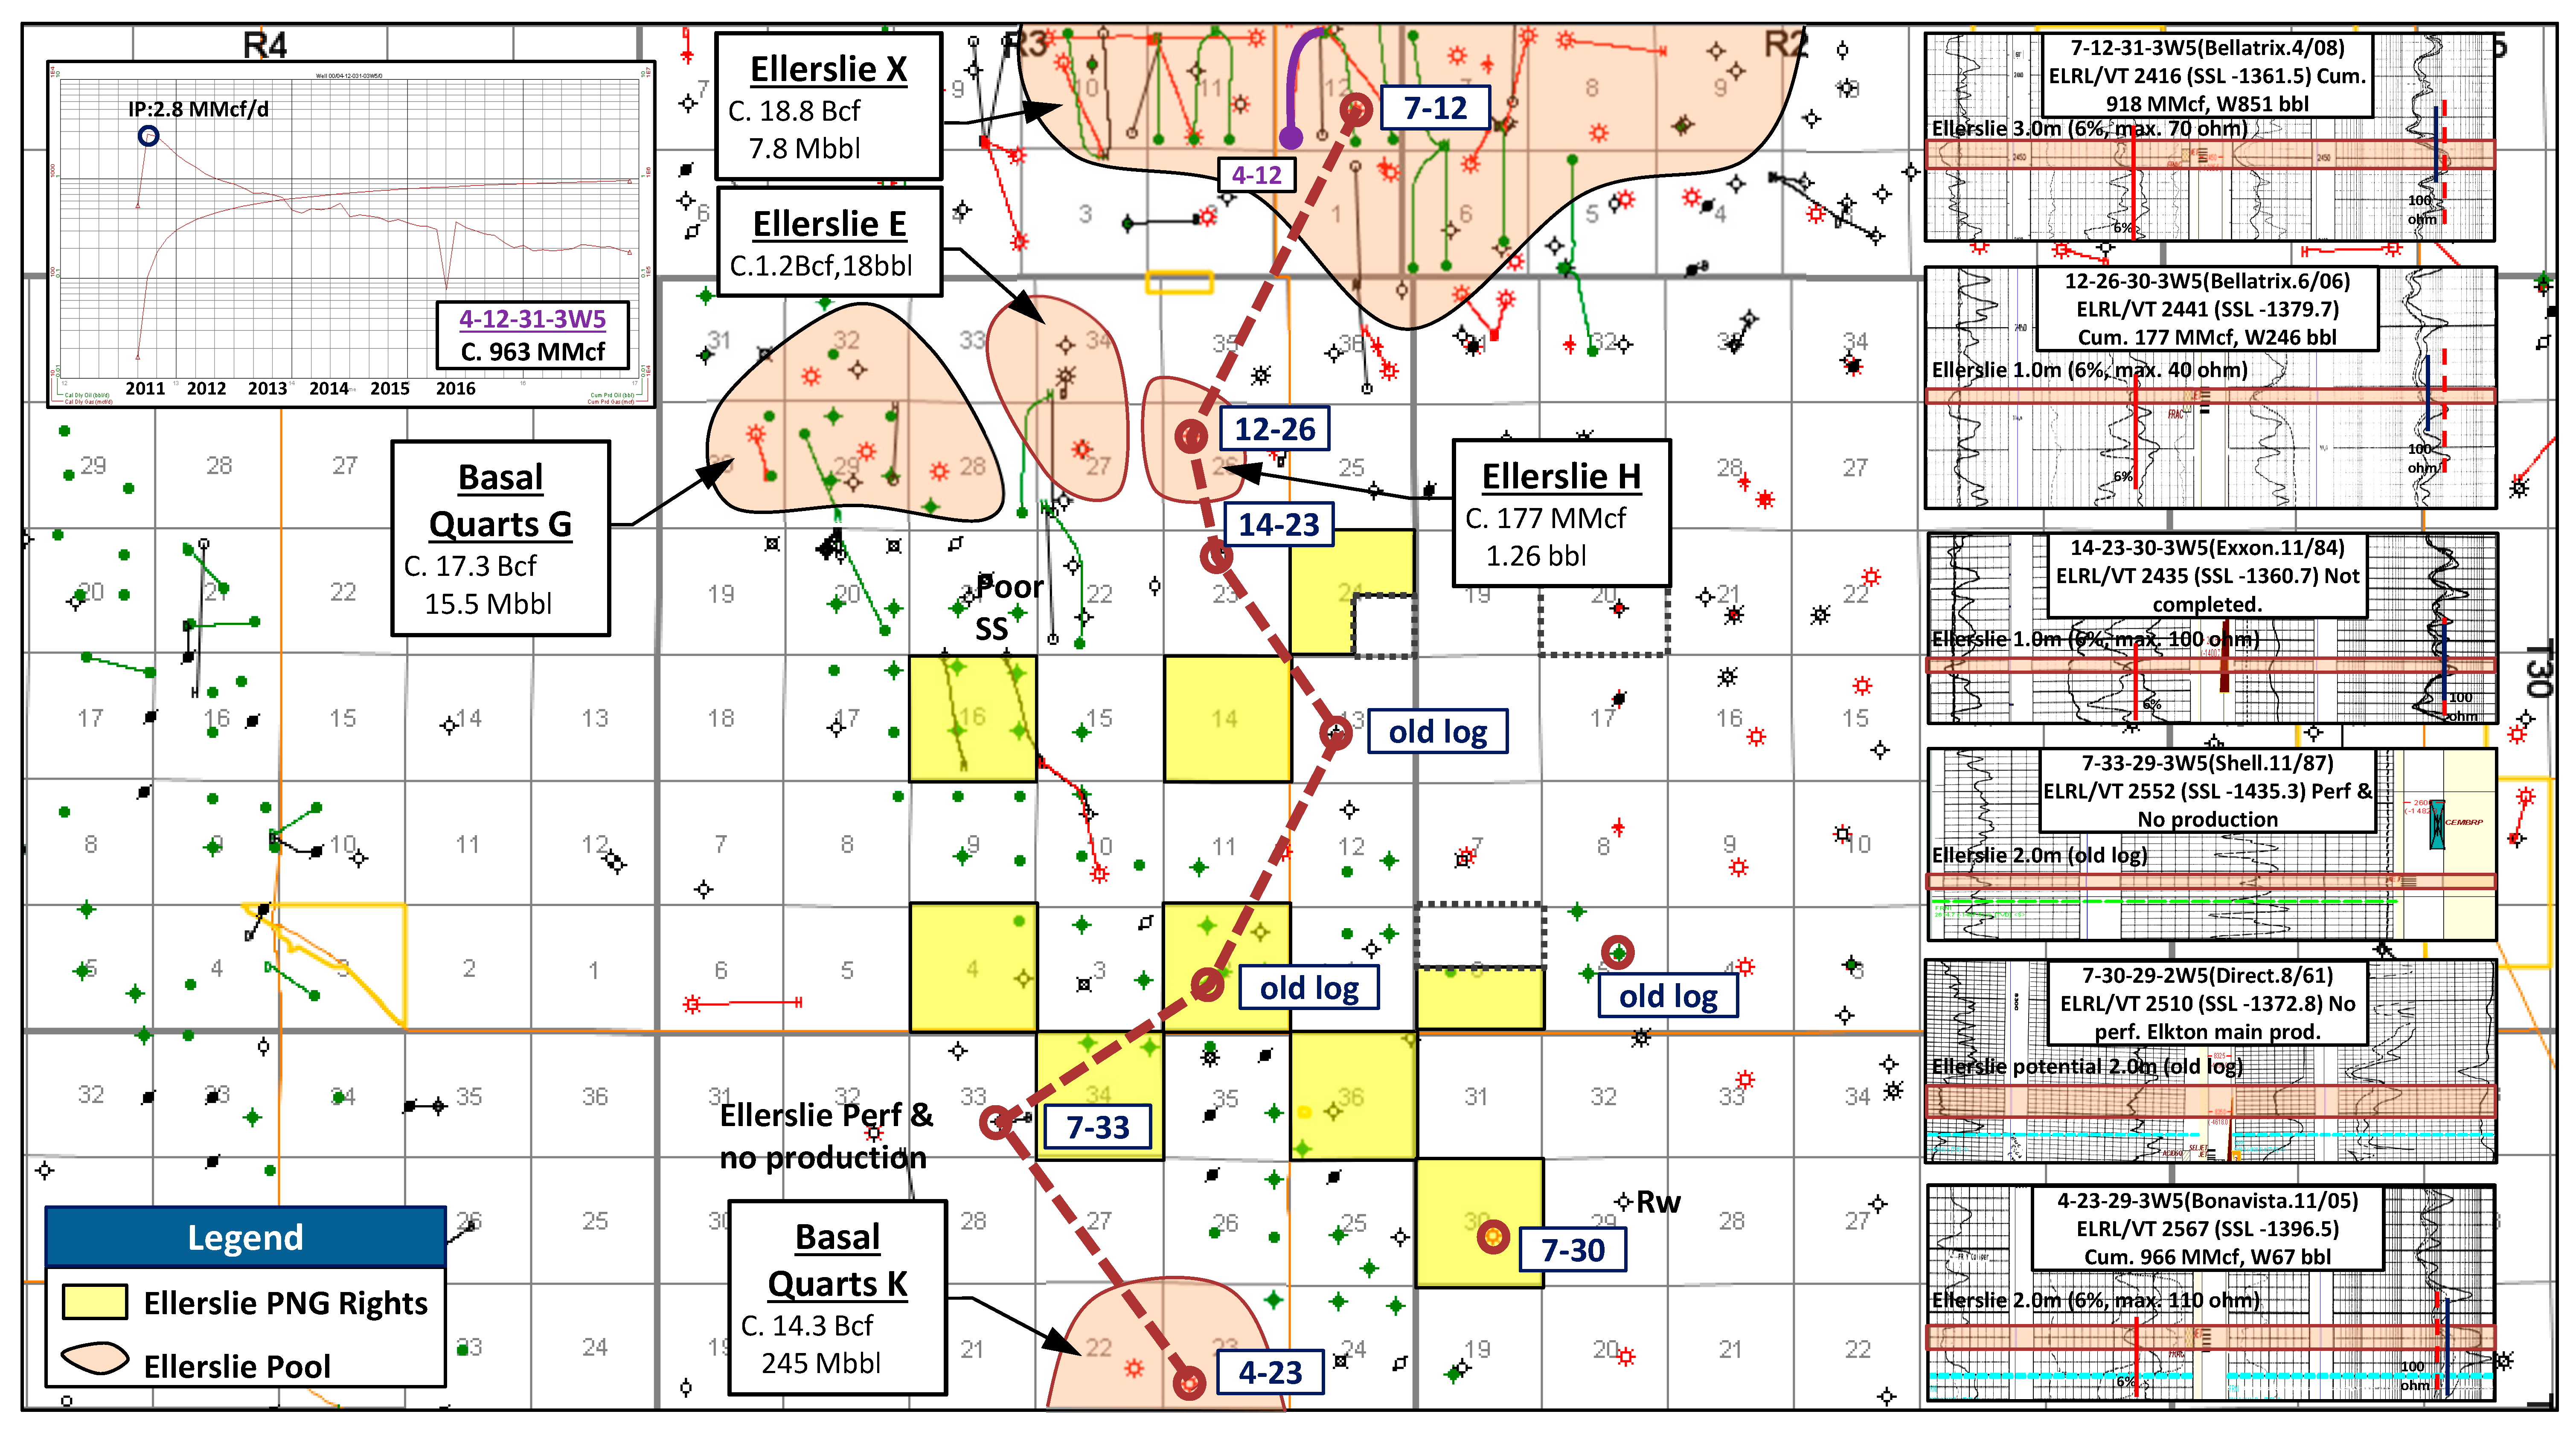
3.3. Ellerslie and Elkton

The Ellerslie formation in the area is an excellent producer of natural gas liquids and has been the target of large-scale horizontal well development in the northern part of the area. Therefore, it has potential for exploitation but requires drilling to confirm the existence of reservoirs, because its thickness is only 1~3 m, and there are difficulties investigating the reservoir from old well logs and seismic exploration analysis.
Moreover, there are various Elkton gas pools with good production history in the study area, such as the pool with 1.0 Tcf of cumulative gas production. However, not many wells are drilled to the Elkton formation and there is a lack of geological data, thus requiring additional seismic exploration to determine the exploitation potential of the formation.
The result of this study could be a successful exploitation guideline for the companies targeting not only the Crossfield area but also other various onshore oil and gas reservoirs in Canada. Additionally, it can provide in-depth knowledge of the WCSB to the researchers involved in the Canadian oil and gas projects.

Author Contributions

B.S.M. wrote the paper, and analyzed the results; W.L. analyzed the results, and edited the revised draft; Y.L. suggested the main idea and supervised the work. All authors have read and agreed to the published version of the manuscript.

Funding

This research received no external funding.

Acknowledgments

This work is supported by Korea Agency for Infrastructure Technology Advancement grant funded by Ministry of Land, Infrastructure and Transport.(RS-2022-00143644) and the Institute of Information & communications Technology Promotion (IITP) grant funded by the Korea government (MSIT) (No. 2021-0-02129).

Conflicts of Interest

The authors declare no conflict of interest.

Appendix A

Figure A1. Alberta Royalty Framework Formula for Conventional Oil.
Energies 15 06860 g0a1

References

  1. Seo, H.; Moon, B.; Kwon, S. The Recent Trend on Oil and Gas Industry in Canada. J. Korean Inst. Gas 2017, 21, 10–19. [Google Scholar]
  2. McKenzie, B. Multi-zone potential in Crossfield land sale. Canadian Discovery Digest Spark. Available online: https://library.mobile.canadiandiscovery.com/taxonomy/term/3091/all/%3A/feature-article/2019-western-canada-year-review-madison-group-subcrop-plays?page=8 (accessed on 1 September 2022).
  3. Moon, S.; Kim, Y.; Chang, S.; Kwon, S. Acquisition Procedure for Petroleum and Natural Gas (PNG) Rights in Alberta, Canada. J. Korean Soc. Miner. Energy Resour. Eng. 2017, 54, 268–279. [Google Scholar] [CrossRef]
  4. Mageau, L.; Zack, K.; Bouchard, J.; Stevenson, M.; Steppan, G.; Urness, V. Assessing the Cardium’s Second Generation-A Look at Horizontal Well Performance by Area; Raymond James Ltd.: Vancouver, BC, Canada, 2012; p. 19. [Google Scholar]
  5. HIS. ACCUMAP ver 27.10. 2017. Available online: https://ihsmarkit.com/products/oil-gas-tools-accumap.html (accessed on 1 September 2022).
  6. Pattison, S. Relative Sea Level Control of Incised Shoreface Sediments in the Burnstick Member, Cardium Formaiton, Upper Cretaceous Alberta. 1987. Available online: http://hdl.handle.net/11375/8722 (accessed on 1 September 2022).
  7. Bonavista Energy Corporation—Taber & Crossfield Assets. Available online: https://bonavistaenergy.com/ (accessed on 1 September 2022).
  8. TransGlobe Energy Corporation. Available online: https://www.trans-globe.com/operations/canada-western-canadian-sedimentary-basin/ (accessed on 1 September 2022).
  9. Macuarie Research. Viking Quest; Equities Research, 2011; pp. 1–33. Available online: www.macquarie.com.au/disclosures (accessed on 1 September 2022).
  10. Alberta Petroleum Royalty Guidelines: Principles and Procedures, Government of Alberta. 2013. Available online: https://open.alberta.ca/publications/alberta-petroleum-royalty-guidelines-principles-and-procedures#summary (accessed on 1 September 2022).
  11. Reinson, G.; Warters, W.; Cox, J.; Price, P. Cretaceous Viking formation of the western Canada sedimentary basin. In Geological Atlas of the Western Canada Sedimentary Basin; Canadian Society of Petroleum Geologists: Calgary, AB, Cannada, 2010. [Google Scholar]
  12. Peters & Co. Limited. Triaxon Oil Corporation Information Memorandum; Peters & Co. Limited: Calgary, AB, Canada, 2015. [Google Scholar]
Figure 1. Location of Crossfield in Alberta, Canada.
Energies 15 06860 g001
Figure 2. Multi-zone oil and gas producers in the study area.
Energies 15 06860 g002
Figure 3. Stratigraphy of Cardium A and B in the study area (modified from Pattison, 1987 [6]).
Energies 15 06860 g003
Figure 4. Well log and core analysis of the Cardium A and Cardium B reservoir.
Energies 15 06860 g004
Figure 5. Cardium A development plan by net pay mapping with economic evaluation.
Energies 15 06860 g005
Figure 6. Regional Viking Geology in Western Canada Sedimentary Basin.
Energies 15 06860 g006
Figure 7. Viking oil trend with local oil pools in the study area.
Energies 15 06860 g007
Figure 8. Viking cross section (N-S, E-W) in the study area.
Energies 15 06860 g008
Figure 9. Viking development plan by net pay mapping with economic evaluation.
Energies 15 06860 g009
Figure 10. Ellerslie development potential in the study area.
Energies 15 06860 g010
Figure 11. Elkton development potential in the study area.
Energies 15 06860 g011
Figure 12. Development summary in the Crossfield study area.
Energies 15 06860 g012
Table 1. Total spuds and average 3 months cumulative production of the study area (McKenzie, 2016).
Zone of InterestWell Specification
(Spud over 100 Wells)
Ave. 3 m Cum. Total (Mboe)Ave. 3 m Cum. Oil (Mbbls)Ave. 3 m Cum. Cond. (Mbbls)Ave. 3 m Cum. Gas (Mboe)
SpudDev/VTHZDev/VTHZDev/VTHZDev/VTHZDev/VTHZ
Cardium4482829111.210.69.68.4001.62.1
Viking11756204.86.41.21.7003.74.7
Ellerslie14958337.623.11.10.90.20.16.322.2
Elkton22015519143.589.723.416.68.70.1111.473.0
Suunda124135807.228.3371.721.1393.5042.07.2
Table 2. Alberta’s incentives for new horizontal oil wells (5% royalty until the maximum is reached).
Measured Depth (Meters)<2500<3000<3500<4000<4500>4500
Cum. oil produced (Mbbls)50,00060,00070,00080,00090,000100,000
Production month (months)182430364248
Table 3. Cardium Economics Sensitivity Analysis with respect to oil price and DCET cost.
IRR (%)Oil Price (USD/bbl)NPV (MCAD)Oil Price (USD/bbl)
607080607080
DCET
(MMCAD)
3.020.747.1113.6DCET
(MMCAD)
3.01188 2069 2927
3.59.323.346.63.5688 1569 2427
4.02.812.425.24.0188 1069 1927
Table 4. Viking Economics Sensitivity Analysis with respect to oil price and DCET cost.
IRR (%)Oil Price (USD/bbl)NPV (MCAD)Oil Price (USD/bbl)
607080607080
DCET
(MMCAD)
3.541.196.0236.6DCET
(MMCAD)
3.51202 2204 3178
4.020.350.6105.04.0702 1704 2678
4.56.728.558.54.5202 1204 2178
Table 5. Development potential summary in the Crossfield study area.
Target Fm.TVD
(m)
PNG Right
(Section)
Probable
Location
Possible
Location
ROR, NPV@10Note
Cardium A20005.541412.4%, 0.8 MM$-HZ multi-fracs target
Cardium B20205.5----mature field with enhanced
oil recovery
Viking220010.0121658.0%, 2.5 MM$-HZ multi-fracs target
Ellerslie24508.25----verified by drilling
Elkton25506.75----future exploration
Total 1632
Publisher’s Note: MDPI stays neutral with regard to jurisdictional claims in published maps and institutional affiliations.

