1. Introduction
Hydrogen fuel cell (FC) is one of the prospective development directions of energy sources when considering portable devices. FCs convert chemical energy from hydrogen gas (H
2) to electrical energy, heat, and water vapor. It has zero CO
2 emission and can produce three times more energy than gasoline per unit of mass in combustion engines [
1,
2].
If coupled with renewable but unstable energy sources, such as wind or solar power plants, and green energy storage/generating systems, e.g., FCs, may greatly improve the utilization rate and stability of renewable energy [
3]. Among all types of FCs, such as solid-oxide, alkaline, and molten carbonate FCs [
4], proton exchange membrane fuel cells (PEMFCs) are considered suitable for transportation and portable applications due to low operation temperature/pressure ranges (45–100 °C/0.4–0.5 bar hydrogen) and fast start-up time [
5].
There are some shortcomings of PEMFCs associated with high materials cost, manufacturing price, and limited lifetime that limit the commercialization of this technology. However, the most challenging barrier for mobile applications is hydrogen storage [
2,
6]. The US Department of Energy (DOE) set a target for the energy density of a hydrogen storage system of 1800 Wh/kg or 5.4 wt% gravimetric hydrogen storage capacity (GHSC) for automotive applications by 2025 [
7]. Currently, only a limited safety solution of H
2 storage at 700 bars in special tanks or complex storage using liquid hydrogen or absorbed hydrogen has been shown to provide a storage density of 4.0–5.7 wt% [
8,
9]. However, pressurized or complex storage is not suitable for most of the needs, and further search for alternatives is required.
Metal hydrides have the potential for meeting those targets [
1,
10,
11]. For example, sodium borohydride (SBH, NaBH
4) is a common candidate since it has high hydrogen content, is well studied, has relatively low cost, is stable as a solid in dry air for months, its reaction products are non-toxic, and it can be recycled [
12]. The fuel comprised of SBH
, and H
2O can theoretically deliver 10.8 wt% of Hydrogen [
13]. Notably, H
2O provides half of the H
2 produced by the reaction (Equation (1) below), whereas the rest comes from the SBH. This reaction, however, faces different hurdles. The main challenges are the low solubility of SBH and its product, sodium metaborate (NaBO
2), in water, which implies that an excess amount of water is needed to facilitate the reaction and solubilize its products [
6,
13,
14,
15]. In a previous study, we suggested an efficient method of hydrogen generation by catalytic reaction between solid SBH and water, which allows the utilization of recuperated water for further hydrogen production [
16].
Usual commercially available open cathode FCs produce water in the state of vapor and the flow forced through them by the fan plays a dual role: cooling and oxygen supply. The membrane electrode assemblies (MEAs) of such stacks are designed to operate at much higher ventilation flow rates than stacks with a close cathode (>300 times higher), since the cooling flow greatly exceeds the stoichiometric amount of air required for stable operation [
13].
Implementation of a water recuperation system (WRS) that harvests water vapor from the FC cathode emission and recirculates it into the generator may significantly reduce the weight of the carried water, hence increasing the fuel’s GHSC, since a part of the required excess water is not stored anywhere but appears during FC operation. Previous attempts to use water vapor directly from the FC were made by Kong et al. [
14]. However, they observed that SBH did not react well with water vapor. Therefore, an alternative method should be applied to exploit water vapor from the FC, e.g., by water condensation and collection for further implementation in the hydrogen generator. Several studies were performed regarding water recuperation from hydrogen fuel cells. Yamazaki et al. [
17] developed an analytical model which predicts the amount of recuperated water from the PEMFC and proved it experimentally. Tibaquirá et al. [
18] examined if such recuperated water meets the sufficient requirements for drinking water. Anand et al. [
19] proposed using a water separator for a more efficient recuperation. Nevertheless, all these studies were performed in closed-cathode FCs which require much lower air supply and are considered suitable for high-power fuel cells (1–2 kW and above). Portable applications (30–1000 W) use FC stacks with cathode open to the air, which are of much greater interest [
20,
21] due to their capability to reduce the weight, volume, cost, and control complexity. In the open cathode FC, the oxidation flow is coupled with the cooling flow. Hence, the required airflow is much higher than those of closed cathode stacks, and water cannot be condensed just by cooling the exhaust flow. Therefore, to condensate water from an open-cathode FC, a more complex system is required with a partially closed air recirculation. As far as we know, no WRS as proposed here was suggested, developed, and tested before.
Among the different types of FC-based systems which can benefit from an SBH hydrogen generator with high GHSC, small unmanned aerial vehicles (UAVs), also called drones, are of special interest. It was shown [
19] that utilizing an FC power plant may significantly increase their flight duration. For example, a 10 kg fixed-wing drone can be powered by a 200 W FC, which makes this kind of vehicle suitable for further research [
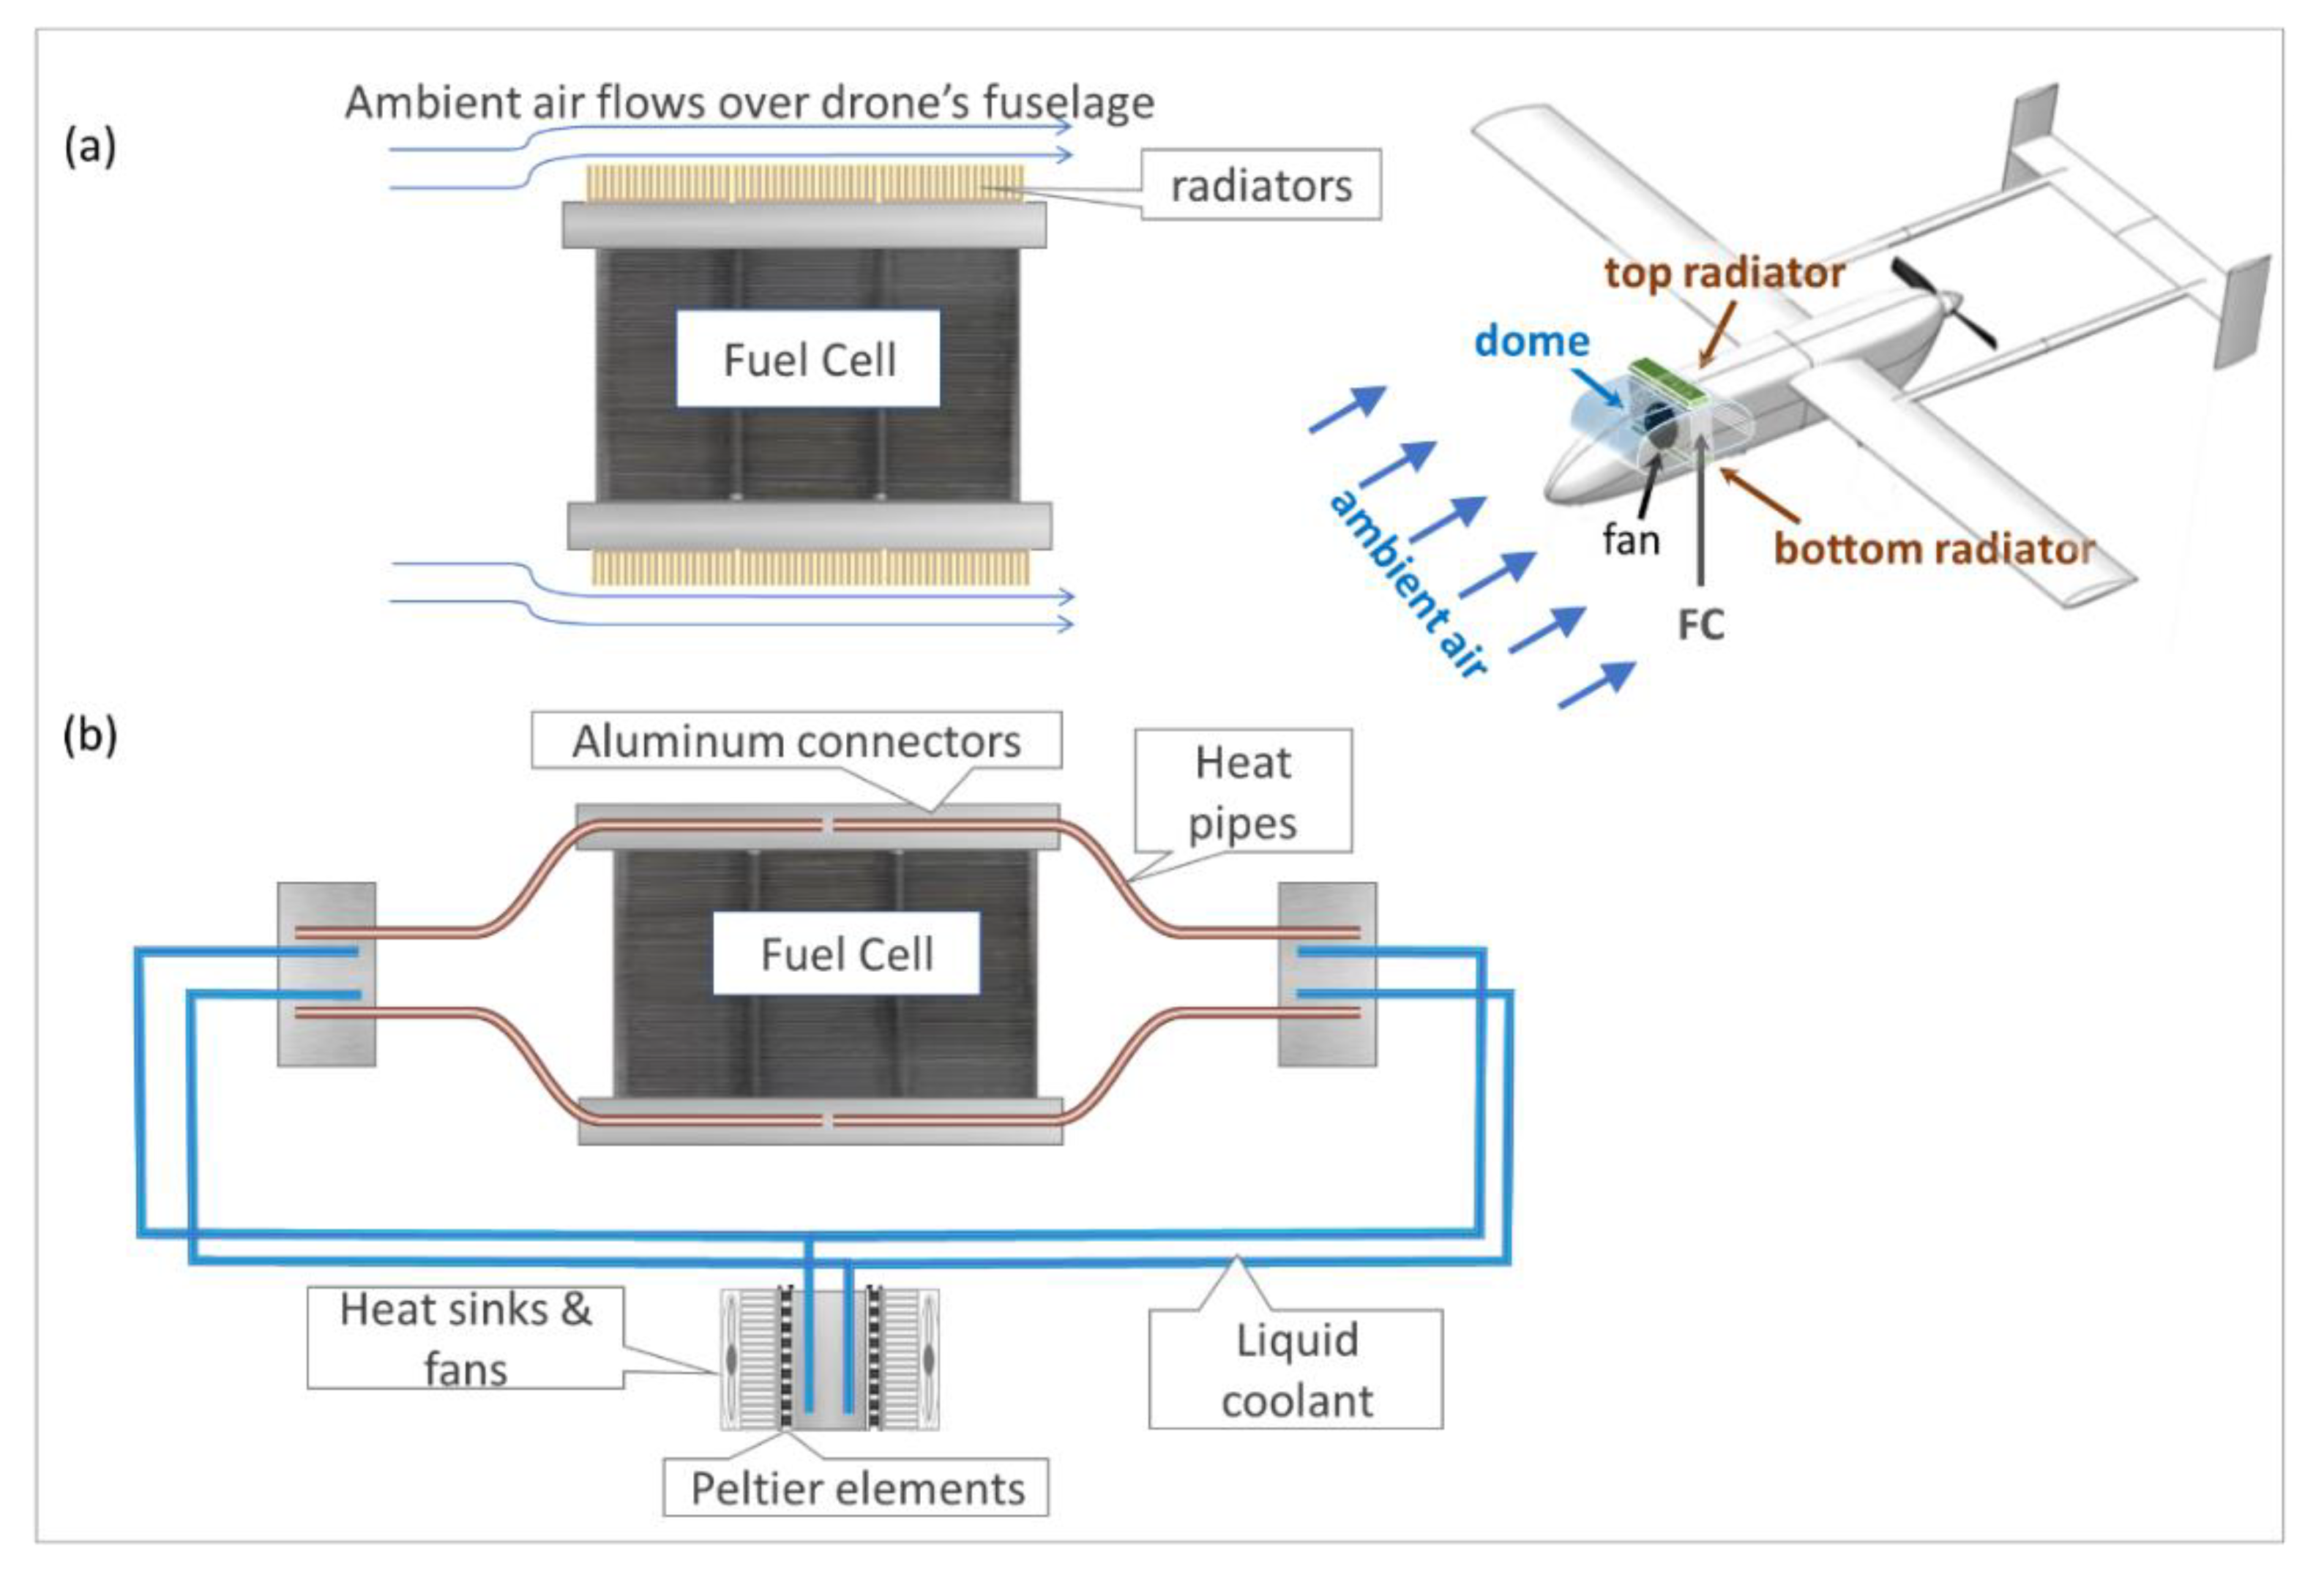
22]. However, the FC should be isolated from the cold and dry ambient air at high altitudes to prevent FC power output degradation due to dehydration or overcooling. In these cases, the cold ambient air can be utilized for FC edge cooling (i.e., removing heat by radiators connected to the FC’s edges, as described in one of our previous research articles [
23]), as well as for the implementation of a WRS from FC vapor for hydrogen production. This may significantly increase the energy density of the power plant fueled by solid SBH.
In this study, we suggest utilizing the passing ambient airflow both as an oxygen source for ventilation and as the carrier for convection cooling—for both FC thermal management (via edge cooling) and for condensing the FC vapor. For this purpose, we examined enclosing the FC in a closed dome and recirculating the humid air through the stack while using edge-cooling methods for FCs thermal management [
23]. To provide sufficient oxygen for FC operation, the dome includes a ventilation inlet and exhaust outlet ports (
Figure 1).
A controlled ventilation airflow is forced through the ventilation inlet at the desired flow rate. It mixes with air already circulating inside the system (by a fan) and reduces its humidity. It is further supplied to the FC where a part of the oxygen molecules reacts at the MEA’s cathode side catalyst layer [
24] with hydrogen ions and electrons from the circuit to produce electrical current and turns into water molecules [
25]. Hydrogen ions, in their turn, are supplied there through proton exchange membrane (usually Nafion) after the catalytical split of hydrogen molecules to protons and electrons at the MEA’s anode.
The air heats up while flowing through the FC, so the relative humidity (RH) of the heated air inside the stack is expected to be low enough to prevent MEA flooding by active condensation. The hot humid air (
Tmax in
Figure 1) that leaves the FC, circulates in the WRS dome by a fan and cools down on the way (over the dome’s walls by the ambient air), while a small part of it leaves the system as exhaust (due to mass conservation). The outlet exhaust air flows through a heat exchanger and cools down to ambient (or close to ambient) temperature (
Tmin at
Figure 1), where a dew point is reached, and condensation occurs on the inner walls of the dome. This way, most of the vapor produced by the FC is condensed and collected (by gravity) from the enclosed dome and delivered to the generator for further H
2 production.
The optimal flow rate of the ventilation air can be estimated analytically. The ventilation flow should be sufficient for FCs’ stable performance but not too high to minimize vapor losses through the exhaust. In addition, to prevent the membrane from flooding and the consequent decrease in FC performance at full saturation conditions, the actual ventilation airflow rate should be examined experimentally. Therefore, in this manuscript, we develop an analytical description of the condition in which this concept might be employed. A theoretical expression for the ventilation flow rates as a function of FC power and ambient temperature and humidity is offered. An experimental prototype was built and tested to validate the theoretical calculations, prove the concept’s feasibility, and estimate its efficiency at relatively low temperature gradient (i.e., at room temperature). Note that high altitude conditions are expected to further improve the water collection efficiency and system energy density, as predicted by the theoretical calculations.
2. Analytical Model
In this section, we provide a theoretical calculation of the expected improvement in hydrogen storage efficiency and conditions at which the WRS should operate. The process of hydrogen production from SBH hydrolysis at the H
2 generator is given by Equation (1):
where
x is the excess of water and
n ≤ x is the hydration water trapped by NaBO
2 molecules, which varies with solution temperature. For reaction temperatures lower than 53.6 °C,
n = 4. For a temperature range between 53.6 °C and 105 °C (as in our case),
n = 2. At temperatures above 105 °C,
n = 0.5 [
6].
The electrochemical reaction that takes place in the FC is given by Equation (2):
Two parameters are commonly utilized to describe FC power plant fuel efficiency: GHSC and energy density. Increased GHSC means increased fuel energy density and vice versa. All the calculations in this research are presented in terms of fuel GHSC defined in Equation (3):
where
is the mass of fuel (water + SBH). The actual value of
changes during operation if a WRS is utilized.
,
, and
are the initial mass of SBH powder, the total mass of water required to fully accomplish the reaction, and the total mass of water collected from the WRS, accordingly.
and
can be represented in the following view:
where
is the coefficient of water collection out of the total amount of water that appeared inside the WRS and water carried by ventilation flow (
).
represents the amount of water formed in the FC cathode during the oxygen reduction, and
represents the amount of water entering the WRS with the ambient ventilation air (see
Figure 1).
Substituting Equations (4)–(6) to Equation (3) gives the following expression for average fuel GHSC:
In our previous research [
16], we were able to achieve a water excess
x of 6.4 using a novel generator that used solid SBH powder. That way, for the worst case, where the inlet air is totally dry (i.e.,
= 0), GHSC becomes:
The suggested WRS should reduce the initial mass of excess water stored in the generator (according to
k), while keeping the required water excess for the reaction. Recuperation alone, however, will not be able to increase GHSC significantly if the products of NaBO
2 with excess water remain inside the system throughout the operation cycle. Fortunately, NaBO
2 water solution is non-toxic [
6,
13] and can be purged to the ambient environment. That way the fuel’s weight in the system can reach zero by the end of the process.
Figure 2 shows the influence of the water collection coefficient on GHSC of initially stored fuel described by Equation (8). It is shown that water recuperation from the FC even in the absence of water vapor supply from the ambient air can increase the GHSC of stored fuel up to 38%. The actual increase of the whole energy system’s GHSC, however, will also depend on the weight of the WRS, including FCs heat management and its water collection properties.
To implement the recuperation approach, one should first define the optimal ventilation airflow sufficient for stack stable operation, estimate the humidity level which may be achieved in that flow, and make sure that its dew point is higher than ambient temperature. In that case, condensation and, accordingly, recuperation is possible. The mass of water produced by FC (
) can be found from Faraday’s laws of electrolysis:
where
and
are water mass and molar flows,
= 18 g/mol is the molar mass of water,
is stacks current (in Ampere),
is the number of MEAs in the stack, and
= 96,500 (C/mol) is the Faraday constant.
The corresponding stoichiometric ventilation airflow
is:
where
is air molar volume calculated from the ideal gas equation. The number 0.21 stands for the molar percentage of oxygen in the air. The required airflow
can be calculated using:
where
> 1 is the ratio between the actual airflow and stoichiometric air flow rate required for stable FC operation. In this paper, we define stoichiometry of the ventilation flow as the ratio between the actual ventilation flow to theoretical sufficient to fully accomplish an electrochemical reaction inside the stack: 1 mole of oxygen for every 2 moles of supplied hydrogen, assuming that the molar fraction of oxygen in the air is 21%.
If the ventilation airflow
is too high, the absolute humidity (
) inside the system may become too low to achieve a dew point at the exhaust cooled down to
(
Figure 1), and condensation conditions might not be obtained in the system. To ensure water collection, the mass of water vapor that leaves the system through exhaust (
) should be less than the total amount of water produced by the FC plus water that entered the system through ventilation.
can be found from the following equation:
where the absolute humidity at saturation
is defined as follows:
where
is the saturated vapor partial pressure and
= 461 J/kg*K is the specific gas constant for water vapor.
Since the FC consumes a part of the oxygen molecules and increases the flow humidity, the outlet flow
is different from the ventilation inflow and should be found (from mass conservation). Assuming that the flow is cooled down to
, and the sum of air and vapor partial pressures are equal to atmospheric and using the ideal gas equation,
can be presented in the following view:
Water vapor partial pressure at saturation (
) can be found from Tetens’ equation (temperature in degrees Celsius):
Assuming the worst-case scenario, using dry inlet air (
), the ratio between produced water by the FC and lost water through exhaust outflow can be found from Equations (10), (12), (14) and (16):
Thus, while the inlet ventilation flow stoichiometry satisfies the following equation, the FC has enough oxygen to operate, while condensation in the WRS is ensured.
Figure 3 presents the threshold of stoichiometry coefficient
λ (T) at the dew point for flight at (−20 °C) >
Tmin > 35 °C and for air pressure of
Patm = 1 atm (as recommended for FC operation). Ventilation airflow with stoichiometry
λ that lies between the red and blue lines should be sufficient for both FC operation and condensation.
It is clear from
Figure 3 that for
Tmin < 35 °C, the FC produces a higher amount of water than required for saturation at the stoichiometric air inflow (l = 1). For lower exhaust temperatures (e.g., cooling down to an ambient temperature at high altitudes), the saturation can be achieved at higher inlet flow, with up to
= 340 at
Tmin = −20 °C. Therefore, the actual amount of recuperated water depends on several parameters, including the FC operating conditions (current and temperature), surrounding humidity and temperature of inflow, and the humidity and temperature of outflow.
To estimate the part of recuperated water (
k), the following assumptions are applied: the airflow temperature cannot exceed the temperature of the FC (
Tmax ≤
TFC), and the outflow air is cooled down to an ambient temperature (
Tmin =
Tamb) before leaving the WRS. In that case, the part of condensed water (
k) that can be extracted from the total amount of water circulating in the system may be found from the following equation:
The graph of
k for various ventilation stoichiometries and ambient temperatures is presented in
Figure 4. For ambient temperatures lower than −20 °C, the rate of water collection is above 95% even with
λ = 10. For temperatures higher than 0 °C, the ventilation stoichiometry significantly affects water collection parameters. As mentioned above, the ventilation air that enters the WRS also contains a certain amount of water vapor (
), that was not considered during the analytical calculations; however, it was taken into account during the experiment. Thus, the values of
k presented in
Figure 4 are an underestimation of the real case.
Using the above analytical estimation, an experimental study was conducted to present the actual implementation and feasibility of the suggested WRS in the worst-case conditions of room temperature and dry ventilation.
4. Discussion
In this paper, we studied a new method of water recuperation from open-cathode PEMFC. We developed the corresponding theoretical calculations defining the operation conditions and an experimental setup to validate the concept feasibility under worst-case conditions of room ambient temperatures and dry inlet ventilation.
The suggested WRS with circulation and controlled ventilation ports may allow both sufficient oxygen supply through ventilation to support FCs’ stable operation and the conditions for vapor condensation inside the dome. The ventilated airflow may be supplied either by a pump or regulated air intake if such a system is utilized on a fixed-wing drone.
Usual commercially available open cathode PEMFCs are designed to operate at high ventilation flow rates while the cooling flow greatly exceeds the stoichiometric amount of air required for stable operation. For example, for a commercial stack with 35 MEA BPP operating at 100 W and 5 A is about 3 L/min (estimated using Equation (12)), the typical colling fan (e.g., Noctua NH-U9S) may provide an average flow of 1000 L/min, which results in stoichiometry λ > 300. According to the theoretical analysis presented here, to maximize the water collection by the WRS, the ventilation inflow should be decreased to the minimal amount sufficient for FC stable operation (
Figure 3). However, if a ventilation flow at low temperature and low stoichiometry is supplied directly to an open-cathode PEMFC, it may cause water condensation inside the stack due to changed water balance in the MEAs, which in turn might cause cathode flooding and stack operation failure. Thus, the flow through the stack itself must be high enough to sustain proper water balance, while ventilation stoichiometry should be as low as possible. Moreover, ventilation is inevitably associated with the outflow of humid used air and therefore reduces the water utilization inside the dome.
Indeed, the experiments revealed that while the ventilation flow rate is kept at λ > 2.4, the FC operation is stable for a relatively long duration (60 min) while placed inside a semi-closed system. Even with a relatively high ambient temperature of 25–27 °C and dry inlet ventilation, the air circulation, edge cooling, and controlled ventilation allowed for a constant rate of condensation and collection of more than half of the water entered the system (from the FC and ventilation). This suggested method may be implemented in systems that use water as a fuel for light on-demand hydrogen generators (e.g., SBH-based) and thus can increase the average fuel’s energy density associated with SBH to GHSC of 6.8 wt% and can be further increased if byproduct emission is applied.
With emission, the system’s weight will decrease during operation and overall efficiency will improve. The expected flight time for the UAV, in that case, might be found to be similar to the Breguet range/flight time equation:
where χ is the drone’s specific power required for a cruise flight measured in kW/kg, SFC is propulsion system-specific fuel consumption measured in kg/kWh and
Winitial/final are the drone’s initial and final weights.
To illustrate the increase in flight duration for a such system with recuperation and byproduct emission, let us consider a study performed by Lapena-Rey et.al. [
26] who performed an experimental test of SBH solution-based power pack with a 200 W FC (AEROPACK) installed on 11 kg maximal take-off weight fixed-wing drone and measured the real fuel consumption and required power for cruise flight. For the studied case, the fuel mass was 1 kg, which corresponds to the 1 L volume of 20 wt% SBH solution. This is similar to the ratio of the generator developed by our research group. The main difference is that we use a solid SBH solution, which is on-demand mixed with water and catalyst instead of a premixed solution. The fuel consumption was about 210 g/h at an average power output of 194 W. Assuming SFC as a linear function of power in the limited FC operational range (see
Supplementary Material), calculation using Equation (20) reveals a 53% increase in flight duration from 4.7 to 7.2 h with 90% water recuperation (for 1 kg fuel, as described in [
26]) and 60% from 4.7 to 7.5 h with recuperation and emission. Moreover, if the same system would store 4 kg of fuel out of a 11 kg maximal take-off weight, then the increase in cruise flight duration and, accordingly, the range would reach 100% (from 18 to 38 hours). That way, utilization of recuperated water along with byproducts emission reveals a great opportunity to develop long-range lightweight aircraft.
The actual amount of collected water in the experiments is relatively close (70–85%) to the expected amount of collected water calculated by the theoretical model (
Table 1). The differences between the experimental measurements and the theoretical estimations might be caused by the following factors.
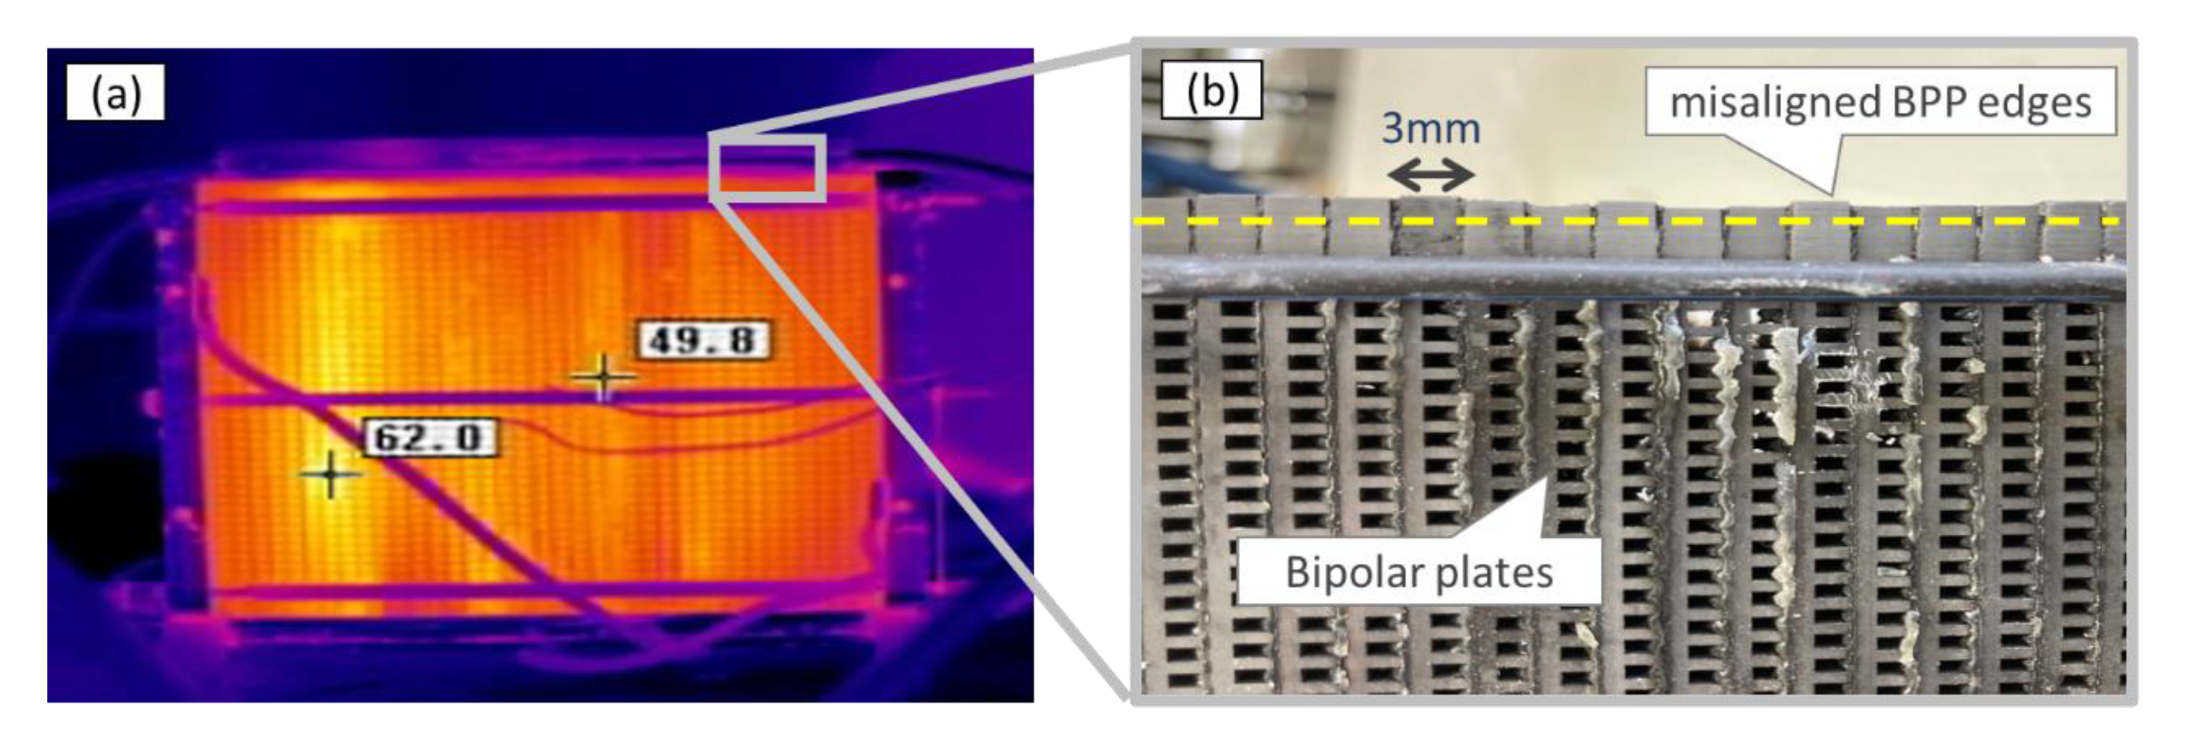
Despite the satisfying heat removal rate achieved by using the edge cooling method, inhomogeneous temperature distribution of the stack is revealed during operation (
Figure 10a) with differences of up to 12 °C. The stacks’ temperature was measured by a single k-type thermocouple placed where the highest temperatures were found by a thermal camera during cooling system testing without WRS (
Figure 10a). Moreover, during the experiments with the WRS, the temperatures measured inside the FC (using the thermocouple mounted inside the stack, shown in
Figure 5c) were lower than the temperatures measured for the stacks outflow (using the DHT, shown in
Figure 5c), indicating non-homogenous temperature distribution in the stack.
Most probably, this was caused by the stack’s edges unevenness. The height difference between two neighboring BPPs was up to 2 mm (
Figure 10b), which resulted in differences in heat removal rates for each BPP.
During experiments, we were able to reveal extra hydrogen consumption conjugated with FC heating even with no load applied. This indicates membrane damage: some hydrogen might flow through it and react with oxygen on the catalyst layer of the cathode side. Most probably, such damage is a result of the FC’s local overheating caused by the inhomogeneous temperature distribution. Such a reaction, however, also goes with water production. Therefore, the total theoretical amount of produced water was calculated using the measured hydrogen flow rate. A part of the hydrogen, however, might have left the system through the exhaust without reaction.
This combined issue of membrane overheating, and hydrogen leakage is expected to be solved by using FC stacks with flat edges, more accurate temperature control, and a better mixing between the ventilation and recirculating flow.
Another possible reason for the FC local overheating (hot spots) may be uneven oxygen distribution in the airflow entering the stack since the ventilation inlet was situated directly in front of the stack’s center (
Figure 5c). The partition wall utilized during the experiment was designed to improve flow mixing and make oxygen distribution more homogenous, but it is hard to estimate the efficiency of such a solution.
In addition, some insignificant water may be absorbed by the FC and released through the H
2 exhaust port. A part of the water that diffuses to the anode part of the MEA due to electro-osmosis [
27], saturated the H
2 inside the stack and left the system with the FC H
2 exhaust (the valve opened once in a minute for one second). The amount of this water was not measured, but it is expected to be much lower than the amount of recuperated water. For the actual onboard system, this water might be recuperated if the purged H
2 is released through the WRS exhaust.
Additional possible reasons for discrepancies from theory may include drainage system imperfection (i.e., part of the condensed water remained inside the WRS), possible leakage of humid air through the system’s wall without passing the heat exchanger, and some humid exhaust air left the system (through the heat exchanger) before cooling down to ambient temperature (it, however, was checked several times during each experiment by inserting the thermocouple to the heat exchanger).
Despite those limitations, a stable FC performance was observed inside a semi-closed system in all the examined cases (
Figure 9), and the obtained experimental measurements for water recuperation are in fair agreement with the theoretical calculations (
Table 1).
Additional cooling of circulating air by the aluminum foil walls (
Figure 5a) assisted in preventing over-humidifying of the MEAs in the stack. The condensation process was stable and water dripping was observed from all the parts of the system. Drainage might be improved by applying hydrophobic–hydrophilic patterns to the inner walls of the system [
28,
29].
The obtained theoretical energy density of the fuel in the experiments with worst-case conditions reached GHSC > 5.5 wt% (
Table 1). When high altitudes are considered with lower ambient temperatures and with product emission, these values are expected to become even more significant (
Figure 2) with up to GHSC = 6.8 wt% for stored fuel. In addition to that, the emission of reaction products will further increase overall efficiency, depending on the relative weight of the fuel in the aircraft.


