
Valorization of Dairy By-Products: Efficiency of Energy Production from Biogas Obtained in Anaerobic Digestion of Ultrafiltration Permeates


Abstract
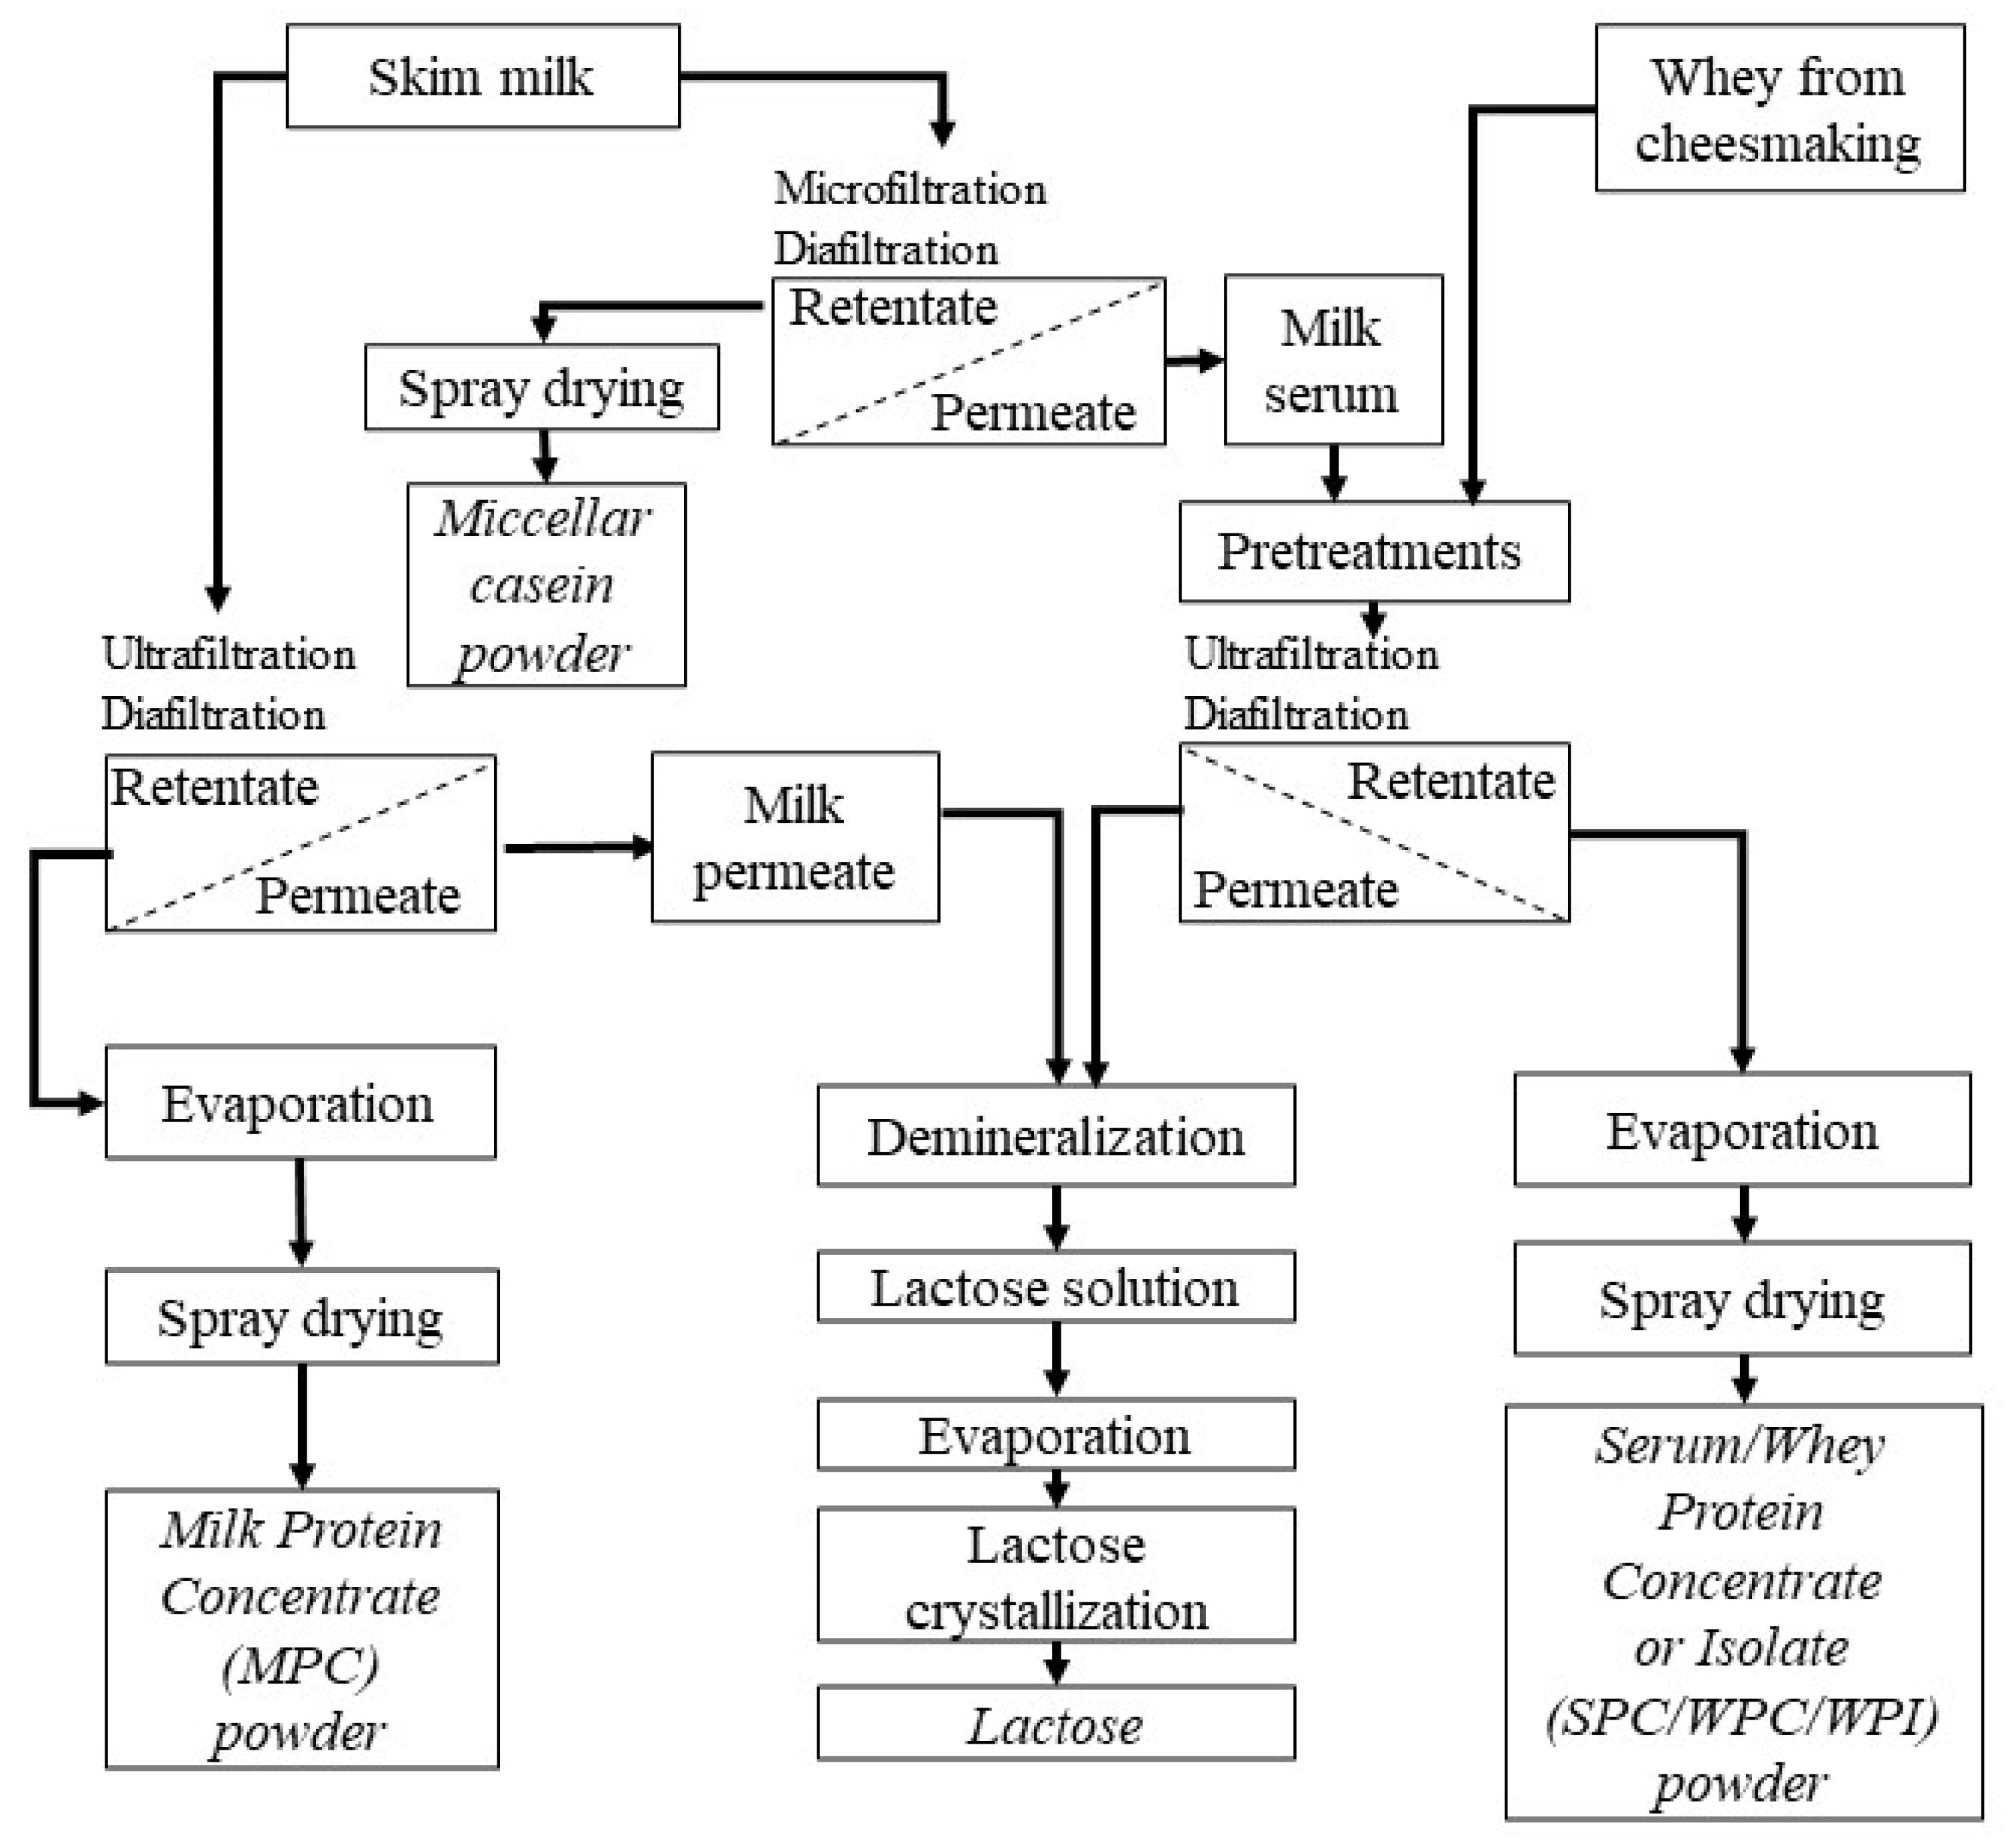
1. Introduction
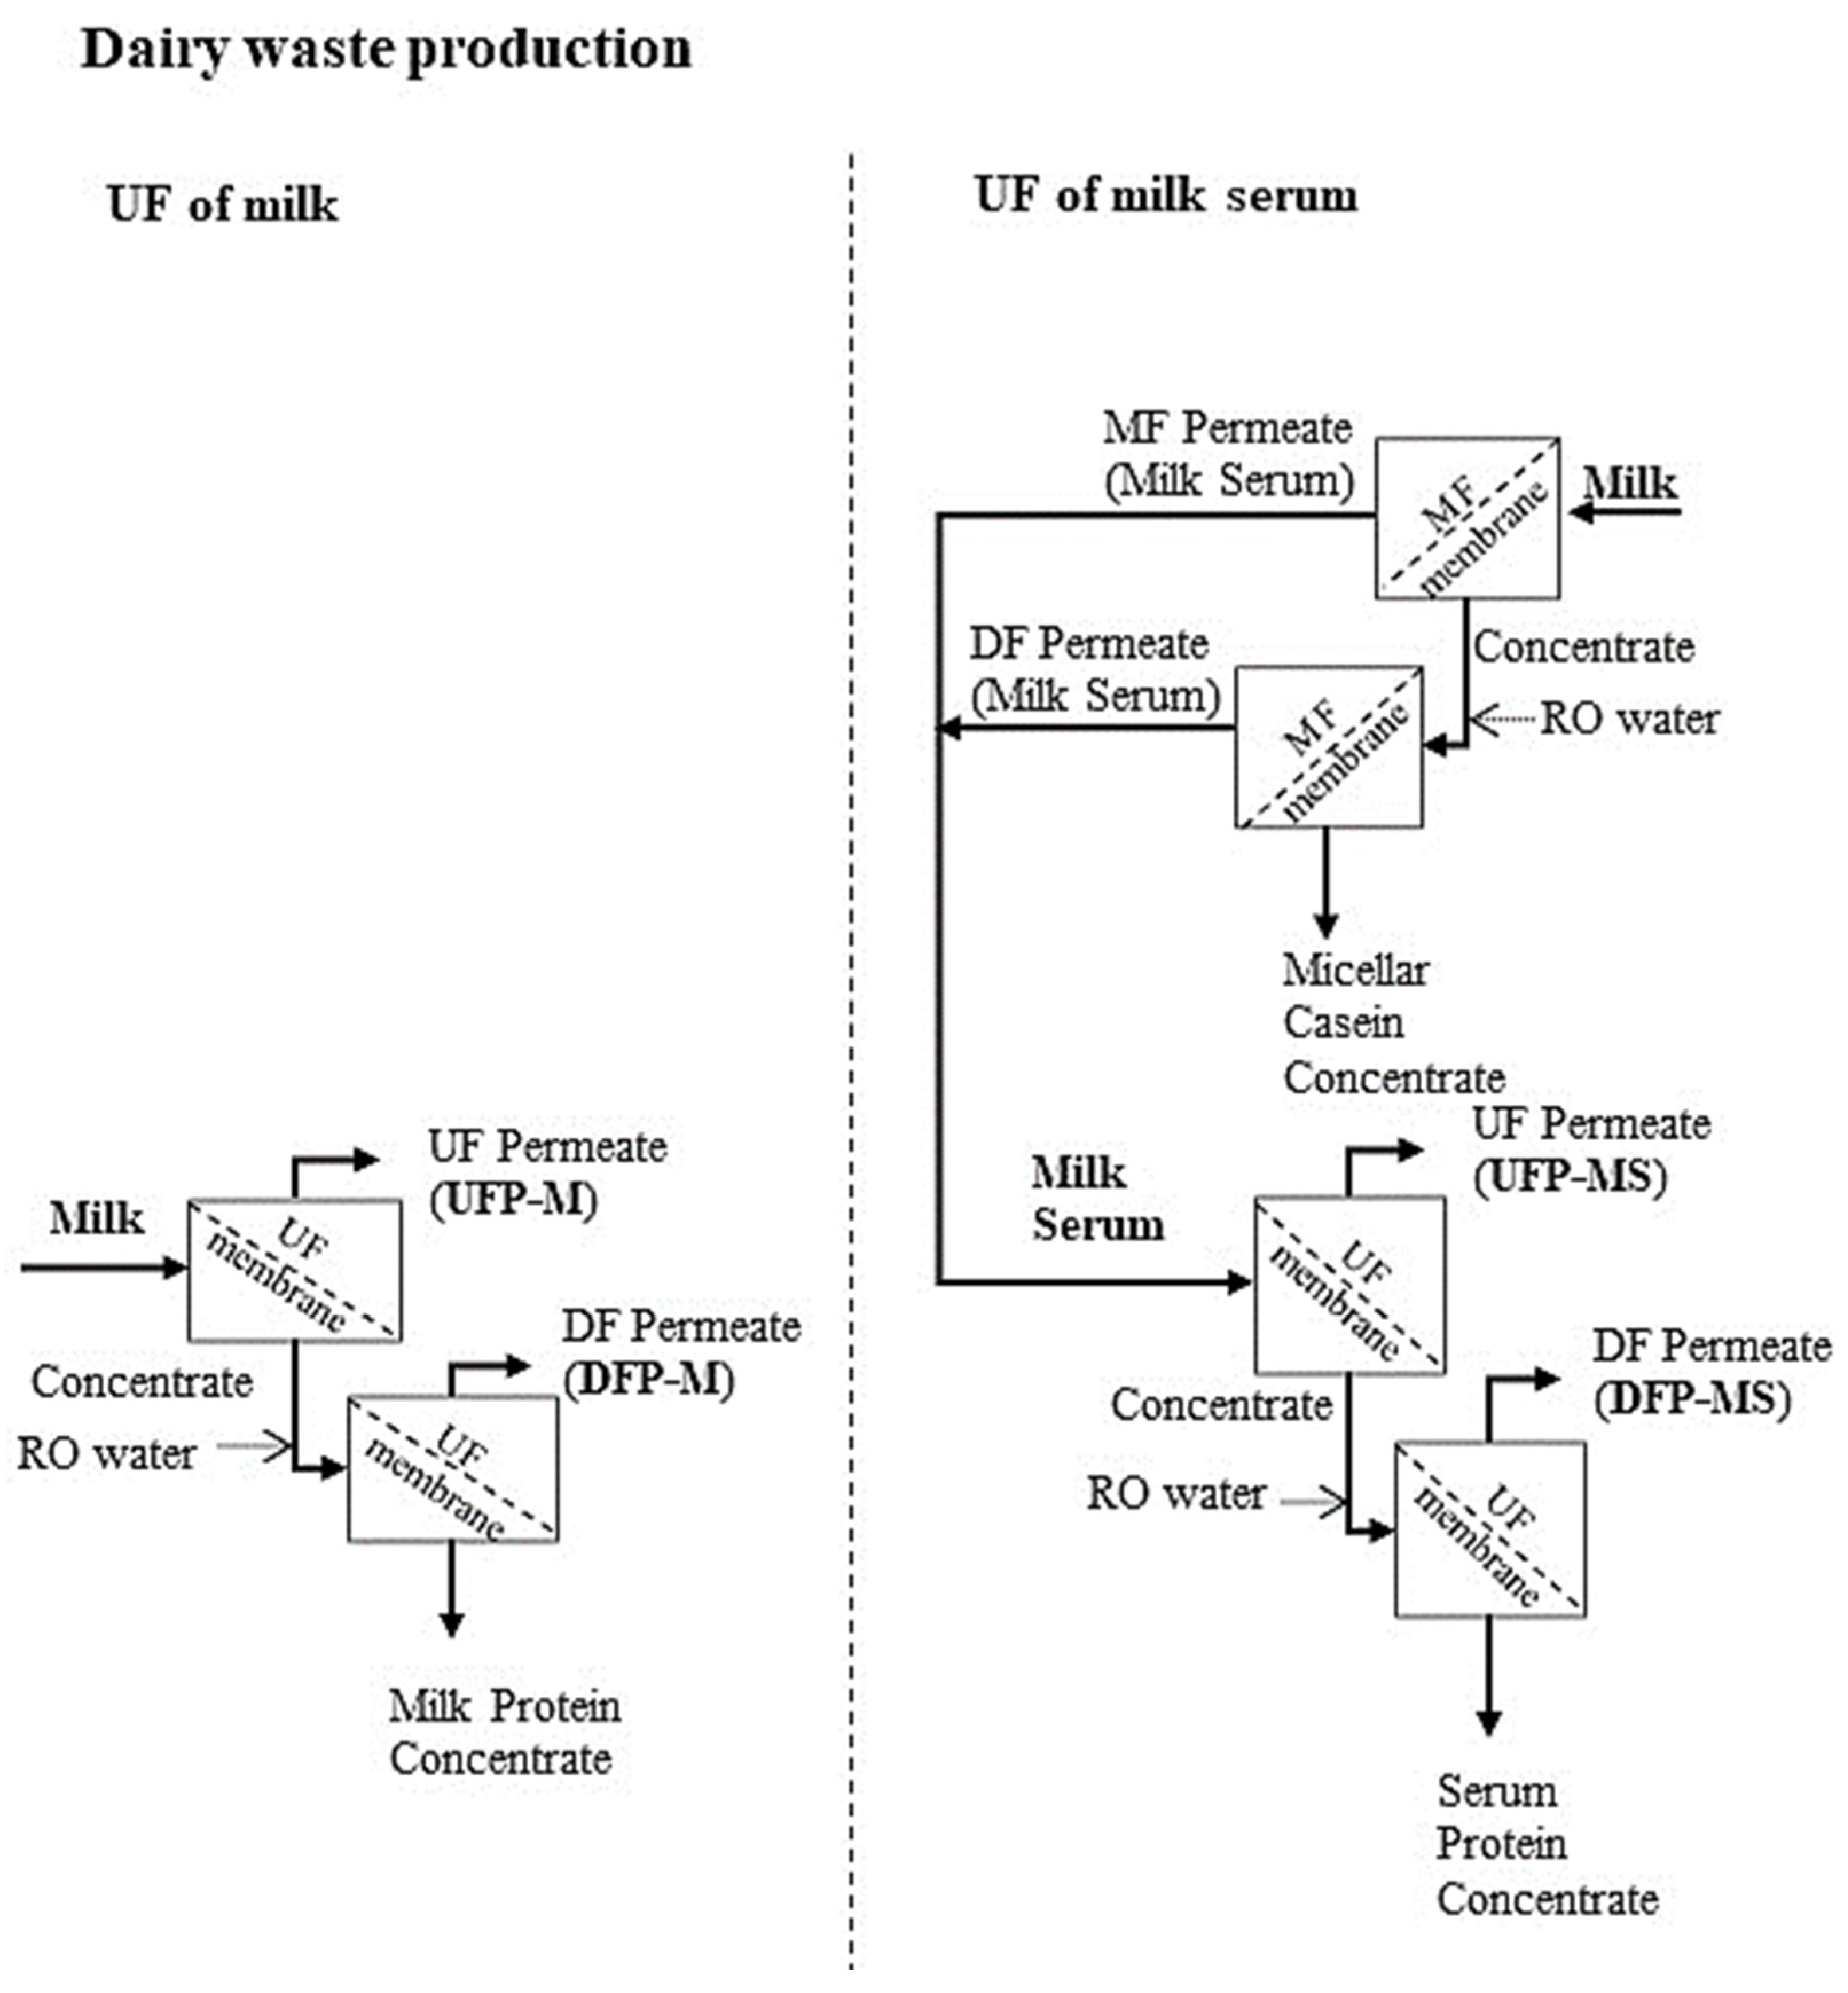
2. Materials and Methods
2.1. Materials
2.2. Analysis of Physicochemical Parameters
2.3. Biogas Efficiency Research
2.4. Kinetic Analysis
2.5. Energetic Calculations
2.6. Case Study
2.7. Statistical Analysis
3. Results and Discussion
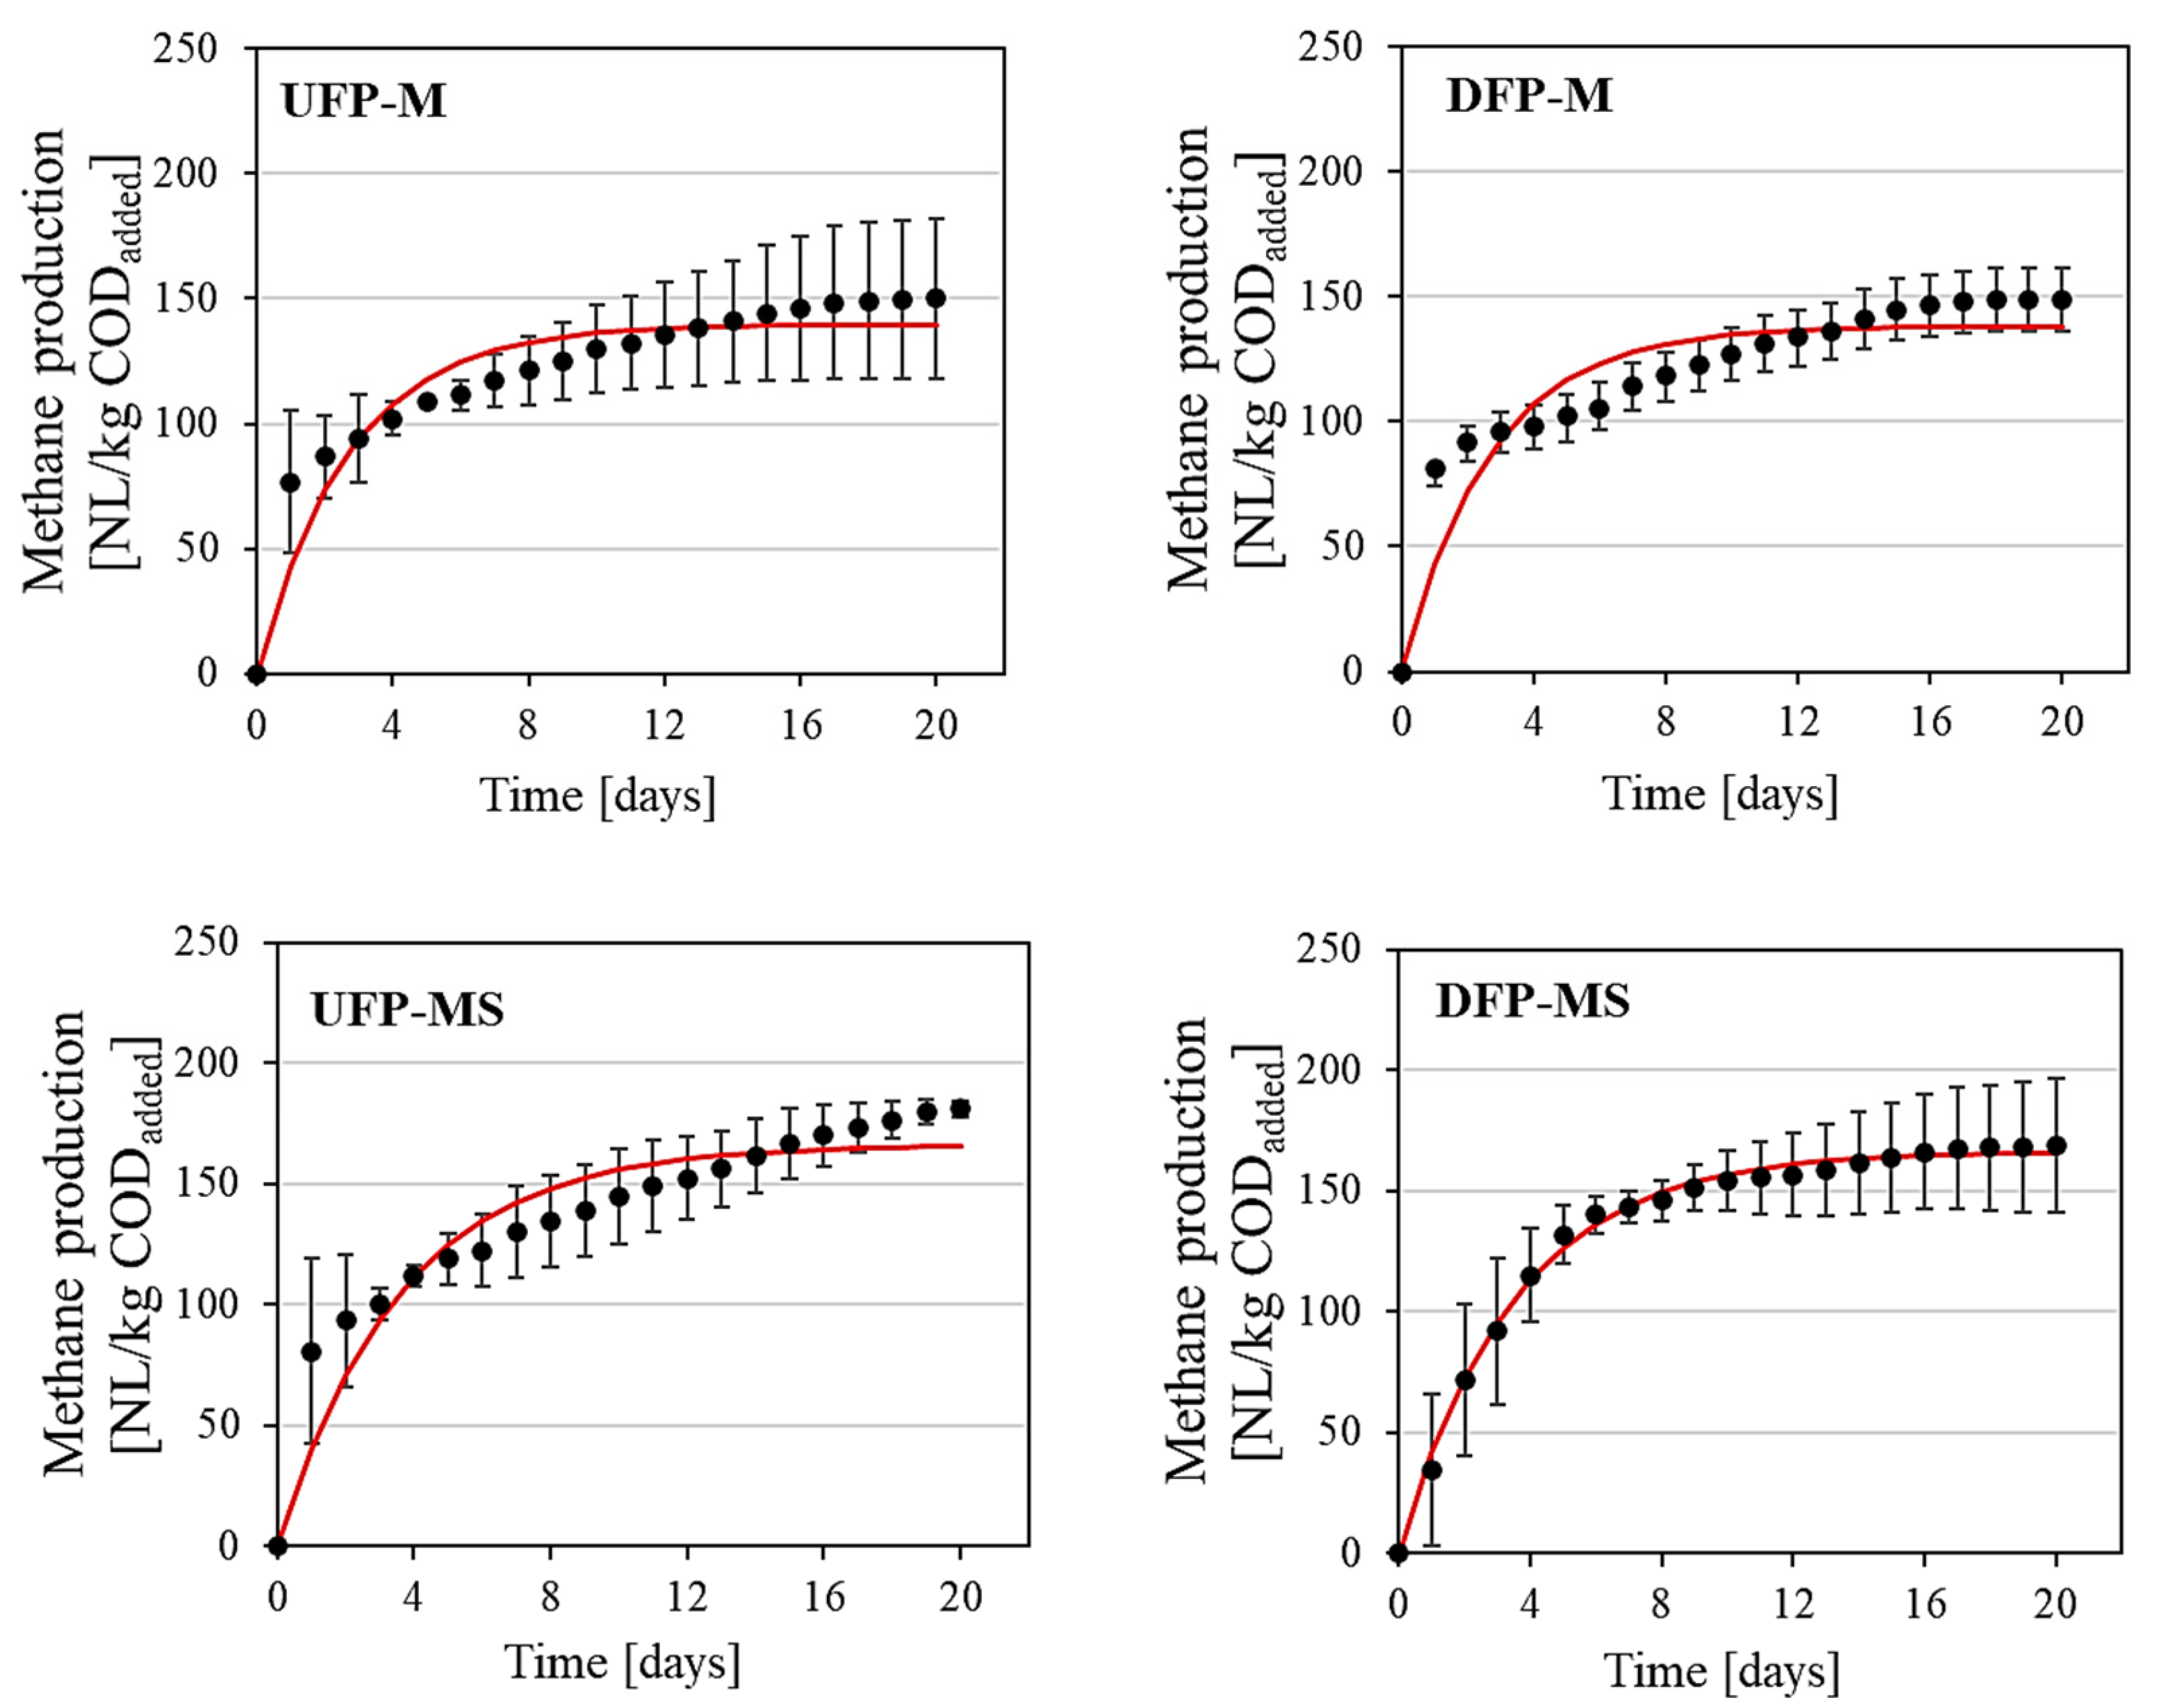
3.1. Analysis of Methane Production
3.2. Kinetic Analysis
3.3. Energy Analysis

| Parameter | Unit | UFP-M | DFP-M | UFP-MS | DFP-MS |
|---|---|---|---|---|---|
| Daily consumption of raw milk | t/d | 1200 | - | - | - |
| Daily consumption of milk serum/whey | t/d | - | - | 800 | - |
| Biomethane production | |||||
| Daily generated permeate | t/d | 864 | 864 | 706 | 706 |
| Annually generated permeate | t/a | 315,360 | 315,360 | 257,690 | 257,690 |
| Dairy OLR (COD) | kg O2/L | 0.057 | 0.019 | 0.039 | 0.008 |
| Total yearly OLR (COD) | kg O2/a | 17,975,520 | 5,991,840 | 10,049,910 | 2,061,520 |
| Methane efficiency | Nm3/kg COD | 0.150 | 0.149 | 0.181 | 0.169 |
| Methane production | m3/a | 2,696,328 | 892,784 | 1,819,033 | 348,397 |
| Annual electric energy | MWh/a | 10,632 | 3520 | 7173 | 1374 |
| Daily electric energy | MWh/d | 29.1 | 9.6 | 19.7 | 3.8 |
| Heat | GJ/a | 40,055 | 13,263 | 27,022 | 5176 |
| Electric power | MW | 1.3 | 0.4 | 0.9 | 0.2 |
| Electric power price 1 | EUR/MWh | 96.50 | |||
| Heat price 2 | EUR/GJ | 8.77 | |||
| Electric power value | EUR/a | 1,025,988 | 339,680 | 692,195 | 132,591 |
| Heat value | EUR/a | 351,282 | 116,317 | 236,983 | 45,390 |
| Total electric power value | EUR/a | 2,190,454 | |||
| Total heat value | EUR/a | 749,972 | |||
| Lactose powder production (edible; non-pharmaceutical range) | |||||
| Yearly production 3 | t/a | 10,971 | 3532 | 6083 | 1387 |
| Lactose powder price 4 | EUR/t | 899 | |||
| Lactose powder value | EUR/a | 9,862,929 | 3,175,268 | 5,468,617 | 1,246,913 |
| Total lactose value | EUR/a | 19,753,727 | |||
4. Conclusions
Author Contributions
Funding
Data Availability Statement
Acknowledgments
Conflicts of Interest
References
- Usmani, Z.; Sharma, M.; Gaffey, J.; Sharma, M.; Dewhurst, R.J.; Moreau, B.; Newbold, J.; Clark, W.; Thakur, V.K.; Gupta, V.K. Valorization of Dairy Waste and By-Products through Microbial Bioprocesses. Bioresour. Technol. 2022, 346, 126444. [Google Scholar] [CrossRef] [PubMed]
- Chokshi, K.; Pancha, I.; Ghosh, A.; Mishra, S. Microalgal Biomass Generation by Phycoremediation of Dairy Industry Wastewater: An Integrated Approach towards Sustainable Biofuel Production. Bioresour. Technol. 2016, 221, 455–460. [Google Scholar] [CrossRef] [PubMed]
- Mahboubi, A.; Ferreira, J.A.; Taherzadeh, M.J.; Lennartsson, P.R. Value-Added Products from Dairy Waste Using Edible Fungi. Waste Manag. 2017, 59, 518–525. [Google Scholar] [CrossRef]
- Wang, S.; Rao, N.C.; Qiu, R.; Moletta, R. Performance and Kinetic Evaluation of Anaerobic Moving Bed Biofilm Reactor for Treating Milk Permeate from Dairy Industry. Bioresour. Technol. 2009, 100, 5641–5647. [Google Scholar] [CrossRef] [PubMed]
- Lee, E.K.; Koros, W.J. Membranes, Synthetic, Applications. In Encyclopedia of Physical Science and Technology; Academic Press: Cambridge, MA, USA, 2003; pp. 279–344. [Google Scholar] [CrossRef]
- Lipnizki, F. Membrane Processes for the Production of Bulk Fermentation Products. Membr. Technol. 2010, 121–153. [Google Scholar] [CrossRef]
- Chamberland, J.; Bouyer, A.; Benoit, S.; Provault, C.; Bérubé, A.; Doyen, A.; Pouliot, Y. Efficiency Assessment of Water Reclamation Processes in Milk Protein Concentrate Manufacturing Plants: A Predictive Analysis. J. Food Eng. 2020, 272, 109811. [Google Scholar] [CrossRef]
- Tomasula, P.M.; Bonnaillie, L.M. Crossflow Microfiltration in the Dairy Industry. In Emerging Dairy Processing Technologies; Wiley: Hoboken, NJ, USA, 2015; pp. 1–32. ISBN 9781118560471. [Google Scholar]
- Çınar, K. Membrane Filtration of Milk: Separation and Fractionation of Milk Proteins. J. Innov. Sci. Eng. 2022, 6, 61–75. [Google Scholar] [CrossRef]
- Bella, K.; Rao, P.V. Anaerobic Digestion of Dairy Wastewater: Effect of Different Parameters and Co-Digestion Options—A Review. Biomass Convers. Biorefin. 2021. [Google Scholar] [CrossRef]
- Marella, C.; Salunke, P.; Biswas, A.C.; Kommineni, A.; Metzger, L.E. Manufacture of Modified Milk Protein Concentrate Utilizing Injection of Carbon Dioxide. J. Dairy Sci. 2015, 98, 3577–3589. [Google Scholar] [CrossRef]
- Barbano, D.M.; Sciancalepore, V.; Rudan, M.A. Characterization of Milk Proteins in Ultrafiltration Permeate. J. Dairy Sci. 1988, 71, 2655–2657. [Google Scholar] [CrossRef]
- Global Whey Protein (Powder & Concentrate) Market Study 2019–2024-ResearchAndMarkets.Com. available online: https://www.Businesswire.Com/News/Home/20190417005321/En/Global-Whey-Protein-Powder-Concentrate-Market-Study-2019-2024---ResearchAndMarkets.Com (accessed on 16 September 2020).
- Milk Protein Concentrate (MPC) Market 2020: Global Industry Analysis by Top Countries Data with Size, Share, Segments, Drivers and Growth Insights to 2026. available online: https://www.Marketwatch.Com/Press-Release/Milk-Protein-Concentrate-Mpc-Market-2020-Global-Industry-Analysis-by-Top-Countries-Data-with-Size-Share-Segments-Drivers-Andgrowth-Insights-to-2026-2020-09-01 (accessed on 4 September 2020).
- Kravtsov, V.A.; Kulikova, I.K.; Anisimov, G.S.; Evdokimov, I.A.; Khramtsov, A.G. Variety of Dairy Ultrafiltration Permeates and Their Purification in Lactose Production Variety of Dairy Ultrafiltration Permeates and Their Purification in Lactose Production. IOP Conf. Ser. Earth Environ. Sci. 2021, 677, 32001. [Google Scholar] [CrossRef]
- Ghaly, A.E.; Ben-Hassan, R.M. Continuous Production of Biogas from Dairy Manure Using an Innovative No-Mix Reactor. Appl. Biochem. Biotechnol. 1989, 20–21, 541–559. [Google Scholar] [CrossRef]
- Parsons, R.A. On-Farm Biogas Production. In North-East Agricultural Engineering Service; Cornell University: Ithaca, NY, USA, 1984. [Google Scholar]
- Kugleman, I.J.; Jerri, J.S. Anaerobic Digestion. In Sludge Treatment; Eckenfelder, W.W., Jr., Santhanan, C.J., Eds.; Mercel Dekker: New York, NY, USA, 1981. [Google Scholar]
- Dębowski, M.; Korzeniewska, E.; Kazimierowicz, J.; Zieliński, M. Efficiency of Sweet Whey Fermentation with Psychrophilic Methanogens. Environ. Sci. Pollut. Res. 2021, 28, 49314–49323. [Google Scholar] [CrossRef] [PubMed]
- Kozłowski, K.; Pietrzykowski, M.; Czekała, W.; Dach, J.; Kowalczyk-Juśko, A.; Jóźwiakowski, K.; Brzoski, M. Energetic and Economic Analysis of Biogas Plant with Using the Dairy Industry Waste. Energy 2019, 183, 1023–1031. [Google Scholar] [CrossRef]
- Rugele, K.; Mezule, L.; Dalecka, B.; Larsson, S.; Vanags, J.; Rubulis, J. Application of Fluorescent in Situ Hybridisation for Monitoring Methanogenic Archaea in Acid Whey Anaerobic Digestion. Agron. Res. 2013, 11, 373–380. [Google Scholar]
- Saddoud, A.; Hassaïri, I.; Sayadi, S. Anaerobic Membrane Reactor with Phase Separation for the Treatment of Cheese Whey. Bioresour. Technol. 2007, 98, 2102–2108. [Google Scholar] [CrossRef]
- Ghaly, A.E. A Comparative Study of Anaerobic Digestion of Acid Cheese Whey and Dairy Manure in a Two-Stage Reactor. Bioresour. Technol. 1996, 58, 61–72. [Google Scholar] [CrossRef]
- Mah, R.A. Interaction of Methanogens and Non-Methanogens in Microbial Ecology. In Proceedings of the Third International Symposium on Anaerobic Digestion, Boston, MA, USA, 14–19 August 1983; pp. 11–22. [Google Scholar]
- Ghaly, A.E.; Pyke, J.B. Amelioration of Meth- Ane Yield in Cheese Whey by Controlling the PH of the Methanogenic Stage. Appl. Biochem. Biotechnol. J. 1991, 27, 217–237. [Google Scholar] [CrossRef]
- Yan, J.Q.; Lo, K.V.; Liao, P.H. Anaerobic Digestion of Cheese Whey Using Upflow Anaerobic Sludge-Blanket Reactor. Biol. Wastes 1989, 27, 289–305. [Google Scholar] [CrossRef]
- Clanton, C.J.; Backus, B.D.; Goodrich, P.R.; Fox, E.J.; Morris, H.A. Anaerobic Digestion of Cheese Whey. In Proceedings of the 1987 Food Processing Waste Conference, Atlanta, Georgia, 1–2 September 1987. [Google Scholar]
- Lo, K.V.; Liao, P.H. Digestion of Cheese Whey with Anaerobic Rotating Biological Contact Reactor. Biomass 1986, 10, 243–252. [Google Scholar] [CrossRef]
- Wolfe, R.S. Fermentation and Anaerobic Respira-Tion in Anaerobic Digestion. In Proceedings of the Third International Symposium on Anaerobic Digestion, Boston, MA, USA, 14–19 August 1983; pp. 3–10. [Google Scholar]
- Pugliese, A.; Bidini, G.; Fantozzi, F. Anaerobic Digestion of Macrophytes Algae for Eutrophication Mitigation and Biogas Production. Energy Procedia 2015, 82, 366–373. [Google Scholar] [CrossRef]
- Barua, V.B.; Kalamdhad, A.S. Biochemical Methane Potential Test of Untreated and Hot Air Oven Pretreated Water Hyacinth: A Comparative Study. J. Clean. Prod. 2017, 166, 273–284. [Google Scholar] [CrossRef]
- Kafle, G.K.; Kim, S.H. Anaerobic Treatment of Apple Waste with Swine Manure for Biogas Production: Batch and Continuous Operation. Appl. Energy 2013, 103, 61–72. [Google Scholar] [CrossRef]
- Mainardis, M.; Flaibani, S.; Trigatti, M.; Goi, D. Techno-Economic Feasibility of Anaerobic Digestion of Cheese Whey in Small Italian Dairies and Effect of Ultrasound Pre-Treatment on Methane Yield. J. Environ. Manag. 2019, 246, 557–563. [Google Scholar] [CrossRef]
- Ratanatamskul, C.; Onnum, G.; Yamamoto, K. A Prototype Single-Stage Anaerobic Digester for Co-Digestion of Food Waste and Sewage Sludge from High-Rise Building for on-Site Biogas Production. Int. Biodeterior. Biodegrad. 2014, 95, 176–180. [Google Scholar] [CrossRef]
- Pochwatka, P.; Kowalczyk-Juśko, A.; Sołowiej, P.; Wawrzyniak, A.; Dach, J. Biogas Plant Exploitation in a Middle-Sized Dairy Farm in Poland: Energetic and Economic Aspects. Energies 2020, 13, 6058. [Google Scholar] [CrossRef]
- RED, I. Renewable Energy—Recast to 2030 (RED II) EU Science Hub. 2013. Available online: https://Ec.Europa.Eu/Jrc/En/Jec/Renewable-Energy-Recast-2030-Red-Ii (accessed on 10 October 2020).
- Kozłowski, K.; Dach, J.; Lewicki, A.; Cieślik, M.; Czekała, W.; Janczak, D. ENVIRONMENTAL AND PROCESS PARAMETERS OF METHANE FERMENTATION IN CONTINUOSLY STIRRED TANK REACTOR (CSTR). Inżynieria Ekol. 2016, 50, 153–160. [Google Scholar] [CrossRef][Green Version]
- Luo, T.; Khoshnevisan, B.; Huang, R.; Chen, Q.; Mei, Z.; Pan, J.; Liu, H. Analysis of Revolution in Decentralized Biogas Facilities Caused by Transition in Chinese Rural Areas. Renew. Sustain. Energy Rev. 2020, 133, 110133. [Google Scholar] [CrossRef]
- Garcia, N.H.; Mattioli, A.; Gil, A.; Frison, N.; Battista, F.; Bolzonella, D. Evaluation of the Methane Potential of Different Agricultural and Food Processing Substrates for Improved Biogas Production in Rural Areas. Renew. Sustain. Energy Rev. 2019, 112, 1–10. [Google Scholar] [CrossRef]
- Zemo, K.H.; Panduro, T.E.; Termansen, M. Impact of Biogas Plants on Rural Residential Property Values and Implications for Local Acceptance. Energy Policy 2019, 129, 1121–1131. [Google Scholar] [CrossRef]
- Michalska, K.; Pazera, A.; Bizukojć, M. Innowacje dla branży mleczarskiej—Biogazownie przyzakładowe (Innovations for the dairy industry—Biogas compounds). Acta Innov. 2013, 9. [Google Scholar]
- Dȩbowski, M.; Kisielewska, M.; Kazimierowicz, J.; Rudnicka, A.; Dudek, M.; Romanowska-Duda, Z.; Zielínski, M. The Effects of Microalgae Biomass Co-Substrate on Biogas Production from the Common Agricultural Biogas Plants Feedstock. Energies 2020, 13, 2186. [Google Scholar] [CrossRef]
- Llabrés-Luengo, P.; Mata-Alvarez, J. Kinetic Study of the Anaerobic Digestion of Straw-Pig Manure Mixtures. Biomass 1987, 14, 129–142. [Google Scholar] [CrossRef]
- Cieślik, M.; Dach, J.; Lewicki, A.; Smurzyńska, A.; Janczak, D.; Pawlicka-Kaczorowska, J.; Boniecki, P.; Cyplik, P.; Czekała, I.; Jóźwiakowski, K. Methane Fermentation of the Maize Straw Silage under Meso- and Thermophilic Conditions. Energy 2016, 115, 1495–1502. [Google Scholar] [CrossRef]
- Bylund, G. Mleczarstwo Technika i Technologia; Tetra Pak: Warszawa, Poland, 2013. [Google Scholar]
- Gavazzi-April, C.; Benoit, S.; Doyen, A.; Britten, M.; Pouliot, Y. Preparation of milk protein concentrates by ultrafiltration and continuous diafiltration: Effect of process design on overall efficiency. J. Dairy Sci. 2018, 101, 9670–9679. [Google Scholar] [CrossRef] [PubMed]
- Ahmad, T.; Aadil, R.M.; Ahmed, H.; Rahman, U.U.; Soares, B.C.V.; Souza, S.L.Q.; Pimentel, T.C.; Scudino, H.; Guimarães, J.T.; Esmerino, E.A.; et al. Treatment and Utilization of Dairy Industrial Waste: A Review. Trends Food Sci. Technol. 2019, 88, 361–372. [Google Scholar] [CrossRef]
- Fernández, C.; Cuetos, M.J.; Martínez, E.J.; Gómez, X. Thermophilic Anaerobic Digestion of Cheese Whey: Coupling H2 and CH4 Production. Biomass Bioenergy 2015, 81, 55–62. [Google Scholar] [CrossRef]
- Kisielewska, M.; Wysocka, I.; Rynkiewicz, M.R. Continuous Biohydrogen and Biomethane Production from Whey Permeate in a Two-Stage Fermentation Process. Environ. Prog. Sustain. Energy 2014, 33, 1411–1418. [Google Scholar] [CrossRef]
- Comino, E.; Riggio, V.A.; Rosso, M. Biogas Production by Anaerobic Co-Digestion of Cattle Slurry and Cheese Whey. Bioresour. Technol. 2012, 114, 46–53. [Google Scholar] [CrossRef]
- Bolen, T.J.; Hasan, M.; Conway, T.; Yaméogo, D.D.S.; Sanchez, P.; Rahman, A.; Azam, H. Feasibility Assessment of Biogas Production from the Anaerobic Co-Digestion of Cheese Whey, Grease Interceptor Waste and Pulped Food Waste for WRRF. Energy 2022, 254, 124144. [Google Scholar] [CrossRef]
- Mata-Alvarez, J.; Dosta, J.; Romero-Güiza, M.S.; Fonoll, X.; Peces, M.; Astals, S. A Critical Review on Anaerobic Co-Digestion Achievements between 2010 and 2013. Renew. Sustain. Energy Rev. 2014, 36, 412–427. [Google Scholar] [CrossRef]
- Durham, R.J. Modern Approaches to Lactose Production. In Dairy-Derived Ingredients Food Nutraceutical Uses; Woodhead Publishing Limited: Cambridge, UK, 2009; pp. 103–144. [Google Scholar] [CrossRef]
- da Silva, A.N.; Perez, R.; Minim, V.P.R.; Martins, D.D.S.A.; Minim, L.A. Integrated Production of Whey Protein Concentrate and Lactose Derivatives: What Is the Best Combination? Food Res. Int. 2015, 73, 62–74. [Google Scholar] [CrossRef]
- Energy Regulatory Office. Reference Prices in 2021. Available online: https://Www.Ure.Gov.Pl/Pl/Oze/Aukcje-Oze/Ceny-Referencyjne/6539,Ceny-Referencyjne.Html (accessed on 17 July 2022).
- Weekly Prices of Lactose. Available online: https://Www.Clal.It/En/Index.Php?Section=lattosio (accessed on 17 July 2022).
- European Commission Bioeconomy Strategy. A Sustainable Bioeconomy for Europe: Strengthening the Connection between Economy, Society and the Environment; European Commission: Brussels, Belgium, 2018. Available online: https://Ec.Europa.Eu/Research/Bioeconomy/Pdf/Ec_bioeconomy_strategy_2018.Pdf (accessed on 25 February 2020).
- Available online: https://Www.Gramwzielone.Pl/Bioenergia/2795/Ile-Kosztuje-Budowa-Biogazowni-i-Kiedy-Sie-Zwroci (accessed on 6 September 2022).


| Trait | Anaerobic Sludge |
|---|---|
| TS [%] | 6.8 ± 0.2 |
| VS [% TS] | 73.5 ± 0.9 |
| Ash [% TS] | 26.5 ± 0.9 |
| C [% TS] | 41.1 ± 0.8 |
| N [% TS] | 3.7 ± 0.0 |
| C/N ratio | 11.2 ± 0.2 |
| Parameter | Substrate | |||
|---|---|---|---|---|
| UFP-M | DFP-M | UFP-MS | DFP-MS | |
| TS [%] | 5.60 a ± 0.06 | 1.81 c ± 0.05 | 3.8 b ± 0.02 | 0.86 d ± 0.09 |
| VS [%] | 5.13 a ± 0.06 | 1.65 a,b ± 0.08 | 3.46 b ± 0.07 | 0.79 a,b ± 0.03 |
| Ash [%] | 0.45 a ± 0.01 | 0.15 c ± 0.01 | 0.332 b ± 0.004 | 0.07 d ± 0.01 |
| Ca [mg/L] | 185.5 a ± 9.6 | 34.8 c ± 2.0 | 54.4 b ± 2.1 | 3.6 d ± 0.1 |
| TN [%] | 0.18 a ± 0.03 | 0.06 c ± 0.01 | 0.097 b ± 0.003 | 0.021 d ± 0.002 |
| Lactose [%] | 4.97 a ± 0.02 | 1.59 c ± 0.18 | 3.37 b ± 0.02 | 0.76 d ± 0.01 |
| pH | 6.55 b ± 0.18 | 6.84 c ± 0.10 | 6.84 c ± 0.04 | 7.03 a ± 0.06 |
| COD [mg O2/L] | 57,020 a ± 510 | 19,150 c ± 1500 | 38,600 b ± 780 | 7610 d ± 430 |
| Trait | COD | VS | Ash | Ca | TN | Lactose | pH | TS | CH4 Production |
|---|---|---|---|---|---|---|---|---|---|
| COD | 1.00 | ||||||||
| VS | 0.11 | 1.00 | |||||||
| Ash | 1.00 * | 0.05 | 1.00 | ||||||
| Ca | 0.93 * | 0.30 | 0.90 * | 1.00 | |||||
| TN | 0.97 * | 0.23 | 0.95 * | 0.98 * | 1.00 | ||||
| Lactose | 1.00 * | 0.10 | 1.00 * | 0.93 * | 0.97 * | 1.00 | |||
| pH | −0.87 * | −0.34 | −0.84 * | −0.94 * | −0.94 * | −0.87 * | 1.00 | ||
| TS | 1.00 * | 0.11 | 1.00 * | 0.93 * | 0.97 * | 1.00 * | −0.87 * | 1.00 | |
| CH4 production | −0.08 | 0.06 | −0.06 | −0.17 | −0.15 | −0.07 | 0.32 | −0.07 | 1.00 |
| Variant | Methane Yield [NL/kg CODadded] | Methane Production Rate [NL/kg COD/d] | k [1/d] | R2 |
|---|---|---|---|---|
| UFP-M | 150 a ± 32 | 52 | 0.37 a | 0.91 |
| DFP-M | 149 a ± 13 | 51 | 0.37 a | 0.87 |
| UFP-MS | 181 a ± 3 | 46 | 0.28 a | 0.91 |
| DFP-MS | 169 a ± 28 | 48 | 0.29 a | 0.99 |
| Variant | CH4 [%] | CO2 [%] |
|---|---|---|
| UFP-M | 69.39 a | 30.61 a |
| DFP-M | 69.23 a | 30.77 a |
| UFP-MS | 68.82 a | 31.18 a |
| DFP-MS | 69.29 a | 30.71 a |
Publisher’s Note: MDPI stays neutral with regard to jurisdictional claims in published maps and institutional affiliations. |
© 2022 by the authors. Licensee MDPI, Basel, Switzerland. This article is an open access article distributed under the terms and conditions of the Creative Commons Attribution (CC BY) license (https://creativecommons.org/licenses/by/4.0/).
Share and Cite
Tarapata, J.; Zieliński, M.; Zulewska, J. Valorization of Dairy By-Products: Efficiency of Energy Production from Biogas Obtained in Anaerobic Digestion of Ultrafiltration Permeates. Energies 2022, 15, 6829. https://doi.org/10.3390/en15186829
Tarapata J, Zieliński M, Zulewska J. Valorization of Dairy By-Products: Efficiency of Energy Production from Biogas Obtained in Anaerobic Digestion of Ultrafiltration Permeates. Energies. 2022; 15(18):6829. https://doi.org/10.3390/en15186829
Chicago/Turabian StyleTarapata, Justyna, Marcin Zieliński, and Justyna Zulewska. 2022. "Valorization of Dairy By-Products: Efficiency of Energy Production from Biogas Obtained in Anaerobic Digestion of Ultrafiltration Permeates" Energies 15, no. 18: 6829. https://doi.org/10.3390/en15186829
APA StyleTarapata, J., Zieliński, M., & Zulewska, J. (2022). Valorization of Dairy By-Products: Efficiency of Energy Production from Biogas Obtained in Anaerobic Digestion of Ultrafiltration Permeates. Energies, 15(18), 6829. https://doi.org/10.3390/en15186829