Article

Evaluation of OKRA (Abelmoschus esculentus) Macromolecular Solution for Enhanced Oil Recovery in Kazakhstan Carbonate Reservoir

by
Azza Hashim Abbas
1,*,
Obinna Markraphael Ajunwa
2,
Birzhan Mazhit
1,
Dmitriy A. Martyushev
3,*,
Kamel Fahmi Bou-Hamdan
4 and
Ramzi A. Abd Alsaheb
5
1
School of Mining and Geosciences, Nazarbayev University, Nur-Sultan 010000, Kazakhstan
2
Biofilm Research Laboratory, Department of Chemical and Materials Engineering, Nazarbayev University, Nur-Sultan 010000, Kazakhstan
3
Department of Oil and Gas Technologies, Perm National Research Polytechnic University, 614990 Perm, Russia
4
Chemical & Petroleum Engineering Department, Beirut Arab University, Debbieh 01270, Lebanon
5
Al-Khwarizmi College of Engineering, University of Baghdad, Baghdad 10001, Iraq
*
Authors to whom correspondence should be addressed.
Energies 2022, 15(18), 6827; https://doi.org/10.3390/en15186827
Submission received: 25 July 2022 / Revised: 12 September 2022 / Accepted: 15 September 2022 / Published: 18 September 2022
(This article belongs to the Special Issue Enhanced Oil Recovery (EOR) Methods)

Abstract

:
Natural polymers have been investigated as part of the endeavors of green chemistry practice in the oil field. However, natural polymer studies are still preliminary. The current study examines okra’s (natural polymer) efficiency for polymer flooding, particularly in Kazakhstan. The evaluation targets the heavy oil trapped in carbonate reservoirs. SEM and FTIR were used to characterize morphology and chemical composition. A rheology study was conducted under different shear rates for three plausible concentrations: 1 wt.%, 2 wt.% and 5 wt.%. The core flooding was challenged by the low porosity and permeability of the core. The results showed that okra’s size is between 150–900 μm. The morphology can be described by rod-like structures with pores and staking as sheet structures. The FTIR confirmed that the solution contains a substantial amount of polysaccharides. During the rheology test, okra showed a proportional relationship between the concentration and viscosity increase, and an inversely proportional relationship with the shear rate. At reservoir temperature, the viscosity reduction was insignificant, which indicated good polymer stability. Okra showed shear-thinning behavior. It was fitted to the Ostwald–de Waele power-law model by a (90–99)% regression coefficient. The findings confirm okra’s pseudo-plasticity, and that it is proportional to the solution concentration. The incremental oil recovery was 7%. The flow was found to be restricted due to the mechanical entrapment resulting from the large molecule size and the low porosity–permeability of the system. This study proves that the dominating feature of natural polysaccharide derivatives is their applicability to moderate reservoir conditions. The current study is a positive attempt at natural polymer application in Kazakhstan and similar field conditions.

Graphical Abstract

1. Introduction

Crude oil is known as the most consumed non-renewable energy source. Oil production is declining and the energy demand is increasing [1]. Realistically, the need to produce more oil is associated with many difficulties. These problems are twofold: oil availability and technology limitation. The technological part has thrived through several transformation operations, such as new devices, the digitization of the wells and new fast software. However, the available oil suffers from several obstacles. In industry parlance, the lack of new discoveries is the oil peak. Even if the brown fields continue to produce at the same level, the exploitation projects’ operation costs and the trapped residual oil may not last for another decade. Therefore, a concentrated effort has been made to carry the industry burden [2].
By focusing on the available resources, it is necessary to introduce the oil fields’ life stages. When a green reservoir comes into production, the pressure is initially high, and the initial energy can deliver the hydrocarbons to the surface. Over the production period, the pressure declines and artificial lift techniques need to be used (e.g., down-hole pumps, gas lifts) [3]. A secondary phase occurs after the primary phase, mainly an artificial lift or pressure maintenance [4]. The most critical stage is when the residual oil is trapped and cannot be recovered by the previous means. This is when the last phase is needed, which is called tertiary recovery or enhanced oil recovery (EOR).
EOR operation aims to mobilize the trapped oil in the reservoir by improving the microscopic and macroscopic displacement efficiencies. This can be achieved by reducing oil viscosity, capillary forces and interfacial tension [5]. Among the known EOR methods is the chemical enhanced oil recovery (CEOR). The method is renowned for its high possible application in brown reservoirs [6,7,8]. CEOR is described as the injection of chemicals that do not exist in the reservoir with specific compatibility considerations. This procedure includes the injection of alkalines, surfactants and polymers or their combinations.
Polymer flooding involves injecting polymer until around 33–50% of the reservoir pore volume has been injected [9]. In order to drive the polymer slug, water flooding is required. It helps in creating a pressure force, so that the oil bank in front moves towards the production wells [10]. Technically, adding polymer to the injected water increases the water viscosity and decreases the water–oil mobility ratio. Therefore, it is usually applied when there is a high waterflood mobility ratio or a high reservoir heterogeneity. A combined advantage is gained since the polymer controls the flow conformance and suppresses the water channeling in highly heterogeneous reservoirs [11,12]. Numerous studies have discussed effective water permeability reduction in high permeability zones [13].
Generally, the implementation has improved the vertical and areal sweep efficiencies and provided higher oil recovery, but the complexity of the process is still there. By looking at the chemical flooding issues, it is clear that the problems are: technical, economic and environmental. Technically, polymers suffer under high temperatures due to their molecules breaking [14]. Some polymers have a short life-cycle and unpredictable adsorption–retention in their formation [15,16]. Complex rheology also affects the injectivity duration and flow behavior [17]. The economic aspect relies on the size of the field under consideration, the polymer concentration, the price of the polymer and the required equipment to inject the polymer [18,19]. For the environment, proper environmental assessment studies are needed on the ecosystem.
Polymers in chemical flooding have two types: synthetic polymers and biopolymers. For synthetic polymers, the most known type is polyacrylamides. The polyacrylamide’s influential properties are its hydrolysis and molecular weight. Hydrolysis is believed to improve the polyacrylamide function (HPAM). Its increasing molecular weight brings better viscosity at a low concentration [20]. However, it associates with flow obstacles. This is because the higher molecular weight implies a larger molecular size, thus, blocking the smaller pores [7,21]. These known principles have progressed over the past thirty years [22,23,24]. Their development focused on improving HPAM flow in heterogeneous reservoirs, low permeability, high temperature and salinity [25]. It also included enhanced HPAM, additives, nanotechnology and co-polymers [16,26,27,28].
The main advantages of biopolymers are the group’s high salinity and temperature tolerance. This tolerance is a direct result of their helical structure. Additionally, these polymers are environmentally friendly in both production and application. The most popular studied biopolymer is xanthan. Guar gum, wulan gum, cellulose, lignin and different polysaccharides were also found to be effective biopolymers. From a more exclusive view, the natural polymer sources found in okra, casava, Arabic gum, exudate gum and aqueous beans are interesting candidates. However, despite their reputed beneficial application, the biopolymers exhibit biological degradation in the presence of their formation’s indigenous bacteria. Another pitfall for biological degradation is the likely formational damage due to bio-plugging [24].
The literature reported that a mixture of Palm Bunch Ash, soya beans and okra were tested as a polymer (alkaline surfactant polymer, ASP) during Alkaline Polymer Flooding. The ASP was run across 24 sand packs. The resulting recovery was approximately between (7–45)%, which is very promising. However, the exact natural polymer contribution to the recovery was not clearly identified. At the University of Port Harcourt, Nigeria, a natural polymer of starch and ogbono was created to evaluate the expected recovery. The injection of a starch and ogbono mixture reduced the water cut and improved oil production. It is worth mentioning that the incremental oil recovery required low concentrations to reduce the mobility ratio reduction [29]. The study proved the conceptual mechanism; however, the wider application to the industry requires further exploration in terms of operational parameters for the reservoir condition. Researchers suggested using Arabic gum in 5000 ppm concentration as a primary polymer in ASP, resulting in 82% at the core scale and 83% on simulation. Despite the limited information about the details, the results seem promising. In another by-product trial, fly ash garnered attention as a polymer in addition to HPAM. The fly ash suffered from instability and precipitation at low concentrations. Some improvement was reported when the fly ash reached a concentration of 2 wt.% [30]. The mushroom polysaccharide was studied for EOR purposes. Its low molecular weight was anticipated to result in shear-thinning due to the orientation of the polymer’s molecular chain [31]. The attempt was limited to rheological studies. Low concentrations of okra were studied by Agi et al., 2019; the study proved that the flow behavior of okra solution is comparable to traditional xanthan gum in the absence of salinity, but it loses its viscosifying ability at a salinity exceeding 25,000 ppm. Generally, most studies did not include the effects of salinity, temperature and core characteristics or field operational conditions. This is definitely insufficient to put many natural polymers into field trial applications. Despite the slow progress in using a natural polymer as a solo component in flooding, it is still promising and a step toward the future.
In conclusion, the natural polymer aspect drives the growing interest in deepening the understanding of natural plant sources. However, a considerable difference can occur for the same plant according to its functional properties [32]. Thus, it may demonstrate different effectiveness and efficiencies. Therefore, the current study aims to experimentally evaluate okra as a natural polymer for the heavy oil fields in Kazakhstan. The study explores the relationship between okra viscosity and shear rate under different concentrations. The ultimate focus was given to the field conditions in terms of salinity and temperature. This evaluation intends to link okra’s chemical and physical properties to their flowing behavior in low porosity–low permeability carbonate.

2. Materials and Methods

2.1. Preparation Method

Okra (Abelmoschus esculentus) is a member of the mallow family, known to be an edible vegetable that grows in a warm summer climate. One kg of fresh okra was obtained from the local market in El-Obeid, Sudan. It was cleaned with distilled water and sliced into circular pieces of approximately 10–20 mm. The sliced portion was then placed in a clean cloth and dried under the sun for three days, as seen in Figure 1. After that, the dried okra was placed in a blender to be converted to powder form. The powder was preserved in the freezer at −4 °C.

2.2. Characterization

Okra’s morphology was analyzed with a Scanning Electron Microscope (SEM). The model is the Carl Zeiss Crossbeam 540 model. The sample was prepared on a slide with double-sided carbon conductive tape. The sample was viewed and photographed at an accelerating voltage of 5 kV and a magnification of 500x.
In order to determine okra’s functional active groups, Fourier-transform infrared spectrometry (FTIR) was used. The spectra were determined using a Nicolet Impact 410 FTIR Spectrometer. The operation was performed within the wave ranges of 4000–400 cm−1.

2.3. Rheology Test

The solution was prepared in a brine of 5000 ppm concentration of NaCl. The viscosity of the brine was 1.105 cp. Three main concentrations of okra (1 wt.%, 2 wt.%, and 5 wt.%) were investigated. First, the apparent viscosities of the solutions were measured by a Modular Compact Rheometer 302e at 25 °C. Next, the device provided the readings for viscosity (η), shear stress (τ), shear rate and time.
The experiment was repeated to determine the effect of the reservoir temperature of 55 °C, representing the targeted field condition.

2.4. Core Flooding Experiment

Part of the CEOR evaluation was to find the effect of polymer on oil recovery during the dynamic flow. This critical part was performed under the reservoir pressure and temperature. The data obtained from the core flooding can illuminate the expected recovery.
The core flooding system used in the study is illustrated in Figure 2. A carbonate core sample was prepared with the size of 7 cm in length and 3.75 cm in diameter. The core was vacuumed and then saturated with deionized water (DIW). Both porosity and permeability were measured as described earlier by [7]. Then, the core sample was vacuumed and left to dry at 100 °C for two days. The oil used in the experiment was a heavy oil sample from western Kazakhstan (19° API). The crude viscosity and density were 0.997 g/cm3 and 474.75 mPa·s, respectively.
The core flooding was initially saturated with water and followed by the oil until no extra water was produced. The flooding procedure started with water flooding, followed by okra solution flooding. The results were recorded and the pressure was monitored.

3. Results and Discussion

3.1. Characterization Results

The surface of the okra showed significant differences in size and shape when viewed by SEM. The okra’s diameter is approximately between 150–900 micrometers. The images presented in Figure 3 show that the surface morphology is homogeneous and has an undefined semi-sheet structure. A remarkable observation is that at the magnification of 5000, the okra has a rod-like structure and some pores. In general, packed films are common among polysaccharides. A similar observation was found for corn silk and American ginseng [33,34].
FTIR spectra were used for the chemical composition to assess the structure of the dried okra, as depicted in Figure 4. A broadband between 4000–400 cm−1 was measured. The sharp peak at 3282 cm−1 is centered between (3400–3000) cm−1, reflecting the presence of stretched hydroxyl O–H groups. The peak at 2920 cm−1 is typical of C–H bonds resulting from vibration and represents cellulose [35]. The peak at 1735 cm−1 is centered between (1720–1740) cm−1 and is attributed to the ester carbonyl (COOR) groups. At the peak of 1617 cm−1, the carboxylate ion stretching band (COO–) appeared. The peak of 1401 cm−1 represents hemicellulose. The polysaccharide is confirmed by the peaks between (1200–900) cm−1. The sharp peak at 1031 cm−1 represents the CO and OH stretching vibration. This typically refers to the polysaccharide in cellulose. Additionally, cyclic alcohol is present in the natural polymer. There is also an appearance of the halo compound C-l at 523 cm−1. The FTIR confirmed that the solution contains a substantial amount of polysaccharides. Despite this confirmation, the peaks’ study range is slightly different from the previous studies on Chinese and Malaysian okra [35,36].

3.2. Effect of Concentration on Viscosity

Undoubtedly, increasing the polymer concentration increases the viscosity of the solution to a certain value. However, it is not necessarily useful for oil recovery. This is because the application cannot be beneficial if the flow of the macromolecules exceeds the required mobility ratio or if it plugs the pores. Therefore, verifying the relationship and determining the viscosity at various concentrations is essential. In Figure 5, the viscosity vs. shear rate for different okra concentrations shows that the concentration increase is proportional to the viscosity increase. There was a noticeable shift in viscosity to higher values at 5 wt.%, while a similar viscosity was achieved at the low concentrations (1 wt.% and 2 wt.%). The relation between polymer viscosity and concentration can be described by molecule aggregation and polymer entanglements which is typical for polymers [37].
Moreover, the results show that the viscosity is dependent on the shear rate. The viscosity at 5 wt.% concentration is twice as high as the viscosity at 2 wt.% for all of the studied shear rates. The increase in shear rate results in viscosity reduction. This observation represents the pseudo-plasticity that relates to shear-thinning behavior.
For most EOR polymers, shear-thinning is expected. Traditional polymer flow curves report the presence of three regions (Region I, Region II, Region III). At low shear rates, semi-linear trends or constant plateaus are usually observed to indicate a Newtonian region known as Region I, where the shear rates do not alter the polymer viscosity. In the current findings, as presented in Figure 5b, this region was not seen. This might be attributed to the fact that Region I occurs at low shear rates due to the coherent motion of domains. Natural polymers have mostly typical values of (0.01–3) 1/s [38]. Practically, the current EOR aspect implementation concerns are more about high shear rates; therefore, Region I is not observed.
For Region II, the polymer’s apparent viscosity decreases by the effect of the shear rates. Region II mechanically occurs because of polymer molecule stretching and the tendency to disrupt the polymer network. In equation form, Region II follows a power-law model, which has been described as the Ostwald–de Waele model, to be discussed further. Noticeably, the okra solution exhibited shear-thinning between the shear rates of 10 1/s to 100 1/s, and the curve tends to show the transition from Region II to Region III. In Region III, the shear rates affect the solution less. It is characterized by the relaxation of the curve, and the viscosity goes toward higher values and stabilization. This behavior is also called the Newtonian fluid or upper Newtonian. Region III is noticed at values higher than 100 1/s shear rates. Okra showed resistance to further viscosity reduction, which is attributed to the polymer reforming the shape and structure of its molecules.

3.3. Effect of Concentration on Viscosity at Reservoir Temperature

In Figure 6-a, the polymer viscosity was studied under the reservoir temperature of 55 °C. The result indicates a similar trend for all of the concentrations: The viscosity of the okra decreased as the temperature increased, especially at low shear rates. The drop in the viscosity was around 18%. The lowering viscosity at the low shear rate is a very important characteristic. This is because the natural flow of fluid in porous media is 1 ft/day, which associates with the range of 8 to 10 1/s shear rates [39]. Therefore, the natural polymer viscosity must be higher than the oil viscosity at reservoir temperature under this low shear rate. However, the intensity of the temperature impacts was different at higher shear rates than lower. Strikingly, there was no critical difference in the viscosity at all studied concentrations between the reservoir and room temperatures.
Some factors might result in this viscosity reduction resistance at reservoir temperatures, such as the solution salinity and thermal stability. In this experiment, the okra solution was prepared in 5000 ppm NaCl, which is known to positively impact the viscosity because the Na+ ions can increase the polymer solution’s polarity. The polarity directly causes the hydrodynamic volume to increase. Afterwards, the molecular chain and the apparent viscosity increase. This all contributes to maintaining the solution properties [40]. For thermal stability, the decomposition mechanism happens due to physical or chemical dehydration or thermal decomposition. For the current study, the Kazakhstan field temperature is considered moderate and is not at the boundary of altering the functional groups of the okra solution. This is because most of these thermal group-breaking points are between 150 °C and 300 °C, making the fiber content stable [41,42]. This indicates that the okra is functioning well in Kazakhstan field conditions.
In Figure 6b, the shear rate curve on the log scale confirms the presence of the two regions, similar to Figure 5b.

3.4. Shear-Thinning Modelling

Natural polymer flow in porous media requires attention to viscosity and shear rates because these factors have different operating points of view. The viscosity depends on the shear rate which is the most significant factor, yet both parameters are time-dependent during the flow. Additionally, the flow in porous media is similar to the flow through pipes with different cross-sectional areas. Therefore, the flow might experience acceleration or deceleration over the dynamic flow time. Thus, having a predictive mathematical model is necessary to give useful insights into the practical problem. Ultimately, it can tell the viscosity at any known shear rate.
In this study, the Ostwald–de Waele power-law model was used as the most straightforward famous shear-thinning description. It is a two-parameter viscosity model. The Ostwald–de Waele model is presented in Equation (1):
η = K γ n 1 .
K represents the flow consistency index (Pa.sn), n is the flow behavior index (dimensionless), γ is the shear rate (1/s) and η is the apparent viscosity (mPa.s).
The parameters K and n are constants characterizing the fluid. For shear-thinning materials, n varies between 0 and 1, which relates to the intensity of the shear-thinning. The shear-thinning ultimately focuses on the flow curve’s linear region. Moreover, the regression coefficient best indicates the mathematical model’s accuracy. Table 1 focuses on the values of K and n and their relation to the shear-thinning. The increase in the flow behavior index is aligned to the addition of the concentration. It is related to the increase in pseudo-plasticity intensity. The same behavior of incremental addition trend occurs at reservoir temperature. However, due to the natural source’s impurities, the results of the regression coefficient indicate that the model fits the data between (90–99)%. Generally, shear-thinning behavior can be interpreted by the increased dispersed phase tendency to aggregate. The aggregation is a mechanism that macromolecules exhibit to propagate in the least resistant path in the flow stream. Additionally, the okra in this study has a rod-like shape, which could be re-coordinated to the position with the least resistance to flow and so thinned [43].

3.5. Core Flooding

The core sample was characterized by a porosity of 15% and oil effective permeability of 27 mD. Therefore, it can be defined as a low permeability and low porosity carbonate core sample. Since the viscous behavior of the polymer in porous media is vitally important, the polymer must propagate in the reservoir. For such cases, it can be associated with some problems, such as injectivity and polymer retention. Therefore, conducting flooding is unavoidable. In Figure 7, the recovery of oil after injecting 5 wt.% okra is presented. The results indicate that the solution recovered an additional 7% of oil. This value is considered lower by 5% than what was observed earlier by [36]. This is attributed to the difference between the two studies in okra size, concentrations, operating temperature and pressure. Although Sarawak Fields has a higher temperature than Kazakhstan, the results are still consistent with natural polymer flow and mechanisms.
In this study, the natural polymer exhibits high flow resistance because of the low porosity and permeability of the limestone. The increase was seen in the pressure drop after the solution injection. The pressure drop directly resulted from the interaction between the natural polymer and the remaining oil, forcing the local oil bank to accumulate. An additional reason is the suggested high molecular weight in comparison to the pore throat, since the flow is in a low porosity–-low permeability condition. Okra solutions were reported to have between 3265 and 36.9 KDa (3.265.000–36.900 g/mol) molecular weights for water-extractable methods [44]. Some reports considered permeability alteration and formation damage as secondary entrapment reasons for a high molecular weight solution [7].

4. Conclusions

The need to transform petroleum-based polymer usage on a large scale into a green polymer is unequivocal. The natural chemicals from plants provide sustainability and cheaper sources of chemicals, and could be tailored to be compatible with the field specification. However, the discrepancy in the relationship between viscosity shear rate and viscosity can be sensitive to the raw material source and its concentration. Therefore, it is critical to examine the impact of particle size, functional groups and used concentration impact on fluid rheology.
The current study examines okra (natural polymer) for Kazakhstan heavy oil that is trapped in low porosity–low permeability carbonate reservoirs. The findings can be encapsulated as:
(1)
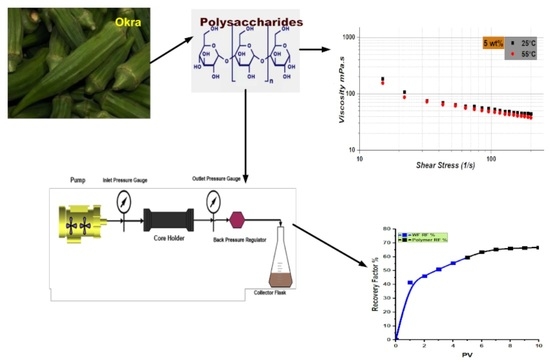
Okra size is between 150–900 μm, which is slightly large. The morphology can be described by rod-like structures with pores and staking as sheet structures which affect the coordination of the molecules under shear rate;
(2)
Okra characterization confirmed the presence of polysaccharides and halo compounds, and the stretching of esters; this highlights the impact of the source’s natural origin;
(3)
The viscosity depends on the shear rate and increases by increasing the concentration. However, there is no significant viscosity reduction at the reservoir temperature;
(4)
The viscosity shear-rate relationship is shear-thinning and was described by the Ostwald–de Waele power-law model. The values of K and n vary with concentration and temperature, and indicate pseudo-plasticity intensity;
(5)
The incremental oil recovery is 7% and the flow is restricted by the mechanical entrapment due to the large molecules and the low porosity–permeability of the cores;
(6)
Okra’s effectiveness depends on its original source and polysaccharide characterization as well as the operating conditions;
(7)
Okra is considered a promising material to enhance heavy oil recovery in Kazakhstan field conditions.

Author Contributions

A.H.A.: formal analysis, investigation, methodology, writing supervision; O.M.A.: methodology, investigation; B.M.: investigation, methodology; D.A.M.: editing and review; K.F.B.-H.: data curation and review; R.A.A.A.: validation and review. All authors have read and agreed to the published version of the manuscript.

Funding

This research was carried out with the financial support of the Ministry of Science and Higher Education of the Russian Federation in the framework of the program of activities of the Perm Scientific and Educational Center “Rational Subsoil Use”.

Informed Consent Statement

Not applicable.

Data Availability Statement

Not applicable.

Conflicts of Interest

The authors declare no conflict of interest.

References

  1. Nia, A.R.; Awasthi, A.; Bhuiyan, N. Industry 4.0 and demand forecasting of the energy supply chain: A literature review. Comput. Ind. Eng. 2021, 154, 107128. [Google Scholar] [CrossRef]
  2. Raniolo, S.; Mancini, S.; Vimercati, S.; Gentil, P.; Simeone, D.; Buchanan, A. The Use of New Technologies to Maximize Oil Production in a Viscous Oil Field in Arctic Environment: The Nikaitchuq Experience. In Proceedings of the Abu Dhabi International Petroleum Exhibition and Conference, Abu Dhabi, United Arab Emirates, 10–13 November 2014. [Google Scholar] [CrossRef]
  3. Fleshman, R.; Lekic, H.O. Artificial lift for high-volume production. Oilfield Rev. 1999, 11, 49–63. [Google Scholar]
  4. Beckwith, R. Pumping Oil: 155 Years of Artificial Lift. J. Pet. Technol. 2014, 66, 101–107. [Google Scholar] [CrossRef]
  5. Babadagli, T. Philosophy of EOR. In Proceedings of the SPE/IATMI Asia Pacific Oil & Gas Conference and Exhibition, Bali, Indonesia, 29–31 October 2019. [Google Scholar] [CrossRef]
  6. Olajire, A.A. Review of ASP EOR (alkaline surfactant polymer enhanced oil recovery) technology in the petroleum industry: Prospects and challenges. Energy 2014, 77, 963–982. [Google Scholar] [CrossRef]
  7. Abbas, A.H.; Sulaiman, W.R.W.; Jaafar, M.Z.; Agi, A.A. Laboratory experiment based permeability reduction estimation for enhanced oil recovery. J. Eng. Sci. Technol. 2018, 13, 2464–2480. [Google Scholar]
  8. Khan, M.N.; Sulaiman, W.R.W.; Abbas, A.H. Study of Sulfosuccinate and Extended Sulfated Sodium Surfactants on the Malaysian Crude/Water Properties for ASP Application in Limestone. Arab. J. Sci. Eng. 2021, 46, 6915–6924. [Google Scholar] [CrossRef]
  9. Dong, H.; Fang, S.; Wang, D.; Wang, J.; Liu, Z.L.; Hou, W. Review of Practical Experience & Management by Polymer Flooding at Daqing. In Proceedings of the SPE Symposium on Improved Oil Recovery, Tulsa, OK, USA, 20–23 April 2008. [Google Scholar]
  10. Abidin, A.; Puspasari, T.; Nugroho, W. Polymers for Enhanced Oil Recovery Technology. Procedia Chem. 2012, 4, 11–16. [Google Scholar] [CrossRef]
  11. Bai, B.; Zhou, J.; Yin, M. A comprehensive review of polyacrylamide polymer gels for conformance control. Pet. Explor. Dev. 2015, 42, 525–532. [Google Scholar] [CrossRef]
  12. Zhu, D.; Hou, J.; Wei, Q.; Chen, Y. Development of a High-Temperature-Resistant Polymer-Gel System for Conformance Control in Jidong Oil Field. SPE Reserv. Eval. Eng. 2018, 22, 100–109. [Google Scholar] [CrossRef]
  13. Al-Hajri, S.; Mahmood, S.M.; Abdulelah, H.; Akbari, S. An Overview on Polymer Retention in Porous Media. Energies 2018, 11, 2751. [Google Scholar] [CrossRef] [Green Version]
  14. Kulawardana, E.U.; Koh, H.; Kim, D.H.; Liyanage, P.J.; Upamali, K.A.; Huh, C.; Weerasooriya, U.; Pope, G.A. Rheology and Transport of Improved EOR Polymers under Harsh Reservoir Conditions. In Proceedings of the SPE Improved Oil Recovery Symposium, Tulsa, OK, USA, 14–18 April 2012. [Google Scholar]
  15. Huh, C.; Lange, E.; Cannella, W. Polymer retention in porous media. In Proceedings of the SPE/DOE Enhanced Oil Recovery Symposium, Tulsa, OK, USA, 22–25 April 1990. [Google Scholar]
  16. Chen, Q.; Ye, Z.; Xu, H.; Wang, Y.; Lai, N. Study on the biodegradability of a chitosan-modified hyperbranched polymer for enhanced oil recovery. J. Appl. Polym. Sci. 2021, 139, 51425. [Google Scholar] [CrossRef]
  17. Alfazazi, U.; Thomas, N.C.; Alameri, W.; Al-Shalabi, E.W. Experimental investigation of polymer injectivity and retention under harsh carbonate reservoir conditions. J. Pet. Sci. Eng. 2020, 192, 107262. [Google Scholar] [CrossRef]
  18. Wang, L.; Lu, X.-G.; Deng, Q.-J.; Xiao, L. EOR technology after polymer flooding and it’s technical and economic evaluation. Oilfield Chem. 2010, 4, 6–9. [Google Scholar]
  19. Al-Murayri, M.T.; Al-Mayyan, H.E.; Moudi, K.; Al-Ajmi, F.; Pitts, D.; Wyatt, M.J.; French, K.; Surtek, J.; Dean, E. Chemical EOR Economic Evaluation in a Low Oil Price Environment: Sabriyah Lower Burgan Reservoir Case Study. In Proceedings of the SPE EOR Conference at Oil and Gas West Asia, Muscat, Oman, 26 March 2018. [Google Scholar] [CrossRef]
  20. Needham, R.B.; Doe, P.H. Polymer flooding review. J. Pet. Technol. 1987, 39, 1503–1507. [Google Scholar] [CrossRef]
  21. Abbas, A.H.; Abdullah, D.S.; Jaafar, M.Z.; Sulaiman, W.R.W.; Agi, A. Comparative numerical study for polymer alternating gas (PAG) flooding in high permeability condition. SN Appl. Sci. 2020, 2, 938. [Google Scholar] [CrossRef]
  22. Taylor, K.C.; Nasr-El-Din, H.A. Water-soluble hydrophobically associating polymers for improved oil recovery: A literature review. J. Pet. Sci. Eng. 1998, 19, 265–280. [Google Scholar] [CrossRef]
  23. Wever, D.; Picchioni, F.; Broekhuis, A. Polymers for enhanced oil recovery: A paradigm for structure–Property relationship in aqueous solution. Prog. Polym. Sci. 2011, 36, 1558–1628. [Google Scholar] [CrossRef]
  24. Kamal, M.S.; Sultan, A.; Al-Mubaiyedh, U.A.; Hussein, I.A. Review on Polymer Flooding: Rheology, Adsorption, Stability, and Field Applications of Various Polymer Systems. Polym. Rev. 2015, 55, 491–530. [Google Scholar] [CrossRef]
  25. Chaudhary, P.; Kumar, S.; Reddy, S. Polymer and its Role in EOR and Water shut-off Process. J. Basic Appl. Eng. Res. 2016, 3, 717–720. [Google Scholar]
  26. Zhang, X.; Li, B.; Pan, F.; Su, X.; Feng, Y. Enhancing Oil Recovery from Low-Permeability Reservoirs with a Ther-moviscosifying Water-Soluble Polymer. Molecules 2021, 26, 7468. [Google Scholar] [CrossRef] [PubMed]
  27. Kumar, S.; Tiwari, R.; Husein, M.; Kumar, N.; Yadav, U. Enhancing the Performance of HPAM Polymer Flooding Using Nano CuO/Nanoclay Blend. Processes 2020, 8, 907. [Google Scholar] [CrossRef]
  28. Bou-Hamdan, K.F. Applications of Nanomaterials in the Oil and Gas Industry. In Handbook of Research on Green Synthesis and Applications of Nanomaterials; IGI Global: Hershey, PA, USA, 2022; pp. 173–198. [Google Scholar]
  29. Ikeagwu, C.; Adetila, S. The study of local polymers on enhanced oil recovery. Arch. Appl. Sci. Res. 2015, 7, 48–55. [Google Scholar]
  30. Fakher, S.; Ahdaya, M.; Imqam, A. Hydrolyzed polyacrylamide—Fly ash reinforced polymer for chemical enhanced oil recovery: Part 1—Injectivity experiments. Fuel 2019, 260, 116310. [Google Scholar] [CrossRef]
  31. Xu, J.-L.; Zhang, J.-C.; Liu, Y.; Sun, H.-J.; Wang, J.-H. Rheological properties of a polysaccharide from floral mushrooms cultivated in Huangshan Mountain. Carbohydr. Polym. 2016, 139, 43–49. [Google Scholar] [CrossRef] [PubMed]
  32. Olawuyi, I.F.; Lee, W.Y. Structural characterization, functional properties and antioxidant activities of polysaccharide extract obtained from okra leaves (Abelmoschus esculentus). Food Chem. 2021, 354, 129437. [Google Scholar] [CrossRef]
  33. Zhao, C.; Li, X.; Miao, J.; Jing, S.; Li, X.; Huang, L.; Gao, W. The effect of different extraction techniques on property and bioactivity of polysaccharides from Dioscorea hemsleyi. Int. J. Biol. Macromol. 2017, 102, 847–856. [Google Scholar] [CrossRef]
  34. Savi, A.; Calegari, G.C.; Santos, V.A.Q.; Pereira, E.A.; Teixeira, S.D. Chemical characterization and antioxidant of polysaccharide extracted from Dioscorea bulbifera. J. King Saud Univ.-Sci. 2018, 32, 636–642. [Google Scholar] [CrossRef]
  35. Hua, D.; Zhang, D.; Huang, B.; Yi, P.; Yan, C. Structural characterization and DPPH· radical scavenging activity of a polysaccharide from Guara fruits. Carbohydr. Polym. 2014, 103, 143–147. [Google Scholar] [CrossRef]
  36. Agi, A.; Junin, R.; Arsad, A.; Abbas, A.; Gbadamosi, A.; Azli, N.B.; Oseh, J. Synergy of the flow behaviour and disperse phase of cellulose nanoparticles in enhancing oil recovery at reservoir condition. PLoS ONE 2019, 14, e0220778. [Google Scholar] [CrossRef]
  37. Hu, H.; Zhao, K.; Fernandes, N.; Boufflet, P.; Bannock, J.H.; Yu, L.; de Mello, J.C.; Stingelin, N.; Heeney, M.; Giannelis, E.P. Entanglements in marginal solutions: A means of tuning pre-aggregation of conjugated polymers with positive implications for charge transport. J. Mater. Chem. C 2015, 3, 7394–7404. [Google Scholar] [CrossRef]
  38. De Kort, G.W.; Leoné, N.; Stellamanns, E.; Auhl, D.; Wilsens, C.H.R.M.; Rastogi, S. Effect of Shear Rate on the Orientation and Relaxation of a Vanillic Acid Based Liquid Crystalline Polymer. Polymers 2018, 10, 935. [Google Scholar] [CrossRef] [PubMed]
  39. Lee, Y.; Jang, Y.; Lee, W.; Wang, J.; Sung, W. Effect of Acidity of Formation Water for Low-Salinity Polymer Injection Method in Carbonate Reservoirs. In Proceedings of the Offshore Technology Conference Asia, Kuala Lumpur, Malaysia, 3–6 November 2020. [Google Scholar] [CrossRef]
  40. Ma, J.; Yu, P.; Xia, B.; An, Y. Effect of salt and temperature on molecular aggregation behavior of acrylamide polymer. e-Polymers 2019, 19, 594–606. [Google Scholar] [CrossRef]
  41. De Rosa, I.M.; Kenny, J.M.; Puglia, D.; Santulli, C.; Sarasini, F. Morphological, thermal and mechanical characterization of okra (Abelmoschus esculentus) fibres as potential reinforcement in polymer composites. Compos. Sci. Technol. 2010, 70, 116–122. [Google Scholar] [CrossRef]
  42. Stawski, D.; Çalişkan, E.; Yilmaz, N.D.; Krucińska, I. Thermal and Mechanical Characteristics of Okra (Abelmoschus esculentus) Fibers Obtained via Water- and Dew-Retting. Appl. Sci. 2020, 10, 5113. [Google Scholar] [CrossRef]
  43. Toledo, R.T.; Singh, R.K.; Kong, F. Fundamentals of Food Process Engineering, 4th ed.; Springer Nature: Cham, Switzerland, 2018. [Google Scholar] [CrossRef]
  44. Xu, K.; Guo, M.; Du, J. Molecular characteristics and rheological properties of water-extractable polysaccharides de-rived from okra (Abelmoschus esculentus L.). Int. J. Food Prop. 2017, 20, S899–S909. [Google Scholar] [CrossRef] [Green Version]
Figure 1. Okra preparation process.
Energies 15 06827 g001
Figure 2. Core Flooding Schematic.
Energies 15 06827 g002
Figure 3. SEM images at different magnifications ×100, ×1000, ×2000 and ×5000 of the okra.
Energies 15 06827 g003
Figure 4. FTIR result for chemical composition.
Energies 15 06827 g004
Figure 5. Effect of concentration on the viscosity under shear rates at 25 °C. (a) viscosity vs. shear rate for different okra concentrations; (b) traditional polymer flow curves report the presence of three regions (Region I, Region II, Region III). At low shear rates, semi-linear trends or constant plateaus are usually observed to indicate a Newtonian region known as Region I, where the shear rates do not alter the polymer viscosity. In the current findings region was not seen. This might be at-tributed to the fact that Region I occurs at low shear rates due to the coherent motion of domains.
Energies 15 06827 g005
Figure 6. Effect of concentration on viscosity under shear rates at 55 °C. (a) viscosity vs. shear rate for different okra concentrations; (b) traditional polymer flow curves report the presence of three regions (Region I, Region II, Region III). At low shear rates, semi-linear trends or constant plateaus are usually observed to indicate a Newtonian re-gion known as Region I, where the shear rates do not alter the polymer viscosity. In the current findings region was not seen. This might be at-tributed to the fact that Region I occurs at low shear rates due to the coherent motion of domains.
Energies 15 06827 g006
Figure 7. Recovery of oil by natural polymer flooding (okra) at reservoir temperature.
Energies 15 06827 g007
Table 1. Ostwald–de Waele power-law model at different temperatures.
Temperature
°C
ConcentrationsConsistency Index KFlow Behavior Index nStability Index R2
251 wt.%89.20.670.95
2 wt.%65.90.750.91
5 wt.%208.60.710.99
551 wt.%44.40.770.96
2 wt.%119.50.590.97
5 wt.%248.60.640.99
Publisher’s Note: MDPI stays neutral with regard to jurisdictional claims in published maps and institutional affiliations.

