Abstract
Data-driven Automated Fault Detection and Diagnosis (AFDD) are recognized as one of the most promising options to improve the efficiency of Air-Handling Units (AHUs). In this study, the field operation of a typical single-duct dual-fan constant air volume AHU is investigated through a series of experiments carried out under Mediterranean (southern Italy) climatic conditions considering both fault-free and faulty scenarios. The AHU performances are analyzed while artificially introducing the following five different typical faults: (1) post-heating coil valve stuck at 100% (always open); (2) post-heating coil valve stuck at 0% (always closed); (3) cooling coil valve stuck at 100% (always open); (4) cooling coil valve stuck at 0% (always closed); (5) humidifier valve stuck at 0% (always closed). The measured faulty data are compared against the corresponding fault-free performance measured under the same boundary conditions with the aim of assessing the faults’ impact on both thermal/hygrometric indoor conditions, as well as patterns of 16 different key operating parameters. The results of this study can help building operators and facility engineers in identifying faults’ symptoms in typical AHUs and facilitate the related development of new AFDD tools.
1. Introduction
It is well known that buildings contribute to about 36% of global final energy demand and 37% of worldwide greenhouse gas (GHG) emissions [1]. Heating, Ventilation and Air-Conditioning (HVAC) systems are responsible of 50–60% of buildings’ energy demand and 10–20% of overall energy consumption [2,3,4], thus becoming strategic for the definition of energy management strategies. According to [3,4,5,6], HVAC systems including Air-Handling Units (AHUs) are frequently operated under faulty conditions due to lack of proper maintenance, failure of components or incorrect installation. Faulty operation of AHUs could have severe impacts [3,4,7,8,9], leading to uncomfortable indoor environments, poor indoor air quality and significant wastes of energy and money. Automated Fault Detection and Diagnosis (AFDD) processes make it possible to automatically recognize fault occurrence and identify the causes and the location of fault [10] and, therefore, its effective adoption is of paramount importance. According to [3,4,10,11], AFDD procedures and recommissioning of AHUs to rectify faulty operation can lead to an energy saving of about 20–30%. Zhao et al. [12] categorize AFDD methods into knowledge-based and data-driven. Knowledge-based methods rely on domain knowledge leveraging on physics laws and can also be easily generalized, while data-driven methods detect faults by analysing the patterns of selected variables and searching for causes according to similarities with pre-labelled anomaly libraries. Recently, the data-driven approach gained great interest thanks to the fact that: (i) it could allow a greater accuracy and (ii) it is also applicable when the physics-based knowledge is not wide enough [13,14]. In this context, data analytics and artificial intelligence techniques are particularly promising [12,13].
1.1. Research Gaps
Data-driven AFDD tools are recognized as efficient methods to improve the performance of AHUs, but the scientific literature underlines that they are still in the relatively early stage of adoption [11] and several research gaps still have to be covered. In particular, a persistent challenge is represented by the lack of common datasets (covering a wide diversity of operating scenarios, AHU configurations and equipment) and test methods to assess the accuracy of AFDD tools [11,15].
Labelled, reliable and scalable fault-free and faulty data have to be collected for developing data-driven AFDD models, but they are still limited taking into account that [4,11,15,16,17,18]: (i) AHUs operate under non-stationary conditions due to temporal variations of weather conditions and heating/cooling loads; (ii) generally AHUs are not equipped with all the sensors required for measuring the key operational parameters; (iii) faulty data are difficult to obtain mainly due to the costs and complexity associated with the implementation of faults into real AHUs; (iv) data labelling requires high-level expertise and field inspections; (v) the symptoms associated with different fault types/severities could be similar, thus requiring a relevant number of accurate sensors; (vi) it is common that more than one fault occurs during AHU operation and, therefore, multi-fault scenarios should be also investigated; (vii) fault symptoms are generally sensitive to the boundary conditions and, therefore, wide operating ranges have to be explored, taking into account that data-driven AFDD tools are not capable of extrapolating beyond the limits of training datasets.
The available experimental datasets for data-driven AFDD tools of AHUs have been mainly obtained under American weather conditions [18,19,20,21], with very limited case studies related to Mediterranean climates [22,23,24]. In addition, it should be highlighted that the sampling frequency of measurements is an important parameter in obtaining an accurate representation of the field performance of AHU components; with reference to this point, a minimum sampling rate of 35 s [25,26] can be found in the scientific literature, even if a 1 min time interval has been adopted in most of the scientific works [18,20,21,22,23,24]. Moreover, several data-driven AFDD methods have been based on the ASHRAE RP-1312 dataset [18], that was obtained in 2012 by means of a simulation model developed via the HVACSIM+ software [27] and then validated against measured data (recorded at 1 min intervals during both fault-free and faulty operation under American summer and winter conditions) with reference to both single-duct dual-fan and dual-duct dual-fan variable air volume (VAV) AHUs.
Even if faulty datasets of AHUs could also be used to benchmark the performance of different AFDD algorithms, only five out of these datasets with verified ground-truth information on specific tagged faults are currently publicly available [20].
According to the literature review [4,11,15,16,17,18,19,20], additional efforts have to be performed in order to obtain new experimental faulty datasets supporting the development and application of data-driven AFDD tools. This important lack is recognized by several authors. For example, Lin et al. [11] underlined that additional public datasets, together with a clear characterization of fault categories, are required. Granderson et al. [19] also indicated a growing need for AHU faulty datasets to assess the accuracy of AFDD tools. More recently, Granderson et al. [20] highlighted that public databases characterized by ground-truth verified points are quite rare. In addition, Casillas et al. [28] noticed that one of the most significant challenges in the field of AFDD methods is represented by the insufficient availability of shared datasets. Finally, Hu et al. [29] concluded that further research is required to obtain and share additional field fault-free and faulted data of HVAC units for data-driven AFDD methods.
Furthermore, it should be highlighted that a few experimental studies quantitatively examine how various faults and fault severities can impact on users’ comfort, patterns of key operational parameters, symptom patterns, energy consumption, GHG emissions, operating and maintenance cost, and equipment life cycle [11,15,19]; this effort is mandatory for guiding future development and application of AFDD tools. For example, Chen et al. [30] highlighted that most of the scientific studies focusing on HVAC systems investigated the fault effects in terms of annual energy consumption or thermal/hygrometric comfort or operating costs, but additional research has to be carried out to quantitatively assess the fault effects on various key operating parameters as well as develop new data-driven AFDD tools.
Finally, the scientific literature related to AFDD tools underlines that several components of HVAC systems often fail during day-to-day operation. In particular, Granderson et al. [19] indicated that sensors, valves and fans are the most common components of AHUs that can fail or give wrong signals. The fault occurrence rate may vary widely, even for the same component in different HVAC systems, and there is limited information regarding the frequency of occurrence of faults in AHUs because the maintenance records with fault information are not always available [31]. Li and O’Neill [31] also highlighted that the cooling/heating coil is a component that plays a very significant role in the AHU’s operation, and one of the most common faults for the heating/cooling coil is represented by the corresponding valve becoming stuck. In addition, they underlined that (i) a heating/cooling coil fault reduces the efficiency of the HVAC system, and (ii) the most common faults for heating/cooling coils are fouling, leaking, scaling and becoming stuck. Dey et al. [32] assessed the occurrence probability of 14 fault types associated with the heating coil, cooling coil, outside air mixing box, controller and sensors based on one-year maintenance records related to a VAV AHU serving the Applied Engineering and Technology building at the University of Texas (San Antonio, TX, USA); the data indicated that the heating coil valve leaking and the return air dumper becoming stuck are the most frequent fault types (with an occurrence probability of 10.9%), while the cooling coil valve becoming stuck and the heating coil valve becoming stuck are characterized by an occurrence probability equal to 6.5% and 4.3%, respectively. However, to the knowledge of the authors, no scientific studies have been developed with reference to the experimental analysis of the effects of the humidifier valve stuck on the performance of AHUs. The heating coil valve becoming stuck has been investigated in two research works [20,33], while the cooling coil valve becoming stuck has been studied by [18,20,33,34,35]. In particular, Granderson et al. [20] evaluated the performance of both a variable-air-volume AHU and a constant-air-volume AHU in the cases of a fully open, 50% open, and fully closed heating coil valve, as well as in the cases of a fully open, 50% open and fully closed cooling coil valve by performing daily tests (with measurements recorded every 1 min) under the climatic conditions of Iowa and Tennessee (U.S.A.) during summer, winter and spring; the authors provided information about the developed dataset, including details on fault severity as well as measurement procedure and apparatus; however, they did not discuss the effects associated with the faults’ occurrence. Nehasil et al. [33] experimentally validated the accuracy of a new tool for the detection of operating faults in HVAC units with reference to both the heating coil valve becoming stuck (fully open, 50% open and fully closed) and the cooling coil valve becoming stuck (fully open, 50% open and fully closed) in the case of the field operation of a constant-air-volume AHU running under the weather conditions of the Czech Republic; the results revealed a 90% detection rate of the developed AFDD method. The cooling coil valve becoming stuck (at 0%, 15%, 20%, 65% and 100% as levels of severity) has also been explored from an experimental point of view by Wen and Li [18] during winter, spring and summer in Iowa (U.S.A.) in the case of a variable-air-volume AHU (data recorded at a 1 min sampling rate); with respect to the normal operation, the authors found that: (i) the cooling coil valve fully closed causes relevant variations in terms of the electric power consumption of several AHU components during summer; (ii) the cooling coil valve fully open corresponds to a significantly larger electric power consumption associated with the operation of both the heating and cooling coil during both summer and winter. Moreover, Feng et al. [34] studied the performance of an innovative AFDD method in the case of the cooling coil valve becoming stuck (fully closed and 15% open) through 10 h experiments (with data collected every 5 min) during the summer operation of a variable-air-volume AHU installed in the city of Hefei (China); the results indicated that the algorithm proposed by the authors can achieve a better accuracy than traditional methods, even if it still has some limitations in terms of applicability to different boundary conditions. Finally, Carling [35] compared three different AFDD methods (qualitative, rule-based and residual) against the experimental performance of a single-duct dual-fan constant-air-volume AHU (with measurements recorded every 5 min) operating in Stockholm (Sweden) with the cooling coil valve stuck (fully open and 50% open) under cooling mode. The authors underlined that: (i) the qualitative method is easy to set up and generates a limited number of false alarms, but it can detect only a few of the investigated faults; (ii) the rule-based method is not always applicable to the investigated plant and provides false alarms, but it can detect more types of faults; (iii) the residual method requires additional sensors, is time-consuming to set up and generates false alarms, even if it can detect several fault types. This literature review evidently underlines that the studies related to cooling coils/heating coils/humidifier valves becoming stuck (i) are few in number (no experimental studies on humidifier valves becoming stuck are available), (ii) have not been performed under Mediterranean climatic conditions, (iii) in some cases have been conducted only in a single season, and (iv) have been carried out with a sampling rate of experimental data not lower than 1 min; therefore, it can be stated that there is a lack of research with reference to the occurrence of the coils’ valves becoming stuck and, therefore, new experimental studies need to be performed in order to investigate in greater detail the effects of such faults in the case of typical AHUs operation.
1.2. Novelty, Goals and Structure of the Paper
The most significant factors limiting a wider application of data-driven AFDD tools for AHUs are addressed in this study thanks to the experimental set-up installed in the SENS i-Lab of the Department of Architecture and Industrial Design of the University of Campania Luigi Vanvitelli (Aversa, south of Italy) [36]. The apparatus consists of a typical HVAC system with a single-duct, dual-fan, constant-air-volume air-handling unit designed for AFDD purposes; it is equipped with (i) a specifically devoted management system allowing to introduce artificial faults, as well as (ii) accurate sensors capable of monitoring and recording the performance of each component upon varying the boundary conditions.
In this paper, high-quality and reliable data representing both fault-free and faulty operating conditions during both summer and winter conditions of the above-mentioned AHU are presented and discussed. Measurements have been collected at 1 s intervals during 9 h daily field experiments running from 9 a.m. up to 6 p.m. In more detail, the following five different typical faults have been experimentally investigated:
- post-heating coil valve stuck at 100% (always open);
- post-heating coil valve stuck at 0% (always closed);
- cooling coil valve stuck at 100% (always open);
- cooling coil valve stuck at 0% (always closed);
- humidifier valve stuck at 0% (always closed).
The experimental data collected under faulty conditions have been analysed and compared with respect to the fault-free performance measured under the same boundary conditions, with the aim of assessing the impacts of the selected faults on (i) thermo-hygrometric indoor comfort as well as (ii) time-domain and frequency-domain patterns of key operating variables.
This work mainly aims at:
- highlighting the difference between AHU field faulty operation and nominal fault-free performance;
- assessing the impacts in terms of thermal/hygrometric comfort of the selected faults based on the comparison of experimental data gathered under normal and faulty scenarios;
- recognizing the AHU faults characterized by the most significant effects in order to identify the most important priorities of future maintenance programs;
- facilitating and supporting the development of data-driven rule-based AFDD methods thanks to the identification of the most impacting key-operating parameters by evaluating the symptoms’ occurrence probability;
- collecting and curating a reliable faulty and fault-free field dataset of a typical AHU operating under Italian weather conditions to be publicly shared with the related research community.
The paper consists of six main sections. Section 2 reports the detailed description of the experimental apparatus as well as its sensors and management system. Section 3 describes the boundary conditions of both the fault-free and faulty experiments. Section 4 includes the results of the comparison between normal and faulted tests in terms of outside air temperature and relative humidity. Section 5 discusses the experimental data and the outcomes of the faults’ impact assessment. The conclusive remarks and future developments of the study are reported in the last section.
2. Description of the Experimental Set-Up
In this section, the experimental set-up is detailed in terms of the HVAC system and AHU (Section 2.1), the integrated test room served by the HVAC system (Section 2.2), sensors and related measuring uncertainty/range of the HVAC system (Section 2.3), as well as the logic controlling the HVAC system operation (Section 2.4).
2.1. HVAC System
A typical HVAC system, including a single-duct, dual-fan, constant-air-volume air-handling unit, serves the integrated test room of the SENS i-Lab of the Department of Architecture and Industrial Design of the University of Campania Luigi Vanvitelli (Aversa, south of Italy) [36]. Figure 1 reports the schematic of the HVAC system, while further details about its main functional parts are indicated in Table 1.
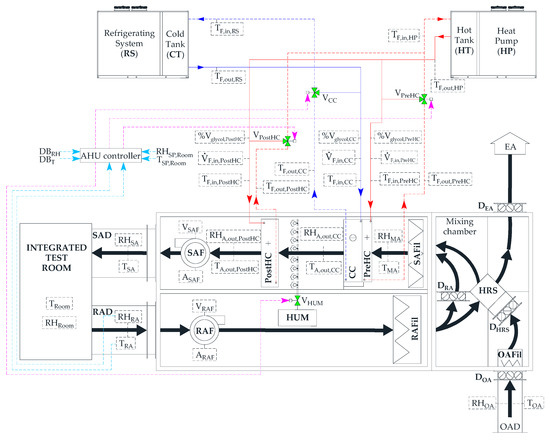
Figure 1.
Schematic of the HVAC system.

Table 1.
Characteristics of the main AHU components.
2.2. Integrated Test Room
The integrated test room is characterized by a floor area of 16.0 m2, a height of 3.6 m, four vertical walls (without windows, but with one door), and a horizontal floor as well as a horizontal ceiling. Figure 2 reports the floor plan as well as an internal view of the integrated test room.
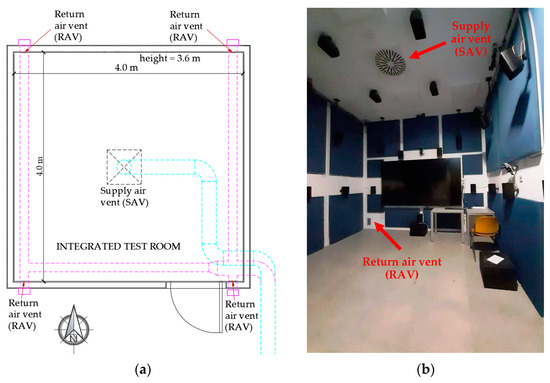
Figure 2.
(a) Floor plan, and (b) internal view of the integrated test room.
Table 2 indicates the characteristics of the envelope of the integrated test room in terms of layer materials, layer thickness, layer thermal conductivity, layer conductive thermal resistance and heat transfer area.
Table 2.
Integrated test room envelope’s characteristics.
2.3. Sensors and Measurement Uncertainty
The AHU of the HVAC system is equipped with accurate sensors aiming at monitoring and recording the temporal trends of its key operating parameters. Taking into account that the AFDD process is substantially affected by the accuracy of sensors, the measurement accuracy has to be specified in order to quantify the reliability of test data [39]. Both the measuring range and accuracy of all sensors are reported in Table 3.
Table 3.
Characteristics of the AHU sensors.
2.4. Control Logics of the AHU
A specifically devoted control logic has been developed and implemented in order to operate the AHU for AFDD purposes. At the beginning of or during the tests, the following parameters can be manually set and modified by the end users:
- the desired targets of both indoor air temperature (TSP,Room) and relative humidity (RHSP,Room) to be achieved inside the integrated test room;
- the deadbands DBT and DBRH associated with TSP,Room and RHSP,Room, respectively;
- the velocity of both the return air fan (OLRAF) and the supply air fan (OLSAF) between 0% and 100%;
- the opening percentages of the return air damper (OPDRA), the outside air damper (OPDOA) and the exhaust air damper (OPDEA) between 0% and 100% (where 100% means that the damper is fully open);
- the activation/deactivation of the static heat-recovery system by setting the opening percentage of the heat-recovery system damper (OPDHRS).
Once the above-mentioned parameters are defined, the activation/deactivation of the humidifier, cooling coil, post-heating coil, heat pump and refrigerating system are based on the operating conditions detailed in Table 4 (the same conditions are applied whatever the season is). The pre-heating coil is not included in this table because of the fact that it was not used during the experiments performed in this study.
Table 4.
Conditions for activating/deactivating the AHU components.
PID (proportional-integral-derivative) controllers automatically adjust (in the range of 0-100%) the opening percentages of the valves (OPV_PostHC, OPV_CC and OPV_HUM) supplying the post-heating coil, the cooling coil and the humidifier, respectively, in order to maintain (i) the actual return air temperature TRA within the upper (UDBT = TSP,Room + DBT) and lower (LDBT = TSP,Room − DBT) deadbands of the return air temperature set-point TSP,Room, as well as (ii) the actual return air relative humidity RHRA within the upper (UDBRH = RHSP,Room + DBRH) and lower (LDBRH = RHSP,Room − DBRH) deadbands of the return air relative humidity set-point RHSP,Room.
However, alternatively the end-users are allowed to alter the components’ operation based on specific research purposes by manually forcing (at the beginning of or during the tests) the opening percentages of the above-mentioned valves in order to keep the desired user-defined positions. Additional details about the control logic are reported in the Appendix A.
3. Methodology: Design of Experiments
The fault-free and faulty operation of the AHU serving the integrated test room of the SENS i-Lab has been investigated by means of 18 experimental tests performed under both summer and winter conditions. In particular, 8 experiments (NS1, NS2, NS3, NW1, NW2, NW3, NW4 and NW5) have been carried out under normal (N) conditions; in more detail, the tests (NS1, NS2 and NS3) have been realized during the summer of 2021 (S), while the other tests (NW1, NW2, NW3, NW4 and NW5) have been executed during the winter of 2021/22 (W). The remaining 10 faulty tests (FS1, FW1, FS2, FW2, FS3, FW3, FS4, FW4, FS5 and FW5) have been developed during both the summer of 2021 (S) and the winter of 2021/22 (W); in particular, a specific single fault type/severity has been investigated during each faulty test by manually forcing the operation of the post-heating valve, the cooling coil valve or the humidifier valve (no test case including multiple faults has been considered).
Table 5 reports the boundary conditions associated with the normal experiments, while Table 6 indicates the boundary conditions of the faulted experiments (the cells corresponding to the faulty component are highlighted by an orange shade).
Table 5.
Boundary conditions of the normal experiments.
Table 6.
Boundary conditions of the faulty experiments.
As indicated in Table 6, 5 fault types/severities have been experimentally investigated by artificially introducing the fault at the beginning of the experiments (set at 9:00 a.m. in any case) up to 6:00 p.m. (end of experiments in any case) without internal gains/loads. In particular, the following 5 fault types/severities have been considered:
- fault 1: the post-heating coil valve always kept closed (stuck at 0%) during the faulty tests FS1 and FW1;
- fault 2: the post-heating coil valve always kept fully open (stuck at 100%) during the faulty tests FS2 and FW2;
- fault 3: the cooling coil valve always kept closed (stuck at 0%) during the faulty tests FS3 and FW3;
- fault 4: the cooling coil valve always kept fully open (stuck at 100%) during the faulty tests FS4 and FW4;
- fault 5: the humidifier valve always kept closed (stuck at 0%) during the faulty tests FS5 and FW5.
The case of the humidifier being stuck at 100% has not been investigated due to the fact that it would lead to technical issues for the experimental set-up due to condensation phenomena, with the resulting risk of compromising the integrity of the devices and sensors of the laboratory.
During all the experiments, the pre-heating coil has always been manually de-activated and not operated.
All the parameters indicated in Table 3 have been measured at 1 s intervals during all normal and faulty tests.
4. Comparison of Boundary Conditions between Fault-Free and Faulty Tests
The normal tests (NS1–NS3 and NW1–NW5) have been assumed as references/baselines to be compared with the faulty tests (FS1–FS5 and FW1–FW5) in order to assess the impacts associated to the occurrence of the selected faults. The comparability of the fault-free experiments with respect to the faulty ones has been firstly verified by contrasting the boundary conditions of the tests in terms of outside air temperature (TOA) and outside air relative humidity (RHOA) by means of the following metrics:
where EXPOA,Baseline,i and EXPOA,Faulty,i are, respectively, the experimental values of TOA or RHOA at time step i under normal and faulty conditions, is the average difference, is the average absolute difference, RMSD is the root mean square difference, and N is the number of experimental data points.
εi = EXPOA,Baseline,i − EXPOA,Faulty,i
Figure 3 summarizes the values of , and RMSD obtained by comparing the most similar fault-free and faulty tests among the above-mentioned experiments in terms of TOA (Figure 3a) and RHOA (Figure 3b).
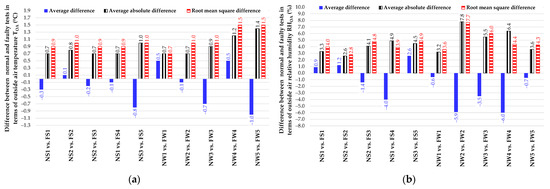
Figure 3.
Comparison of fault-free and faulty tests in terms of (a) outside air temperature TOA and (b) outside air relative humidity RHOA.
Figure 3 highlights how the values of , and RMSD are, respectively, at most −1.0, 1.4, 1.5 °C for TOA and −6.0, 7.8, 7.7% for RHOA. The data reported in this figure underline that the values of are always not larger than 1.5 °C with respect to TOA and not larger than 10.0% with respect to RHOA. In addition, it should be underlined that all the tests (normal and faulty) performed during summer were characterized by the same initial indoor air temperature (about 28 °C) and relative humidity (about 60%); similarly, all the experiments (normal and faulty) carried out during winter were characterized by the same initial indoor air temperature (about 18 °C) and relative humidity (about 60%). Additional details about the comparison in terms of boundary conditions between normal and faulty tests are reported in the Appendix B. According to the approach followed by Granderson et al. [20], the boundary conditions of the compared normal and faulty tests can be assumed as very similar based on the data reported in Figure 3. In more detail, it can be stated that:
- the fault-free test NS1 is comparable with both the faulty tests FS1 and FS4;
- the fault-free experiment NS2 is similar to both the faulty experiments FS2 and FS3;
- the fault-free test NS3 matches the faulty test FS5;
- the faulty test FW1 is similar to the fault-free test NW1;
- the faulty experiment FW2 is comparable with the fault-free test NW2;
- the fault-free test NW3 matches the faulty test FW3;
- the faulty experiment FW4 is similar to the fault-free test NW4;
- the fault-free test NW5 is comparable with the faulty test FW5.
Therefore, comparing the above-mentioned normal and faulty experiments allows for assessing the effects associated with the occurrence of the selected faults on the AHU performance.
5. Experimental Symptoms of Typical Faults on HVAC Performance
In this section, the normal and the corresponding/similar faulty tests are compared to highlight the impact of each investigated fault on the AHU behavior and performance. The comparison has been performed from different points of view: in Section 5.1, the effects of the selected faults on indoor thermal/hygrometric conditions are discussed; Section 5.2 analyzes the fault impact in terms of patterns of key operational parameters as well as symptom occurrence probability.
5.1. Effects of Faults on Thermal and Hygrometric Comfort
Figure 4a reports the percentage of time (indicated as thermal or hygrometric comfort time) during which the indoor air temperature or indoor air relative humidity are kept within the given deadbands for each normal and associated faulty test. Figure 4b reports the thermal discomfort relevance and the hygrometric discomfort relevance calculated based on the measured data via the following equations:
where:
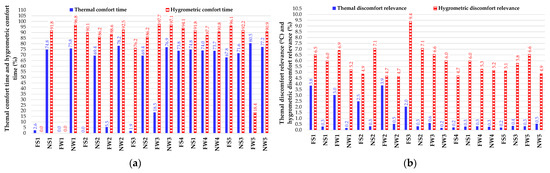
Figure 4.
(a) Thermal/hygrometric comfort time, (b) Thermal/hygrometric discomfort relevance as a function of the tests.
- ΔTout,DBT is the difference between the actual return air temperature TRA and the corresponding upper deadband UDBT or lower deadband LDBT, calculated only in the cases where TRA falls out of its deadbands;
- ΔRHout,DBRH is the difference between the actual return air relative humidity RHRA and the corresponding upper deadband UDBRH or lower deadband LDBRH, calculated only when RHRA falls out of its deadbands;
- Nout,DBT and Nout,DBRH are the number of experimental data points where TRA and RHRA are out of the corresponding deadbands, respectively.
Figure 5 shows the percentage comfort time difference (%DCT) between each normal and corresponding faulty test, calculated as follows:
where CTBaseline and CTFaulty represent the comfort time under normal and faulty conditions, respectively (i.e., the test period during which the indoor air temperature and relative humidity are kept within the given deadbands). A positive value of these parameters indicates that the hours of comfort associated with the faulty test are lower than the corresponding normal test (and vice versa).
%DCT = CTBaseline − CTFaulty
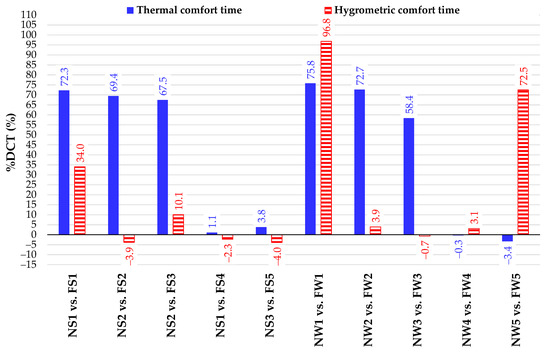
Figure 5.
Difference between normal and faulty tests in terms of thermal and hygrometric comfort time.
Figure 4a also highlights that during the normal tests the percentage of comfort time is lower than 100%: this is justified considering that (i) the values of return air temperature and return air relative humidity are initially different with respect to the target values, and (ii) during start-up phases, the AHU operates under transient conditions with reduced performance with respect to the steady-state operation.
The analysis of the results underlines that, when the post-heating valve is kept fully closed (i.e., fault 1) or fully open (i.e., fault 2), the indoor temperature control becomes very poor during both summer and winter, with a thermal discomfort relevance always higher than 2.5 °C (Figure 4b). The control of indoor air relative humidity is very marginally affected (−3.9% and +3.9% during summer and winter, respectively) when the post-heating coil valve is always kept fully-open (i.e., fault 2) due to the fact that the cooling capacity of the system is not fully able to reduce the return air temperature as required (Figure 5). However, when the post-heating valve is kept in the fully-closed position (i.e., fault 1), the hygrometric comfort time is strongly reduced by 34% during summer and by more than 96% during winter (Figure 5).
In the case of the cooling coil valve always being kept fully closed (i.e., fault 3), the control of indoor air temperature is strongly reduced with a value of %DCT higher than 67% during summer and 58% during winter (Figure 5); however, the thermal discomfort relevance is consistent during summer (equal to 2.0 °C), while it is negligible (equal to 0.6 °C) during winter (Figure 4b). The relative humidity control during summer is also affected by fault 3, with a hygrometric comfort time decreased by about 10% (Figure 5), while during winter its effect is negligible. The magnitude of hygrometric discomfort relevance is about 9.4% during summer (Figure 4b).
Fault 4 (i.e., the cooling coil valve is always kept fully open) shows a negligible effect on both indoor air temperature and indoor air relative humidity control, considering that the operation of the heating coil and the humidifier counterbalance the continuous activation of the cooling coil (according to the control logic of the investigated AHU).
Finally, the fault related to the humidifier valve (i.e., fault 5) marginally affects the indoor air temperature and relative humidity control during summer because of the fact that the operating time of the humidifier during the normal experiment is small with respect to the entire test duration, while during winter it significantly reduces the hygrometric comfort time with %DCT = 72.5% (Figure 5).
According to [45], a system is fault-tolerant if it may be subject to a fault, but the system remains satisfying its designated goal. The data reported in Figure 5 denoted that the investigated AHU could be considered as fault-tolerant with reference to the fault F4 (cooling coil valve always kept fully open) during both the analyzed summer and winter load conditions, taking into account that the parameter %DCT is negligible and, therefore, the system is able to restore the indoor comfort conditions also in the case of faulty operation.
As indicated in Figure 5, the most adverse fault types in terms of thermal comfort time are the fault F1 (post-heating coil valve kept closed), the fault F2 (post-heating coil valve kept open) and the fault F3 (cooling coil valve kept closed) during both heating and cooling seasons. With reference to the hygrometric comfort time, the most unfavorable fault types correspond to the fault F1 during both summer and winter and the fault F5 (humidifier valve kept closed) during heating season only.
5.2. Effects of Faults on the Patterns of Key Operating Parameters and Evaluation of Symptom Probability
In this section, the experimental patterns of key operating variables measured during fault-free and faulty tests are evaluated, compared and discussed. In particular, the analysis has been performed with reference to the following 16 parameters: (1) return air temperature (TRA), (2) mixed air temperature (TMA), (3) air temperature at the outlet of the cooling coil (TA,out,CC), (4) air temperature at the outlet of the post-heating coil (TA,out,PostHC), (5) supply air temperature (TSA), (6) return air relative humidity (RHRA), (7) mixed air relative humidity (RHMA), (8) air relative humidity at the outlet of the cooling coil (RHA,out,CC), (9) air relative humidity at the outlet of the post-heating coil (RHA,out,PostHC), (10) supply air relative humidity (RHSA), (11) heat carrier fluid temperature at the cooling coil outlet (TF,out,CC), (12) heat carrier fluid temperature at the cooling coil inlet (TF,in,CC), (13) heat carrier fluid temperature at the post-heating coil outlet (TF,out,PostHC), (14) heat carrier fluid temperature at the post-heating coil inlet (TF,in,PostHC), (15) volumetric flow rate of heat carrier fluid entering the cooling coil () and (16) volumetric flow rate of heat carrier fluid entering the post-heating coil ().
According to [20,46], the above-mentioned key variables considered in this experimental study are easily available in practical AHUs and reflect measurements that are typically logged in building control systems that AFDD tools generally have access to.
The differences between the values of the AHU key operating parameters measured during the fault-free tests and the values measured during the corresponding faulty experiments are compared in Figure A3, Figure A4 and Figure A5 of Appendix C.
In this section, the analysis of patterns associated to the AHU key operating parameters has been carried out by evaluating both the arithmetic mean μ and the standard deviation σ assumed by each of the above-mentioned variables during both normal and faulty tests. This investigation has been performed with the aim of identifying the parameters allowing detection of the symptoms associated with the occurrence of the investigated faults by analyzing the difference between faulty and normal tests carried out under the same boundary conditions. This approach is fully consistent with that adopted in several scientific papers [18,30] with the aim of assessing symptom patterns according to various faults and boundary conditions. With reference to this point, Wen and Li [18] performed a fault impact analysis by comparing the fault-free and faulty operation of a variable-air-volume AHU during winter, spring and summer in Iowa (U.S.A.) in terms of both arithmetic mean and standard deviation of the most significant operational variables. According to [30], the symptom associated with a fault can be detected by comparing faulty and fault-free tests performed under similar operating conditions in the case of the absolute difference between each observation during faulty conditions EXPFaulty,i and the arithmetic mean of measurements under normal operation μBaseline is higher than the standard deviation associated with a fault-free scenario σBaseline based on the following equation:
where t is the threshold value that can be set equal to one (with a 68% confidence level) according to [30]; a lower threshold implies that smaller deviations of faulty observations from normal conditions can be classified as symptoms.
|EXPFaulty,i − μBaseline| > t · σBaseline
However, it should be underlined that fault symptom magnitude could also be affected by several factors such as climatic conditions and thermal/cooling loads as well as system control logic; thus, in this study the same fault type/severity has been investigated during both summer and winter. Figure 6 and Figure 7, respectively, report the values of the arithmetic mean and the standard deviation associated with the above-mentioned 16 key operating parameters measured in this study during normal and faulty experiments. The plots are organized according to the variable type; in particular, Figure 6a and Figure 7a correspond to the air temperature, Figure 6b and Figure 7b correspond to the water temperature, Figure 6c and Figure 7c correspond to the air relative humidity and Figure 6d and Figure 7d correspond to the water volumetric flow rate. Figure 6 and Figure 7 allow one to compare the corresponding normal and faulty tests performed under the same boundary conditions (NS1 vs. FS1, NS2 vs. FS2, NS2 vs. FS3, NS1 vs. FS4, NS3 vs. FS5, NW1 vs. FW1, NW2 vs. FW2, NW3 vs. FW3, NW4 vs. FW4, NW5 vs. FW5).
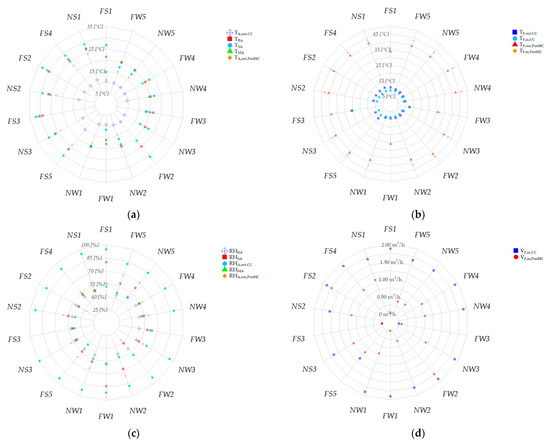
Figure 6.
Arithmetic means of (a) air temperature, (b) water temperature, (c) air relative humidity, and (d) water volumetric flow rate measured during faulty and normal tests.
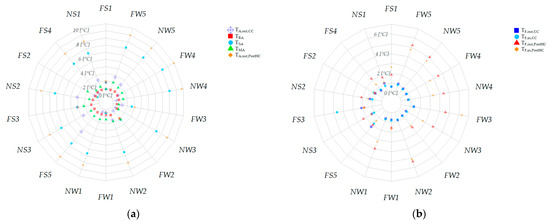
Figure 7.
Standard deviations of (a) air temperature, (b) water temperature, (c) air relative humidity, and (d) water volumetric flow rate measured during faulty and normal tests.
The analysis of the statistics clearly shows that when the post-heating coil valve is kept fully closed (i.e., fault 1, test NS1 vs. test FS1, test NW1 vs. test FW1) the distribution of TA,out,PostHC, TSA, TRA, RHA,out,PostHC and RHSA strongly changes during both summer and winter conditions (Figure 6a,c and Figure 7a,c); this is well described by the difference of the arithmetic mean and the standard deviation between normal and faulty tests, which assume significant values, especially for the temperature/relative humidity of both the air at the outlet of the post-heating coil and the supply air. In addition, the patterns of TF,out,PostHC, TF,in,PostHC and (Figure 6b,d and Figure 7b,d) strongly change during both summer and winter, due to the fact that the utilization of the post-heating coil is not allowed under faulty conditions.
In the case of the post-heating coil valve always being kept fully open (i.e., fault 2, test NS2 vs. test FS2, test NW2 vs. test FW2), both the arithmetic mean and the standard deviation of the temperature and relative humidity of both the air at the outlet of the post-heating coil and the supply air are subject to a strong variation during both summer and winter (Figure 6a,c and Figure 7a,c); in addition, the arithmetic mean of the return air temperature increases by more than 3 °C due to this faulty condition (Figure 6a); finally, it should be also underlined that the arithmetic mean of (Figure 6d) significantly changes during both the heating and cooling seasons.
The occurrence of fault 3 (i.e., the cooling coil valve always being kept fully closed, test NS2 vs. test FS3, test NW3 vs. test FW3) is particularly relevant in terms of variation of the arithmetic mean of TA,out,CC, TRA, TA,out,PostHC and TSA mainly during summer (Figure 6a); in addition, the standard deviation of the temperature of the air at the outlet of the post-heating coil and the supply air significantly decreases in comparison to the corresponding normal conditions during both the heating and cooling seasons (Figure 7a). As expected, the value of the arithmetic mean of RHA,out,CC during both summer and winter is strongly reduced (Figure 6c), while the standard deviation of the air relative humidity at the outlet of the post-heating coil during winter decreases from about 28% to about 8% (Figure 7c). As far as the heat carrier fluid is concerned, a strong variation of the arithmetic mean of TF,out,CC, TF,in,CC, TF,out,PostHC, TF,in,PostHC, and during both summer and winter can be observed (Figure 6b,d); the standard deviation of the water temperature at the inlet of the post-heating coil significantly increases during winter (Figure 7b), while the standard deviation of the water temperature at the inlet of the cooling coil is strongly enhanced during summer (Figure 7b) due to the fact that the faulty condition does not allow the operation of the cooling coil.
Fault 4 (i.e., the cooling coil valve always being kept fully open, test NS1 vs. FS4, test NW4 vs. test FW4) does not significantly affect the trends of the selected 16 key operating variables, considering that the post-heating coil (according to the control logic of the investigated AHU) is able to contrast the continuous operation of the cooling coil.
Finally, the occurrence of fault 5 (i.e., the humidifier valve always being kept fully closed, test NS3 vs. test FS5, test NW5 vs. test FW5) relevantly impacts on the arithmetic mean of TA,out,CC during summer (Figure 6a), taking into account that the dehumidification process is operated for a reduced period of time through the cooling coil.
Table 7 reports, for each operating variable and faulty condition, the Symptom Occurrence Probability (SOP) representing the time percentage of the testing period during which the condition specified by Equation (8) is verified. For each line of this table, the green shade has been assigned to the cells corresponding to the lowest values of SOP, while the largest values of SOP have been highlighted by red shades.
Table 7.
Symptom occurrence probability (SOP) as a function of tests and measured parameters.
As can be observed in Table 7 and Figure 6 and Figure 7, for each fault the highest values of SOP are assumed by the variables that showed large differences in terms of arithmetic mean and standard deviation between faulty and normal conditions.
When the post-heating coil valve is always kept fully open (i.e., fault 1), the temperature and relative humidity of return air, supply air, and air at the outlet of the post-heating coil assume high values of SOP, describing very well the occurrence of the symptom during both summer and winter. In addition, as expected during the occurrence of this fault, the volumetric flow rate of the heat carrier fluid entering the post-heating coil is associated with a SOP equal to 100%, while the temperature of the water entering and exiting the post-heating coil are characterized by a value of SOP greater than 97%.
The symptom associated with fault 2 (i.e., the post-heating coil valve kept always fully closed) is well described by the return and supply air temperature during both summer and winter conditions. During the heating season, the air temperature at the outlet of the post-heating coil, the temperature and relative humidity of return and supply air, as well as the temperature of the water entering and exiting the post-heating coil, also represent accurate descriptors of the fault occurrence.
The cooling coil valve being stuck at 0% (i.e., fault 3) leads the air temperature and relative humidity at the outlet of the cooling coil, the return air temperature, and the temperature of water entering and exiting the cooling coil to assume values that are always far from the fault-free baseline during both summer and winter, showing very high values of SOP. In addition, the measurements of the post-heating coil inlet water temperature during summer highlight a significant symptom occurrence probability.
When the cooling coil valve is always kept open (i.e., fault 4), none of the selected measured parameters are characterized by a relevant value of SOP; this is mainly due to the logic controlling the operation of the investigated AHU, where the activation of the cooling coil is counterbalanced by the operation of the post-heating coil during both faulty and fault-free conditions.
In the case of fault 5 (i.e., the humidifier valve is always kept closed), only the relative humidity of return air is significantly affected during winter by the fault occurrence (as indicated by a value of SOP larger than 84%).
5.3. Discussion
Figure 8, Figure 9, Figure 10 and Figure 11 summarize the intensity of the impacts related to each analysed fault in terms of thermal/hygrometric comfort time as well as key operating parameter patterns.
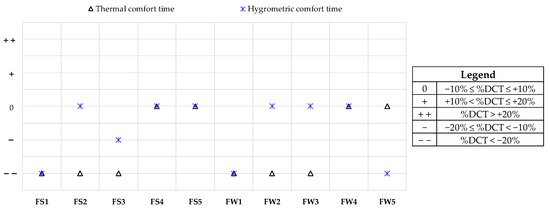
Figure 8.
Symptoms’ relevance to the selected faults in terms of thermal-hygrometric comfort.
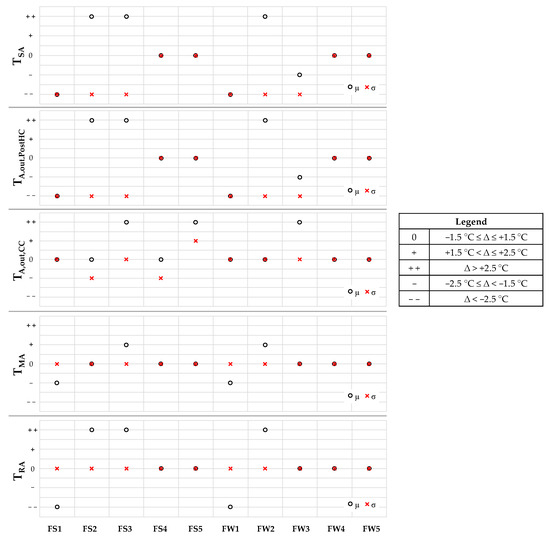
Figure 9.
Symptoms’ relevance to the selected faults in terms of air temperature.
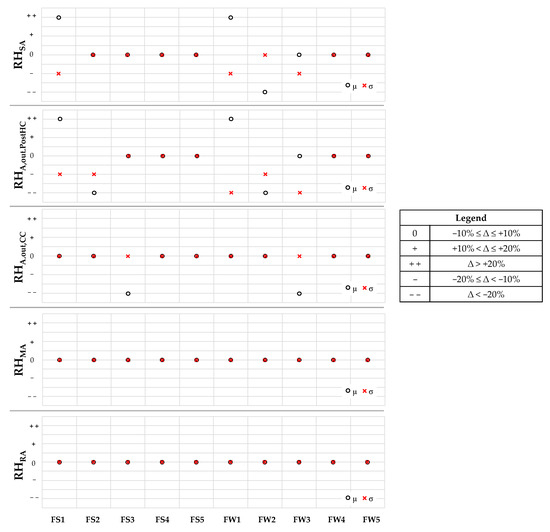
Figure 10.
Symptoms’ relevance to the selected faults in terms of air relative humidity.
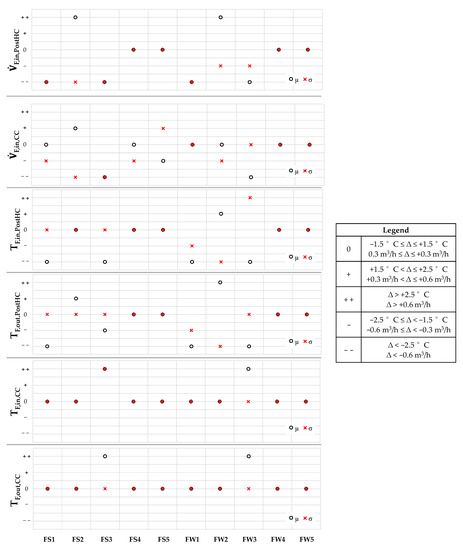
Figure 11.
Symptoms’ relevance to the selected faults in terms of heat carrier fluid parameters.
The impact intensity is reported for each fault according to the following qualitative scale, conceived to enhance the readability of the results obtained:
- “0” means that the fault causes no substantial changes;
- “+” means that the fault causes slightly positive changes;
- “+ +” means that the fault causes substantial positive changes;
- “-” means that the fault causes slightly negative changes;
- “- -” means that the fault causes substantial negative changes.
According to this scale, in particular Figure 8 refers to the thermal and hygrometric comfort time (ranked based on the parameter %DCT defined by Equation (7)), while Figure 9, Figure 10 and Figure 11 describe the symptoms’ relevance (specified in the associated legends) of the selected faults in terms of air temperature (Figure 9), air relative humidity (Figure 10) and heat carrier fluid parameters (Figure 11) according to the values assumed by the following parameter ∆:
where XFaulty and XBaseline represent the arithmetic mean μ, or the standard deviation σ calculated based on the measured values under faulty and normal conditions, respectively.
∆ = XFaulty − XBaseline
6. Conclusions
The effects of five typical faults of AHUs have been assessed in terms of thermal/hygrometric indoor comfort time and trends of key operating parameters, in order to help building operators and facility engineers in recognizing different fault patterns and identifying faults of AHUs; the assessment has been performed by contrasting experimental data associated with fault-free and faulty tests carried out during both the summer and winter of southern Italy under similar boundary conditions.
The experimental data highlighted that the most adverse fault types in terms of thermal comfort time are fault F1 (post-heating coil valve kept closed), fault F2 (post-heating coil valve kept open) and fault F3 (cooling coil valve kept closed) during both the heating and cooling seasons. With reference to the hygrometric comfort time, the most unfavorable fault types correspond to fault F1 during both summer and winter and fault F5 (humidifier valve kept closed) during heating season only.
The Symptom Occurrence Probability (SOP) values, calculated based on the measured data, denoted that both the fault corresponding to the post-heating coil valve being kept closed (F1) and the fault corresponding to the cooling coil valve being kept closed (F3) represent the fault types more significantly influencing the most important AHU key operating parameters during both the heating and cooling seasons.
The curated database will be uploaded in a public data repository, allowing its exploitation for research and institutional purposes by research organizations, AFDD users and AFDD developers.
In the future, the authors would like to extend the presented experimental database by considering different types of faults (including the cases of multiple simultaneous faults), additional faults’ severities and broader range of operating conditions. Moreover, the consistency between fault-free and faulty tests will be further investigated by introducing a data compensation method to take into account the discrepancy in terms of boundary conditions (i.e., outside air temperature and relative humidity). In addition, a detailed dynamic simulation model of the investigated AHU will be developed and verified against the fault-free and faulty experimental data; this tool will allow exploration of a larger variety of faulty scenarios under wider operational scenarios. Finally, the authors would like to develop and validate an innovative data-driven algorithm customized on the experimental results for performing AFDD analyses on typical AHUs.
Author Contributions
Conceptualization, A.R., F.G., A.C. and L.M.; methodology, A.R., F.G., A.C. and L.M.; software, A.R., F.G. and M.E.Y.; validation, A.R., F.G. and M.E.Y.; formal analysis, A.R., F.G., M.E.Y., A.C. and L.M.; investigation, A.R., F.G. and M.E.Y.; resources, A.R., M.M. and L.M.; data curation, A.R., F.G., M.E.Y. and A.C.; writing—original draft preparation, A.R., F.G., M.E.Y., A.C., M.M. and L.M.; writing—review and editing, A.R., F.G., M.E.Y., A.C., M.M. and L.M.; visualization, A.R., F.G. and A.C.; supervision, A.R., M.M. and L.M.; project administration, A.R., M.M. and L.M.; funding acquisition, A.R., M.M. and L.M. All authors have read and agreed to the published version of the manuscript.
Funding
This research received no external funding.
Institutional Review Board Statement
Not applicable.
Informed Consent Statement
Not applicable.
Data Availability Statement
Data will be made available by the authors in a publicly accessible repository.
Acknowledgments
This work was undertaken as part of the program “PON FSE-FESR Ricerca e Innovazione 2014–2020” of the Italian Ministry of Education, University and Research, Action I.1 “Dottorati innovativi con caratterizzazione industriale”. The authors would like to thank the company Belimo (https://www.belimo.com/ accessed on 1 September 2022) for supporting the research activities described in this paper by means of its energy valves.
Conflicts of Interest
The authors declare no conflict of interest.
Nomenclature
| Latin letters | |
| AFDD | Automatic fault detection and diagnosis |
| AHU | Air-handling unit |
| CC | Cooling coil |
| CT | Cold tank |
| CTBaseline | Comfort time of normal experimental tests |
| CTFaulty | Comfort time of faulty experimental tests |
| DBRH | Deadband of RHSP,Room (%) |
| DBT | Deadband of TSP,Room (°C) |
| DEA | Exhaust air damper |
| DOA | Outside air damper |
| DHRS | Damper of the heat recovery system |
| DRA | Return air damper |
| EA | Exhaust air |
| EXPOA,Baseline,i | Experimental value of TOA or ROA at time step i under fault-free conditions (°C) |
| EXPOA,Faulty,i | Experimental value of TOA or ROA at time step i under faulty conditions (°C) |
| EXPFaulty,i | Experimental value at time step i under faulty conditions |
| FS1 | Faulty test with the post-heating coil valve always kept closed during summer |
| FS2 | Faulty test with the post-heating coil valve always kept open during summer |
| FS3 | Faulty test with the cooling coil valve always kept closed during summer |
| FS4 | Faulty test with the cooling coil valve always kept open during summer |
| FS5 | Faulty test with the humidifier valve always kept closed during summer |
| FW1 | Faulty test with the post-heating coil valve always kept closed during winter |
| FW2 | Faulty test with the post-heating coil valve always kept open during winter |
| FW3 | Faulty test with the cooling coil valve always kept closed during winter |
| FW4 | Faulty test with the cooling coil valve always kept open during winter |
| FW5 | Faulty test with the humidifier valve always kept closed during winter |
| GHG | Greenhouse gas |
| HP | Heat pump |
| HRS | Static cross-flow heat recovery system |
| HT | Hot tank |
| HUM | Humidifier |
| HVAC | Heating, Ventilation and Air-Conditioning |
| LDBRH | Lower deadband of indoor air relative humidity (%) |
| LDBT | Lower deadband in indoor air temperature (°C) |
| N | Number of experimental data points |
| NS1 | Normal summer test n°1 |
| NS2 | Normal summer test n°2 |
| NS3 | Normal summer test n°3 |
| NW1 | Normal winter test n°1 |
| NW2 | Normal winter test n°2 |
| NW3 | Normal winter test n°3 |
| NW4 | Normal winter test n°4 |
| NW5 | Normal winter test n°5 |
| Nout,DBT | Number of experimental data points with TRA out of the corresponding deadband |
| Nout,DBRH | Number of experimental data points with RHRA out of the corresponding deadband |
| OAD | Outside air duct |
| OAFil | Outside air filter |
| OLRAF | Velocity of the return air fan (%) |
| OLSAF | Velocity of the supply air fan (%) |
| OPDEA | Opening percentage of the DEA (%) |
| OPDHRS | Opening percentage of the DHRS (%) |
| OPDOA | Opening percentage of the DOA (%) |
| OPDRA | Opening percentage of the DRA (%) |
| OPV_CC | Opening percentage of valve regulating the flow entering the CC (%) |
| OPV_HUM | Opening percentage of valve regulating the flow exiting the HUM (%) |
| OPV_PostHC | Opening percentage of valve regulating the flow entering the PostHC (%) |
| OPV_PreHC | Opening percentage of valve regulating the flow entering the PreHC (%) |
| PID | Proportional-integral-derivative |
| PostHC | Post-heating coil |
| PreHC | Pre-heating coil |
| RAD | Return air duct |
| RAF | Return air fan |
| RAFil | Return air filter |
| RAV | Return air vent |
| RHA,out,CC | Cooling coil outlet air relative humidity (%) |
| RHA,out,CC,Baseline | Measured cooling coil outlet air relative humidity under fault-free conditions (%) |
| RHA,out,CC,Faulty | Measured cooling coil outlet air relative humidity under faulty conditions (%) |
| RHA,out,PostHC | Post-heating coil outlet air relative humidity (%) |
| RHA,out,PostHC,Baseline | Measured post-heating coil outlet air relative humidity under fault-free conditions (%) |
| RHA,out,PostHC,Faulty | Measured post-heating coil outlet air relative humidity under faulty conditions (%) |
| RHMA | Mixed air relative humidity (%) |
| RHMA,Baseline | Measured mixed air relative humidity under fault-free conditions (%) |
| RHMA,Faulty | Measured mixed air relative humidity under faulty conditions (%) |
| RHOA | Outside air relative humidity (%) |
| RHRA | Return air relative humidity (%) |
| RHRA,Baseline | Measured return air relative humidity under fault-free conditions (%) |
| RHRA,initial | Initial indoor return air relative humidity (%) |
| RHRA,Faulty | Measured return air relative humidity under faulty conditions (%) |
| RHRoom | Air relative humidity inside the integrated test room (%) |
| RHSA | Supply air relative humidity (%) |
| RHSA,Baseline | Measured supply air relative humidity under fault-free conditions (%) |
| RHSA,Faulty | Measured supply air relative humidity under faulty conditions (%) |
| RHSP,Room | Desired target of indoor air relative humidity (%) |
| RMSD | Root mean square difference (°C/%) |
| RS | Refrigerating system |
| SAD | Supply air duct |
| SAF | Supply air fan |
| SAFil | Supply air filter |
| SAV | Supply air vent |
| SOP | Symptom Occurrence Probability (%) |
| t | Threshold value (equal to one) |
| TA,out,CC | Air temperature at the outlet of the cooling coil (°C) |
| TA,out,CC,Baseline | Measured air temperature at the outlet of the cooling coil under fault-free conditions (°C) |
| TA,out,CC,Faulty | Measured air temperature at the outlet of the cooling coil under faulty conditions (°C) |
| TA,out,PostHC | Air temperature at the outlet of the post-heating coil (°C) |
| TA,out,PostHC,Baseline | Measured air temperature at the outlet of the post-heating coil under fault-free conditions (°C) |
| TA,out,PostHC,Faulty | Measured air temperature at the outlet of the post-heating coil under faulty conditions (°C) |
| TCT | Heat carrier fluid temperature inside the cold tank (°C) |
| TCT,set-point | Target temperature of heat carrier fluid temperature inside the cold tank (°C) |
| TF,in,CC | Heat carrier fluid temperature at cooling coil inlet (°C) |
| TF,in,HP | Heat carrier fluid temperature at heat pump outlet (°C) |
| TF,in,PostHC | Heat carrier fluid temperature at post-heating coil inlet (°C) |
| TF,in,PostHC,Baseline | Heat carrier fluid temperature at post-heating coil inlet under fault-free conditions (°C) |
| TF,in,PostHC,Faulty | Heat carrier fluid temperature at post-heating coil inlet under faulty conditions (°C) |
| TF,in,PreHC | Heat carrier fluid temperature at pre-heating coil inlet (°C) |
| TF,in,RS | Heat carrier fluid temperature at refrigerating system inlet (°C) |
| TF,out,CC | Heat carrier fluid temperature at cooling coil outlet (°C) |
| TF,out,CC,Baseline | Heat carrier fluid temperature at cooling coil outlet under fault-free conditions (°C) |
| TF,out,CC,Faulty | Heat carrier fluid temperature at cooling coil outlet under faulty conditions (°C) |
| TF,out,HP | Heat carrier fluid temperature at heat pump outlet (°C) |
| TF,out,PostHC | Heat carrier fluid temperature at post-heating coil outlet (°C) |
| TF,out,PostHC,Baseline | Heat carrier fluid temperature at post-heating coil outlet under fault-free conditions (°C) |
| TF,out,PostHC,Faulty | Heat carrier fluid temperature at post-heating coil outlet under faulty conditions (°C) |
| TF,out,PreHC | Heat carrier fluid temperature at pre-heating coil outlet (°C) |
| TF,out,RS | Heat carrier fluid temperature at refrigerating system outlet (°C) |
| THT | Heat carrier fluid temperature inside the hot tank (°C) |
| THT,set-point | Target temperature of heat carrier fluid temperature inside the hot tank (°C) |
| TMA | Mixed air temperature (°C) |
| TMA,Baseline | Measured mixed air temperature under fault-free conditions (°C) |
| TMA,Faulty | Measured mixed air temperature under faulty conditions (°C) |
| TOA | Outside air temperature (°C) |
| TRA | Return air temperature (°C) |
| TRA,Baseline | Measured return air temperature under fault-free conditions (°C) |
| TRA,initial | Initial return air temperature (°C) |
| TRA,Faulty | Measured return air temperature under faulty conditions (°C) |
| TRoom | Air temperature inside the integrated test room (°C) |
| TSA | Supply air temperature (°C) |
| TSA,Baseline | Measured supply air temperature under fault-free conditions (°C) |
| TSA,Faulty | Measured supply air temperature under faulty conditions (°C) |
| TSP,Room | Desired target of indoor air temperature (°C) |
| UDBRH | Upper deadband of indoor air relative humidity (%) |
| UDBT | Upper deadband of indoor air temperature (°C) |
| VAV | Variable air volume |
| VCC | Three-way valves supplying the cooling coil |
| VHUM | Three-way valve supplying the humidifier |
| VPostHC | Three-way valve supplying the post-heating coil |
| VPreHC | Three-way valve supplying the pre-heating coil |
| Volumetric flow rate of heat carrier fluid entering the cooling coil (m3/h) | |
| Volumetric flow rate of heat carrier fluid entering the cooling coil under fault-free conditions (m3/h) | |
| Volumetric flow rate of heat carrier fluid entering the cooling coil under faulty conditions (m3/h) | |
| Volumetric flow rate of heat carrier fluid entering the post-heating coil (m3/h) | |
| Volumetric flow rate of heat carrier fluid entering the post-heating coil under fault-free conditions (m3/h) | |
| Volumetric flow rate of heat carrier fluid entering the post-heating coil under faulty conditions (m3/h) | |
| Volumetric flow rate of heat carrier fluid entering the pre-heating coil (m3/h) | |
| XBaseline | Arithmetic mean m or standard deviation s calculated based on the measured values under normal conditions |
| XFaulty | Arithmetic mean m or standard deviation s calculated based on the measured values under faulty conditions |
| ∆RHout,DBT | Difference between RHRA and UDBRH calculated in the case of RHRA is larger than UDBRH, or the difference between LDBRH and RHRA in the case of RHRA is lower than LDBRH |
| ∆Tout,DBRH | Difference between RHRA and UDBRH calculated in the case of RHRA is larger than UDBRH, or the difference between LDBRH and RHRA in the case of RHRA is lower than LDBRH |
| ∆Tout,DBT | Difference between TRA and UDBT calculated in the case of TRA is larger than UDBT, or the difference between LDBT and TRA in the case of TRA is lower than LDBT |
| %DCT | Percentage comfort time difference (%) |
| %VGlycol,PreHC | Percentage by volume of glycol in the heat carrier fluid entering the PreHC |
| %VGlycol,CC | Percentage by volume of glycol in the heat carrier fluid entering the CC |
| %VGlycol,PostHC | Percentage by volume of glycol in the heat carrier fluid entering the PostHC |
| Greek | |
| ∆ | Difference |
| εi | Instantaneous difference (°C/%) |
| Average error (°C/%) | |
| Absolute average error (°C/%) | |
| Intensity of thermal discomfort time (°C) | |
| Intensity of hygrometric discomfort time (%) | |
| μ | Arithmetic mean (°C/%) |
| σ | Standard deviation (°C/%) |
| μBaseline | Arithmetic mean under normal conditions (°C/%) |
| σBaseline | Standard deviation under normal conditions (°C/%) |
Appendix A
The logic controlling the AHU operation is detailed in this Appendix.
As reported in the manuscript, a specifically-devoted control logic has been developed and implemented in order to operate the AHU for AFDD purposes. In particular, at the beginning of the tests, the following parameters are manually set (and they can be eventually modified during the test) by the end-users: (i) the desired targets of both indoor air temperature (TSP,Room) and relative humidity (RHSP,Room) to be achieved inside the integrated test room; (ii) the deadbands DBT and DBRH of both TSP,Room and RHSP,Room, respectively; (iii) the velocity (between 0% and 100%) of both the return air fan (OLRAF) and the supply air fan (OLSAF); (iv) the opening percentages (between 0% and 100%) of the return air damper (OPDRA), the outside air damper (OPDOA) and the exhaust air damper (OPDEA); (v) the activation/deactivation of the static heat-recovery system damper by means of the opening percentage of the heat-recovery system damper (OPDHRS).
Once the previous parameters are manually set by the end-users:
- the refrigeration machine operates to maintain a temperature TCT equal to TCT,set-point (with a deadband of 1 °C) inside the 75 L cold tank, while the heat pump is activated in order to achieve a temperature THT equal to THT,set-point (with a deadband of 1 °C) inside the 75 L hot tank;
- the desired return air temperature and relative humidity are kept at a chosen set-point (with defined deadbands) by regulating both the supply air temperature and the supply air relative humidity, while maintaining a constant air flow rate to the room;
- PID (proportional-integral-derivative) controllers automatically adjust (in the range 0–100%) the opening percentages of the valves (OPV_PreHC, OPV_PostHC, OPV_CC and OPV_HUM) supplying the pre-heating coil, the post-heating coil, the cooling coil and the humidifier, respectively, with the aim of achieving the desired targets inside the test room;
- if the actual return air temperature TRA is beyond the upper deadband UDBT of the indoor air temperature set-point TSP,Room (UDBT = TSP,Room + DBT), the cooling coil valve PID loop is enabled and the cooling coil valve position is controlled in the range 0–100% by the cooling coil valve controller PID output in order to achieve the lower deadband LDBT (LDBT = TSP,Room − DBT) of the indoor air temperature set-point thanks to the reduction of supply air temperature; once this desired temperature level is reached, the post-heating coil is activated in order to increase the return air temperature up to the UDBT by enhancing the supply air temperature; then, the cooling coil is activated again in order to reach the LDBT and so forth; therefore, the HVAC system aims to maintain the return air temperature between LDBT and UDBT, whatever the season is;
- when the actual return air temperature TRA falls below the LDBT, the cooling coil valve PID loop is disabled and the cooling coil valve is fully closed, except in the case when the indoor relative humidity has to be reduced;
- in the case of the actual return air temperature TRA falling below the LDBT, the heating coil valve PID loop is enabled and the heating coil valve position is regulated between 0 and 100% by the heating coil valve controller PID output in order to achieve a temperature level equal to the UDBT by increasing the supply air temperature; once this desired temperature level is reached, the cooling coil is activated in order to reduce the return air temperature down to the LDBT by lowering the supply air temperature; then, the heating coil is activated again in order to reach the UDBT and so forth; therefore, the HVAC system aims to maintain the return air temperature between LDBT and UDBT, whatever the season is;
- when the actual return air temperature TRA is beyond the UDBT, the heating coil valve PID loop is disabled and the heating coil valve is fully closed;
- in the case of the actual return air relative humidity RHRA being beyond the upper deadband UDBRH of the indoor air relative humidity set-point RHSP,Room (UDBRH = RHSP,Room + DBRH), the cooling coil valve PID loop is enabled and the cooling coil valve position is managed in the range 0–100% by the cooling coil valve controller PID output in order to achieve the lower deadband LDBRH of the indoor air relative humidity set-point RHSP,Room (LDBRH = RHSP,Room − DBRH); once this relative humidity is reached, the humidifier valve PID loop is enabled and the humidifier valve position is varied in the range 0-100% by the humidifier valve controller PID in order to increase the return air relative humidity up to the UDBRH; then, the cooling coil is activated again in order to reach the LDBRH and so forth; therefore, the HVAC system aims to maintain the return air relative humidity between LDBRH and UDBRH, whatever the season is;
- if the actual return air relative humidity RHRA falls below the LDBRH, the humidifier valve PID loop is enabled and the humidifier valve position is controlled between 0 and 100% by the humidifier valve controller PID output with the aim of achieving an indoor air relative humidity level equal to the UDBRH while the cooling coil valve PID loop is disabled and the cooling coil valve is fully closed (except in the case when the indoor air temperature has to be reduced); once this relative humidity level is achieved, the cooling coil is activated in order to reduce the return air relative humidity down to the level LDBRH; then, the humidifier is activated again in order to reach the indoor air relative humidity of UDBRH and so forth; therefore, the HVAC system aims to keep the return air relative humidity between LDBRH and UDBRH, whatever the season is;
- if both (i) the actual return air temperature TRA is beyond the upper deadband UDBT and (ii) the actual return air relative humidity RHRA is beyond the upper deadband UDBRH, the control of return air relative humidity has priority and, therefore, the cooling coil valve PID loop is enabled and the cooling coil valve position is operated via the PID to firstly achieve the lower deadband LDBRH; once this lower deadband LDBRH is obtained, the cooling coil valve PID loop is still enabled with the aim of reaching the lower deadband LDBT only in the case of the actual return air temperature TRA still being beyond the upper deadband UDBT (otherwise the cooling coil loop is disabled).
However, alternatively the end-users are allowed to alter the components’ operation/control logic based on specific research purposes by manually forcing (at the beginning of or during the tests) the opening percentages of the valves in order to keep the desired user-defined positions. In addition, the end-users can manually vary the velocity of both supply and return air fans between 0% and 100%. Similarly, the parameters OPDRA, OPDOA and OPDEA can be artificially forced in the range 0–100%, where 100% means that the damper is fully open. The parameter OPDHRS can be set to 100% (no heat recovery) or 0% (heat recovery takes place).
Appendix B
The experimental trends of outside air temperature and outside air relative humidity during the entire duration of normal and faulty tests (running from 9 a.m. up to 6 p.m.) are shown in Figure A1a–d; as indicated in these figures, outside air temperature ranges from a minimum of 22.2 °C up to a maximum of 38.3 °C during summer (Figure A1a) and from a minimum of 7.2 °C up to a maximum of 24.9 °C during winter (Figure A1b), while outside air relative humidity varies in the range of 22.4–74.8% during summer (Figure A1c) and in the range of 21.9–90.3% during winter (Figure A1d).
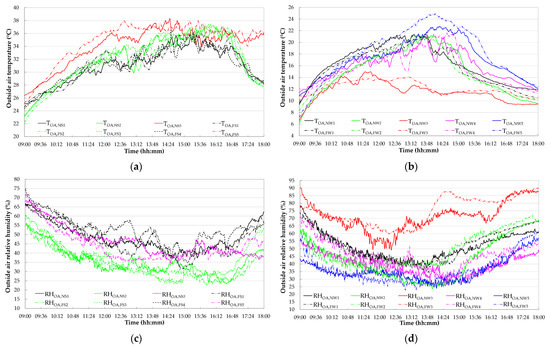
Figure A1.
Measured values of TOA during summer tests (a), measured values of TOA during winter tests (b), measured values of RHOA during summer tests (c), measured values of RHOA during winter tests (d).
The boundary conditions of the normal tests (baselines) have been compared with the corresponding/similar faulty experiments in Figure A2a–j from a qualitative point of view in terms of outside air temperature (TOA), outside air relative humidity (RHOA), initial indoor air temperature (TRA,initial) and initial indoor air relative humidity (RHRA,initial) in order to assess their similarity. In particular, Figure A2a compares the tests NS1 and FS1, Figure A2b compares the tests NS2 and FS2, Figure A2c compares the tests NS2 and FS3, Figure A2d compares the tests NS1 and FS4, Figure A2e compares the test NS3 and FS5, Figure A2f compares the tests NW1 and FW1, Figure A2g compares the tests NW2 and FW2, Figure A2h compares the tests NW3 and FW3, Figure A2i compares the tests NW4 and FW4 and Figure A2j compares the tests NW5 and FW5.
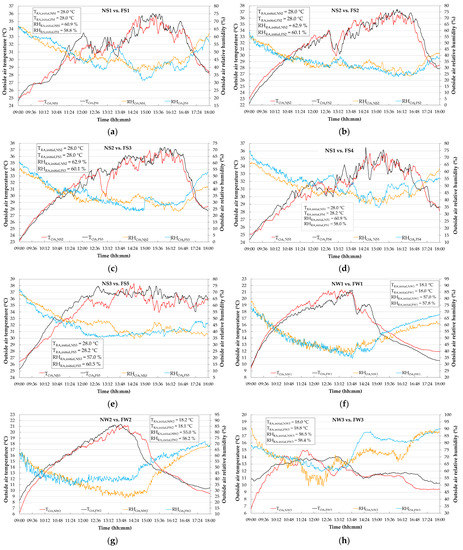
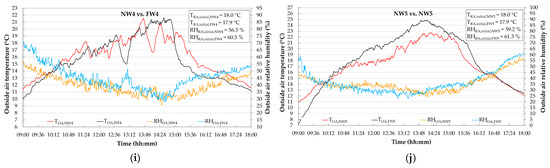
Figure A2.
Comparison of normal and faulty tests in terms of TOA, RHOA and indoor initial conditions: comparison between NS1 and FS1 (a), NS2 and FS2 (b), NS2 and FS3 (c), NS1 and FS4 (d), NS3 and FS5 (e), NW1 and FW1 (f), NW2 and FW2 (g), NW3 and FW3 (h), NW4 and FW4 (i) and NW5 and FW5 (j).
Appendix C
In Figure A3, Figure A4 and Figure A5, the experimental trends of AHU key operating parameters measured during both the fault-free and faulty tests have been compared. The following parameters/residuals have been calculated according to the experimental data and reported in the above-mentioned figures as a function of the time in order to better highlight the results of the comparison:
where TRA,Baseline, TMA,Baseline, TA,out,CC,Baseline, TA,out,PostHC,Baseline, TSA,Baseline, RHRA,Baseline, RHMA,Baseline, RHA,out,CC,Baseline, RHA,out,PostHC,Baseline, RHSA,Baseline, TF,out,CC,Baseline, TF,in,CC,Baseline, TF,out,PostHC,Baseline, TF,in,PostHC,Baseline, and are the values measured during the normal operation (baselines), while TRA,Faulty, TMA,Faulty, TA,out,CC,Faulty, TA,out,PostHC,Faulty, TSA,Faulty, RHRA,Faulty, RHMA,Faulty, RHA,out,CC,Faulty, RHA,out,PostHC,Faulty, RHSA,Faulty, TF,out,CC,Faulty, TF,in,CC,Faulty, TF,out,PostHC,Faulty, TF,in,PostHC,Faulty, and represent the values measured in the case of fault occurrence. In more detail, Figure A3 compares the faulty and fault-free tests in terms of ∆TRA, ∆TMA, ∆TA,out,CC, ∆TA,out,PostHC and ∆TSA (Equations (A1)–(A5)); Figure A4 compares the faulty and fault-free tests in terms of ∆RHRA, ∆RHMA, ∆RHA,out,CC, ∆RHA,out,PostHC and ∆RHSA (Equations (A6)–(A10)); Figure A5 compares the faulty and fault-free tests in terms of ∆TF,out,CC, ∆TF,in,CC, ∆TF,out,PostHC, ∆TF,in,PostHC, and (Equations (A11)–(A16)). In order to facilitate the readability of the figures and the comparison among them, the same range of values on the vertical axes of all Figure A3a–j, Figure A4a–j and Figure A5a–j was adopted.
∆TRA = TRA,Baseline − TRA,Faulty
∆TMA = TMA,Baseline − TMA,Faulty
∆TA,out,CC = TA,out,CC,Baseline − TA,out,CC,Faulty
∆TA,out,PostHC = TA,out,PostHC,Baseline − TA,out,PostHC,Faulty
∆TSA = TSA,Baseline − TSA,Faulty
∆RHRA = RHRA,Baseline − RHRA,Faulty
∆RHMA = RHMA,Baseline − RHMA,Faulty
∆RHA,out,CC = RH A,out,CC,Baseline − RHA,out,CC,Faulty
∆RHA,out,PostHC = RHA,out, PostHC,Baseline − RHA,out, PostHC,Faulty
∆RHSA = RHSA,Baseline − RHSA,Faulty
∆TF,out,CC = TF,out,CC,Baseline − TF,out,CC,Faulty
∆TF,in,CC = TF,in,CC,Baseline − TF,in,CC,Faulty
∆TF,out,PostHC = TF,out, PostHC,Baseline − TF,out, PostHC,Faulty
∆TF,in,PostHC = TF,in, PostHC,Baseline − TF,in, PostHC,Faulty
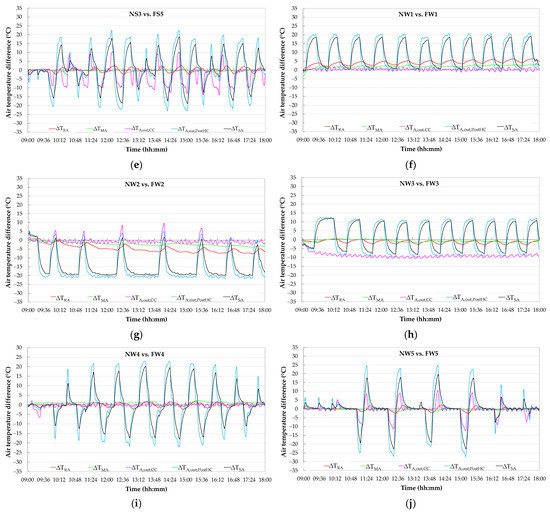
Figure A3.
Comparison of faulty and fault-free tests in terms of ∆TRA, ∆TMA, ∆TA,out,CC, ∆TA,out,PostHC and ∆TSA (Equations (A1)–(A5)): comparison between NS1 and FS1 (a), NS2 and FS2 (b), NS2 and FS3 (c), NS1 and FS4 (d), NS3 and FS5 (e), NW1 and FW1 (f), NW2 and FW2 (g), NW3 and FW3 (h), NW4 and FW4 (i), NW5 and FW5 (j).
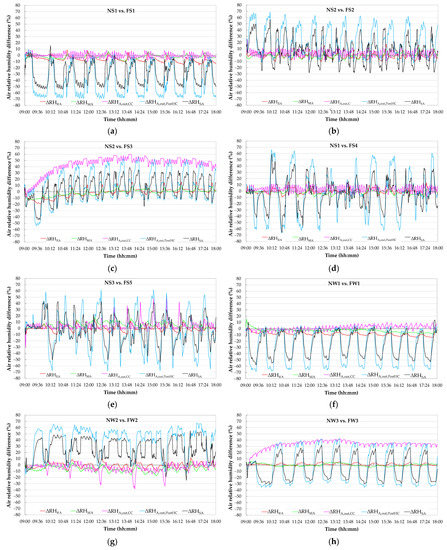
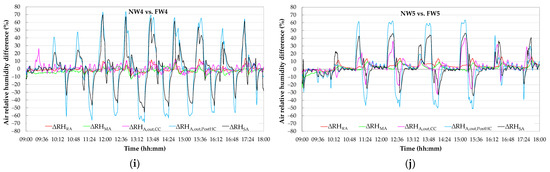
Figure A4.
Comparison of faulty and fault-free tests in terms of ∆RHRA, ∆RHMA, ∆RHA,out,CC, ∆RHA,out,PostHC and ∆RHSA (Equations (A6)–(A10)): comparison between NS1 and FS1 (a), NS2 and FS2 (b), NS2 and FS3 (c), NS1 and FS4 (d), NS3 and FS5 (e), NW1 and FW1 (f), NW2 and FW2 (g), NW3 and FW3 (h), NW4 and FW4 (i), NW5 and FW5 (j).
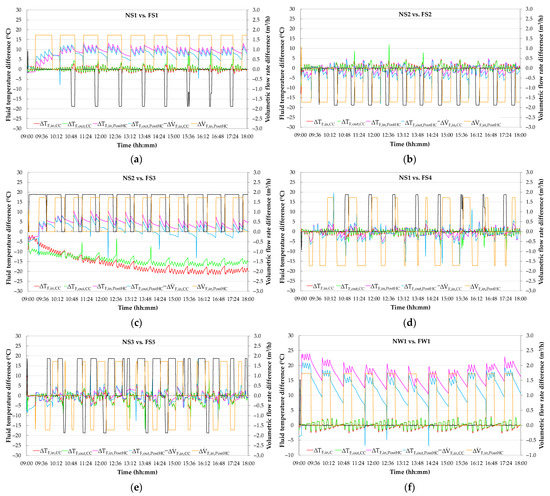
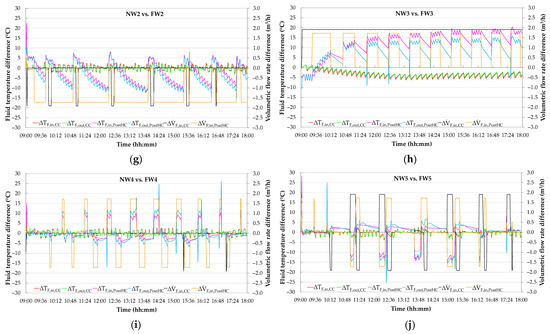
Figure A5.
Comparison of faulty and fault-free tests in terms of ∆TF,out,CC, ∆TF,in,CC, ∆TF,out,PostHC, ∆TF,in,PostHC, and (Equations (A11)–(A16)): comparison between NS1 and FS1 (a), NS2 and FS2 (b), NS2 and FS3 (c), NS1 and FS4 (d), NS3 and FS5 (e), NW1 and FW1 (f), NW2 and FW2 (g), NW3 and FW3 (h), NW4 and FW4 (i), NW5 and FW5 (j).
References
- 2021 Global Status Report for Buildings and Construction. Towards a Zero-Emission, Efficient and Resilient Buildings and Construction Sector. Available online: https://globalabc.org/sites/default/files/2021-10/GABC_Buildings-GSR-2021_BOOK.pdf (accessed on 1 August 2022).
- Cao, X.; Dai, X.; Liu, J. Building energy-consumption status worldwide and the state-of-the-art technologies for zero-energy buildings during the past decade. Energy Build. 2016, 128, 198–213. [Google Scholar] [CrossRef]
- Yun, W.S.; Hong, W.H.; Seo, H. A data-driven fault detection and diagnosis scheme for air handling units in building HVAC systems considering undefined states. J. Build. Eng. 2021, 35, 102111. [Google Scholar] [CrossRef]
- Mirnaghi, M.S.; Haghighat, F. Fault detection and diagnosis of large-scale HVAC systems in buildings using data-driven methods: A comprehensive review. Energy Build. 2020, 229, 110492. [Google Scholar]
- Proctor, J. Residential and small commercial central air conditioning; rated efficiency isn’t automatic. In Proceedings of the ASHRAE Winter Meeting, Anaheim, CA, USA 24–28 January 2004. [Google Scholar]
- Rossi, T.M. Unitary air conditioner field performance. In Proceedings of the International Refrigeration and Air Conditioning Conference, West Lafayette, IN, USA, 12–15 July 2004. [Google Scholar]
- Schein, J.; Bushby, S.T.; Castro, N.S.; House, J.M. A rule-based fault detection method for air handling units. Energy Build. 2006, 38, 1485–1492. [Google Scholar] [CrossRef]
- Katipamula, S.; Brambley, M.R. Methods for fault detection, diagnostics, and prognostics for building systems—A review, part II. HVACR Res. 2005, 11, 169–187. [Google Scholar] [CrossRef]
- Wu, S.; Sun, J.Q. Cross-level fault detection and diagnosis of building HVAC systems. Build. Environ. 2011, 46, 1558–1566. [Google Scholar] [CrossRef]
- Wang, H.; Chen, Y. A robust fault detection and diagnosis strategy for multiple faults of VAV air handling units. Energy Build. 2016, 127, 442–451. [Google Scholar] [CrossRef]
- Lin, G.; Kramer, H.; Granderson, J. Building fault detection and diagnostics: Achieved savings, and methods to evaluate algorithm performance. Build. Environ. 2020, 168, 106505. [Google Scholar] [CrossRef]
- Zhao, Y.; Li, T.; Zhang, X.; Zhang, C. Artificial intelligence-based fault detection and diagnosis methods for building energy systems: Advantages, challenges and the future. Renew. Sust. Energ. Rev. 2019, 109, 85–101. [Google Scholar] [CrossRef]
- Kim, W.; Katipamula, S. A review of fault detection and diagnostics methods for building systems. Sci. Technol. Built Environ. 2018, 24, 3–21. [Google Scholar] [CrossRef]
- Huang, J.; Wen, J.; Yoon, H.; Pradhan, O.; Wu, T.; O’Neill, Z.; Candan, K.S. Real vs. Simulated: Questions on the capability of simulated datasets on building fault detection for energy efficiency from a data-driven perspective. Energy Build. 2022, 259, 111872. [Google Scholar] [CrossRef]
- Frank, S.; Lin, G.; Jin, X.; Singla, R.; Farthing, A.; Granderson, J. A performance evaluation framework for building fault detection and diagnosis algorithms. Energy Build. 2019, 192, 84–92. [Google Scholar] [CrossRef]
- Yu, Y.; Woradechjumroen, D.; Yu, D. A review of fault detection and diagnosis methodologies on air-handling units. Energy Build. 2014, 82, 550–562. [Google Scholar] [CrossRef]
- Piscitelli, M.S.; Mazzarelli, D.M.; Capozzoli, A. Enhancing operational performance of AHUs through an advanced fault detection and diagnosis process based on temporal association and decision rules. Energy Build. 2020, 226, 110369. [Google Scholar] [CrossRef]
- Wen, J.; Li, S. RP-1312—Tools for evaluating fault detection and diagnostic methods for Air-Handling Units. American Society of Heating, Refrigeration and Air-Conditioning Engineers (ASHRAE), Final Report. 2012. Available online: https://www.techstreet.com/standards/rp-1312-tools-for-evaluating-fault-detection-and-diagnostic-methods-for-air-handling-units?product_id=1833299#product (accessed on 1 September 2022).
- Granderson, J.; Lin, G.; Singla, R.; Mayhorn, E.; Ehrlich, P.; Vrabie, D. Commercial Fault Detection and Diagnostics Tools: What They Offer, How They Differ, and What’s Still Needed. Lawrence Berkeley National Laboratory Recent Work. 2018, pp. 1–12. Available online: https://escholarship.org/uc/item/4j72k57p (accessed on 1 August 2022).
- Granderson, J.; Lin, G.; Harding, A.; Im, P.; Chen, Y. Building Fault Detection Data to Aid Diagnostic Algorithm Creation and Performance Testing. Sci. Data 2020, 7, 65. [Google Scholar] [CrossRef]
- Liu, R.; Zhou, X.; Milbrandt, R. Experimental Study of Lab Controlled Faults in Dual-Duct VAV System. In Proceedings of the ASHRAE Transactions, Atlanta, USA, 27 June–1 July 2015. [Google Scholar]
- Rosato, A.; Guarino, F.; Filomena, V.; Sibilio, S.; Maffei, L. Experimental calibration and validation of a simulation model for fault detection of HVAC systems and application to a case study. Energies 2020, 13, 3948. [Google Scholar] [CrossRef]
- Rosato, A.; Guarino, F.; Sibilio, S.; Entchev, E.; Masullo, M.; Maffei, L. Healthy and faulty experimental performance of a typical HVAC system under Italian climatic conditions: Artificial neural network-based model and fault impact assessment. Energies 2021, 14, 5362. [Google Scholar] [CrossRef]
- Rosato, A.; Guarino, F.; Youssef, M.; Sibilio, S.; Maffei, L. Preliminary symptoms assessment of typical faults related to the fans and humidifiers of HVAC systems based on experimental data collected during Italian summer and winter. In Proceedings of the IOP Conference Series: Earth and Environmental Science, 4th International Conference on Renewable Energy and Environment Engineering, Florence, Italy, 27–30 August 2021; IOP Publishing: Bristol, UK, 2021; Volume 897, p. 12009. [Google Scholar]
- Wu, B.; Cai, W.; Cheng, F.; Chen, H. Simultaneous-fault diagnosis considering time series with a deep learning transformer architecture for air handling units. Energy Build. 2022, 257, 111608. [Google Scholar] [CrossRef]
- Liao, H.; Cai, W.; Cheng, F.; Dubey, S.; Rajesh, P.B. An Online Data-Driven Fault Diagnosis Method for Air Handling Units by Rule and Convolutional Neural Networks. Sensors 2021, 21, 4358. [Google Scholar] [CrossRef]
- HVAC SIMulation PLUS other systems (HVACSIM+). Available online: https://www.nist.gov/services-resources/software/hvac-simulation-plus-other-systems-hvacsim (accessed on 1 August 2022).
- Casillas, A.; Lin, G.; Granderson, J. Curation of Ground-Truth Validated Benchmarking Datasets for Fault Detection & Diagnostics Tools; Lawrence Berkeley National Laboratory: Berkeley, CA, USA, 2021. Available online: https://eta-publications.lbl.gov/sites/default/files/curation_of_ground-truth_validated_benchmarking_datasets_for_fault_detection_acasillas_0.pdf (accessed on 1 August 2022).
- Hu, R.I.; Granderson, J.; Auslader, D.M.; Agogino, A. Design of machine learning models with domain experts for automated sensor selection for energy fault detection. Appl. Energy 2019, 235, 117–128. [Google Scholar] [CrossRef]
- Chen, Y.; Lin, G.; Chen, Z.; Wen, J.; Granderson, J. A simulation-based evaluation of fan coil unit fault effects. Energy Build. 2022, 263, 112041. [Google Scholar] [CrossRef]
- Li, Y.; O’Neill, Z. A critical review of fault modeling of HVAC systems in buildings. Build. Simul. 2018, 11, 953–975. [Google Scholar] [CrossRef]
- Dey, D.; Dong, B.; Li, Z. A Probabilistic Framework to Diagnose Faults in Air Handling Units. In Proceedings of the International High Performance Buildings Conference, West Lafayette, IN, USA, 11–14 July 2016; Available online: http://docs.lib.purdue.edu/ihpbc/168 (accessed on 1 September 2022).
- Nehasil, O.; Dobiášová, L.; Mazanec, V.; Široky, J. Versatile AHU fault detection–Design, field validation and practical application. Energy Build. 2021, 237, 110781–110792. [Google Scholar] [CrossRef]
- Feng, B.; Zhou, Q.; Xing, J.; Yang, Q.; Qin, X.; Mo, Y.; Chen, W. A fully distributed voting strategy for AHU fault detection and diagnosis based on a decentralized structure. Energy Rep. 2022, 8, 390–404. [Google Scholar] [CrossRef]
- Carling, P. Comparison of Three Fault Detection and Diagnosis Methods Based on Field Data of an Air Handling Unit. In Proceedings of the ASHRAE Transactions 108, Atlantic City, NJ, USA, 12 January 2002. [Google Scholar]
- SENS i-Lab, Department of Architecture and Industrial Design, University of Campania Luigi Vanvitelli. Available online: https://www.architettura.unicampania.it/images/ricerca/laboratori/EN/SENS-i_Lab_2021_EN.pdf (accessed on 1 August 2022).
- CAREL. Humidifiers Technical Datasheet. Available online: https://www.carel.com/documents/10191/0/%2B030220621/92fca658-a251-49ee-9979-b8829fcba49f?version=1.0 (accessed on 1 August 2022).
- AERMEC. Reversible Air/Water Heat Pump Technical Datasheet. Available online: https://download.aermec.com/docs/schede/ANL-021-203-HP_Y_UN50_03.pdf?r=14395 (accessed on 1 August 2022).
- Mastrullo, R.; Rosato, A.; Vanoli, G.P.; Thome, J.R. A methodology to select the experimental plant instrumentation based on an a priori analysis of measurement errors and instrumentation cost. Int. Commun. Heat Mass Transf. 2008, 35, 689–695. [Google Scholar] [CrossRef]
- SIEMENS. Duct Sensors Technical Datasheet. Available online: https://www.downloads.siemens.com/download-center/Download.aspx?pos=download&fct=getasset&id1=24897 (accessed on 1 August 2022).
- E+E Elektronic. EE210 Outdoor Datasheet. Available online: https://www.epluse.com/fileadmin/data/product/ee210/datasheet_EE210_Outdoor.pdf (accessed on 1 August 2022).
- TSI. Q-TRAK Technical Datasheet. Available online: https://tsi.com/getmedia/d2a8d1d1-7551-47fe-8a0f-3c14b09b494b/7575_QTrak_A4_UK_5001356-web?ext=.pdf (accessed on 1 August 2022).
- MEASUREIT. Sensors. Available online: https://shop.measureit.eu/sensori.html (accessed on 1 August 2022).
- BELIMO. Energy Valve Technical Datasheet. Available online: https://www.belimoseoul.com/data/medium/9d020b80b518dcf144d3cc8db59f777e.pdf (accessed on 1 August 2022).
- Blanke, M.; Kinnaert, M.; Lunze, J.; Staroswiecki, M. Diagnosis and Fault-Tolerant Control, 3rd ed.; Springer: Berlin, Germany, 2016; pp. 1–701. [Google Scholar]
- Yan, Y.; Cai, J.; Tang, Y.; Yu, Y. A Decentralized Boltzmann-machine-based fault diagnosis method for sensors of Air Handling Units in HVACs. J. Build. Eng. 2022, 50, 104130. [Google Scholar] [CrossRef]
Publisher’s Note: MDPI stays neutral with regard to jurisdictional claims in published maps and institutional affiliations. |
© 2022 by the authors. Licensee MDPI, Basel, Switzerland. This article is an open access article distributed under the terms and conditions of the Creative Commons Attribution (CC BY) license (https://creativecommons.org/licenses/by/4.0/).