Article

Energy Performance Certificate Classes Rating Methods Tested with Data: How Does the Application of Minimum Energy Performance Standards to Worst-Performing Buildings Affect Renovation Rates, Costs, Emissions, Energy Consumption?

by
Andrea Ferrantelli
1,2,* and
Jarek Kurnitski
1,2
1
FinEst Centre for Smart Cities (Finest Centre), Tallinn University of Technology, 19086 Tallinn, Estonia
2
Department of Civil Engineering, Aalto University, 00076 Aalto, Finland
*
Author to whom correspondence should be addressed.
Energies 2022, 15(20), 7552; https://doi.org/10.3390/en15207552
Submission received: 2 September 2022 / Revised: 20 September 2022 / Accepted: 11 October 2022 / Published: 13 October 2022

Abstract

:
Energy renovations of the building stock are a paramount objective of the European Union (EU) to combat climate change. A tool for renovation progress monitoring is energy performance certificate (EPC) labelling. The present study tested the effect of different EPC label classifications on a national database, which comprises ~25,000 EPC values from apartment buildings, detached houses, office buildings, and educational, commercial, and service buildings. Analysing the EPC classes labelling resulting from four different EU methods, we estimated the annual renovation rates, costs, energy savings, and CO2 emissions reduction that would affect the national building stock if each of them was adopted, to fulfil the European Climate Target Plan by the year 2033. The ISO 52003-1:2017 two-point and one-point methods determined a very uneven distribution of renovation rates, from 0.45% to ~9%. Conversely, the Directive 15% recently proposed in COM/2021/802 with uniform rates determined smaller differences and standard deviation, not pushing renovations above 3.70%, namely a rate that once fine-tuned can stimulate realistic, yet effective renovation campaigns. The major differences in renovation rates provided by the studied methods show the need for a harmonized strategy such as the Directive proposal to enable achievement of European targets.

1. Introduction

1.1. Energy Efficiency of National Building Stocks and Energy Labelling

As buildings constitute a large source of energy consumption in Europe and elsewhere, the legislators believe that an improvement of the building stock’s energy efficiency would cut emissions and reduce the market’s vulnerability to energy prices [1]. Moreover, this would concur in boosting the economy and creating jobs. The Renovation Wave Strategy [2,3] was presented in October 2020 following the European Union (EU) Climate Target Plan [4] within the European Green Deal [1,5]. The main objective was establishing some measures aimed at doubling the annual energy renovation rate, which is currently in the order of 1.0% [6], by 2030. In July 2021, a European Commission’s package called ‘Fit for 55’ [6,7] was released, specifically demanding a cut of greenhouse gas emissions by at least 55% by 2030. The Fit for 55 package discusses financial support for investments in renovation and introduces the Social Climate Fund.
Aimed at harmonising these distinct strategies, the recent December 2021 revision of the Energy Performance of Buildings Directive (EPBD) recast proposal upgrades the existing framework of regulations towards more ambitious goals; coupled with the new emissions trading system (ETS) for buildings and road transport, it establishes the ground for achieving a zero-emission and fully decarbonised European building stock by 2050 [8].
The EPBD recast proposal stresses that buildings account for 40% of the final energy consumption in the EU and for 36% of its energy-related greenhouse gas emissions. It is stated that reduction of energy consumption and the use of energy from renewable sources in buildings constitute important measures needed to reduce the EU greenhouse gas emissions.
On one side, the new ETS creates economic incentives for decarbonisation, particularly targeting vulnerable households through public support; on the other, the revised EPBD is meant to push the industry to innovate, inducing lower renovation costs and pushing the buildings to consume less energy. The EPBD recast proposal will also act on energy production, by boosting the integration of renewable energy in buildings; this is necessary for achieving the 2030 target regarding their share in renewables.
The EPBD recast proposal requires zero-emission buildings not to produce operational carbon emissions on-site; since heating systems have a lifetime of approximately 20 years, this implies an end to the public support of fossil-fuel powered boilers by 2027 according to the European Union’s EPBD regulations [8], so a legal basis according to which requirements for heat generators and national bans for fossil fuels can be introduced is indeed provided.
Energy production and use of renewables are a fundamental means of improvement of the building stock. The Energy Performance Certificate (EPC) classes system, however, constitutes a well-tested and relatively simple way to assess the overall readiness of the building stock and to boost renovations [9,10]. Such a methodology was adopted in Western countries in the 1970s, followed by China in the late 1990s [11]. The EPCs are defined as the measured or calculated energy consumption of a building over a certain amount of time (often, annually). In the European Union (EU), these are commonly rated from A to G (smallest to largest, hence best to worst) [12], and provide a very strong tool for assessing the energy performance of national building stocks [13,14].
The EPBD recast proposal [8] introduces the Minimum Energy Performance Standards, which require a renovation of the worst-performing buildings of classes G and F. The G rating is set to the 15% worst-performing buildings of the national building stock related to each country concerned, while the remaining buildings are proportionally distributed among the energy performance levels between G and A. The latter, class A, corresponds to zero-emission buildings. Specifically, public and non-residential buildings will need to be renovated to at least class F by 2027 at the latest, and to at least class E by 2030. Residential buildings should instead reach at least class F by 2030, and at least class E by 2033. This will execute a new vision, a zero-emission building stock by 2050 [8].

1.2. Literature Review and Research Gap

All of the above is a very ambitious program that follows directly from the European Green Deal. Clearly, this critically depends on building renovations that, given the EPC system, can be favoured only by setting limitations on the energy labels classes. The EPC labelling can be defined in different ways; each country has already its own prescription, and recently the European Union has proposed different methods to unify the energy classes. The ISO 52003-1:2017 European Standard [15] prescribes the so-called “two-point” and “one-point” methods, also creating the possibility to adopt any country-preferred energy scaling. On the other hand, the recent EPBD proposal [8] defines the energy scaling method described above, with the 15% worst-performing buildings to be placed in class G.
Now, the EPC labelling system has been the subject of controversy for years, as was well described in [16]. The main problems range from the performance gap, namely the EPCs’ accuracy in relation to real energy data [17], to consistency of the EPCs; it is indeed critical to the EPBD that for any building, a replicable and standardised assessment is carried out in the same way. For instance, a recent comparison of computed versus measured EPC values for the Estonian building stock revealed that time-related behaviours can be quite different [14]. Furthermore, it was argued in [16] that steady-state modelling is unable to model dynamic aspects of energy usage, inducing a sort of inertia that restricts embedding the latest research on energy modelling within frameworks of energy assessment.
Finally, it has been recently suggested that the end-users’ demands and needs when buying or renting property (e.g., comfort, heating source, energy efficiency, smart technology) shall influence how EPCs will become key drivers for deep renovation [18]; such a bottom-up phenomenon needs to be complemented by a top-down approach that is grounded on national and transnational EPC labelling legislation. Unfortunately, as it was stressed and quantified in various studies (see [16,19], and references quoted therein), the differences in calculation methodology among the countries are still remarkable. The different primary energy factors that are nationally adopted do critically affect the refurbishment solutions that are necessary to fulfil the EPBD requirements [20].
A commonly established energy class labelling for buildings might therefore be needed. The common goal of the European Green Deal should be supported by a strategy that is as uniform as possible, to harmonise and speed up renovations, continent-wise. For this to happen, one needs however to select a labelling method that boosts renovations with realistic rates and costs, ideally providing a sizeable reduction of carbon dioxide emissions as well. Unfortunately, no study so far has been able to accomplish this task by testing in the field the latest European Commission candidates for energy labelling. In other words, how the different energy rating directives would perform when they are applied to an actual case study of a national database is still unknown.

1.3. Contribution of the Present Study

This paper aims at filling this gap by testing, for the first time in the literature, each of the above EU methods (from the EPBD and ISO 52003-1:2017) on an EPC database of a specific country. Such a task is necessary to single out a scaling procedure that would be able to boost renovations with a reasonable, realistic annual rate.
Since the EU countries mostly favour renovations from G to F by 2027–2030, and from F to E in 2033, the way the scaling applies to the worst-performing classes is of paramount interest. As it was recently shown, a country’s own energy labelling regulations can dramatically affect renovations, contracting [11] and the energy performance of all building types [14,21]. This also has a sizeable impact on CO2 emissions, as illustrated in [22], and on management policy as well: setting minimum requirements in the national implementation of the EPBD recast will in fact determine how many buildings must be upgraded out of the G and F classes. If these buildings will not be renovated accordingly, due to the EPBD regulations it will not be possible to sell or rent them.
Although comparing standards across the EU is useful, this is not merely a technical matter since different systems might lead to different choices. There needs to be some individual economic optimising behaviour, as renovation rates are not merely a function of technical ratings but are driven by macroeconomic arguments.
If prices reflect fuel efficiency, and different levels of efficiency are permitted, a given level of capital investment will not necessarily lead to specific efficiency ratings. For instance, larger, less efficient buildings might be preferred to smaller, more efficient ones.
Our analysis accordingly includes a tentative cost estimation, based on Estonian renovation pricing, to reflect how much economic effort would be required by each distinct method if adopted in Estonia in the immediate future. A corresponding calculation of energy saving potential, and reduction of CO2 emissions, is added as well. Accounting for investment load and environmental benefits thus complements the technical investigation of the different energy labelling regulations, allowing for an unbiased comparison with a broad brush.
Our discussion is compact and synthetic and is articulated as follows: in Section 2 we discuss the national EPC database under analysis, as well as the different labelling methods from the European Standard and Directive proposal. The methodology for costs, energy saving potential, and carbon dioxide reduction estimates is also highlighted. Section 3 reports our results and Section 4 discusses their implications regarding energy policy, while in Section 5 we draw our conclusions.

2. Methods

2.1. EPC Datasets and Energy Labels

The study at hand addresses a database of 24898 EPCs of Estonian buildings that were released between the late 1990s and February 2022. These represent a wide spectrum of typologies: apartment buildings, detached houses, office buildings, and the educational as well as the commercial and services sectors.
The detached houses comprise several sub-typologies of single- and multi-family buildings, such terraced houses with a dedicated entrance, two or three apartment houses, and so on. The educational sector comprises kindergartens, primary and secondary schools, universities, and research facilities.
The commercial buildings cluster corresponds to various types of stores of different scale (from small bakeries to shopping centres) and to beauty, vehicle, and personal services buildings. The entire database, featuring a total of 11 building categories, was analysed in very much detail in [14], including raw data analysis and long-time energy performance predictions. Table 1 summarises the basic parameters of the dataset.
Detached houses (from now on, “dwellings” Di), accounting for 18122 EPCs, are further subdivided by the Estonian directive into three groups according to the heated area A, namely if A < 120 m2, A = 120 m2–220 m2, and A > 220 m2. The three corresponding subclusters are named D1, D2, and D3 (see Table 1). The raw data for this category were analysed in [21], which also featured an assessment of time evolution and estimations of energy readiness among the other results. The energy labelling of D1, D2, and D3 according to the Estonian legislation is given in Table 2.

Estonian Energy Labelling for Class A

Some few words are needed to explain the Estonian EPC class A values for nearly zero energy buildings (NZEB): like all other EPC classes, they include a wider scope of energy uses than the one defined by the EPBD. The main difference is caused by the small power appliances (plug loads) which are not in the EPBD scope but are included in Estonia for all buildings. Another difference is caused by lighting electricity in residential buildings, which similarly to non-fixed lighting does not belong to the EPBD scope, yet it is included in Estonia [23].
In the case of EPC class A, the EPBD scope can easily be calculated because appliances and lighting have tabulated values in the Estonian regulation, resulting for instance in a factor 105/45.9~2.3 difference in the case of apartment buildings (see Table 3). Therefore, the EPBD scope values in Table 3 provide a realistic picture about the strictness of the Estonian NZEB requirements. It is well known indeed that appliances and lighting are responsible for a large amount of energy usage [24]: for instance, regarding office buildings, plug loads may account for up to 25% of total energy consumption, which in high efficiency buildings can even rise to more than 50% of the total energy consumption [25].
For existing buildings’ EPCs, which are based on metered energy use, such recalculation cannot be performed.

2.2. EU Energy Labelling Methods: ISO 52003-1 and Directive Proposal

According to the well-known ISO 52003-1:2017 European Standard [15], two types of energy labelling are covered:
  • Default energy rating scheme with two reference points (called “Method 1” here);
  • Default energy rating scheme with a single reference point (called “Method 2” here).
The corresponding procedures are briefly described below, following ISO 52003-2:2017 [12].

2.2.1. Method 1 (Two-Points)

Once the type of building is defined (e.g., apartment building), two parameters need to be selected: the energy performance regulation reference, Rr, and the building stock reference, Rs. These correspond, respectively, to the point between two classes (typically, B and C) and to the median of the EPC distribution (often the boundary between D and E). This procedure is more focused on existing buildings, as only two classes are below the minimum performance requirement [12]. The prescription for defining the class boundaries according to Rr and Rs is listed in Table 4.

2.2.2. Method 2 (One-Point)

This procedure is especially recommended for new buildings. It is based on only one reference point nref and features a nonlinear scale that should be better adapted to cover all buildings [12],
Y = 2 ( n n r e f )
Specifically, this is the geometric series with n being the energy class position on the scale, and nref the position of the energy class for the reference point on the scale, which is the boundary between two classes. In other words, the class boundaries are identified by Y, which multiplies the EPC value associated with the class boundary corresponding to nref. The ISO_TR 52003-2 standard uses 4 and 5 (nref = 4), i.e., the boundary between D and E, which using Equation (1) gives us the values in Table 5 for the class boundaries.
The advantages that are claimed by the standard are just one reference point and a nonlinear scale that is better adapted to cover all buildings. Very importantly for our discussion, it is claimed to ”respect efforts and costs to shift from one class on the scale to the class above” [12].

2.2.3. Directive 15%

A December 2021 proposal for a new Directive of the European Parliament [8] introduces an alternative labelling method, which turns out to be the simplest of these three approaches. This will be called “Directive 15%” in the following. Class A is for zero-emission buildings (ZEB), which will replace the current nearly zero energy buildings (NZEB), while class G corresponds to the 15% worst-performing buildings. All the remaining classes will then be divided with equal bandwidths. Since, however, ZEB values are currently not yet defined, in this paper we use existing NZEB values for class A. This assumption is undoubtedly a limitation of the study, because both ZEB and NZEB are based on the cost optimal energy performance; however, changes in the ZEB primary energy values cannot be big and will not considerably change the EPC classes distribution that is calculated with this assumption.

2.3. Renovation Costs and Energy Savings

2.3.1. Renovation Costs Estimation

For this part of the analysis we relied on a document entitled “Long-term strategy for building renovation“ (“LTRS” henceforth) that was released by the Estonian Ministry of Economic Affairs and Communications in 2020 for the European Union [26]. The main goal of the long-term renovation strategy is the deep renovation by 2050 of all buildings that were constructed before 2000. The minimum required energy performance of a building after a major renovation was set to class C, thus making the LTRS more stringent than the EPBD directive requirements of class E by 2033.
The renovation to EPC class C is based on the optimal cost calculation of the net present value (30-year period in residential buildings and 20-year period in non-residential), reported in [27]. Section 6.6 of the LTRS reports deep renovation costs (i.e., to class C) for single family, apartment buildings, public sector, and commercial buildings (Table 6).
In our analysis, as no costs of renovating to E-class were available in the LTRS document, we assumed 50% of the costs reported in Table 6, since class E lies midway in between classes G and C.
The cost calculation can be summarised as follows: first we computed the fraction of the total building stock that is subject to renovation according to each labelling method; then, by counting the number of renovation years that should provide class E, we obtained the renovation volume percentages to class E. The next step was computing the actual renovation volume [m2] that is forecast by each distinct labelling method. This was accomplished by multiplying the renovation volume percentages for each building type by the total renovation volume for the Estonian building stock constructed before 2000 and still in use in 2050 [26]. Finally, the cost estimates were derived by multiplying the renovation volumes [m2] derived from the rates by the cost per square metre.
Besides estimating the financial cost of renovating to class F by 2030 and class E by 2033, we also compared the EPBD costs against those determined by the LTRS implementation, which requires class C by 2050 with a constant renovation rate. To this aim, for each building type we computed the percentage difference between the EPBD and LTRS renovation volumes that are determined by each labelling method.

2.3.2. Energy Savings Estimation

In the LTRS document [26], the energy consumption of the Estonian building stock is split into electricity and heat. Values of delivered heating and electricity, and primary energy-specific use (the EPC label that is based on measured consumption data) are given for two heat sources: efficient district heating (primary energy factor 0.65) and natural gas (primary energy factor 1.0). The primary energy factor for electricity is 2.0.
Dwellings differ from other building types since stove heating is considered in the pre-renovation stage (with 0.65 as primary energy factor of wood fuels) and heat pumps in the post-renovation stage. This increases electricity consumption significantly, with a corresponding lower total reduction of primary energy consumption than for the other building types. The full analysis, with derivation of the consumption values in kWh/(m2y) pre- and post-renovation by means of building performance simulations (BPS), is given in [28].
In our case, we used the EPC primary energy value (the sum of electricity and heat multiplied by primary energy factors), and the total value for 2033 in the LTRS was replaced by the corresponding E-class upper value (to be conservative) for each category. The results according to the different labelling methods were then compared. To account for the relative difference between electricity and heating, for each distinct building class we kept the same proportion over the total as in the LTRS value (e.g., if the LTRS had electric = 1/5 of the total, the EPC was divided by 5 to obtain “electric”, then subtracting it from the total returned “heating”).
Next, the actual renovation volume [m2] that was forecasted by each distinct labelling method was obtained by multiplying the cumulative ratio of EPC percentages of F, G and H class by the total renovation volume. This can be written in a very simple form as
Vrenov [m2]= Vtot × (F + G + H class %)
Equation (2) therefore allows us to estimate the renovation volume Vrenov corresponding to any minimal class that is required by each method (F, E, C etc.), given the total renovation volume Vtot.

2.3.3. CO2 Emissions Reduction Estimation

The procedure for this final estimate is formally identical to the one above. However, the different 2020 specific CO2 emission factors of energy carriers, based on [29], are the following: 1.15 t/MWh for electricity and 0.15 t/MWh for heating. For the period 2020–2050 they are based on the study [30]: the average specific emission factors for the period 2020–2030 are 0.83 t/MWh for electricity and 0.12 t/MWh for heating.

3. Results

All the calculations in this study were performed with the software R [
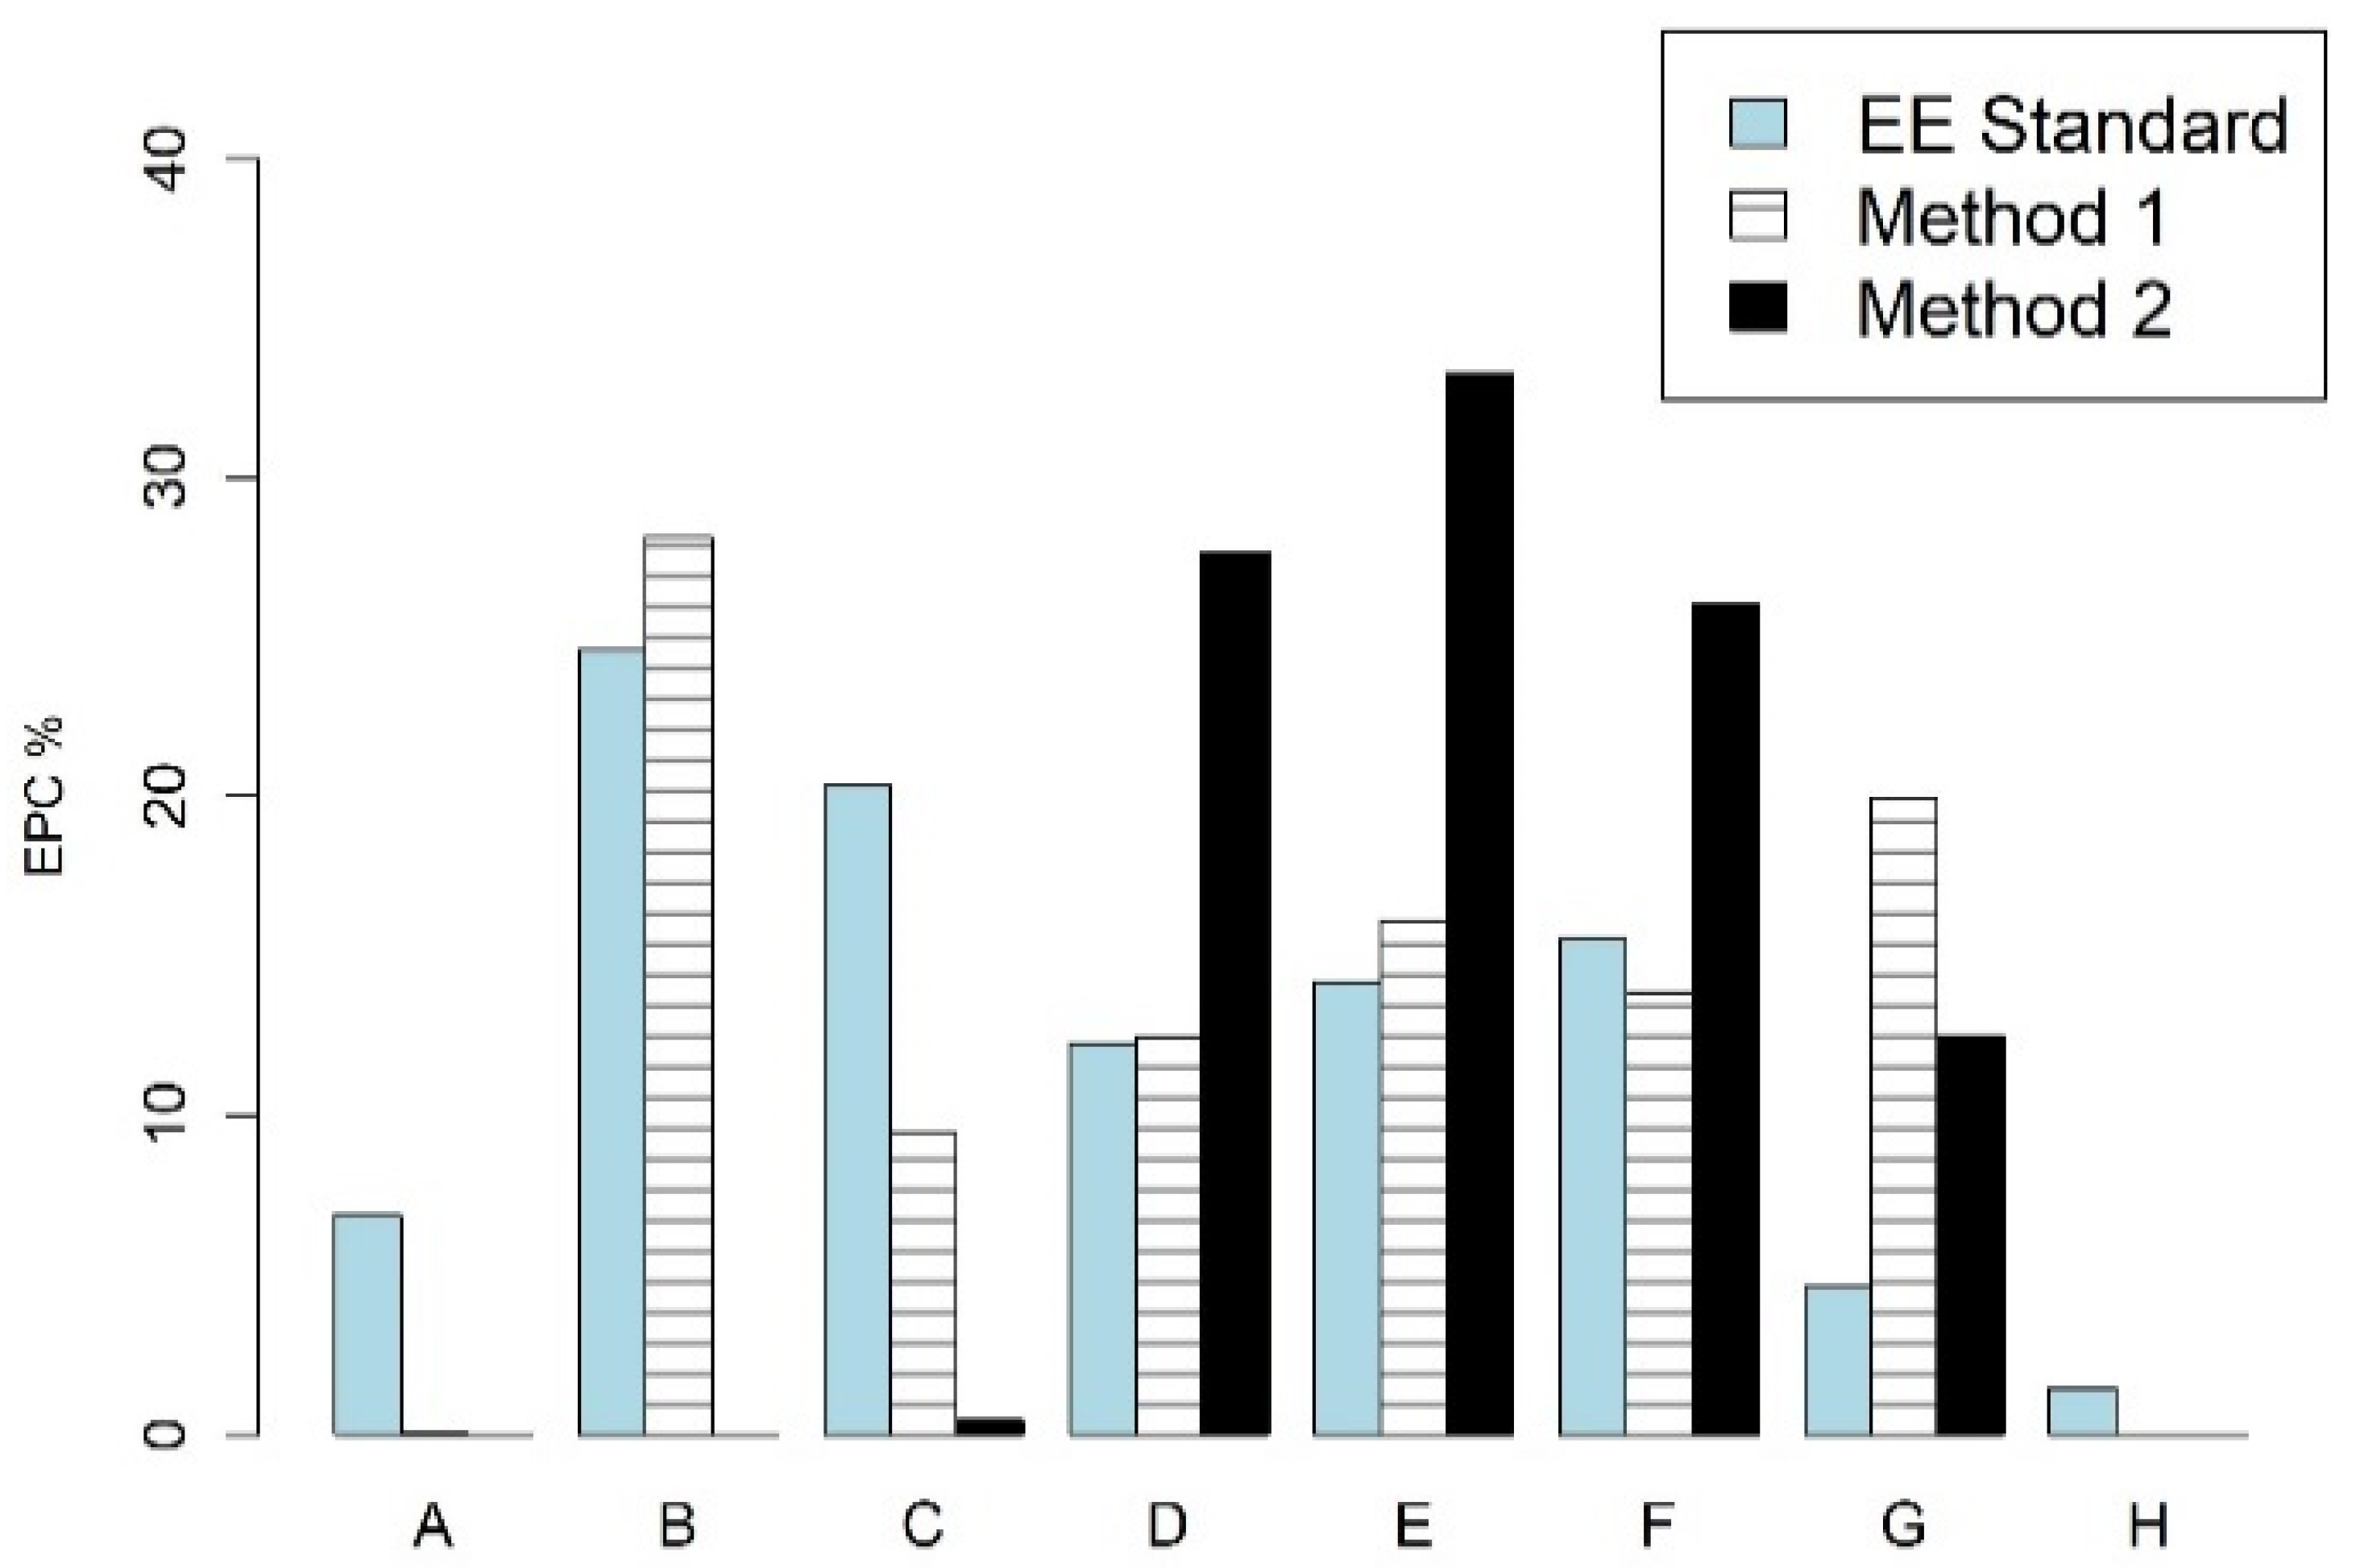
31]. A sample of our results is reported below with two types of bar plots for apartment buildings: one features the Estonian standard, Method 1 and Method 2 (
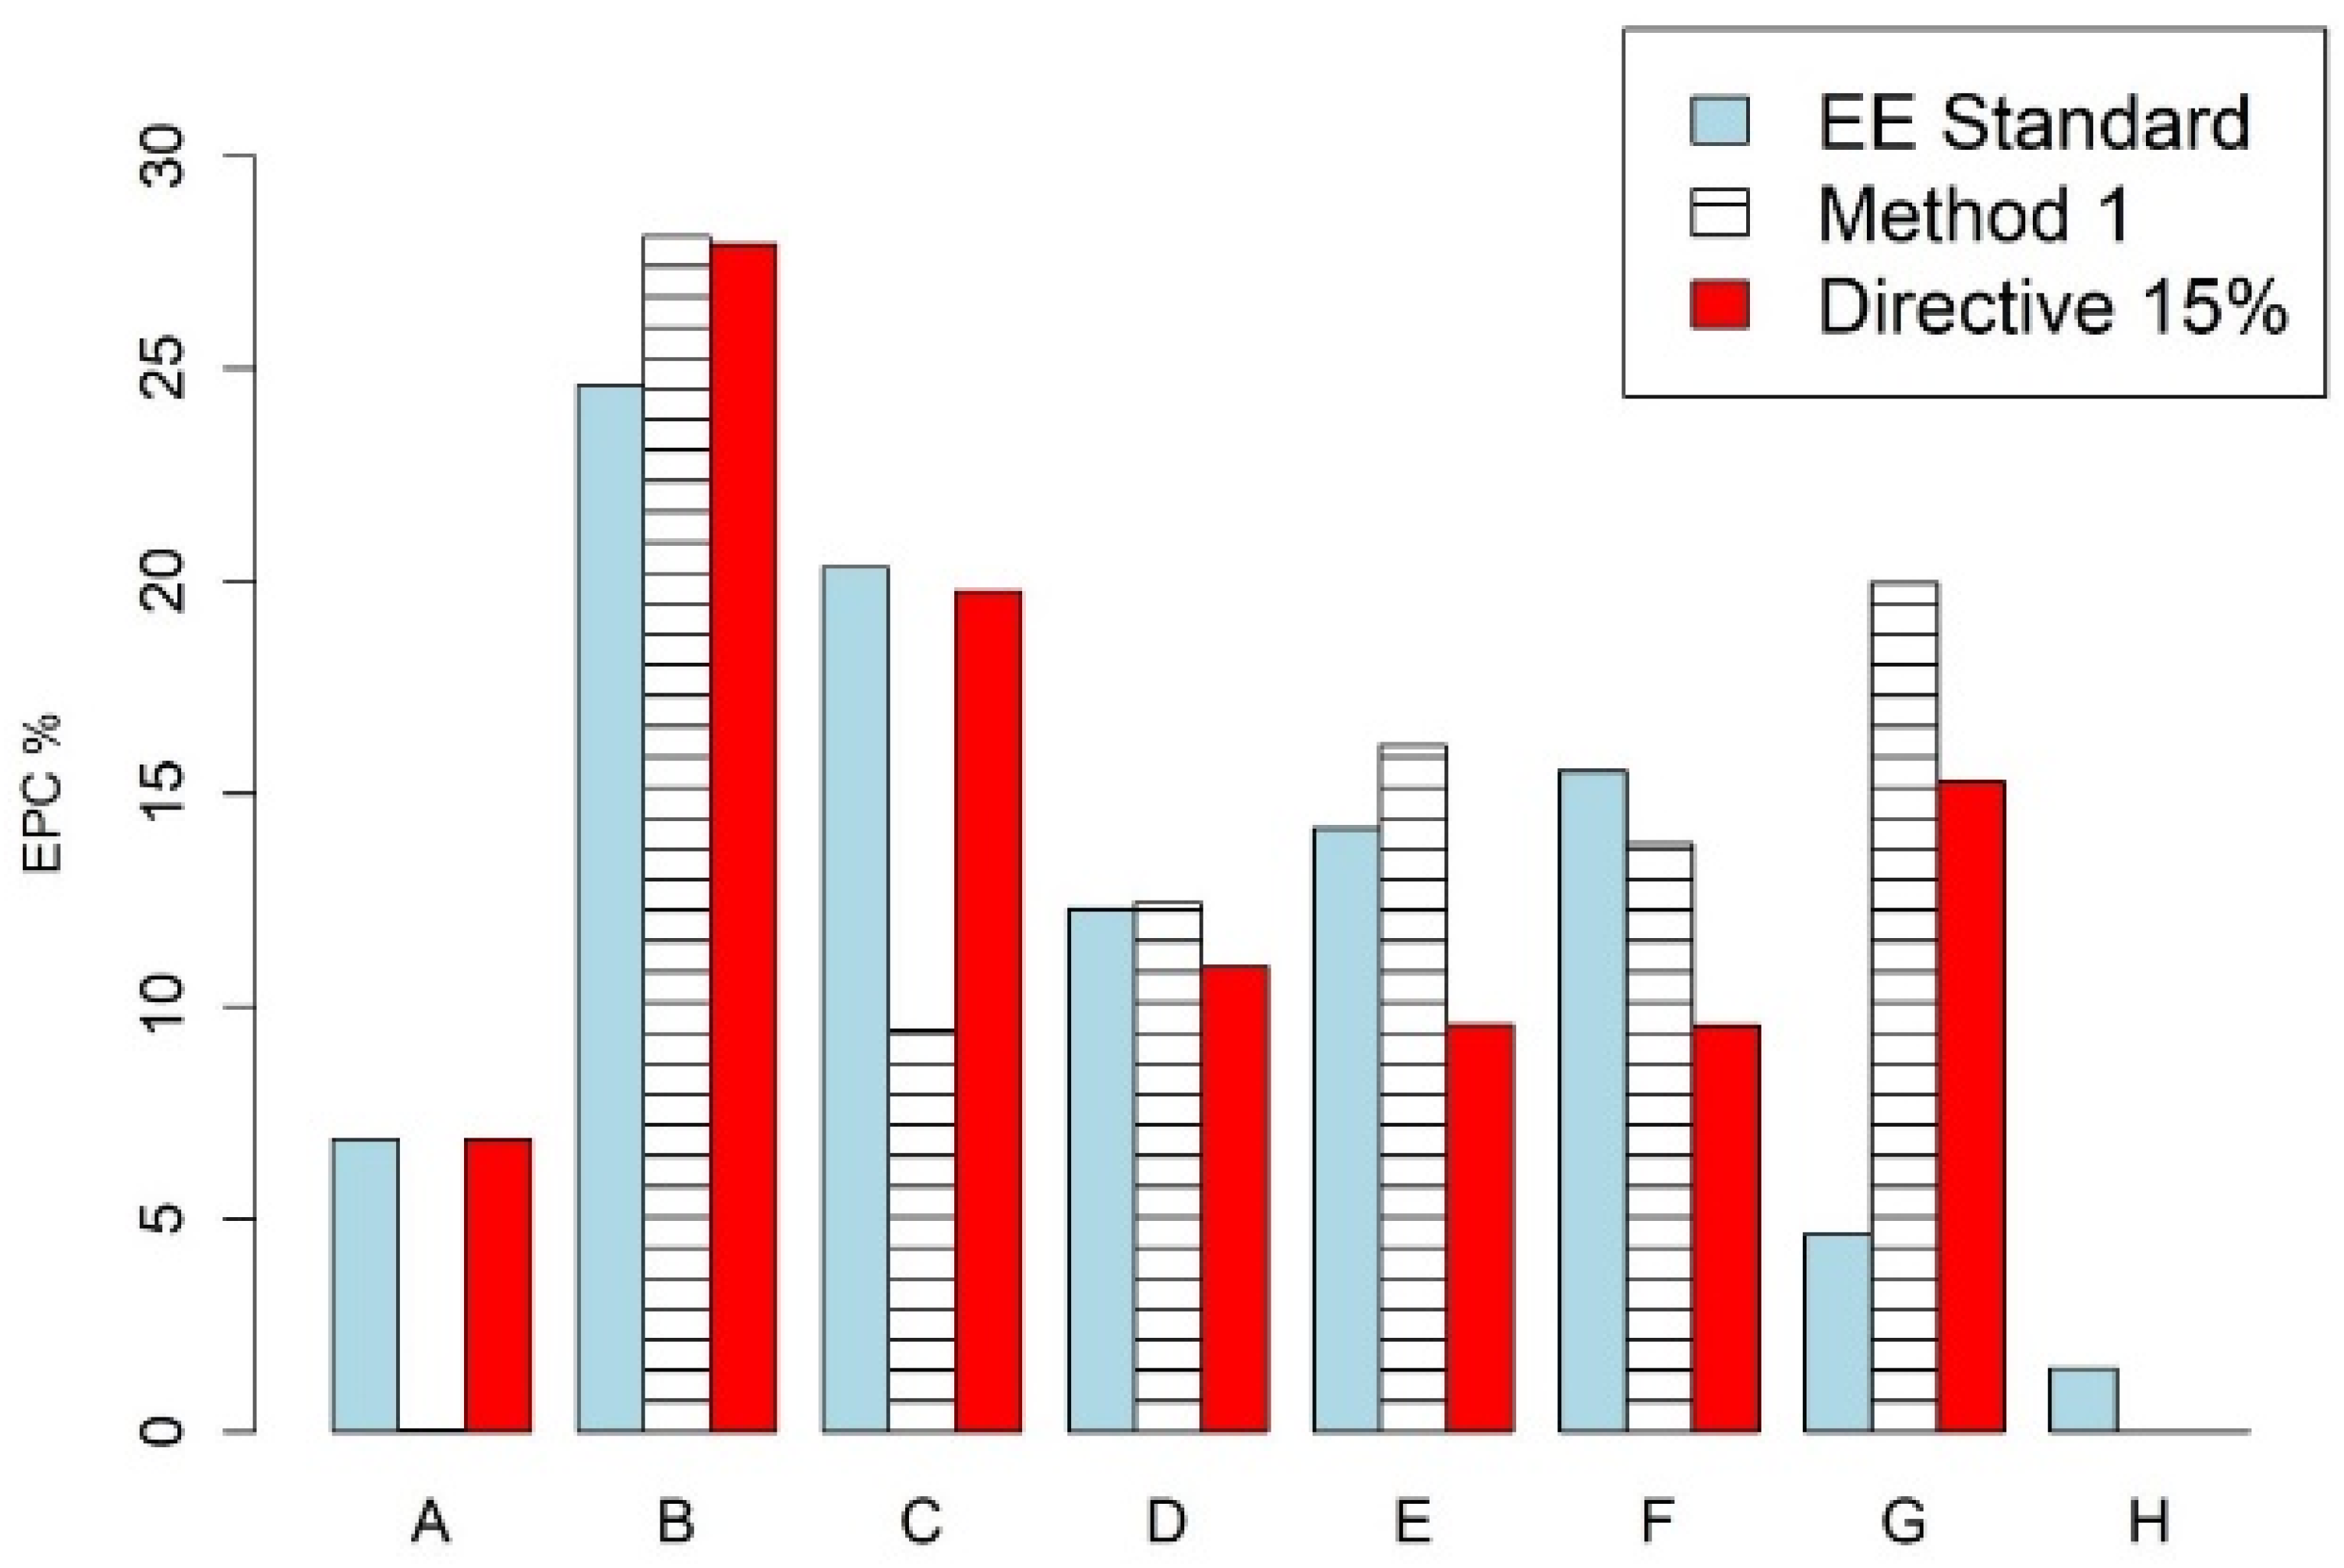
Figure 1); the second one compares the energy scaling according to the Estonian Standard, Method 1 and the new proposal, Directive 15% (Figure 2).
The above Figure 1 illustrates very clearly that Method 2 dramatically reduces the scope of classes A, B, and C to be overly biased towards large energy consumption (D class onwards). This is a distinctive feature of Method 2, indeed, whose nonlinearity reserves a very small bandwidth for classes A and B. While this could be useful for new buildings, we are here interested in portraying the effects of the various methods on the full building stock. We accordingly concentrate on comparing the other three in the second type, shown in Figure 2, as they seem to be more balanced for our purposes.
An example of upper-class boundaries for the apartment buildings is also given in Table 7. The corresponding bandwidths for each class up to G and every standard are visualized in Figure 3.
The resulting percentages of EPCs (equal to the ratio of buildings over the total) that are allocated in each class according to all methods are given for the apartment buildings in Table 8, and for any other category addressed in this study in the Appendix A.

3.1. Renovation Rates

Given the above tables, a rough estimation of the renovation rates that are determined by each method is easily obtained by adding the percentage of buildings in class F to that of those in class G.
Residential buildings must achieve the EPC class F by 2030 and EPC class E by 2033, while public and other non-residential buildings must achieve EPC class F by 2027 and class E by 2030.
If we assume the starting point as 2024 (this is the earliest possible, as the directive will be published by the end of 2022 and implemented in 2023), it will be 10 years by 2033 for apartment buildings and dwellings, and 7 years for non-residential. So, in the case of 25% of the apartment buildings stock, the annual renovation rate Rrenov shall be 2.5% per year, according to Equation (3):
Rrenov [%] = (F + G class %)/10
An estimation for all categories is given in 
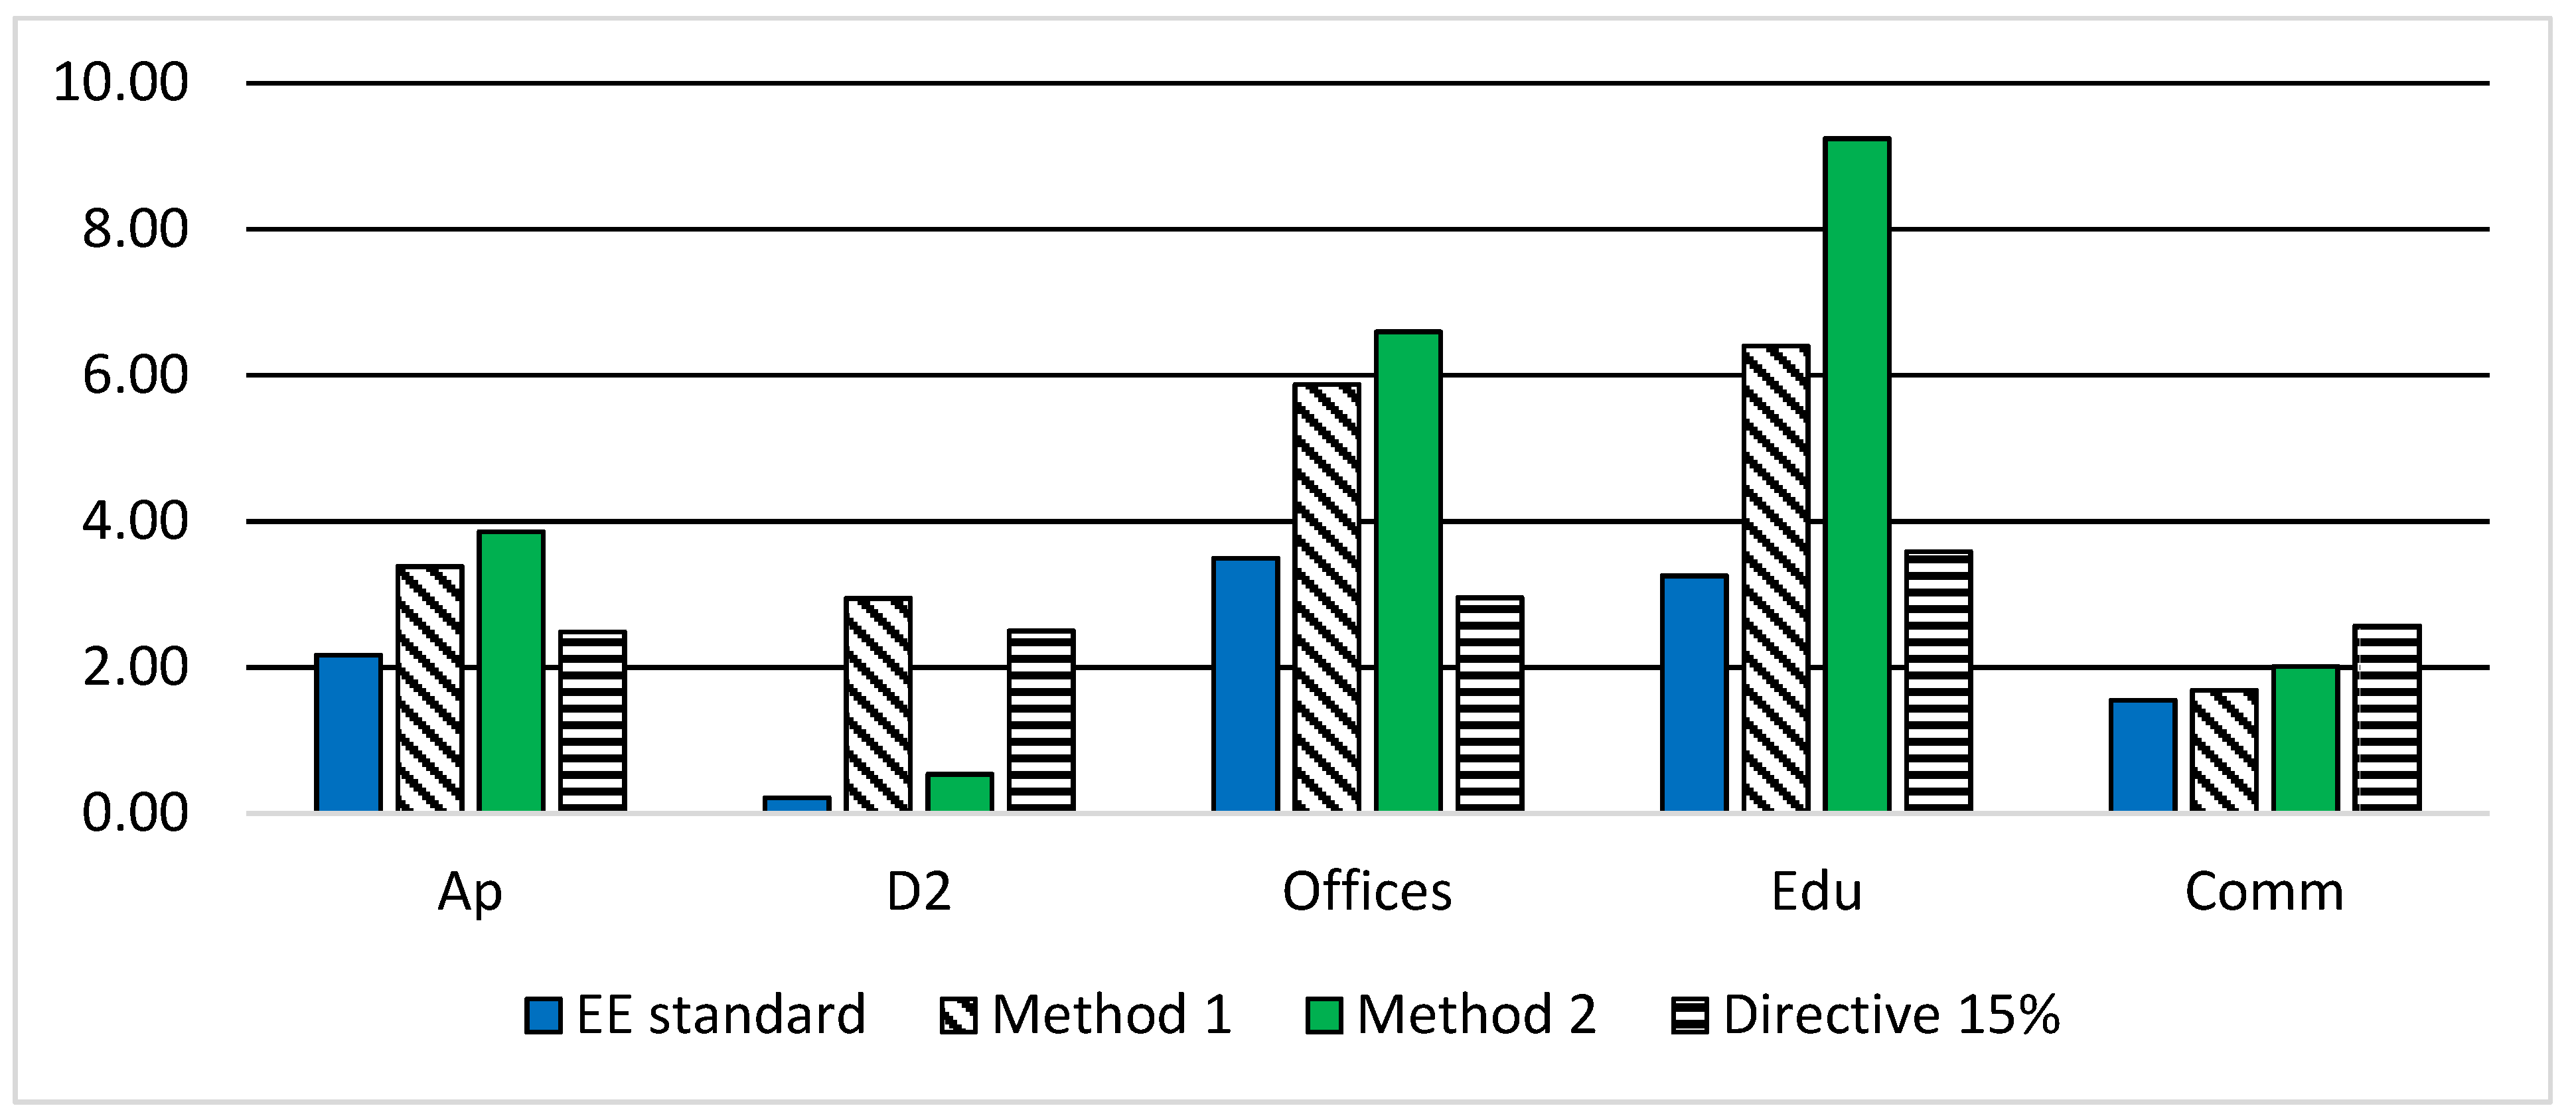
Table 9 including a row with the standard deviation (SD) for each method.
These values are visually compared in the bar plot in Figure 4. Regarding dwellings, the cluster D2 was selected as it corresponds to 56% of the total Estonian detached houses building stock [21].

3.2. Cost Analysis

In this section we report a cost estimate of the interventions. First, one should compute the fraction of the total building stock that is subject to renovation according to each labelling method.
From the annual renovation rates in Table 9, counting the number of renovation years that should provide class E yields the renovation volume percentages to class E that are reported in Table 10.
Now, the actual renovation volume (m2) that is forecast by each distinct labelling method is computed by multiplying the percentages above by the total renovation volume for the Estonian building stock constructed before 2000 and in use in 2050 [26], which is given in Table 11 (where the “dwellings” subcluster is defined as a weighted average of %, i.e., weighted on the number of Di EPCs over the dwellings dataset).
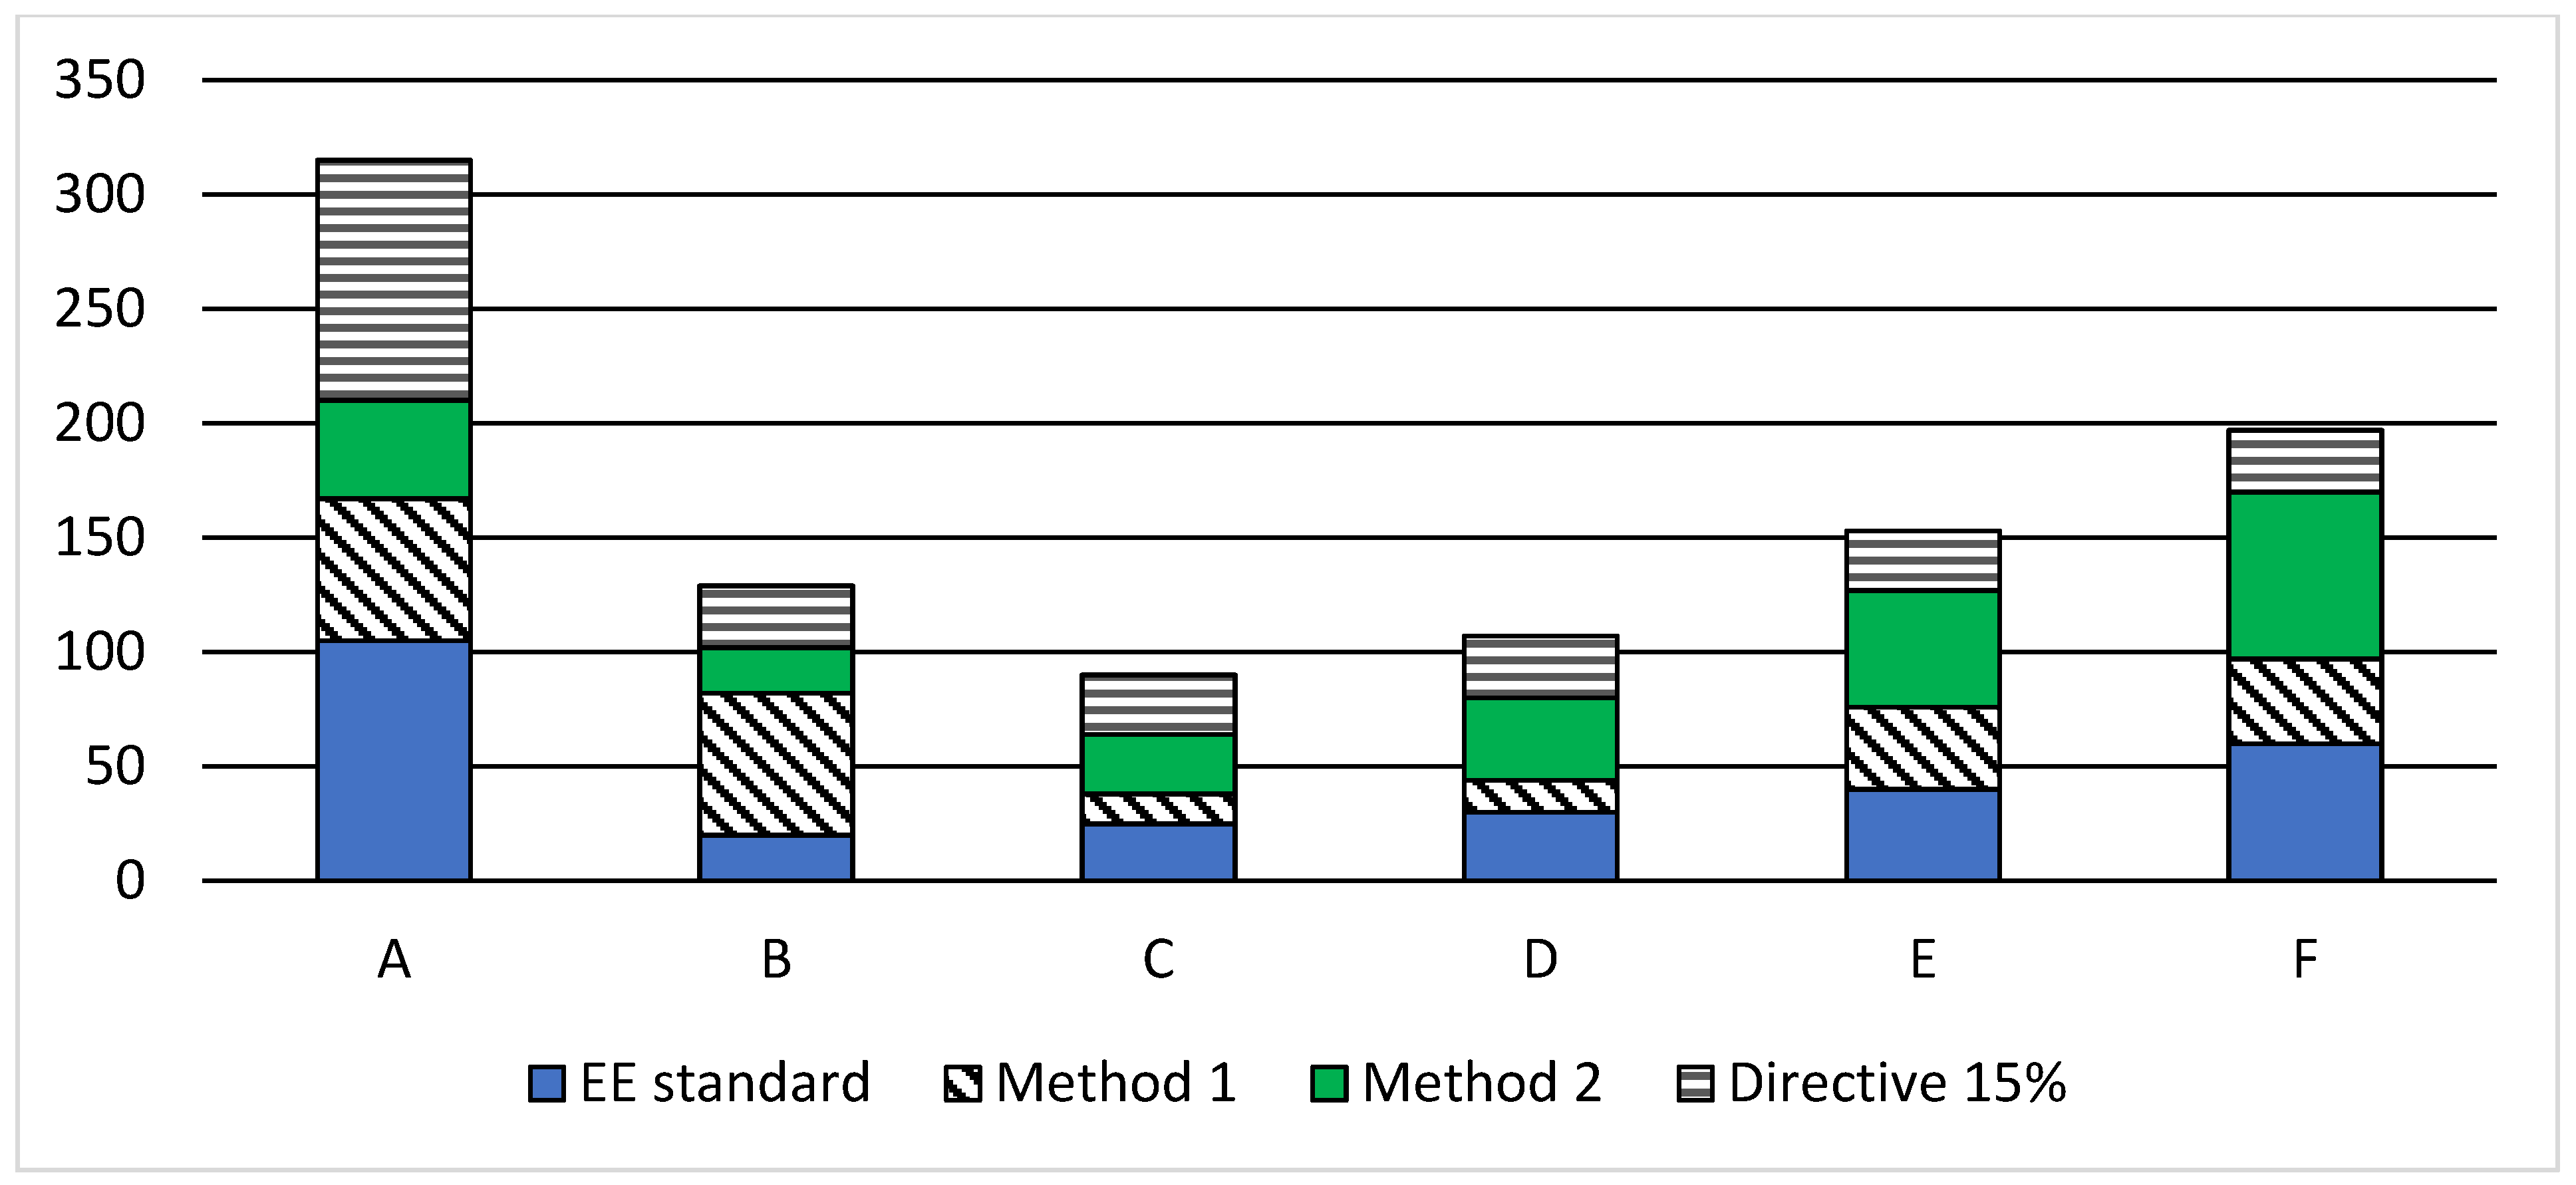
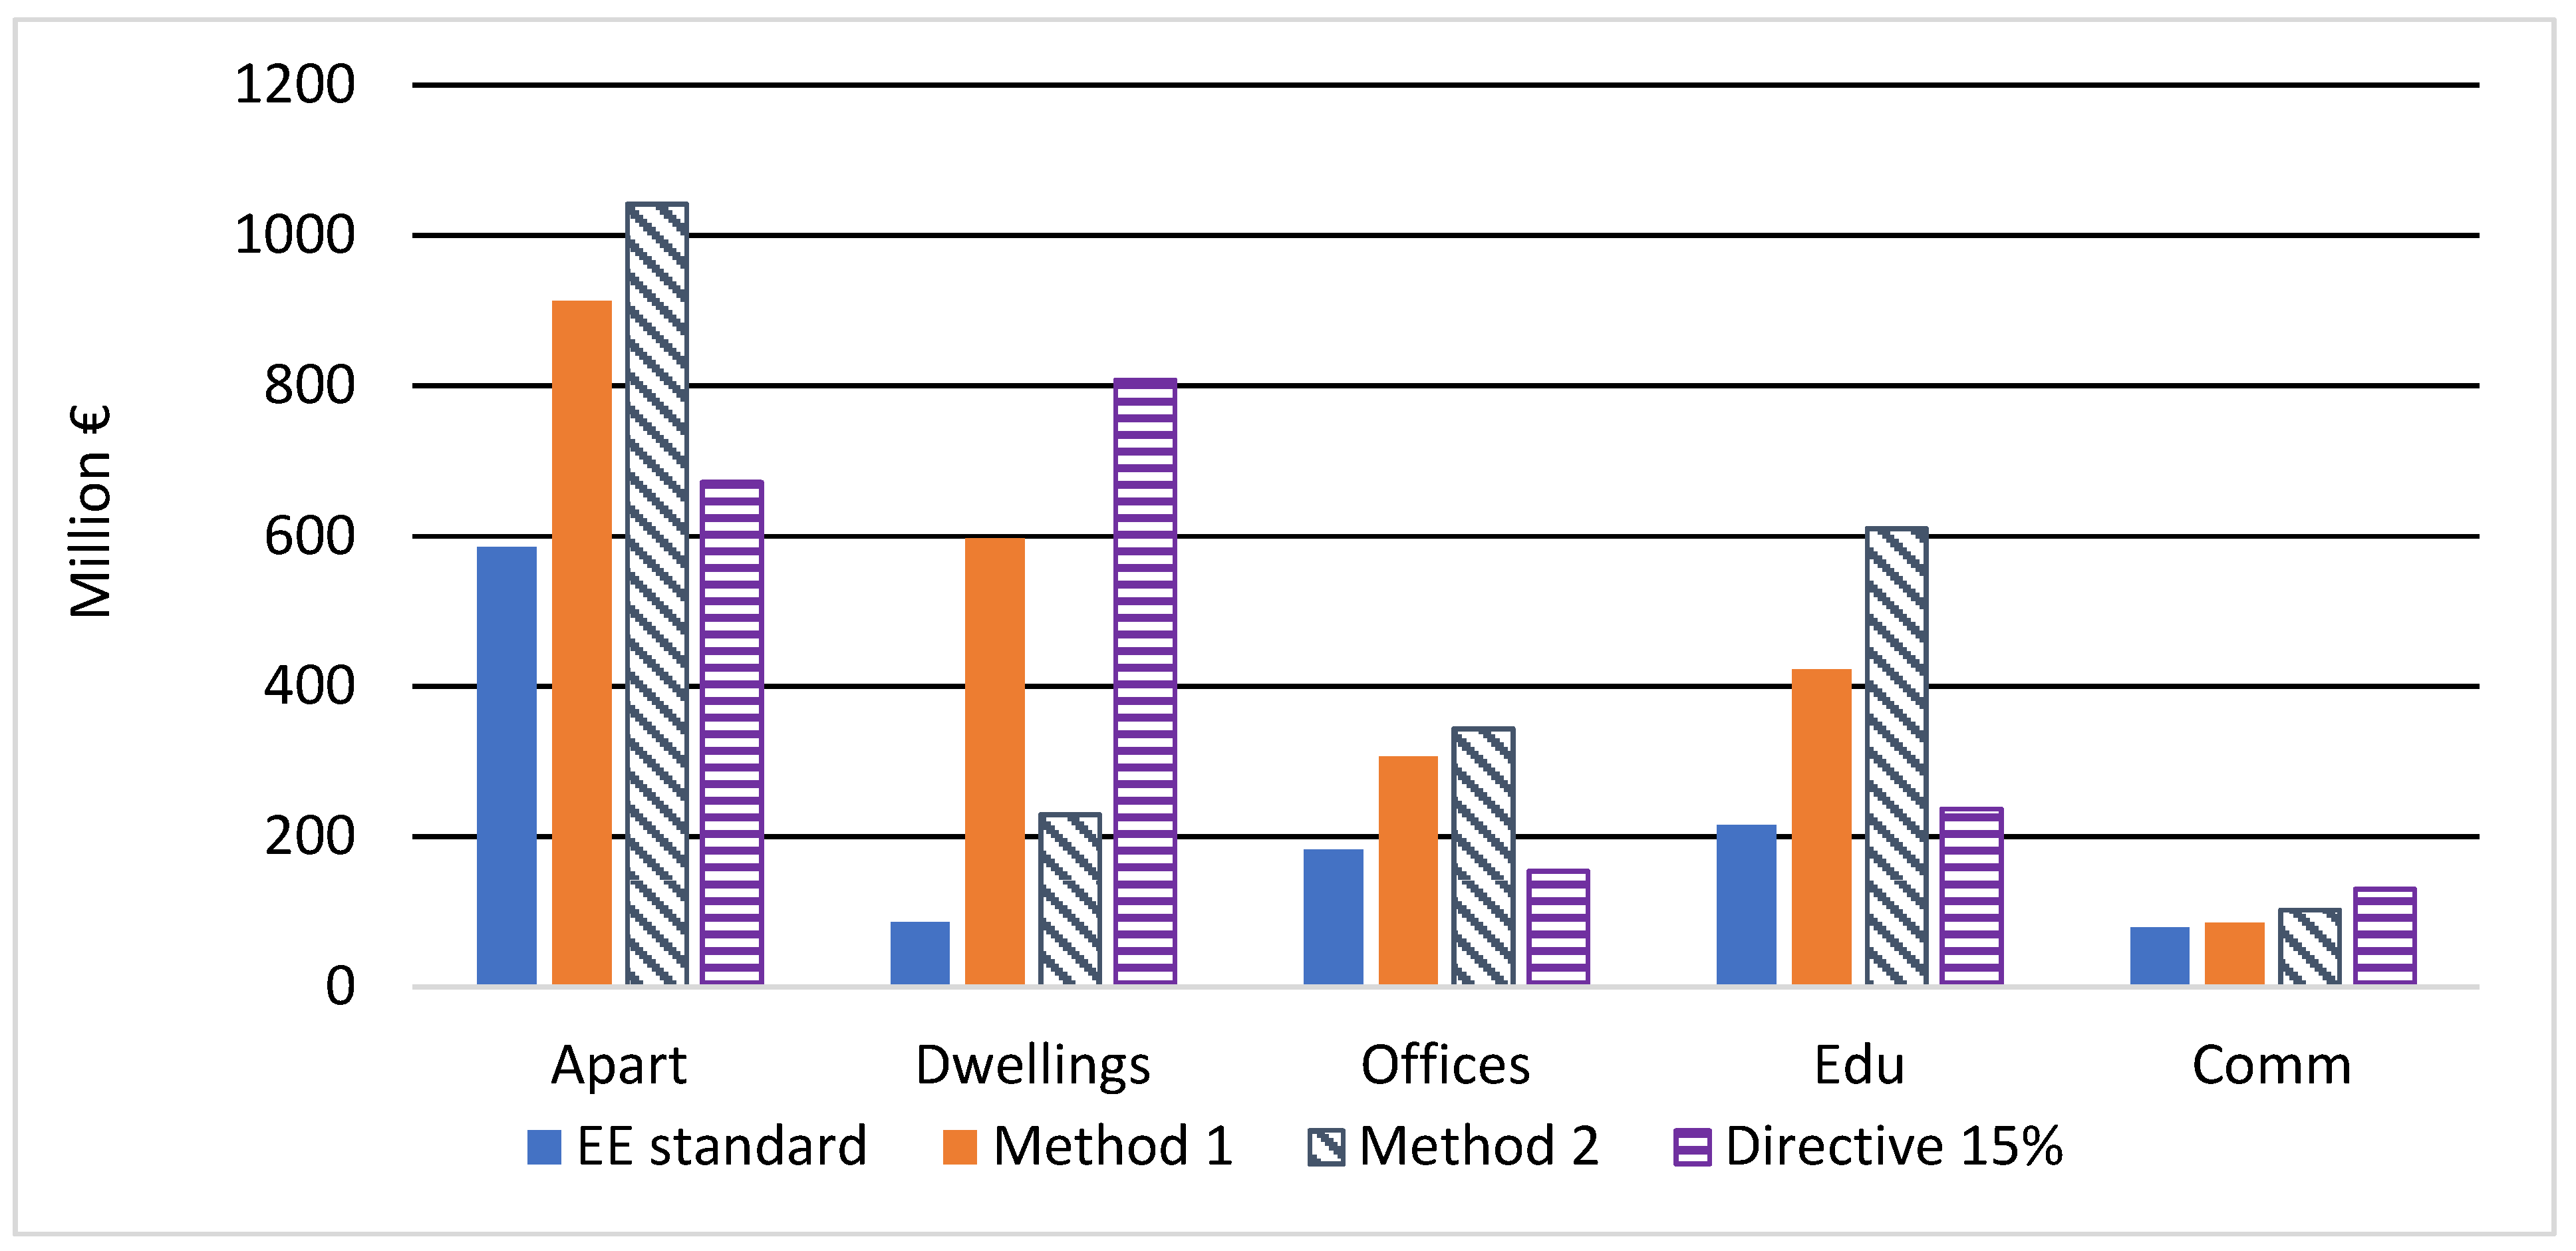
Finally, the cost estimates (in million euros) are then reported in Figure 5: these are derived by multiplying the renovation volumes (m2) derived from the rates in Table 10 by the cost per square metre, as detailed in Section 2.
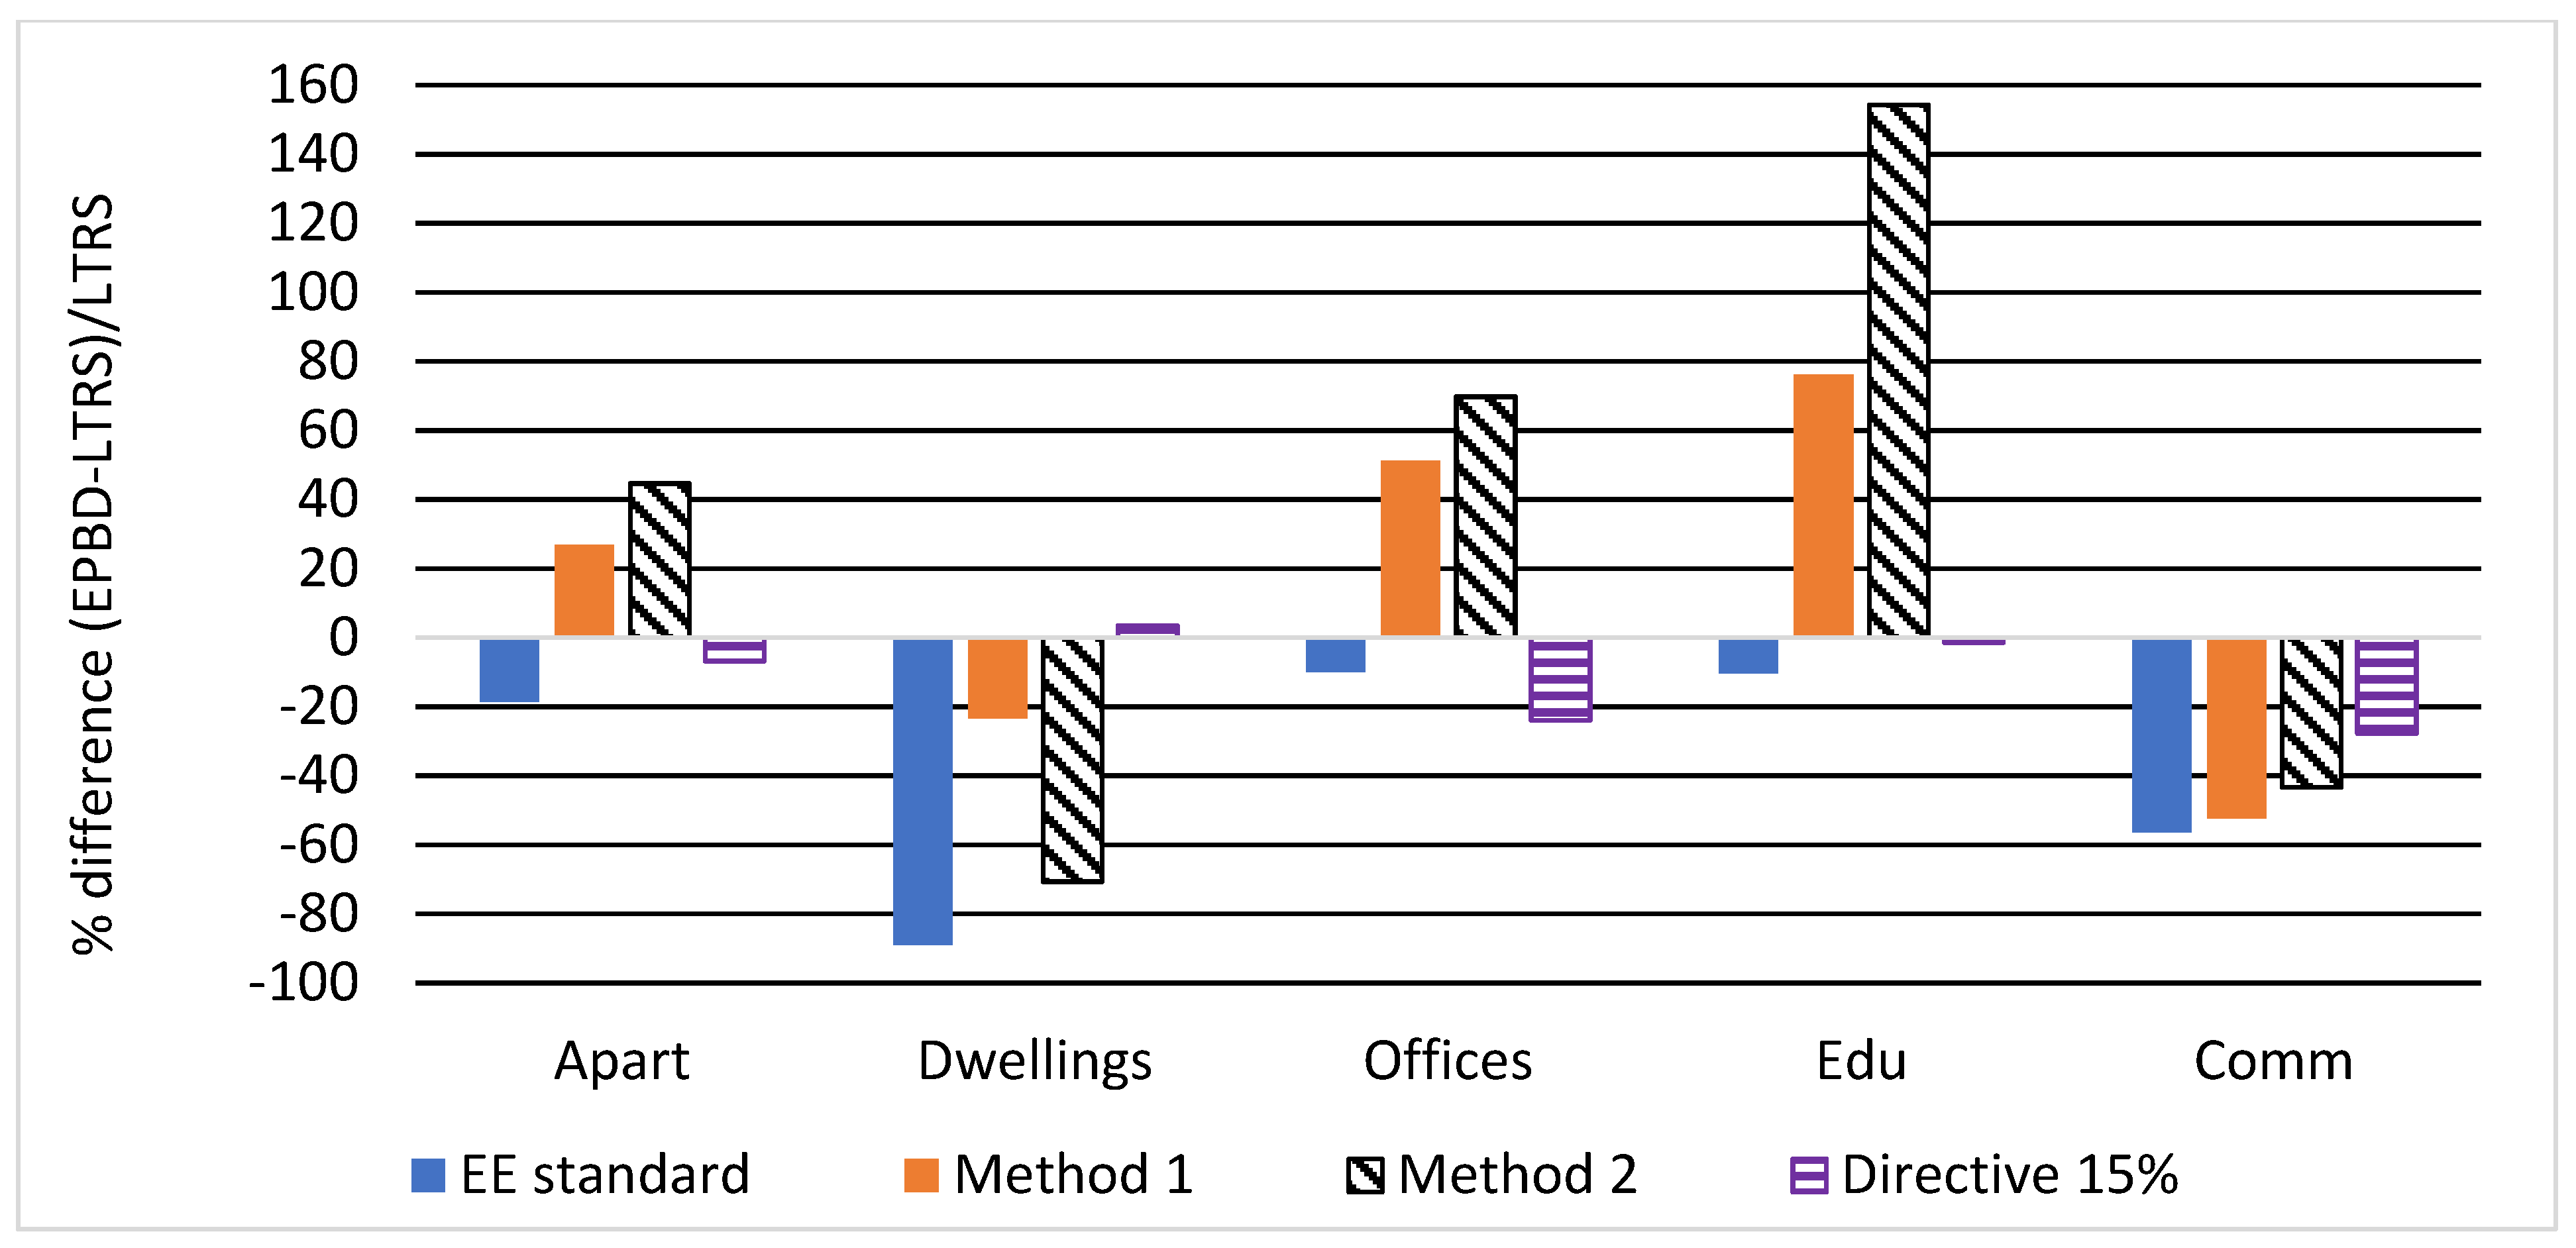
The percentage differences of renovation volumes between EPBD 2033 and the LTRS, the latter assuming a constant renovation rate to class C by 2050, are reported in Table 12 and visualised in Figure 6.
Figure 6 therefore compares the EPBD directive with the Estonian LTRS ambition, attempting to answer the question: ”How much would it cost to assume a constant renovation rate to class C by 2050 (LTRS), instead of adopting the EPBD right away?”.

3.3. Energy Savings and CO2 Emissions Reduction

Energy consumption and CO2 emissions reduction are here computed as described in Section 2. The net reduction amount in TWh per year, with respect to the 2020 consumption, is listed in Table 13; the reduction percentages are reported in Table 14.
Table 14 shows a curious effect: the values for Met.1 and Met.2, namely the percentage ratios (net reduction)/(total consumption), are the same for all building types. Let us recall that the reduction values account for the renovation volume percentage from G (or H) to E, combined with the upper value of G-class (for 2020) relative to the upper E-class value (for 2033). Those equal percentages thus unveil the algebraic structures of Met.1 and Met.2 (see Table 4 and Table 5), which are fairly different from the simpler EE and Dir. 15%. The labelling arrangement is accordingly crucial. Regarding the carbon dioxide emissions, we computed the total amount of reduction in tons per year, as given in Table 15.
Finally, the percentage of CO2 emissions reduction is illustrated in Table 16.

4. Discussion

4.1. Renovation Rates

Some overall considerations about testing the Directive 15% proposal could be drawn starting from Table 9. A common energy weighted renovation rate is estimated to approach annually 1.0% in residential buildings and 1.2% in non-residential buildings [6] (this applies also to Estonia), thus 2.9% to class E in this case would be quite an extensive effort. However, this is not far from the renovation wave target that aims to double the current 1% energy weighted renovation rate to 2% (class C in the Estonian context). Furthermore, the European agenda, as defined in both the Renovation Wave Strategy [2] and Fit for 55 package [7] is aimed at lighter, stepwise renovation.
In light of the above, Table 9 exhibits strong differences about the capability of the distinct energy labelling methods to stimulate effective, yet realistic renovations of the national building stocks. Methods 1 and 2 from ISO 52003-1:2017 would respectively require an exceedingly large 6.40% and 9.24% rate from educational buildings. Although the widespread coordination that is characteristic of the public sector can induce more efficient renovation campaigns [14], improving the building stock in 7 years with a 9% renovation rate is completely unrealistic. This is more clearly the case for office buildings, which are mostly private and would require a ~6% rate.
In this sense, the Estonian EPC and Directive 15% are not demanding more than 3.49% (office buildings) and 3.70% (largest dwellings D3). These are still high requirements, yet they do not need to be lowered by large amounts, which is totally possible through a slight remodulation of the two standards. Overall, the Directive proposal imposes very uniform demands across the categories, with an average of 2.90% and a small standard deviation of 0.49%. This means that it does not distinguish among the categories, allowing for a uniform renovation plan at least for the private sector. The Estonian standard instead exhibits a strong bias towards detached houses, with minimal renovation rates between 0.28% and 0.48%. Here the SD is also quite small, only 1.28%.
Looking in fact at the standard deviations for all methods, Table 9 unquestionably suggests that both Met.1 and the one-point method Met.2 suffer from a very uneven renovation rate, that can vary from as little as 0.45% to as much as ~9%, depending on the building category. Specifically, Met.2 has an SD = 3.10%, due to the very uneven bandwidths illustrated in Figure 3, resulting from a rather sophisticated scaling prescription (see e.g., Table 5). In contrast, even if an equal bandwidth will mean that it is easier to renovate from G to F than from B to A, such a simple scale is easier to understand. In other words, it seems that the scale proposed by Directive 15% works quite well according to Estonian data; such a simple common scale evidently provides great additional value for the progress monitoring when applied in all countries.

4.2. Renovation Costs Analysis

Examining the renovation volumes in Table 10 shows substantial differences among the labelling methods; the striking feature is the fairly more uniform values for Directive 15% with respect to the large variance that is found in other methods. Specifically, the one-point Method 2 predicts volumes between ~4.5% and ~65%. When combined with the different costs per square metre of each building type, this naturally returns a highly non-uniform cost estimate, as seen in Figure 5. All methods exhibit large variations in the total costs, with the EE normative being probably the most consistent.
If we were now to ask what would happen if instead of the EPBD strategy, one adopted the Estonian LTRS ambition of a constant renovation rate to class C by 2050, Table 12 and Figure 6 provide a clear answer. For instance, using the two-point labelling Method 1 within EPBD would require for apartments 26.8% more volume (thus costs) than the LTRS. Directive 15% is instead quite aligned with the LTRS, with ~20% savings for apartment buildings and commercial buildings when using EPBD instead of the LTRS. The EE standard saves money consistently, while Method 1 and 2 can be even dramatically more expensive within EPBD compared to the LTRS. Method 2 requires the largest investment in apartment buildings, offices, and especially in the educational sector by far (a staggering +154.2%). Furthermore, the renovation volumes in Table 10 clearly show that Method 2 would be particularly unforgiving, requiring a deep intervention in the entire building stock for all categories except for private houses.
Interestingly, the commercial sector is not critically dependent on the chosen method, while Methods 1 and 2 can demand up to a double investment compared to the Estonian normative and Directive 15%. The latter is overall affordable, apart from private houses, where it requires more than three times the investment of Method 2. Overall, Directive 15% seems anyway to be the most balanced.
In summary, we can conclude that EPBD requirements with EE ambition (LTRS), namely EPC class C renovation by 2050 for all buildings, would be advantageous until 2030 only in the case of educational buildings. Especially regarding the private sector, the LTRS strategy would imply unacceptable additional costs if compared to the EPBD requirement of class E by 2033.

4.3. Energy Savings and CO2 Reduction Estimates

Computing the energy consumption reduction depends on many different parameters, e.g., renovation volume per class and labelling method, heating and electricity coefficients, and so on. The percentage of improvement against the 2020 consumption in Table 14 illustrates sharp differences among the methods, also with respect to the LTRS strategy of class C in 2050. For all labelling methods, it is mostly the combination of renovation volume and G- vs. E-class upper boundaries that guarantees a substantial improvement. The surprisingly good performance of the EE standard has actually a clear reason: in Table 13, Table 14, Table 15 and Table 16, the systematically higher values are due to the renovation occurring from H-class, whereas all the other methods start from G-class. In a sense, also in view of adoption by all EU member states, Method 1 and Directive 15% seem to provide the best compromises among costs, annual renovation rates, and environmental gains.
As the differences in cost and renovation volume between the two exhibit a huge variance depending on the specific category, choosing either method could mostly be a matter of renovation feasibility and political choices for one building type over another (e.g., pushing renovations of private houses rather than educational buildings).

5. Conclusions

Several methods for energy performance labelling, which are prescribed by either national regulations or European directives, have been compared and applied to a large dataset of EPC certificates of nearly 25,000 Estonian apartment buildings, detached houses, office buildings, and educational, commercial, and services sectors.
By analysing the EPC classes bandwidths and the resulting allocations, we have estimated the renovation rates that would be imposed on the Estonian building stock by each method, to fulfil the European Climate Target Plan by the year 2033.
Generally, the required renovation rates notably depended on the chosen EPC bandwidth method, clearly showing a need for a common strategy. The two-points and one-point methods proposed in ISO 52003-1:2017 and ISO 52003-2:2017 exhibited a very uneven bandwidth structure, which resulted in large differences in renovation rates that could be unrealistically high, such as 9%.
Conversely, the national regulation of Estonia and Directive 15% proposal in COM/2021/802, which should be approved in 2023, benefit from a more even allocation of classes bandwidth. However, single-family houses were an outlier in the Estonian regulation, resulting in very low renovation rates. For other building categories there were smaller differences among the renovation rates of the various building categories, which most typically ranged between 2.5 and 3% with the Directive and were slightly lower with the Estonian regulation.
In conclusion, a common EPC scale with defined bandwidths is sorely needed to execute the European deep renovation targets with the same effort and ambition. The renovation rates that were calculated with the Estonian EPC database reveal that the Directive 15% proposal with fixed zero emissions works well, resulting in reasonably even and realistic renovation rates for all building categories.
In a similar fashion, the methods’ performance has strong implications for renovation costs, as well as energy consumption and carbon dioxide emissions. The Estonian LTRS that aims at class C by 2050 results in additional costs compared to the EPBD directive. A preliminary analysis of costs until 2033 showed that the one-point Method 2 was not meaningful because of overshooting, while the two-points Method 1 was useful, together with the Directive 15% that was slightly more balanced and managed to keep the costs more controlled. It is somewhat surprising that the simplest and most robust method, Directive 15%, seems to be the most straightforward in the execution of renovation targets.
Although the methodology introduced in this paper is simple enough to be easily applied to common EPC databases, the study at hand is preliminary and essential. Several improvements for future perspectives can thus be easily identified. Since in fact ZEB values are currently not yet defined, we had to use existing Estonian NZEB values for class A; this shall be updated once the legislation has taken care of the matter. Moreover, it would be interesting to investigate whether our major findings are confirmed in other countries. If the annual renovation rates are still around 3% for most countries, it might be eventually advisable to remodulate the 15% level to relax the requirements in a more realistic fashion.
Additionally, the economic analysis here attempted is rather preliminary and needs refinements in several aspects. Particularly, since renovation rates are driven by the macroeconomic arguments for the investment function, namely interest rates (inverse) and income (positive), these will need to be addressed in the future as well.

Author Contributions

Conceptualization, A.F. and J.K.; methodology, A.F. and J.K.; software, A.F.; formal analysis, A.F.; investigation, A.F.; resources, J.K.; data curation, A.F.; writing—original draft preparation, A.F.; writing—review and editing, A.F. and J.K.; supervision, J.K.; project administration, J.K.; funding acquisition, J.K. All authors have read and agreed to the published version of the manuscript.

Funding

Support is acknowledged from the European Regional Development Fund via the Estonian Centre of Excellence in Zero Energy and Resource Efficient Smart Buildings and Districts ZEBE, grant 2014-2020.4.01.15-0016, from the Estonian Research Council through the grants PSG409, PRG658, and DigiAudit, from the Estonian Ministry of Education and Research and European Regional Fund (grant 2014-2020.4.01.20-0289), and by the European Commission through the H2020 project Finest Twins (grant No. 856602).

Data Availability Statement

Not applicable.

Conflicts of Interest

The authors declare no conflict of interest. The funders had no role in the design of the study; in the collection, analyses, or interpretation of data; in the writing of the manuscript, or in the decision to publish the results.

Appendix A

This section reports the tables featuring the EPC certificates percentages per energy class, as allocated by the different methods: for dwellings D1 in Table A1, D2 in Table A2, D3 in Table A3, office buildings in Table A4, educational buildings in Table A5, and commercial buildings in Table A6.
Table A1. EPC certificates % per energy class, dwellings D1 (A < 120 m2).
Cl.EEMet.1Met.2Dir. 15%
A39.561.410.5739.56
B48.2681.850.844.15
C2.915.5210.516.14
D4.991.6371.358.87
E1.375.0812.2715.98
F1.321.322.388.57
G1.193.182.0816.73
H0.400.000.000.00
Table A2. EPC certificates % per energy class, dwellings D2 (A = 120 m2–220 m2).
Cl.EEMet.1Met.2Dir. 15%
A33.500.050.8933.50
B32.8739.040.856.14
C24.6010.953.8711.57
D5.464.5655.3917.24
E1.4415.9733.646.58
F1.1414.583.628.76
G0.6714.851.7416.22
H0.320.000.000.00
Table A3. EPC certificates % per energy class, dwellings D3 (A > 220 m2).
Cl.EEMet.1Met.2Dir. 15%
A13.441.650.4213.44
B27.6434.291.239.80
C12.148.951.7720.60
D38.757.0932.529.38
E3.2834.2949.469.83
F1.866.909.4521.90
G1.096.835.1515.07
H0.320.000.000.00
Table A4. EPC certificates % per energy class, as allocated by the different methods, office buildings.
Cl.EEMet.1Met.2Dir. 15%
A9.330.500.139.33
B14.1220.430.3819.17
C23.087.573.0326.23
D16.5215.6417.4014.00
E12.4814.7532.9110.59
F9.5811.6021.565.55
G8.0729.5124.5915.13
H6.810.000.000.00
Table A5. EPC certificates % per energy class, as allocated by the different methods, educational.
Cl.EEMet.1Met.2Dir. 15%
A6.630.350.276.63
B5.5711.480.0910.95
C18.026.541.4119.52
D25.8811.4010.0723.14
E21.1125.4423.5014.66
F13.6918.0237.909.98
G6.4526.7726.7715.11
H2.650.000.000.00
Table A6. EPC certificates % per energy class, as allocated by the different methods, commercial.
Cl.EEMet.1Met.2Dir. 15%
A27.991.780.8127.99
B18.6143.370.9710.19
C34.9517.9610.0316.99
D5.9917.6433.3317.31
E1.627.4440.789.55
F2.101.295.342.91
G2.5910.528.7415.05
H6.150.000.000.00

References

  1. Glachant, J.-M.; Linares, P.; Loeschel, A.; Edenhofer, O.; Tagliapietra, S.; Zachmann, G. The European union energy transition: Key priorities for the next five years. Eur. Energy Clim. J. 2020, 9, 5–14. [Google Scholar] [CrossRef]
  2. European Commission. COM(2020) 662 Final—Renovation Wave Strategy; European Commission: Brussels, Belgium, 2020. [Google Scholar]
  3. European Commission. Questions and Answers on the Renovation Wave. 2020. Available online: https://ec.europa.eu/commission/presscorner/detail/en/qanda_20_1836 (accessed on 19 September 2022).
  4. European Commission. COM(2020) 562 Final—Climate Target Plan; European Commission: Brussels, Belgium, 2020. [Google Scholar]
  5. European Commission. COM(2019) 640 Final—European Green Deal; European Commission: Brussels, Belgium, 2019. [Google Scholar]
  6. Zangheri, P.; Castellazzi, L.; D’agostino, D.; Economidou, M.; Ruggieri, G.; Tsemekidi-Tzeiranaki, S.; Maduta, C.; Bertoldi, P. Progress of the Member States in implementing the Energy Performance of Building Directive; EUR 30469 EN; Publications Office of the European Union: Luxembourg, 2021. [Google Scholar]
  7. European Commission. COM/2021/550 Final—Fit for 55; European Commission: Brussels, Belgium, 2021. [Google Scholar]
  8. European Commission. COM/2021/802 Final; European Commission: Brussels, Belgium, 2021. [Google Scholar]
  9. Hamburg, A.; Kalamees, T. How well are energy performance objectives being achieved in renovated apartment buildings in Estonia? Energy Build. 2019, 199, 332–341. [Google Scholar] [CrossRef]
  10. Pasichnyi, O.; Wallin, J.; Levihn, F.; Shahrokni, H.; Kordas, O. Energy performance certificates—New opportunities for data-enabled urban energy policy instruments? Energy Policy 2019, 127, 486–499. [Google Scholar] [CrossRef]
  11. Zhang, M.; Wang, M.; Jin, W.; Xia-Bauer, C. Managing energy efficiency of buildings in China: A survey of energy performance contracting (EPC) in building sector. Energy Policy 2018, 114, 13–21. [Google Scholar] [CrossRef]
  12. ISO 52003-2:2017; Energy Performance of Buildings—Indicators, Requirements, Ratings and Certificates—Part 2: Explanations and Justifications for ISO 52003-1. International Organization for Standardization: Geneva, Switzerland, 2017.
  13. Droutsa, K.G.; Kontoyiannidis, S.; Dascalaki, E.G.; Balaras, C.A. Mapping the energy performance of hellenic residential buildings from EPC (energy performance certificate) data. Energy 2016, 98, 284–295. [Google Scholar] [CrossRef]
  14. Ferrantelli, A.; Belikov, J.; Petlenkov, E.; Thalfeldt, M.; Kurnitski, J. Evaluating the energy readiness of national building stocks through benchmarking. IEEE Access 2022, 10, 45430–45443. [Google Scholar] [CrossRef]
  15. ISO 52003-1:2017; Energy performance of buildings—Indicators, requirements, ratings and certificates—Part 1: General aspects and application to the overall energy performance. International Organization for Standardization: Geneva, Switzerland, 2017.
  16. Jenkins, D.P.; Semple, S.; Patidar, S.; McCallum, P. Changing the approach to energy compliance in residential buildings—Re-imagining EPCs. Energy Buidings 2021, 249, 111239. [Google Scholar] [CrossRef]
  17. de Wilde, P. The gap between predicted and measured energy performance of buildings: A framework for investigation. Autom. Constr. 2014, 41, 40–49. [Google Scholar] [CrossRef]
  18. Zuhaib, S.; Schmatzberger, S.; Volt, J.; Toth, Z.; Kranzl, L.; Maia, I.E.N.; Verheyen, J.; Borragán, G.; Monteiro, C.S.; Mateus, N.; et al. Next-generation energy performance certificates: End-user needs and expectations. Energy Policy 2022, 161, 112723. [Google Scholar] [CrossRef]
  19. Semple, S.; Jenkins, D. Variation of energy performance certificate assessments in the European Union. Energy Policy 2020, 137, 111127. [Google Scholar] [CrossRef]
  20. Gibbons, L.; Javed, S. A review of HVAC solution-sets and energy performace of nearly zero-energy multi-story apartment buildings in Nordic climates by statistical analysis of environmental performance certificates and literature review. Energy 2022, 238, 121709. [Google Scholar] [CrossRef]
  21. Ferrantelli, A.; Thalfeldt, M.; Kurnitski, J. Benchmarking the measured energy use of Nordic residential buildings and their Zero Energy-readiness. In Proceedings of the CLIMA 2022 the 14th REHVA HVAC World Congress, Rotterdam, The Netherlands., 22–25 May 2022. [Google Scholar] [CrossRef]
  22. Pagliaro, F.; Hugony, F.; Zanghirella, F.; Basili, R.; Misceo, M.; Colasuonno, L.; Del Fatto, V. Assessing building energy performance and energy policy impact through the combined analysis of EPC data—The Italian case study of SIAPE. Energy Policy 2021, 159, 112609. [Google Scholar] [CrossRef]
  23. Majandus-ja Taristuminister. Nõuded Energiamärgise Andmisele ja Energiamärgisele; Majandus-ja Taristuminister: Tallinn, Estonia, 2015. [Google Scholar]
  24. Yun, G.Y.; Kim, H.; Kim, J.T. Effects of occupancy and lighting use patterns on lighting energy consumption. Energy Build. 2012, 46, 152–158. [Google Scholar] [CrossRef]
  25. Poll, S.; Teubert, C. Pilot study of a plug load management system: Preparing for sustainability base. In Proceedings of the 2012 IEEE Green Technologies Conference, Tulsa, OK, USA, 19–20 April 2012. [Google Scholar]
  26. Ministry of Economic Affairs and Communications. Long-Term Strategy for Building Renovation; Ministry of Economic Affairs and Communications: Tallinn, Estonia, 2020. [Google Scholar]
  27. Directorate-General for Energy. EU Countries’ 2018 Cost-Optimal Reports (Estonia); European Commission: Brussels, Belgium, 2018. [Google Scholar]
  28. Arumägi, E.; Simson, R.; Kuusk, K.; Kalamees, T.; Kurnitski, J. Hoonete Kuluoptimaalsete Energiatõhususe Miinimumtasemete Analüüs; Tallinna Tehnikaülikool: Tallinn, Estonia, 2017. [Google Scholar]
  29. Tallinn University of Technology. Energiakandjate Kaalumistegurid [Weighting Factors for Energy Carriers]; Tallinn University of Technology: Tallinn, Estonia, 2017. [Google Scholar]
  30. SEI Tallinn. Eesti Kliimaambitsiooni Tõstmise Võimaluste Analüüs [Reaching Climate Neutrality in Estonia]; SEI Tallinn: Tallinn, Estonia, 2019. [Google Scholar]
  31. R Core Team. R: A Language and Environment for Statistical Computing; R Foundation for Statistical Computing: Vienna, Austria, 2020. [Google Scholar]
Figure 1. Comparison of number of EPC certificates per class, apartment buildings.
Energies 15 07552 g001
Figure 2. Comparison of number of EPC certificates per class including Directive 15% apartment buildings.
Energies 15 07552 g002
Figure 3. Energy label classes bandwidths for apartment buildings (kWh/(m2a)).
Energies 15 07552 g003
Figure 4. Renovation rates (%) for selected building categories.
Energies 15 07552 g004
Figure 5. Cost estimates to class E (EPBD) up to 2033, million euros.
Energies 15 07552 g005
Figure 6. Percentage difference of cost estimates to 2033 between EPBD and class C ambition in 2050 (LTRS).
Energies 15 07552 g006
Table 1. EPC summary for all building categories: number N, % over the total, mean M (kWh/(m2a)).
CategoryN% totM
Apartments394515.8%172.6
D122659.1%158.7
D210,08940.5%143.2
D3576823.2%155.7
Offices10814.3%198
Educational11324.5%204.1
Commercial618 2.5%228.4
Table 2. Estonian energy labels for the three categories of detached houses D1, D2, and D3; EPC (kWh/(m2a)).
En. LabelD1 (EPC)D2 (EPC)D3 (EPC)
A≤145≤120≤100
B146–165121–140101–120
C166–185141–160121–140
D186–235161–210141–200
E236–285211–260201–250
F286–350261–330251–320
G351–420331–400321–390
H≥421≥401≥391
Table 3. NZEB values (kWh/(m2a)) according to the Estonian regulation EE (left) and to the current European Directive EPBD (right). The EPBD does not include plug loads (non-residential) or plug loads and lighting (residential) [23].
CategoryEEEPBD
Apartments10545.9
D1, <120 m214589.4
D2, 120–220 m212073.4
D3, >220 m210059.5
Offices10062.1
Commercial160154
Educational10082.6
Table 4. Rules for determining the performance classes, Method 1 [12].
ClassEPC
A<0.5·Rr
B0.5·Rr ≤ EP < Rr
CRr ≤ EP < 0.5·(Rr + Rs)
D0.5·(Rr + Rs) ≤ EP < Rs
ERs ≤ EP < 1.25·Rs
F1.25·Rs ≤ EP < 1.5·Rs
G1.5·Rs ≤ EP
Table 5. Class boundaries for nref = 4, Method 2.
Class BoundaryY
AB0.35
BC0.5
CD0.71
DE1
EF1.411
FG2
Table 6. Average renovation costs per unit area to class C for all categories [26].
CategoryAverage Cost [€/m2]
Apartments300
Dwellings400
Offices450
Educational600
Commercial450
Table 7. Upper class boundaries (kWh/(m2a)) for Estonian apartment buildings.
Cl.EEMet.1Met.2Dir. 15%
A1056243105
B12512463132
C15013789158
D180151125185
E220187176211
F280224249238
Table 8. EPC certificates (%) per energy class, as allocated by the different methods, for apartment buildings.
Cl.EEMet.1Met.2Dir. 15%
A6.890.050.036.89
B24.6128.110.0327.93
C20.339.430.4619.77
D12.2912.4527.6610.95
E14.2016.1533.269.58
F15.5413.8426.089.56
G4.6419.9712.5015.31
H1.500.000.000.00
Table 9. Estimated annual renovation rates Rrenov, from classes F and G to class E, for all methods and building categories. Arithmetic average and standard deviation in the bottom rows.
Cat.EEMet.1Met.2Dir. 15%
Ap2.17%3.38%3.86%2.49%
D10.29%0.45%0.45%2.53%
D20.21%2.94%0.54%2.50%
D30.48%1.37%1.46%3.70%
Off3.49%5.87%6.59%2.95%
Edu3.26%6.40%9.24%3.58%
Com1.55%1.69%2.01%2.57%
Ave1.64%3.16%3.45%2.90%
SD1.28%2.09%3.10%0.49%
Table 10. Renovation volume (%) to class E, EPBD 2033.
Cat.EEMet.1Met.2Dir. 15%
Apart.21.6833.8138.5824.87
D12.914.54.4625.3
D22.1329.435.3624.98
D34.7713.7314.636.97
Offices24.4641.1146.1520.68
Edu.22.7944.7964.6725.09
Comm.10.8411.8114.0817.96
Dwell.3.0721.328.1928.83
Table 11. Renovation volume for Estonian buildings by 2050.
CategoryTotal Area [m2]
Apartments18,000,000
Dwellings14,000,000
Offices3,310,000
Educational3,145,000
Commercial3,221,000
Table 12. Percentage difference in renovation volume, EPBD vs. the LTRS.
Cat.EEMet.1Met.2Dir. 15%
Apart.−18.726.844.7−6.7
Dwell.−89.0−23.5−70.63.5
Offices−10.051.269.7−23.9
Edu.−10.476.1154.2−1.4
Comm.−56.4−52.4−43.3−27.7
Table 13. Energy consumption reduction in 2033 vs. 2020, TWh/a.
Cat.EEMet.1Met.2Dir. 15%
Dwell.0.090.070.1450.068
Apart.0.470.230.5110.119
Offices0.110.050.1170.067
Comm.0.050.020.0510.012
Edu.0.100.060.1440.028
Table 14. Energy consumption reduction in 2033 vs. 2020 for EPBD and LTRS (%).
Cat.EEMet.1Met.2Dir.LTRS
Dwell.35.816.729.457.919
Apart.35.216.729.4511.115
Offices34.916.729.513.714
Comm.28.216.729.57.712
Edu.35.816.729.512.812
Table 15. CO2 reduction in 2033 vs. 2020, t/a.
Cat.EEMet.1Met.2Dir.
Dwell.42,00049,00073,00089,000
Apart.242,000181,000288,000125,000
Offices84,00063,00095,00089,000
Comm.66,00045,00072,00043,000
Edu.43,00037,00067,00022,000
Table 16. CO2 (%) reduction in 2033 according to EPBD and LTRS vs. 2020.
Cat.EEMet.1Met.2Dir.LTRS
Dwell.54.641.050.134.826
Apart.51.137.246.833.031
Offices52.038.648.036.436
Comm.48.540.249.433.836
Edu.50.836.145.933.126
Publisher’s Note: MDPI stays neutral with regard to jurisdictional claims in published maps and institutional affiliations.

