1. Introduction
Underground mining is one of the pillars of modern society’s stable development. The underground mining method is the most economically feasible method for extracting minerals located at great depths. It allows the extraction of valuable minerals while significantly reducing the production of waste rock compared with open-pit mining [
1]. The advantages of underground mining are its relatively low environmental damage and minimal impact on climatic conditions. However, it is more dangerous for workers’ lives and health [
2]. There are various underground mining methods, and each method has advantages and disadvantages. In the underground mining industry, the selection of mining methods is based on geomechanical conditions, the geometry of the deposit, ore body depth, and other parameters [
3].
Failure processes have significant influences on underground mine development. The causes of failure can vary (e.g., low rock mass strength or an abundant inflow of water into the opening) and may lead to the destruction of underground opening integrity, causing human and financial losses. Since all geomechanical parameters have varying significance from a stability point of view, the initial strategy for safe and profitable enterprise development is to identify the weight of the most critical parameters affecting rock failure and stability. In addition, there is a direct correlation between the occurrence of a failure and the chosen mining method, which must be considered within the geomechanical risk assessment. In the past, various authors have discussed the significance of weighting criteria, but no solid methodology has been proposed for weighing risk-prone geomechanical design parameters aimed at geomechanical risk assessment. The process of weighting risk-prone parameters will improve the procedure for designing underground structures and is an important component of any comprehensive risk assessment program. These studies will increase the safety of mining operations. Moreover, such investigations will lead to an increase in the safety of mining operations by enabling us to identify geomechanical risks, select a suitable mining method, and prepare for the consequences of potential accidents. The aim of this study was to propose a sound procedure for weighing risk-prone geomechanical parameters that can be used within the geomechanical risk assessment practices.
Various weighting procedures are required elements of multi-criteria decision-making methods (MCDM) [
4]. The MCDM methods are an effective tool for experts to systematize (facilitate) decision-making with conflicting or multi-criteria parameters. Weighing methods are classified into three categories: subjective, objective, and integrated weighing methods [
5]. The subjective approach is based on obtaining information about the importance of criteria from the judgments and experiences of decision-makers. By contrast, the objective approach has a mathematical foundation, and decision-makers do not affect the weight of the criteria. The integrated weighing method involves a combination of subjective and objective approaches. Since the rock mass has a complex heterogeneous structure (for several reasons: geology, fracturing, etc.), and in most cases, the lack of quantitative geomechanical data at mining enterprises is commonplace, using mathematical methods is impractical; therefore, subjective weighting methods are more appropriate.
2. The Ridder–Sokolny Underground Mine: A Selected Case Study
In this study, the conditions of the Ridder–Sokolny mine are used for the verification of the proposed weighting procedure. Ridder–Sokolny deposit of polymetallic ores is located near Ridder city in the East Kazakhstan region. Philip Ridder discovered this deposit in 1784, and ore mining has been carried out on it since 1789. Currently, the mining is carried out by Kazzinc company, the largest zinc producer in Kazakhstan. Ore endowments are estimated at 224.5 (Mt), of which copper accounts for ~0.39%, lead accounts for ~0.78%, zinc accounts for ~1.66%; gold accounts for ~2.61 (g/t), and silver accounts for ~25.6 (g/t) [
6]. Sub-level stoping is the mining method at Ridder. Sub-level stoping is the process of extracting the desired ore or other minerals from an underground mine, leaving behind an open space known as a stope [
7]. Stoping is used when the country rock has regular ore boundaries, is steeply dipping, and is sufficiently strong not to cave into the stope. However, artificial support is also provided if excavated spaces have a complex structure planned for a permanent period. As mining progresses, the stope is often backfilled with tailings or a mixture of tailings and cement when needed for strength.
3. The Study Area
3.1. Geology
The Ridder–Sokolny polymetallic deposit is located between the Obruchevsky uplift and the Severny shear thrust fault in the central part of the Leninogorsk ore field [
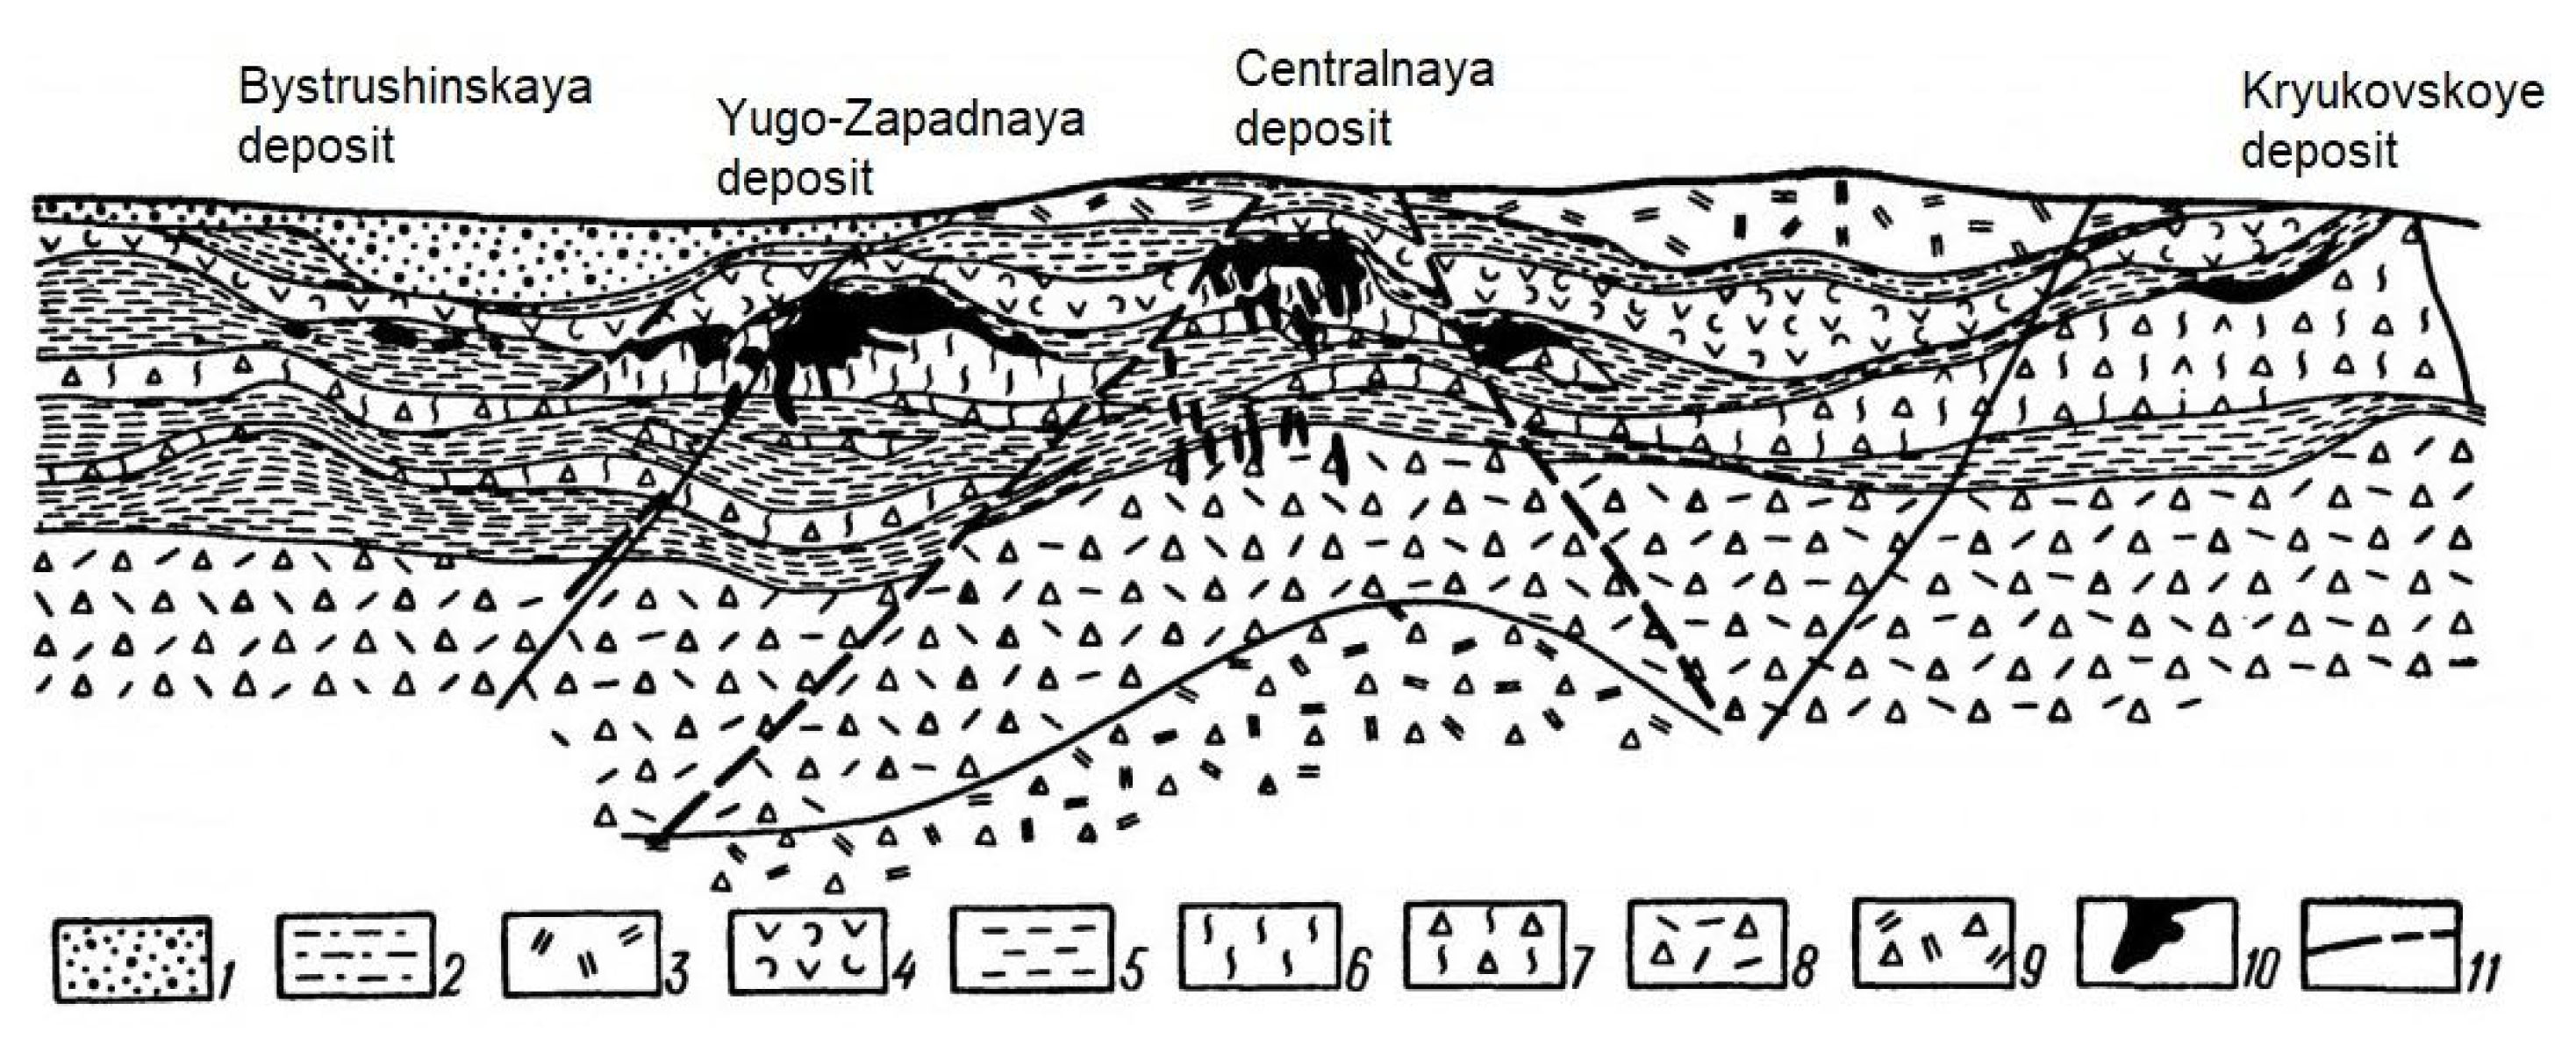
8]. The massif structure is divided into formations (from bottom to top: Leninogorskaya, Kryukovskaya, Ilyinskaya, and Sokolny) and is composed of volcanogenic sedimentary rocks from the Devonian period. The rocks of the Ilyinskaya and Sokolnaya formations overlap the central part of industrial mineralization localized in the rocky volcanogenic–sedimentary rocks of the Kryukovskaya formation, which lies on the Leninogorsk formation.
The Kryukovskaya formation consists of siliceous, calcareous clay siltstones with layers of gravelites, sandstones, and porphyrite breccias. Metasomatically modified rocks are widely represented: chloritolites, sericitolites, siliceous–carbonate–sericite rocks, and microquartzites. The width of the Kryukovskaya formation is 500–540 m.
The ore-bearing structure of the deposit is represented by a combination of gently dipping and steeply dipping ore bodies localized under the calcareous siltstones. Gently dipping ore bodies are represented on the upper part in the contact zones with siltstones of the top of Kryukovskaya formation (lithology code 5).
Figure 1 shows the mineralization of gently dipping-type deposits of the upper horizon that by now, almost all of them have been mined [
8].
After the extraction of the gently dipping ore bodies, mining focused on the steeply dipping ore bodies presented in the form of layers, veins, and lenses concentrated on the lower level of the mineralization. The sizes of the ore bodies along the strike and downdip are small, with a total of more than ten thousand block units.
The block structure of the deposit is determined by tectonic disturbances, mainly fissure displacement of the northwestern orientation with strike azimuths of 300–350°. There are also a number of smaller tectonic disturbances.
The ores of the Ridder–Sokolny deposit are characterized by the predominance of zinc over lead and copper. Hydrothermally altered rocks within the lower and middle horizons of the Kryukovskaya formation are widespread in the deposit. Among the metasomatic formations, sericitolites, microquartzites, quartz–sericite–chlorite, and quartz–carbonate–barite rocks predominate, composing almost the entire ore-mineralizing level of the deposit. Sphalerite, galena, chalcopyrite, pyrite, quartz, dolomite, ankerite, sericite, chlorite, and native gold are the major minerals, which make up more than 99 percent of the volume of the vein ore body. Bournonite, fahlore ore, marcasite, arsenopyrite, calcite, and cobaltite are secondary minerals. Of the rare minerals, the most widely distributed are tellurides (Pb, Ag, Bi)—altaite, hessian, and tellurobismuthite. Less common are other tellurides, sulfosalt, and sulfotellurides—wittite, tetradymite, tsumoite, and cosalite [
8].
3.2. Geomechanical Parameters
The physical and mechanical properties of rocks at the Ridder–Sokolny deposit were studied during the operation, construction, and mine-exploration stages. Laboratory tests showed that the most solid rocks include agglomerate tuffs, microquartzites, weak shales, and sericite–chloride–quartz rocks. The Ridder mine rock mass is categorized into different domains by the mine geotechnical department on the basis of lithological, geological, physical, and mechanical properties, as illustrated in
Table 1. Accordingly, the stability of mine openings was evaluated and determined for each rock domain.
The main discontinuity sets were formed during the injection of ore-bearing solutions along large fissures. Their orientation depends on the orientation of the steeply dipping ore bodies. The most dominant systems of discontinuities are a system of inclined and gently dipping fissures of stratification with undulating occurrence in volcanogenic sedimentary rocks and a system of steeply dipping fissures orientated across the strike of steeply dipping ore bodies in the lower portion of the mineralization. In general, in Ridder, the rock mass is of a blocky type that has a cubic shape and is formed by the intersection of three orthogonal major discontinuity sets.
The average discontinuity spacing and opening range are 0.5–0.7 m and 0.1 mm, respectively. In most cases, there is no fissure filler (except in crushing zones). The discontinuity weathering in the upper portion of the mineralization zone is moderate, and there are no signs of weathering in the lower portions of the mineralized zone. The water condition in the upper portion of the mineralization zone is in the form of dripping. A summary of the physical and mechanical properties of various rock units compiled from the mine database is presented in
Table 1. These properties were obtained by core testing on intact rock samples obtained from geological exploration wells of the deposit.
It should be borne in mind that the Ridder–Sokolny deposit is very large, and additional studies are required to fully characterize the rock mass. A summary of the geomechanical ratings conducted by the mine geotechnical department is illustrated in
Table 2 [
8].
The size of the stopes is one of the most important parameters affecting the displacement field around stope and stope stability. Therefore, for a more realistic weighting of geomechanical parameters and their influence on opening stability, the approximate dimensions of the stopes should be determined. For this purpose, the design dimensions and failure modes of 219 stopes of the Ridder–Sokolny mine were analyzed. The average stope dimensions at Ridder were determined to be 31 m (height), 33 m (width), and 39 m (length).
4. Development of the Weighting Procedure
Because of the necessity to reduce the risks associated with underground mining, researchers must develop realistic methods for assessing the geomechanical conditions of the rock mass before and during the design. In particular, managing and predicting geotechnical risks is challenging in other domains [
9,
10]. The development of realistic criteria to quantify rock mass design parameters and weighting them according to their significance has proven to be very difficult due to the heterogeneous nature of the rock mass and the influence of underground mining processes. Therefore, there is a need to develop methodologies for the weighting of geomechanical parameters considering the challenges associated with rock mass characterization. The main objective of this study was to develop a weighting strategy to quantify the significance of rock mass design parameters. The Fuzzy Analytical Hierarchy Process (FAHP) method proposed by Buckly [
11] and applied by Pehlivan [
12] form the basis of the developed weighting methodology.
The Fuzzy Analytical Hierarchy Process (FAHP) is a multi-criteria decision-making (MCDM) method based on the hierarchical structure analysis and systematic determination of the criteria weights using the fuzzy set theory. The criteria weight depends on linguistic evaluation provided by experts according to their experience and knowledge. A weighting process based on fuzzy logic is a more appropriate approach to overcome uncertainties; in some cases, decision-makers are more confident in giving a judgment range than fixed values. FAHP is used in a wide range of fields, such as risk assessment, energy, business, mechanical engineering, and others [
13]. Therefore, the use of FAHP as a weighting method for underground conditions is useful because, in geomechanical design, we always lack geological and geomechanical data that are associated with uncertainties. It should be noted that there are five fundamental FAHP methods proposed by [
11,
12,
14,
15,
16,
17]. In this study, the geometric mean method using the triangular membership function was used. In this method, a unique fuzzy number is determined for the weight of the selected parameters, and the method is managed more easily mathematically. Moreover, the method is more suitable for cases in which there is a lack of sufficient data and a high scatter in the available data.
The Ridder–Sokolny operation has a long history of mining; the mine is a complex structure of stopes, drifts, ramps, and other workings. In addition, studies of the rock mass are constantly being conducted at the mine. Therefore, it is reasonable to weigh the key geomechanical design parameters with the direct participation of local experts. For this reason, the authors made a two-month visit (June–July 2021) to the site, during which they had productive interactions with the geomechanical department of the Ridder–Sokolny mine, and they were in contact with the department over the course of the research. Accordingly, the selected parameters for validation and testing of the proposed method were juxtaposed on the basis of over ten years of experience and knowledge of the Ridder–Sokolny geomechanical department experts through a local expert survey program. The Ridder geomechanical department monitors active and mined workings weekly and receives and processes information from all geotechnical team members (managers, engineers, technicians, shift men, planning department staff, etc.) involved in the mining process. In addition, during this study, geological sections of the collapsed openings, a summary of core description and photography database, the design parameters of the excavated units, the geomechanical database of rating indicators, information on the backfilled stopes, and the catalog of unfilled stopes were analyzed and used along with the opinion of experts on opening stability and failure mode.
4.1. Selection of Key Geomechanical Parameters for the Ridder–Sokolny Mine Conditions
The rock mass design parameters are key components of underground mine design that affect the safety and success of the mining operation significantly. Fundamental geomechanical problems are related to rock deformation and failure or strength behavior [
18]. These problems are affected by the rock in situ properties and the stress field surrounding the mine openings. Underground mining operations directly affect the rock mass stress balance, leading to instabilities at various locations. Consequently, under the influence of the stress field, the rock reacts in different ways, and the nature of the opening deformation depends on the geomechanical parameters. Accordingly, a specific group of physical and mechanical characteristics is measured in the laboratory or by in situ testing to determine rock mass design parameters.
In the first step of this study, a set of risk-prone geomechanical parameters were selected according to observations recorded at the Ridder–Sokolny mine. The selection of these parameters was directly influenced by the characteristics of the Ridder rock masses and mining conditions, as outlined by the mine geotechnical department and observed cases of instability. Accordingly, the following geomechanical parameters of the Ridder–Sokolny underground mine were selected for the evaluation and application of the proposed weighting procedure:
C1: Orientation of discontinuities relative to the opening;
C2: Rock mass bulk modulus: K = E/(3 * (1 − 2 v)), where E is Young’s modulus and v is Poisson’s ratio;
C3: Rock mass interlocking degree;
C4: Rock mass average block size;
C5: Rock mass cohesion;
C6: Rock mass friction angle;
C7: Water inflow.
The logic in selecting the above parameters was based on an analysis of available geomechanical data from the mine and observations documented at the mine site. The analysis of observations recorded at the Ridder–Sokolny mine showed that the pump system cannot cope with such a significant volume of water inflow (C7) because there are accumulations of water in some areas of the lower horizons. With regard to the degrading effect of water on in situ rock strength parameters, the volume of water inflow was selected as a key parameter affecting the stability and used within the developed weighting procedure.
The data analysis showed that commonly applied rock mass classification systems—modified rock mass quality (Q’), Geological Strength Index (GSI), and Rock Mass Rating System (RMR)—are used at the mine, and there are data on physical and mechanical parameters of the rock mass. The availability of quality Young’s modulus and Poisson’s ratio data prompted the use of the unifying parameter of the rock mass bulk modulus (C
2) as an indication of the rock mass mechanical response to deformation and stability. In addition, essential components of rock mass strength are cohesion (C
5) and internal friction angle (C
6); these were determined at the mine’s stages of exploration, construction, and operation by testing cores obtained from exploration and geotechnical boreholes, as reported by [
8]. The aforementioned parameters were recognized as key parameters in the assessment of overall stability and used in the application of the proposed weighting procedure. The generalized geomechanical parameters from the Ridder–Sokolny mine database are presented in
Table 1 and
Table 2.
The rock mass classification systems used a different set of geomechanical parameters; however, some characteristics were shared. The presence of some similar criteria within the commonly used classification systems indicates their importance and relevance from a geomechanical assessment point of view. For example, in all three classification systems, there is a criterion for the conditions of the discontinuity surface (degree of roughness), which directly affects the quality of contacts between discrete blocks within the rock mass and generally determines the rock mass interlocking degree (C3). Therefore, criteria C1, C3, and C4 were chosen according to the principle of collaborative presence in classification systems. It should be noted that the data on geomechanical parameters influence the assessment of experts’ judgments when weighing.
4.2. Proposed Weighting Procedure of Risk-Prone Geomechanical Parameters
4.2.1. The Geometric Mean Method
The geometric mean method [
11,
12] is an extension of the AHP that employs fuzzy pairwise comparison matrices, similar to other FAHP methods. Instead of using exact ratios, fuzzy numbers are used in this method, which allows for catching the vagueness of the criteria (
Table 3).
The calculation process in the Buckley method is illustrated in the consecutive steps below:
Step 1: Establishing the fuzzy comparison matrix:
. At this stage, experts should use linguistic variables (
Table 3) to compare criteria/parameters with each other. For example, they should answer the question of how much more or less important criterion C
1 is than criterion C
2 in terms of the impact on the failure process in the selected mining method (e.g., the sub-level stoping method used in the Ridder–Sokolny mine). Accordingly, a fuzzy pairwise comparison matrix is formed from the answers received as below:
where
and
At this stage, the fuzzy comparison matrix should be checked for consistency, as illustrated in the next section.
Step 2: The next step is the calculation of the fuzzy geometric mean value (
) for criterion (
i) in each row, and it is determined as:
Step 3: The fuzzy weights
are calculated using the following equation:
where
,
and
lk,
mk,
uk are fuzzy numbers.
Step 4: The last step is to calculate the final weights for each criterion. Defuzzification (the determination process of single numbers) is necessary for fuzzy weights
. In this study, defuzzification was accomplished using the center of the area (CoA) equation below:
4.2.2. Checking the Consistency of the Comparison Matrix
Calculating consistency is a “filter”. For this study, the method proposed by Saaty [
19] was used to verify consistency, which, according to Ahmed and Kilic [
20], is a uniform inconsistency measure before fuzzification. It is important to note that improving consistency does not imply becoming closer to the “real” situation solution. It simply indicates that when collecting data, the values estimated in the matrix are closer to being logically connected than being randomly generated. Consistency is calculated by converting the fuzzy numbers to normal numbers (
Table 3) using the following equations:
where
CI is the consistency index,
n is the size of the comparison matrix, and
λmax is the maximal eigenvalue.
The consistency degree concerning the comparison matrix is reflected in
CI.
where
CR is the consistency ratio and
RI is the random index.
The
CR can be determined as a presented comparison matrix consistency ratio to the random matrix consistency. The
RI value depends on
n (the size of the matrix), as illustrated in
Table 4. In cases in which
CR is less than or equal to 0.1, the matrix is consistent. In cases in which
CR is greater than 0.1, experts are encouraged to revise and reconsider their estimates in the pairwise comparison matrix.
4.2.3. Triangular Membership Function
In fuzzy analysis, various membership functions (MFs) are used (trapezoidal, triangular, Gaussian, polynomial PI, etc.); each is used to describe experts’ opinions; however, the triangular MF gives the best performance [
21]. Furthermore, it leads to entropy equalization and constitutes an immediate solution to optimization problems in fuzzy modeling [
22]. In addition, Sadollah [
23] stated that the triangular MF is the most used due to its simplicity, and it is considered better than other MFs. Each MF has a graphical representation, and the triangular MF consists of two straight lines (
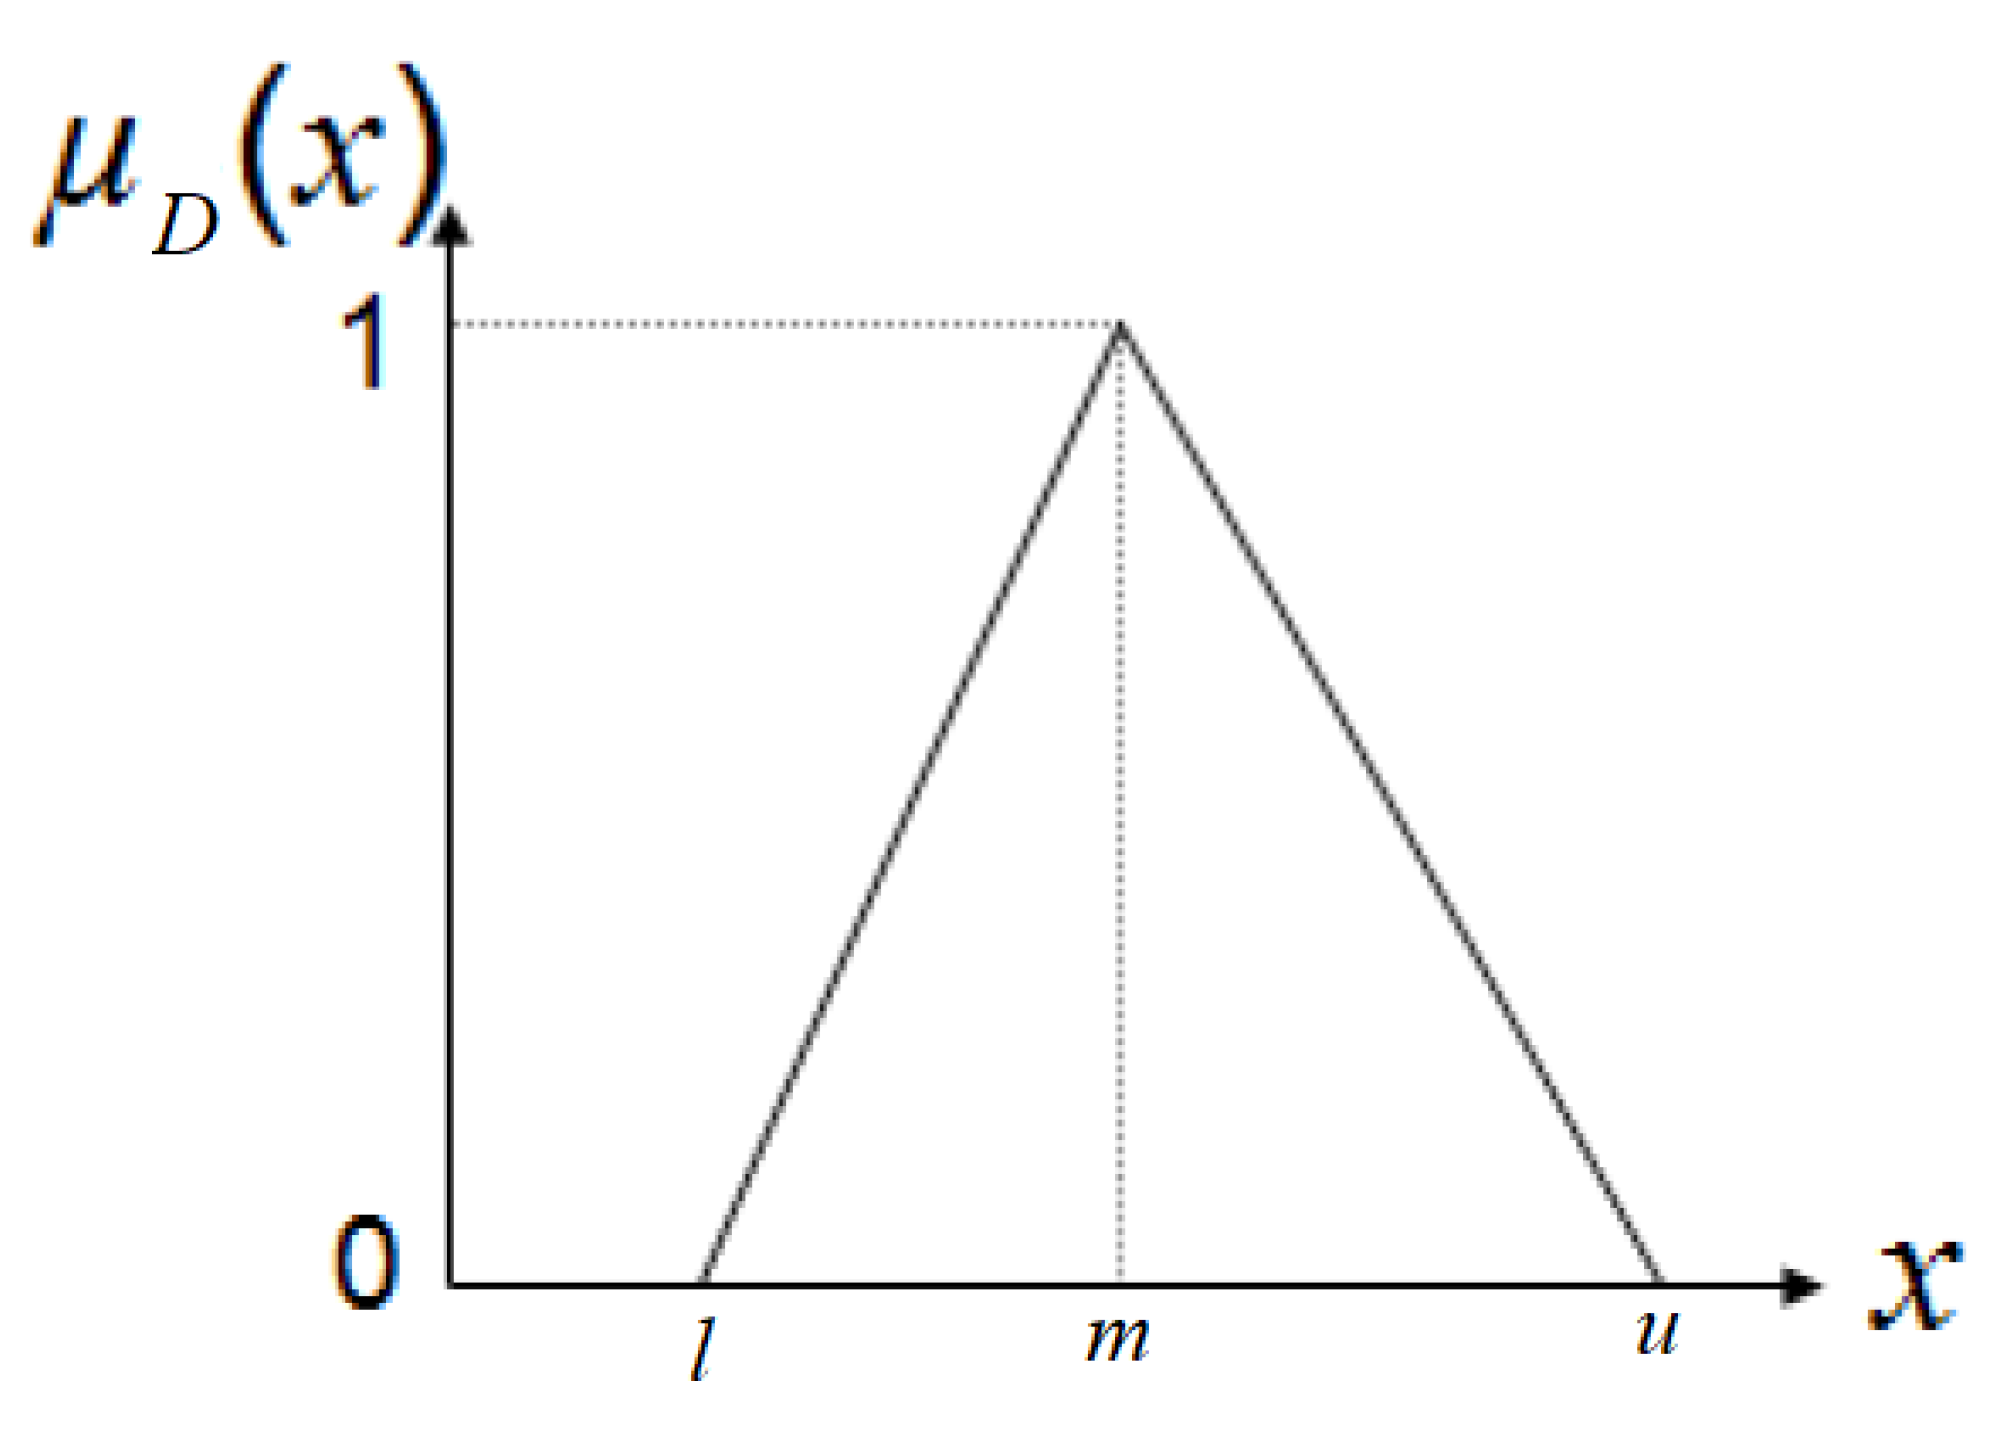
Figure 2), which facilitates its application in fuzzy modeling. A triangular MF is presented by three indicators,
l,
m, and
u, described by Equation (7); this is illustrated graphically in
Figure 2 [
21]. The indicators represent the vagueness of judgment, that is, any evaluation of the criterion is in the interval between
l and
u with a center at the point
m.
where
l and
u locate on the “base” of the triangle and parameter
m is indicative of the peak.
4.2.4. Weighting the Judgments of Experts
In cases in which several experts carry out the weighting of parameters, it is necessary to aggregate their judgments from several fuzzy comparison matrices into one using the following geometric mean equations proposed by Buckley [
24]:
If all fuzzy comparison matrices before aggregation are consistent, the final matrix will be consistent.
The formulations presented in
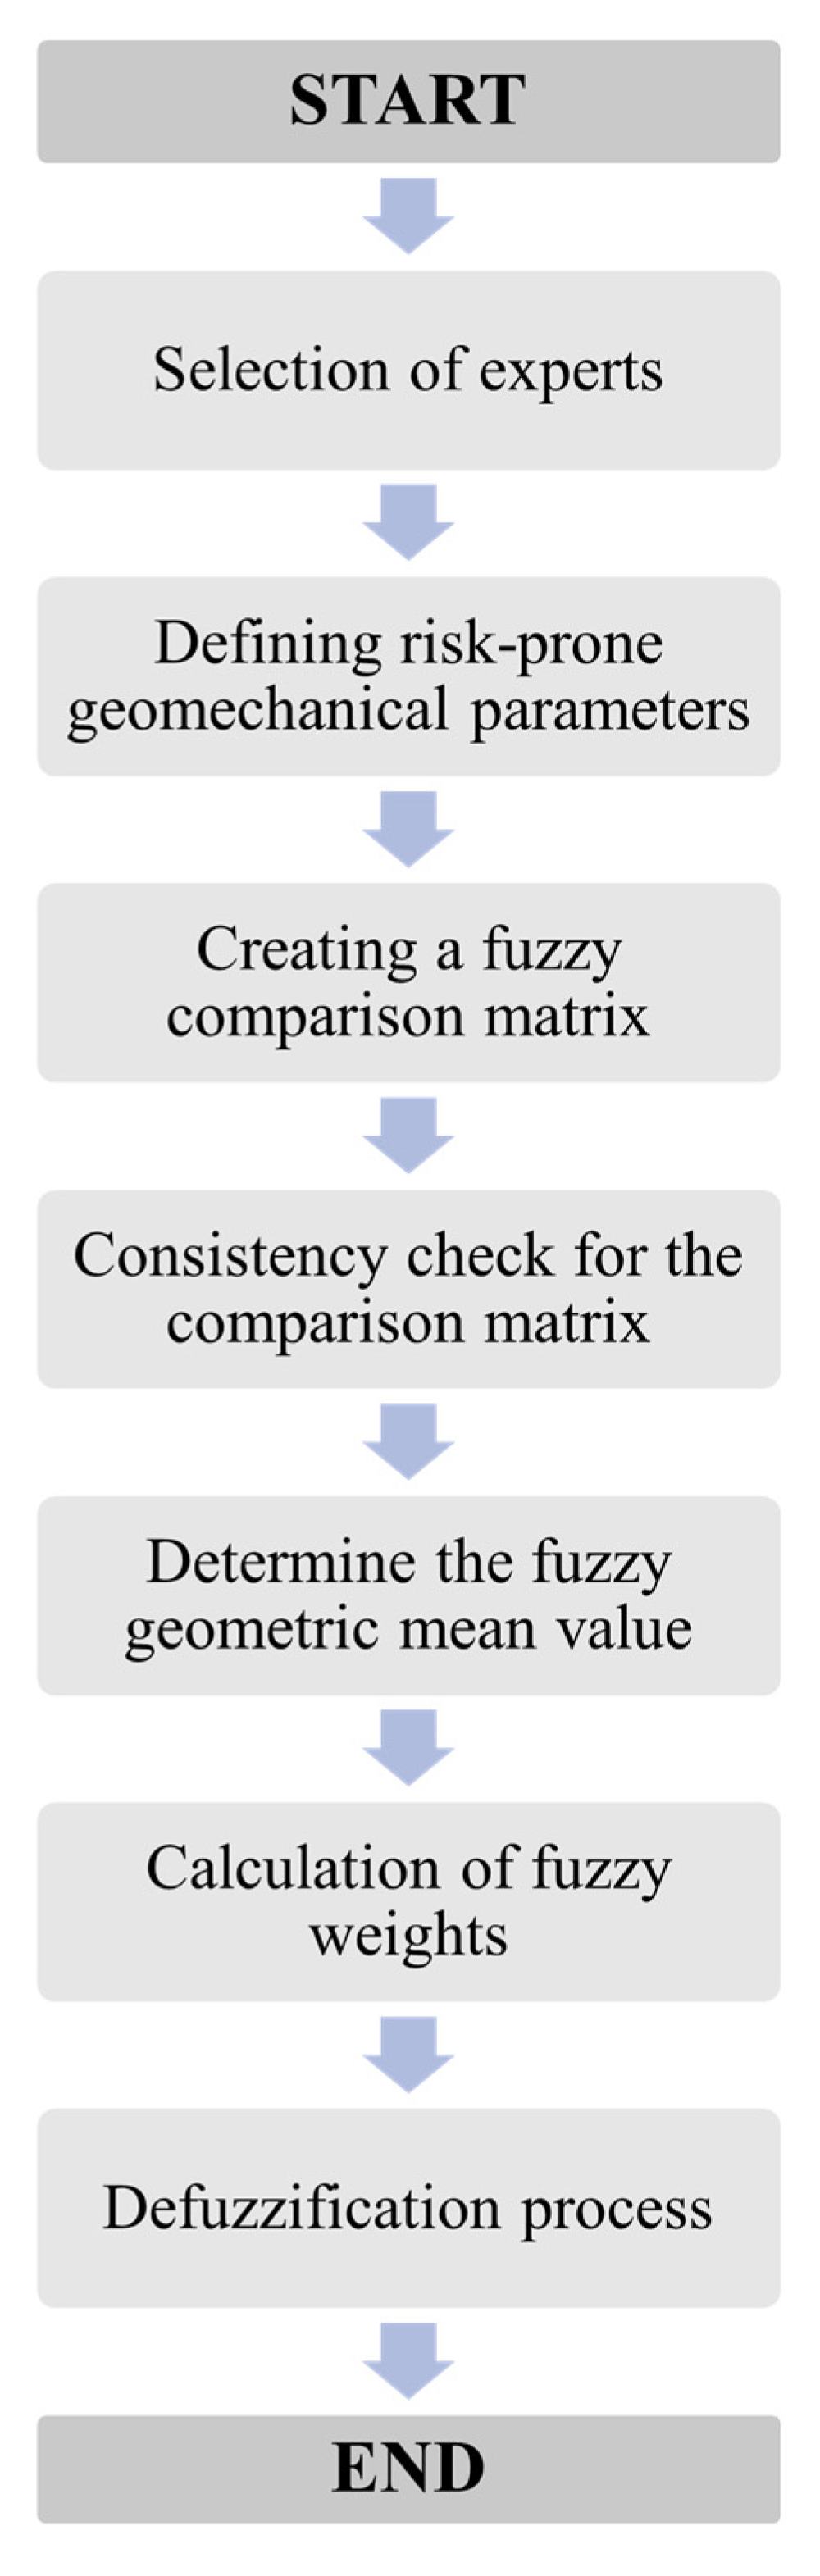
Section 3.2 were coded in the Microsoft Excel environment, and a spreadsheet was developed for the proposed weighting procedure [
25]. The application of the proposed method to an actual underground mining operation is illustrated in the following section. The developed weighting methodology is illustrated schematically in
Figure 3.
5. Analysis Results of the Weighting of Key Geomechanical Parameters at Ridder–Sokolny Mine
The developed spreadsheet was used to evaluate Ridder–Sokolny mine data, and the following results were obtained. According to the developed method, a pairwise comparison matrix was established in the first stage. A comparative presentation of the obtained results is presented in
Table 5.
After forming a fuzzy comparison matrix, it was necessary to verify that the data were not randomly taken numbers but logically related values. Therefore, it was necessary to convert fuzzy numbers to crisp ones to check the consistency. As a result, the following matrix was obtained (
Table 6).
The size of the comparison matrix was n = 7, the maximal eigenvalue λmax was 7.7, and RI was 1.32.
CI = (7.7 − 7)/(7 − 1) = 0.12
CR = 0.12/1.32 = 0.09
Employing Equations (6) and (7) and converting the calculated fuzzy numbers into crisp ones, the pairwise comparison matrix was consistent since
CR was less than 0.1. Therefore, the determined fuzzy pairwise comparison matrix was also consistent. Accordingly, the calculated fuzzy geometric mean values
and fuzzy weights
are shown in
Table 7.
In the last step of the process, defuzzification was applied to the data, and, if required, normalization processes were carried out. For the selected case study, the final obtained weightings for the selected geomechanical parameters are shown in
Table 8.
6. Discussion
A realistic weighting of geomechanical design parameters that are risk-prone is vital for the safety and economic success of underground mining operations. The developed weighting methodology was applied to one of the largest underground mining operations in Kazakhstan. According to the proposed weighting methodology, in the Ridder–Sokolny mine, which employs the sub-level stoping method, the orientation of discontinuities relative to the mining stope (C
1) had the highest significant weight and influence (32.7%) in the opening instability and from a geomechanical risk point of view. By contrast, the water inflow criterion (C7) had the lowest weight and significance (3.8%) in the opening stability. The weight hierarchy of the remaining geomechanical parameters was determined as illustrated below:
where:
C1: Orientation of discontinuities relative to the opening;
C2: Rock mass bulk modulus: K = E/(3 * (1 − 2 v)), where E is Young’s modulus and v is Poisson’s ratio;
C3: Rock mass interlocking;
C4: Rock mass block size;
C5: Cohesion;
C6: Internal friction angle;
C7: Water inflow.
This study confirmed the hypothesis that geomechanical parameters can be weighted in terms of the uncertainty associated with each parameter. Using the FAHP method, it is possible to apply the proposed weighting criteria even in heterogeneous and complicated rock masses, provided that enough observational and field data are available to calibrate the method. This is consistent with previous applications of the use of FAHP methods, such as the selection of underground mining methods [
26] or risk assessment [
27], and many other works (e.g., [
13]). Despite the widespread and successful use of the FAHP method in other engineering aspects, there are no studies to date on the application of this method to the weighing of geomechanical parameters as an essential element of geomechanical risk assessment. The contribution of this study is an improvement in the geomechanical risk assessment process, which is a key aspect of the design process and mining method selection in underground mining. Having a knowledge of the significance and weight of various design parameters enables one to adopt a more suitable design strategy, leading to better selection of an appropriate mining method. Once the significance of key parameters is known, more realistic geomechanical risk assessments aiming to optimize the mining method selection process can be carried out. The application of the developed weighting strategy to the Ridder–Sokolny underground mine illustrates that, in this case, the stability of stopes with average dimensions of 31 × 33 × 39 m was mostly affected by the orientation of the discontinuities with respect to the stope walls. Therefore, in the employed sub-level stoping mining process, special attention should be paid to the orientation of discontinuities with respect to stope walls. Accordingly, changing the stope dimension and mining sequence can be used as possible solutions to minimize the detrimental effect of this parameter and avoid risks of stope wall failure.
The results obtained in this study are only applicable to the Ridder–Sokolny mine, but the proposed methodology can be applied in other cases that involve geomechanics design. It should be noted that experts’ judgments are based on their experience and knowledge, and, in some cases, they may differ from one another. The degree of fuzziness will always be present. Nevertheless, experts’ judgments can be combined into a fuzzy comparison matrix, and any parameter can be weighed as long as there is sufficient experience and enough documented observations on the opening behavior.
7. Conclusions and Recommendations
This study aimed to develop a weighting strategy for risk-prone geomechanical parameters to achieve a more realistic assessment of geomechanical risks. According to the geomechanical database analysis of the Ridder–Sokolny mine, seven parameters for weighing were identified, and the average dimensions of the stopes were determined. Using one of the fundamental methods of FAHP (the geometric mean method), it was possible to weigh the selected geomechanical parameters. The results indicate that in the Ridder–Sokolny mine, when employing the sub-level mining method, the most important parameter affecting stope stability and associated geomechanical risks was the orientation of the discontinuities relative to the stope walls. At the same time, the inflow of water had the lowest weight regarding the stope stability at Ridder. More research is needed to expand the application of FAHP methods in geomechanical risk assessment. Further verification and calibration of the method in other underground mining conditions are required. This is a work in progress and will be the subject of the authors’ future publications.


