Article

Research on the Application of Fracture Water to Mitigate the Thermal Imbalance of a Rock Mass Associated with the Operation of Ground-Coupled Heat Pumps

1
College of Mining, Guizhou University, Guiyang 550025, China
2
College of Materials and Metallurgy, Guiyang 550025, China
3
School of Mines, China University of Mining and Technology, Xuzhou 221116, China
*
Author to whom correspondence should be addressed.
Energies 2022, 15(17), 6385; https://doi.org/10.3390/en15176385
Submission received: 21 April 2022 / Revised: 16 May 2022 / Accepted: 25 May 2022 / Published: 1 September 2022
(This article belongs to the Special Issue Energy Geotechnics and Geostructures)

Abstract

:
Shallow geothermal energy is a clean and effective form of energy that can overcome the problems associated with the depletion of carbon-based energy carbon emissions. Due to the special hydrogeological conditions in karst regions, the heat transfer between heat exchange boreholes and the ground formation is a complicated, multi-physical process. The abundant groundwater flow plays an important role in the heat transfer process, and even presents an opportunity to mitigate the heat imbalance during the long term operation of ground-coupled heat pumps (GCHP). In this study, both laboratorial experiments and numerical simulations were performed to analyze the mechanism that shows how fracture water impacts on heat capacity and the thermal imbalance of the energy storage rock mass. The results showed that the overall temperature fluctuation of the rock mass was reduced by the fracture water, and the temperature curve with time became gentler, which means in practice that the heat imbalance in the rock mass could be delayed. However, the temperature contour map showed that the impact of the fracture water flow was constrained in the nearby areas and decreased obviously with distance. The temperature field was also dragged along the direction of the fracture water flow. During the shutdown period, the fracture water significantly enhanced the thermal recovery ability of the rock mass. The results will assist in further understanding the mechanism of heat transfer and energy balance in a rock mass with fracture water flow. It is proposed that the U pipes should be located at zones with abundant fracture water if the construction condition permits. U pipes that are near the fractures should share more of the load or a denser layout could be possible as their heat transfer capacity is improved by the water flow.

1. Introduction

The ground-coupled heat pump (GCHP) is the main application technology for shallow geothermal resources [1], and the karst region has the potential for the development of geothermal resources since its abundant groundwater flow can enhance the heat transfer between the underground heat exchanger and the rock mass [2]. However, the installation and application of the GCHP system are restricted by the geological conditions of the site [3], and the issue of thermal imbalance [4] might be caused by the unequal amounts of input energy and extracted energy from the rock mass in a number of long-term operations [5].
Karst regions with complex geological conditions and abundant groundwater are widely distributed in southern China, central Asia, eastern Europe, and other places in the world [6]. Water channels are formed by fractures, fissures, and caves, which impact the thermal imbalance in the zone of heat transfer [7]. W. He et al. [8] supposed that it was difficult and expensive to install a ground heat exchanger for the karst aeras due to the low drilling rate through rocks and the additional treatment needed to prevent well collapse when fractures and caves are encountered, but the positive effect of groundwater in mitigating the thermal imbalance was not discussed.
Accumulative heat or cold in the ground can seriously reduce the heat transfer efficiency of borehole heat exchanger systems, further decreasing the thermal performance of GCHP systems. The exiting literature has used various methods to analyze how the risk of thermal imbalance can be reduced. Y. Tian et al. [9] built an analytical model to study the heating performance considering the condition of groundwater seepage and the results showed that the groundwater can mitigate the decrease in soil temperature near the energy piles located upstream. W. Zhou et al. [10] proposed hybrid ground source heat pumps integrating GCHP and a groundwater source heat pump to eliminate the heat imbalance problem and to reduce investment. In engineering practice, the difference in energy between heating and cooling was restricted artificially to mitigate the thermal imbalance. However, the problem was not solved fundamentally, and moreover, the supplementary system brought more investment than the single system. T. You et al. [11] proposed other methods to solve the thermal imbalance problem, including the modification of the heat exchanger, modification of the GCHP system, and operation-modified solutions. Z. Zeng et al. [12] built an experimental platform to test the ground-source heat pump system under the karst geological conditions with different operating models. The results showed that longer shutdown periods could delay the heat buildup in the surrounding soil, and the energy efficiency coefficient of the system also rose accordingly. Y. Li et al. [13] explored the mechanism of temperature change and the recovery of the soil under intermittent operations through an experiment, and it was found that the intermittent operation mode of daytime operation and night shutdown was beneficial for soil temperature recovery, but in the study the groundwater was assumed to be stagnant; therefore, its possible ability to mitigate the thermal imbalance was ignored. C. Dacquay et al. presented a novel design in which electrochromic glass window controls were integrated with a GCHP system for long-term optimization and sustainability, but the level of tint variation limited its further development [14].
The aforementioned studies provided some methods for enhancing the efficiency of GCHP and mitigating the heat imbalance. However, these studies did not consider the special and complex hydrogeological conditions in karst regions, and how those conditions influence the thermal imbalance in a rock mass.
Thermal imbalance is an important issue in the current research field of GCHP technology [15]. This study established a physical model and a numerical simulation to demonstrate how the fracture water impacts the heat transfer and energy storage in a fractured rock mass in karst areas. The experimental results simulating the cooling period of GCHP indicated that the temperature increase in a rock mass with water-conducting fractures is delayed due to the cooling effect of the water flow. In the numerical model simulating the heating period of GCHP, the coupled heat and mass transfer model of the buried pipe heat transfer area in the fractured rock mass was built. The temperature field was dragged along the direction of flowing fracture water, and the effective influence on the thermal imbalance was concentrated near the fracture. Therefore, it is suggested that buried pipes should be located at the zone with abounding fracture water if the construction condition permits, or buried pipes installed near the fracture water zone should share more load since their heat transfer ability is enhanced by the water flow.

2. Laboratorial Experiment

2.1. Sampling and Materials

The rock and drill cuttings were sampled from a GCHP project in a karst region in Guizhou, China, and its heat conductivity was tested at 1.84 W/(m∙k). Calcite rock produced from Guangxi, another typical karst region in south China, was used to build two rock mass models: one with a horizontal fracture and an integrated one. The original rock mass was cut into a cuboid of 1 m in length, 0.8 m in width, and 0.5 m in height, then an artificial horizontal fracture was made by machine cutting through it.

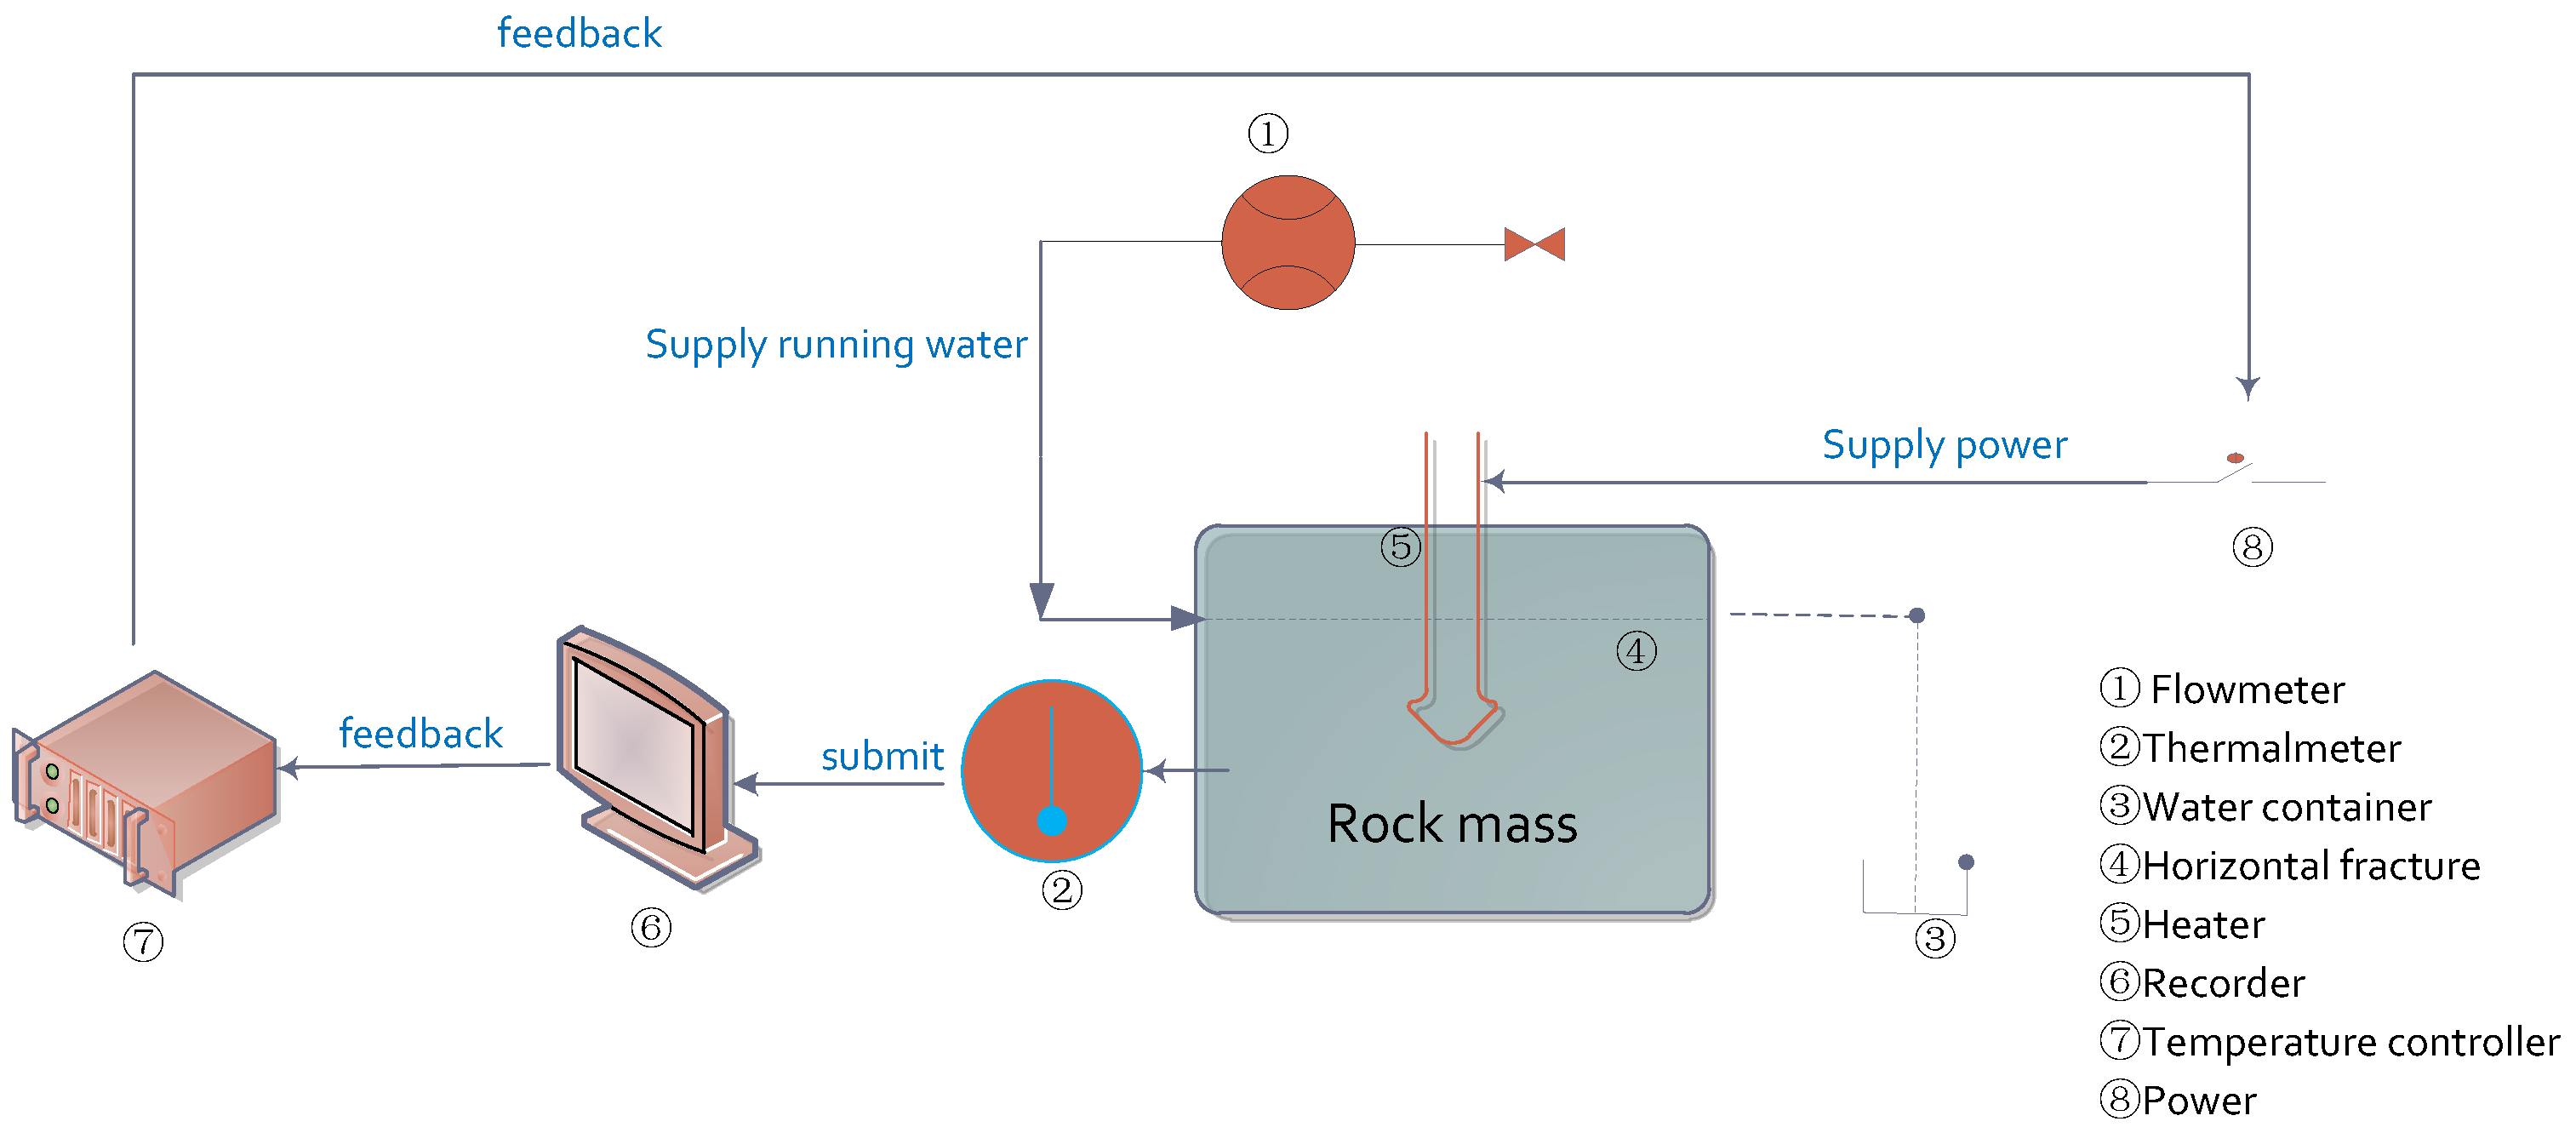
2.2. Experiment System

A total of 12 waterproof heating pipes with a length of 300 mm and a diameter of 10 mm were used to simulate the buried pipe of the heat exchanger in the experiment. The rock mass was heated by the heating pipes maintained at 303.15 K by the automatic temperature system. Instant and accurate temperature data were monitored by thermal sensors, and curves were displayed on the electronical temperature recorder. The flowchart of the experiment system is shown in Figure 1.
In the experiment, the electric heaters were firstly inserted into the rock mass to simulate the process of inputting thermal energy into the rock mass (cooling condition of GCHP in summer), and then the temperature of different locations in the rock mass was transmitted by sensors to the recorder. The recorder monitored the temperature variation during the experiment with a frequency of 3 min. Then the data were processed to generate 3D contour maps of the temperature field at different times. The temperature data were fed back to the electric temperature controller. When the temperature was different from the set point in the heating controller, the heating power was adjusted automatically. A horizontal fracture was made in the rock mass to simulate the flow of the fracture water, and a flow meter was used to control the flow rate of the water. The facility had controlling, feedback, recording, and heating devices; it can conduct different tests when the experimental rock body is changed, so it can be considered as a platform.

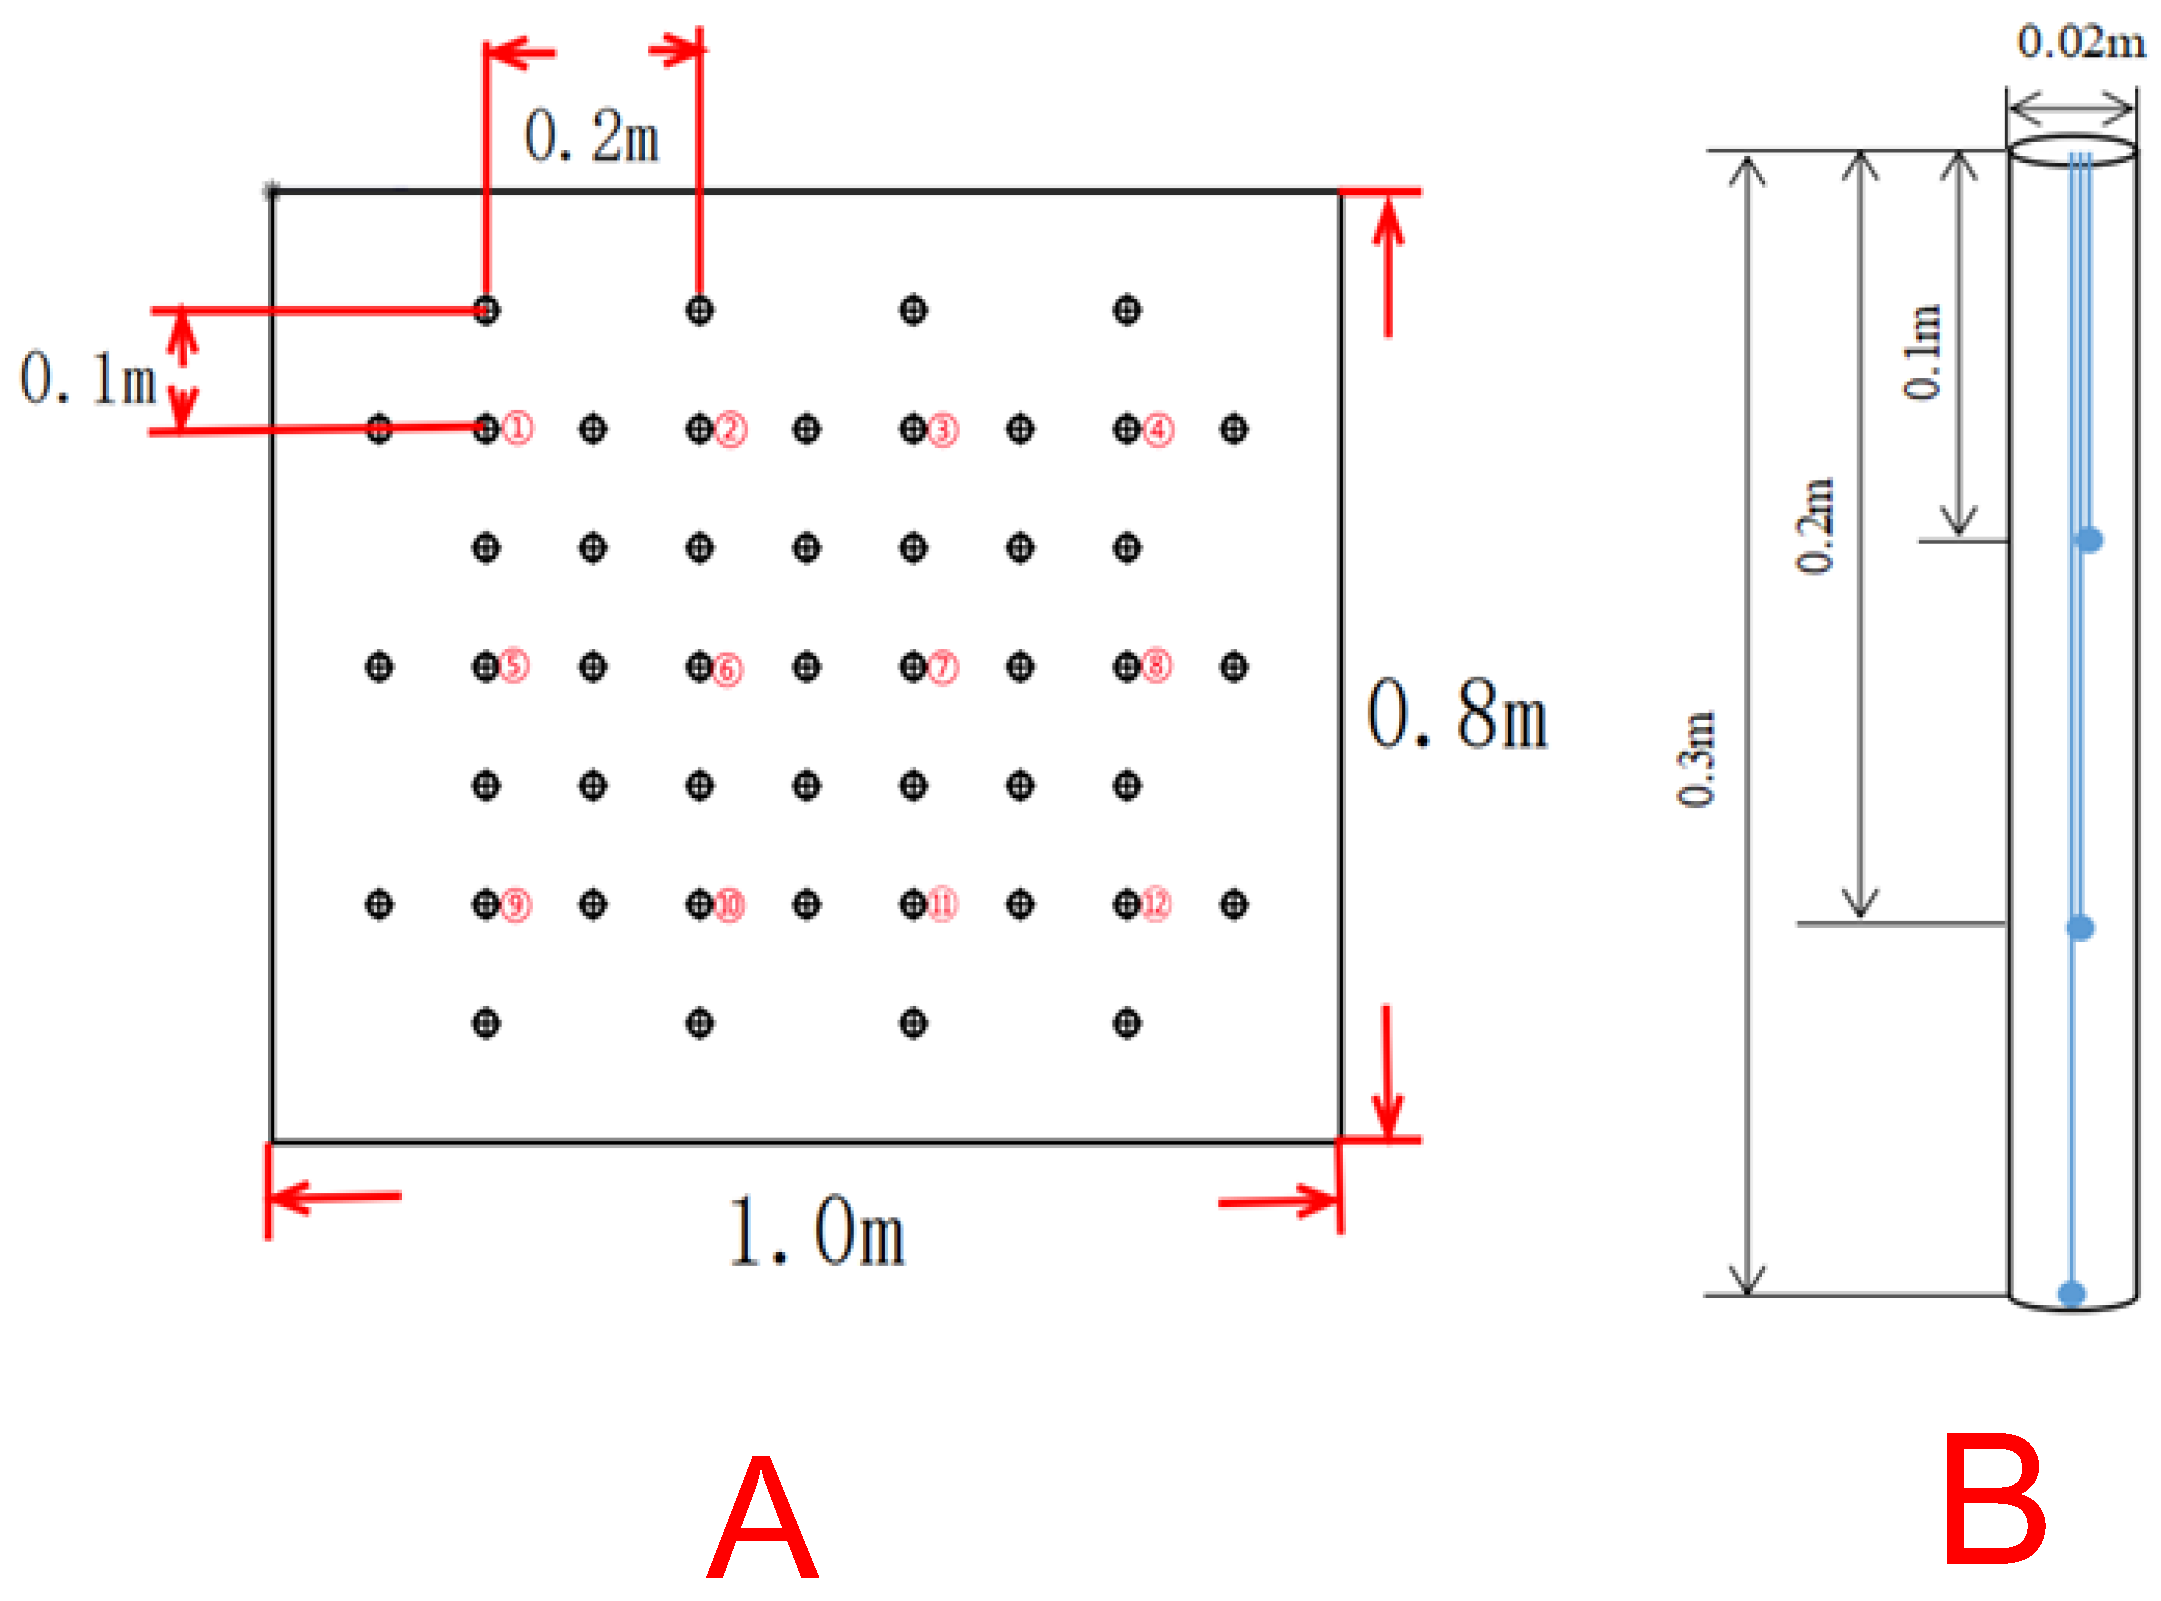
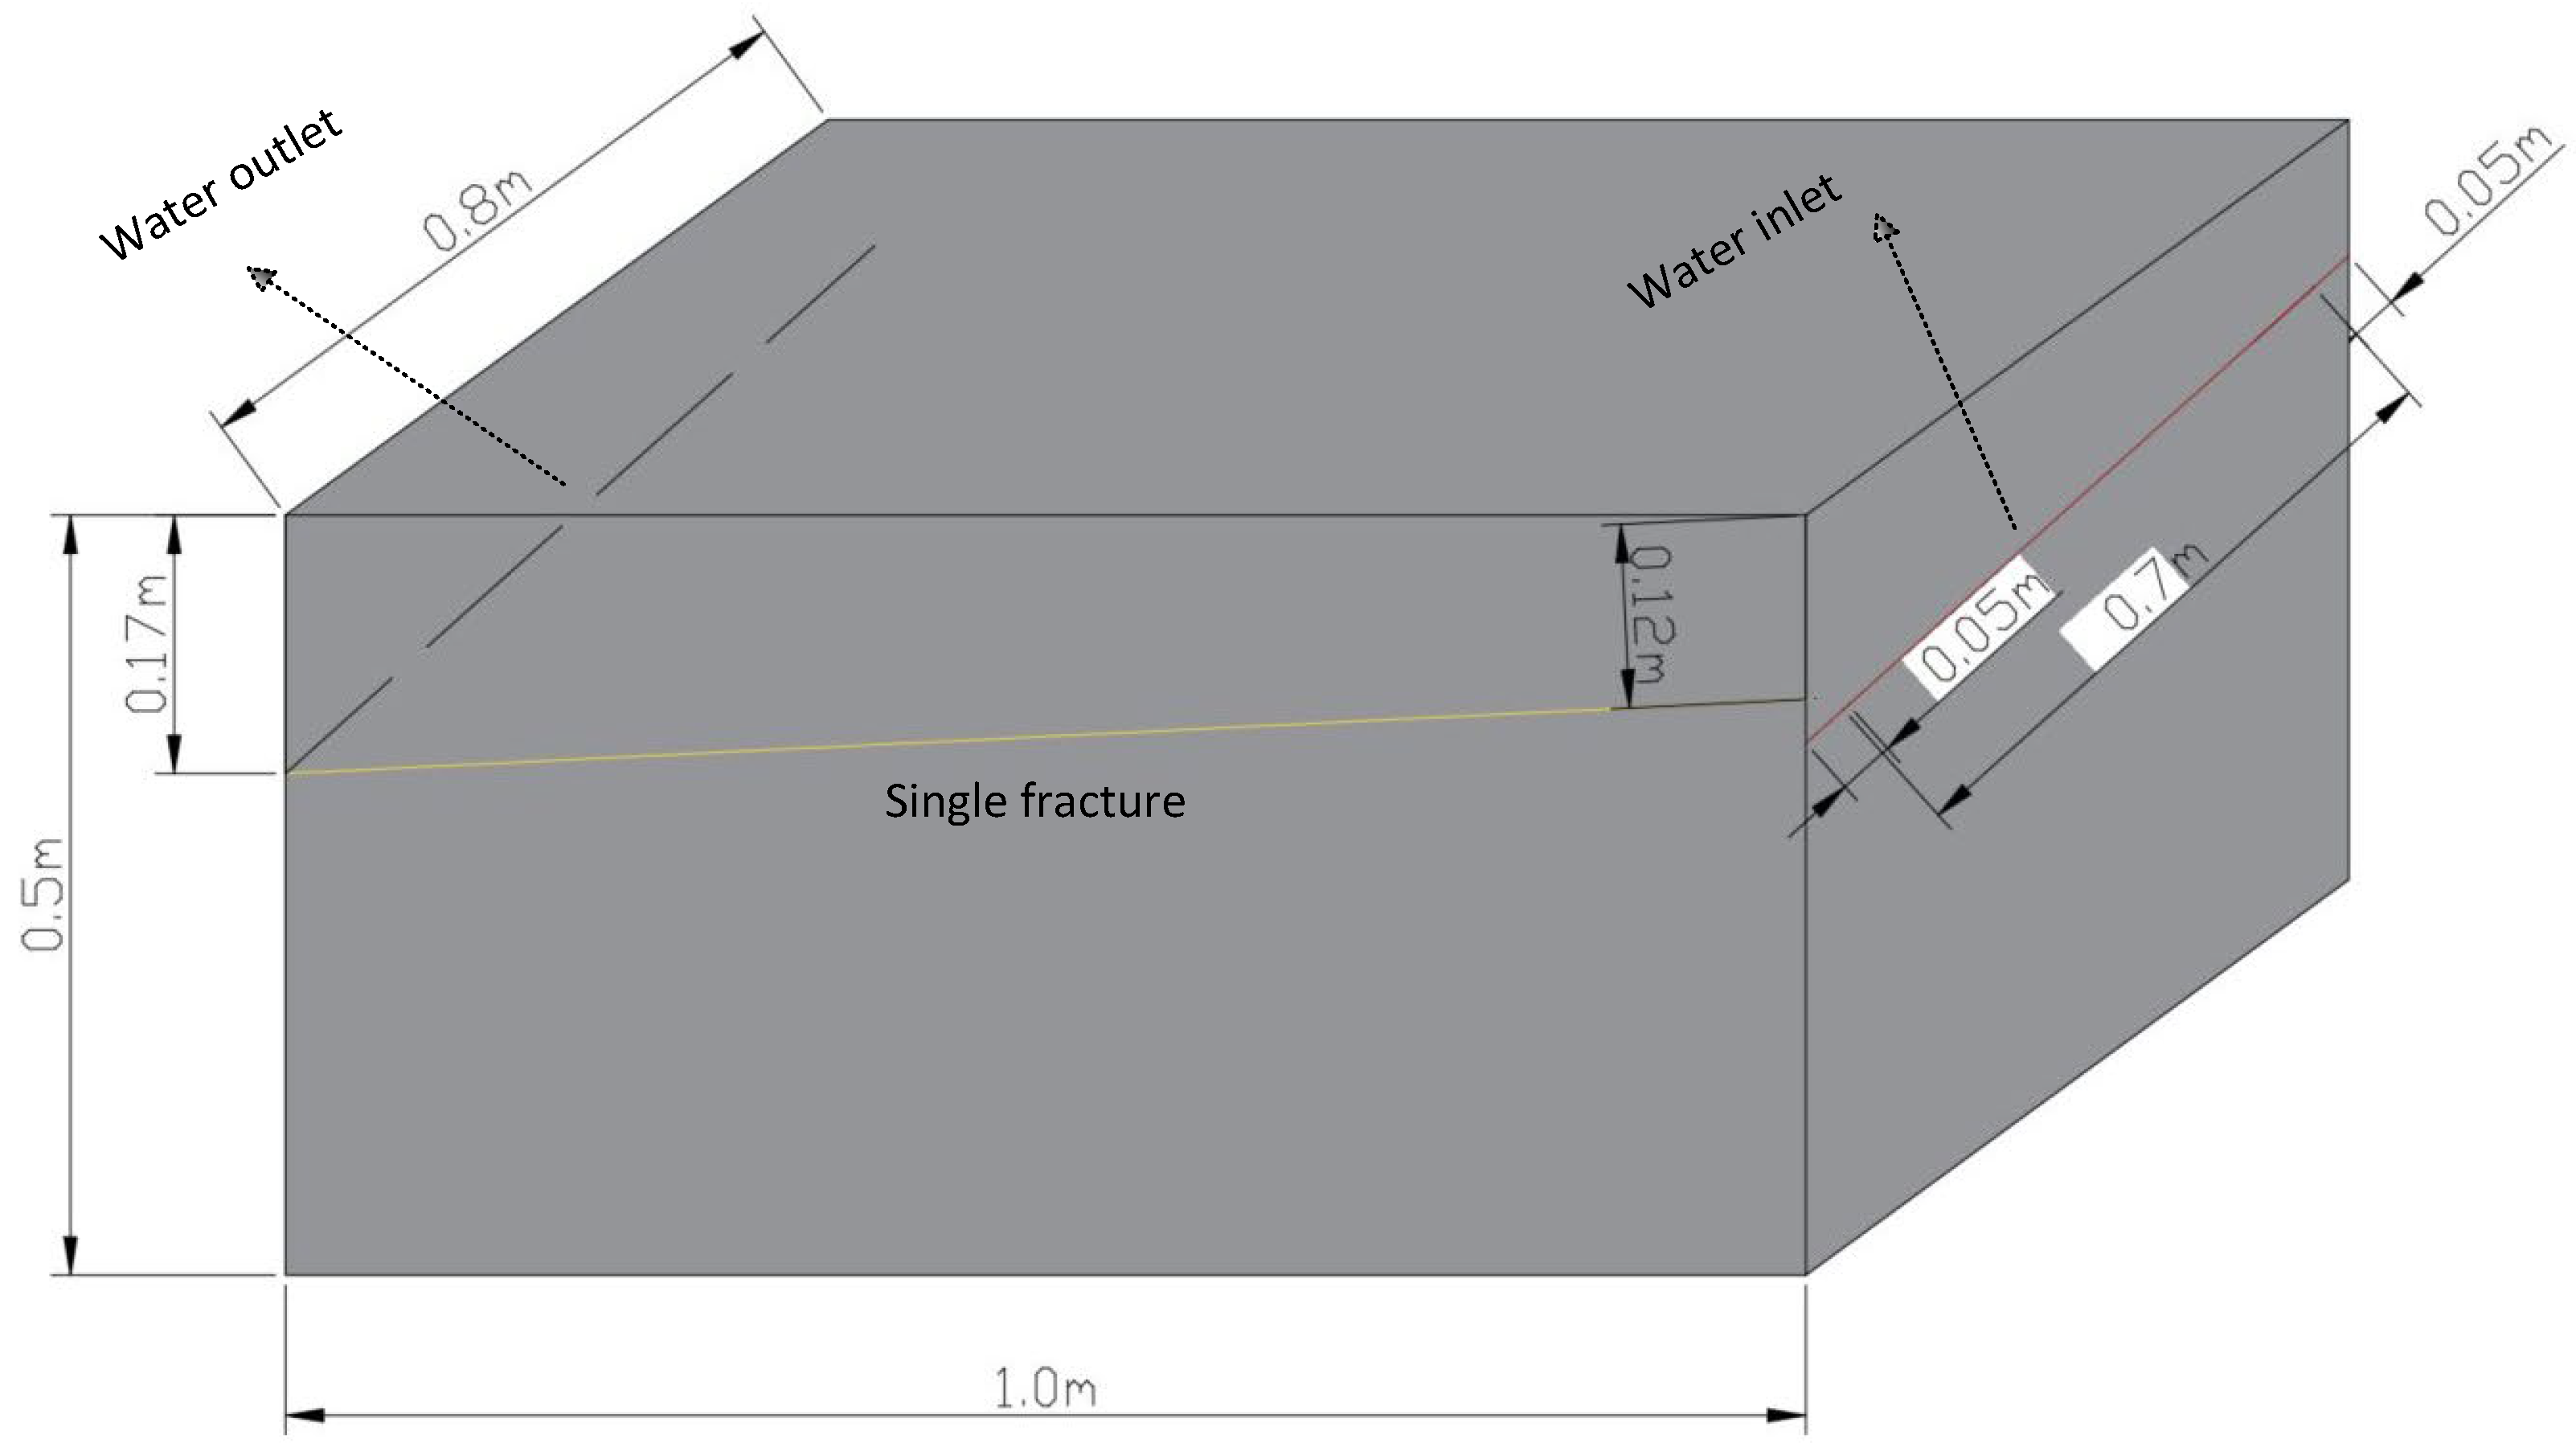
2.3. Model Specifications

An integrated rock mass model without fractures was built with specifications of 1 m in length, 0.8 m in width, and 0.5 m in height. A total of 12 thermostatic heating holes and 32 temperature monitoring holes were arranged inside the rock mass, and the drilling depth was 0.3 m for each hole. The locations of the heating holes were arranged as in Figure 2A. The numbered boreholes were temperature monitoring holes. The distance between the holes was 0.2 m, and the distance between the temperature monitoring holes and the thermostatic heating holes was 0.1 m. A series of thermal sensors were arranged to detect the temperature of the heating holes at the depths of 0.1 m, 0.2 m, and 0.3 m from the surface of the rock mass, respectively (Figure 2B). In total, 111 temperature monitoring points were set to cover the rock mass model.
The initial temperature before the implementation of the experiment was recorded, and the experiment was terminated when the temperature curve of the rock mass approached equilibrium. The surface temperature of the rock mass and input heat were also reported from the data recorder.
The experiment could only simulate the cooling condition of GCHP (rejecting heat to the rock) since it was hard to cool the rock using cooling devices that mock the heat exchange pipes, and it was very difficult to artificially create two fractures in the rock model. Therefore, the laboratorial experiment was used to investigate the case of thermal input to the rock mass without fracture (NF) and a horizontal fracture (F1), while the heating conditions of GCHP and the case of two fractures were simulated by the numerical simulation.
A rock mass with one horizontal fracture was built (Figure 3). The integrated rock mass model was cut at the depth of 0.12 m, with one side functioning as a water entrance and the other as an exit. The other two sides were sealed with mica glue to ensure the water did not flow outside. The parameters of this model were the same as those of the non-fracture model. The water was controlled by the thermostat at 288.15 K, and the rate of water flow was maintained at 0.005 mm/s by the flow counter.

2.4. Experimental Results and Discussion

The recorded data were imported into the processor to draw the temperature contour maps at different depths. The left column in Figure 4 shows the temperature fields at different depths (0.1 m, 0.2 m, and 0.3 m) in the rock mass without fracture, and the right column shows the temperatures field at the same depths in the rock mass with a horizontal fracture.
By comparing the two columns, it can be seen that the highest temperature of the non-fractured rock mass was in the center, which was reduced when fracture water presented. The overall temperature field of the horizontal single fracture rock mass was affected by the fracture water, and the highest temperature moved slightly along the direction of the fracture water flow.
By comparing the highest temperature difference at the same depth, the effect of flowing water in mitigating heat accumulation is obvious. The temperature difference was 7.5 K at the depth of 0.1 m (first row in Figure 4a,d); the temperature difference was 7.5 K at the depth of 0.2 m (second row in Figure 4b,e); and the temperature difference was 2.5 K at the depth of 0.3 m (3rd row in Figure 4c,f). One should note that the horizontal fracture was set to be 0.12 m deep; therefore, the cooling effect of the fracture water flow was more obvious at the region close to the fracture. As the distance increased, the impact of the fracture water significantly reduced. Therefore, the horizontal fracture flow only affected the region immediately around it.
Figure 5A,B are the curves of instantaneous temperature at the center of the rock mass by the end of the simulated cooling period. They were measured at the depths of 0.1 m, 0.2 m, and 0.3 m, respectively. The measured temperatures in the model with a horizontal fracture were lower than that in the non-fracture rock mass all the time. Meanwhile, the slope temperature curves of the horizontal single fracture rock mass monitoring hole were gentler than those of the non-fracture rock mass, indicating that the temperature increased more slowly due to the improved heat capacity of the rock mass brought by the fracture water.

3. Numerical Simulation

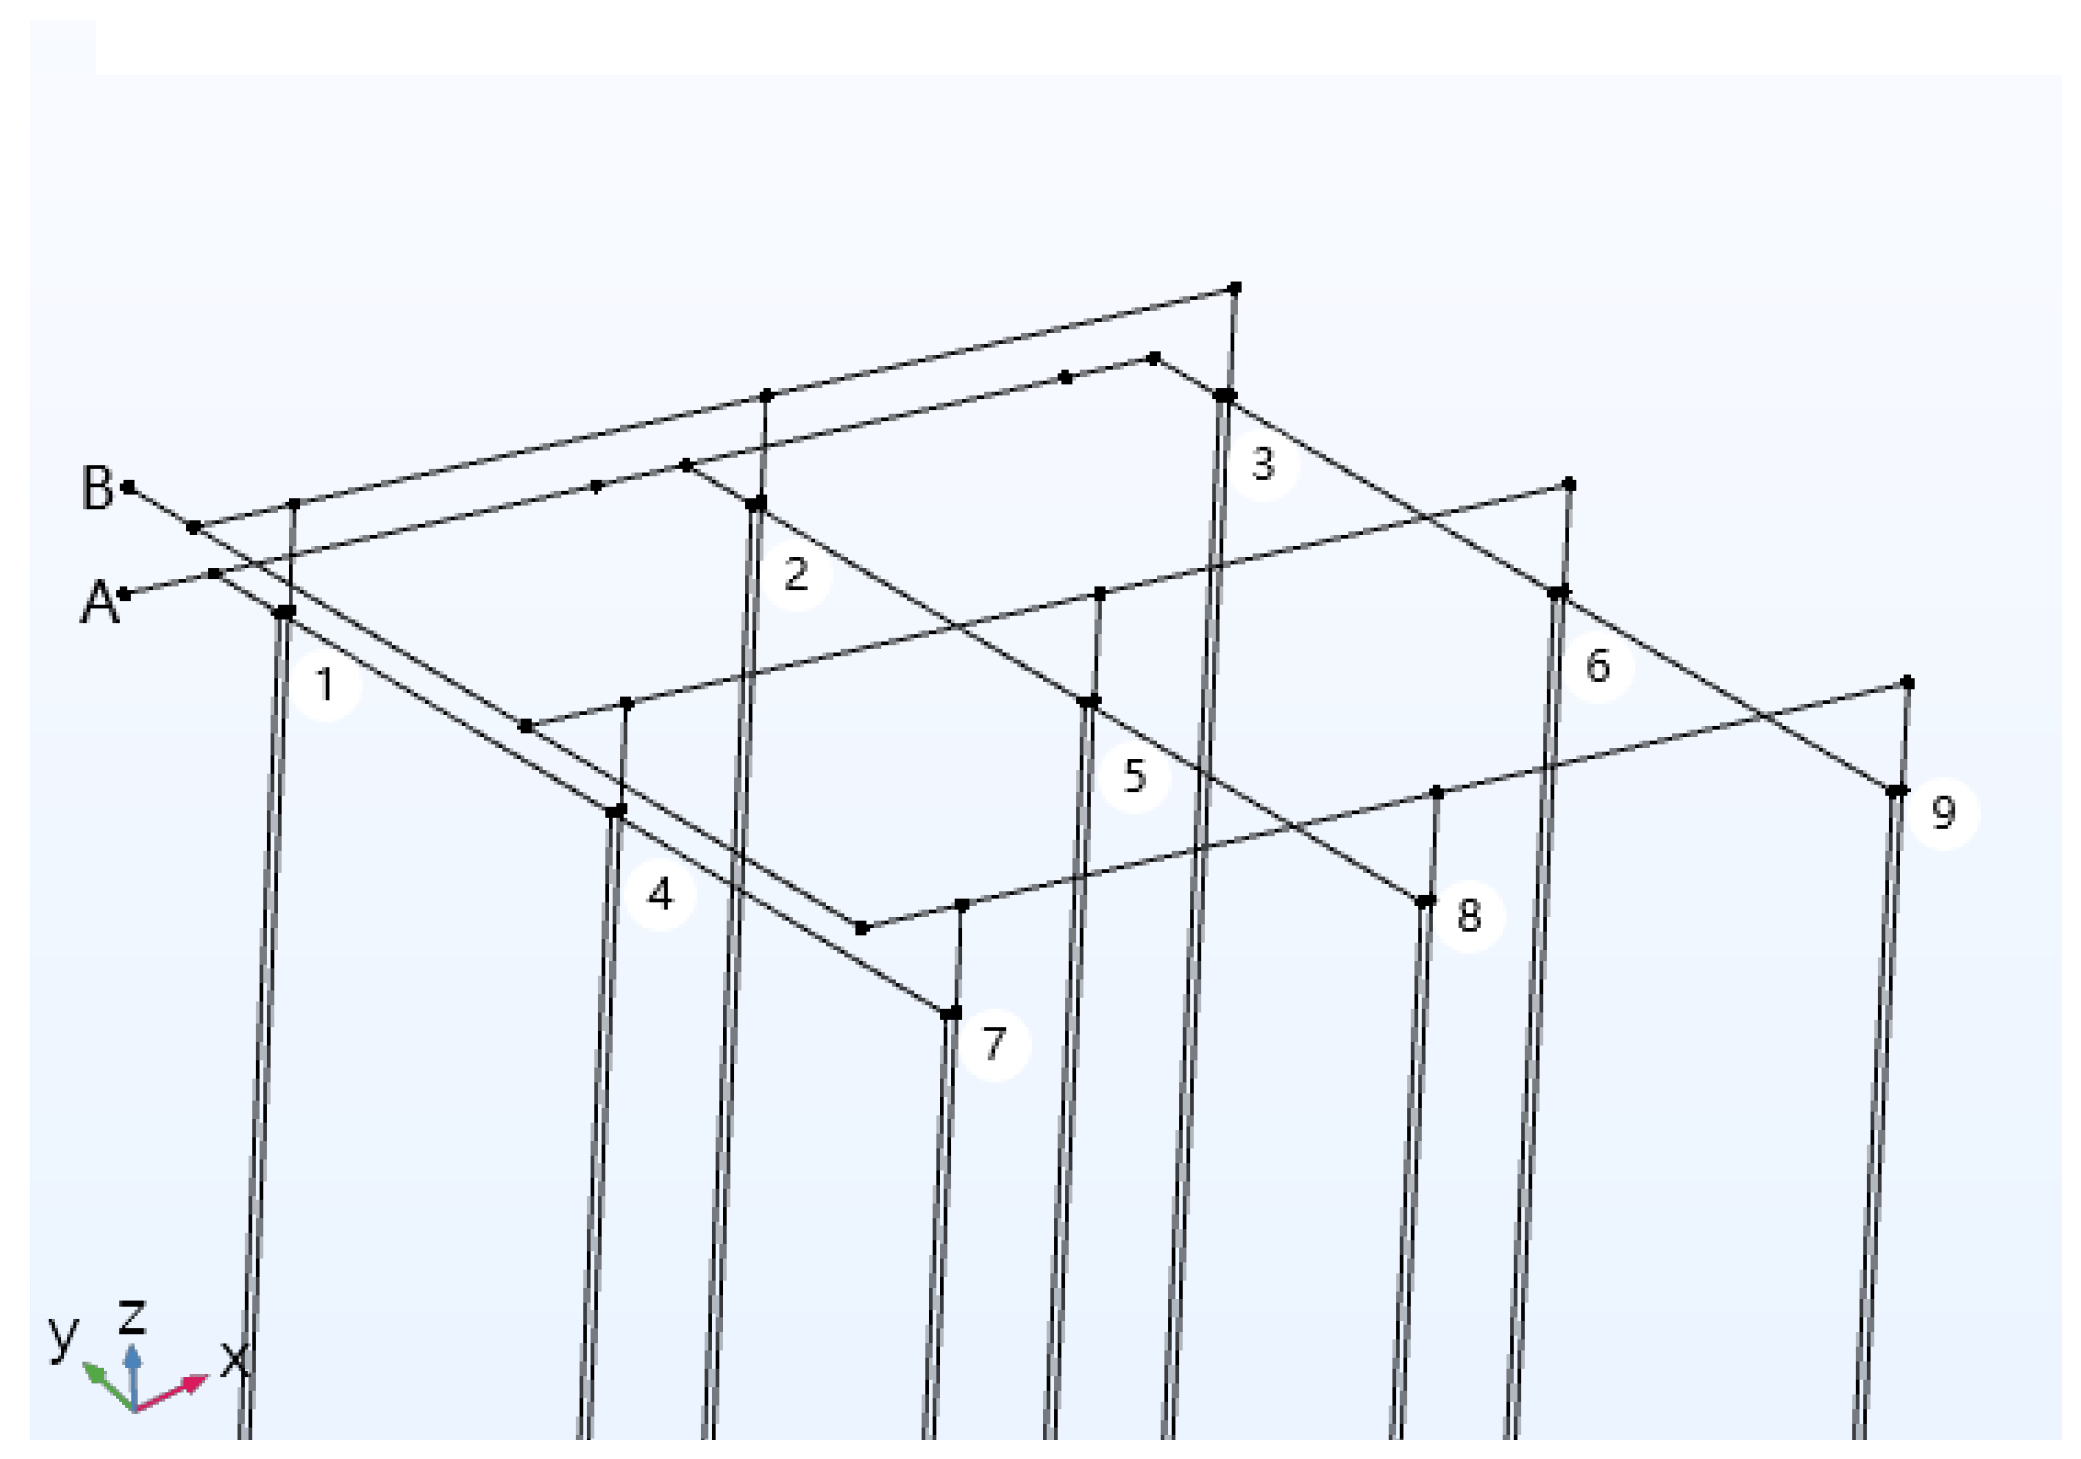
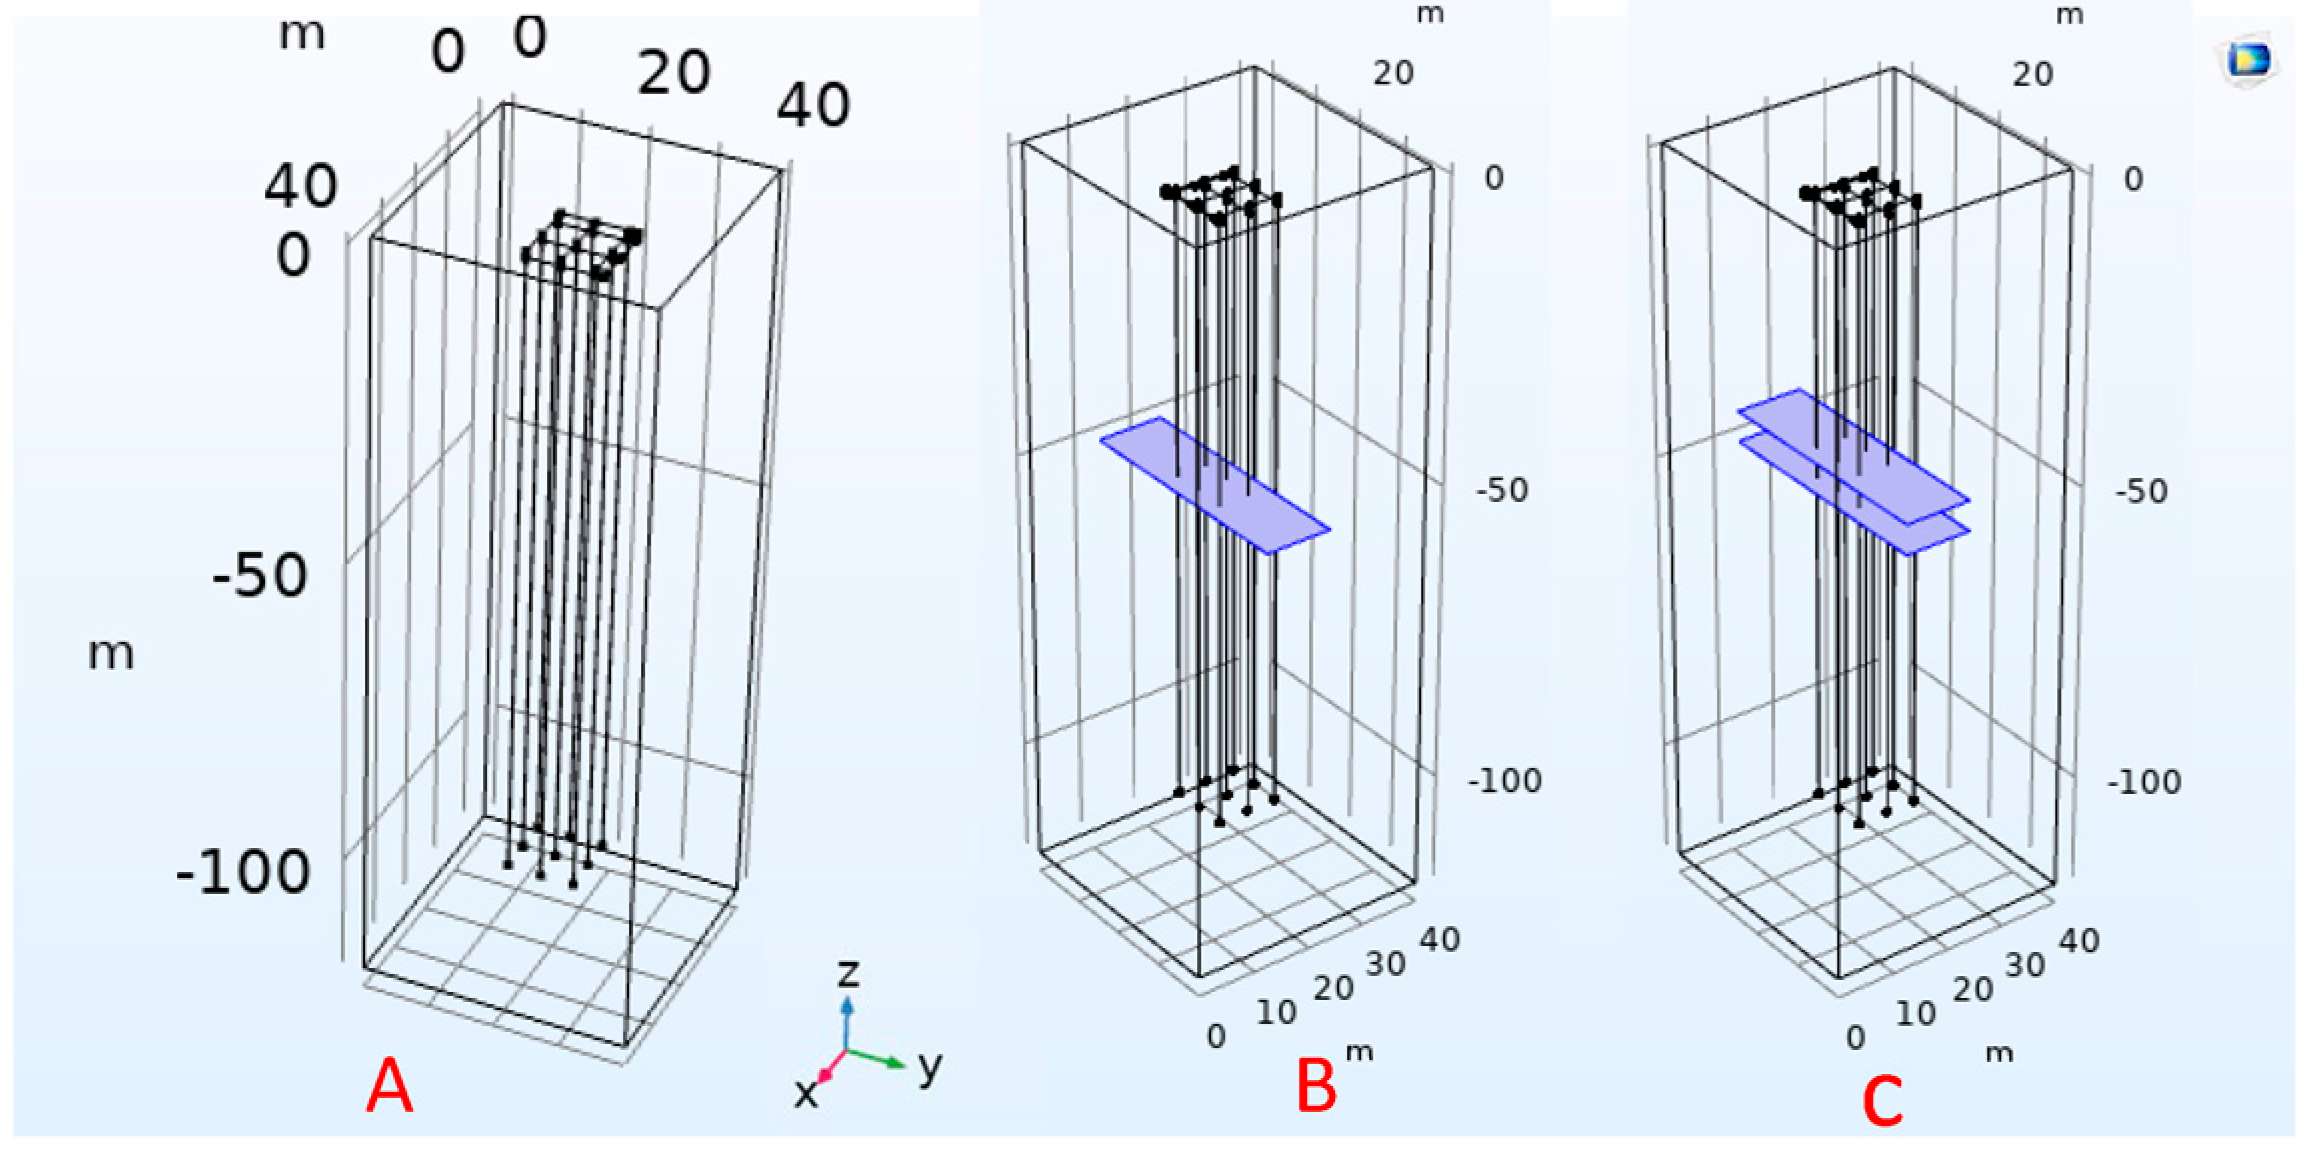
3.1. Geometry of the Model

COMSOL Multiphysicals software is a finite element simulation tool and comes from Durham city in the US, the 5.6 version was used to simulate. By establishing and solving coupled partial differential equations of specific forms of heat transfer, porous flow, mechanics, and others, it can simulate thermal–hydraulic–mechanical coupling processes. Basic steps include establishing geometry models, specifying initial and boundary conditions, meshing, and calculations.
The impact of the fracture water on the heating condition of GCHP was further analyzed by a numerical simulation, and the software was used to investigate the more complex condition. In order to investigate the influence of different fracture numbers on the heat transfer performance of the buried heat exchangers, a 3D heat transfer model with 3 × 3 heat exchange holes was built. Each hole accommodated a single U pipe (Figure 6). The fracture crossed the rock mass at Z = −50 m in the case of one horizontal fracture (F1) as shown in Figure 6B. The fractures crossed the rock mass at Z = −50 m and Z = −47.5 m in the case of two horizontal fractures (F2), as shown in Figure 6C. The fractures were simplified as one or two horizontal fractures, but the simulation results still provided a demonstration of how the fracture water affected the temperature field in the rock mass. The depth, thickness, and inner diameter of the U pipe were 100 m, 6 mm, and 26 mm, respectively.
The distance between the U pipes was 5 m, and the rock mass was a homogeneous cuboid with the size of 40 m × 40 m × 120 m. At the top of this model, the vertical U pipes were connected in parallel through a horizontal pipe network. Points A and B in Figure 7 are the water inlet and outlet of the U pipe network, respectively. The zero point was set at the ground surface. The geometric and physical parameters involved in this simulation research are shown in Table 1.

3.2. Control Equations

In the simulation, the fracture water flow, heat transfer in porous media, and heat transfer in pipes were coupled to investigate how the fracture water flow affects the heat transfer of a rock mass in the operation of GCHP.
Each simulated period included 4 months of heating and 8 months of shutdown (15 November to 15 March of the next year). The relative piecewise functions were as follows:
p w 1 ( t ) = { u _ pipe 0 < t 4 0 4 < t < 12
where t is time, s; u_pipe is the interpolation function of the flow velocity of the fluid medium in the U pipe from the beginning to end of the 4th month. The flow rate of the medium was 0 m/s for the remaining eight months, which meant that the heat pump unit was in a shutdown state. The model was simulated for three heating periods with two shutdown periods.
The Darcy’s law equation was used to calculate the flow velocity field:
t ( ρ ε p ) + ( ρ u ) = Q m
where ρ is the density of the fluid material, kg/m3; εp is the dimensionless number of the porous material between 0 and 1; u is the Darcy’s velocity or specific discharge vector, m/s; Qm is mass flux, kg/s.
u = κ μ ( p + ρ g D )
where κ is permeability, m2; g is magnitude of gravitational acceleration, m/s2; ▽D is gravity potential, dimensionless; μ is the dynamic viscosity, Pa·s;
The heat transfer mechanism among the heat carrying flow, U pipe, and host rock includes conduction, advection, and transfer through walls based on the principle of energy conservation. The energy equation for an incompressible fluid flowing in a pipe is given as:
ρ A C p T t + ρ A C p u e t t T = t ( A κ t T ) + 1 2 f D ρ A d h | u | u 2 + Q + Q w a l l
where A is the pipe cross-sectional area available for flow, m2. Q represents a general heat source, W/m; Qwall represents external heat exchange through the pipe wall, W/m; dh is the mean hydraulic diameter, m; CP is the specific heat capacity at constant pressure, J/(kg·K); T is the temperature, K; t is time, s; u is the velocity vector, m/s; κ is the thermal conductivity, W/(m·K).
The energy balance equations in porous media are given as Equations (5) and (6):
( ρ C p ) e f f T t + ρ C p u t T + q = Q + Q v d
where q is the volume flow rate per unit trace length in the fracture, m2/s; (ρCp)eff is the effective volumetric heat capacity at a constant pressure defined by an averaging model to account for both the solid matrix and fluid properties, J/(m3·K); Cp is the fluid heat capacity at a constant pressure, J/(kg·K); Q is the heat source other than viscous dissipation, W/m3.
q = κ e f f T
where κeff is the is the effective thermal conductivity, W/(m·K). ∇T denotes the gradient operator restricted to the fracture’s tangential plane.
The heat transfer in pipes and heat exchange and storage in porous media was coupled by the energy balance presented in Equation (4), and the heat exchange and storage in the porous media and Darcy’s velocity field was coupled by the energy balance presented in Equation (5).
The cubic law, shown in Equation (7) [19] shows that the flow through the fracture is proportional to the cubic of fracture width (e), and Equation (8) [20] shows convective heat transfer between fracture water and the tube, so it can be concluded that the energy carried by fracture water flow was significant compared with the non-fracture case. The equations are as follows:
q fr = e 3 g 12 ν J
where qfr is the fracture water flow of single-width, m2/s; e is the width of the fracture, m; v is viscosity of the fracture water, m2/s; g is the acceleration of gravity, m/s2; J is the pressure drop along the fracture flow direction.
Q w = h Δ t w f π d e ¯
where Qw is the heat transfer power between the U pipe and the fracture water flow, W; h is the surface heat transfer coefficient between the outer wall of the U pipe and the fracture water, w/(m2·k); Δtw-f is the temperature difference between the wall of the U pipe and the fracture water, K; d is the depth of the fracture, m; ē is the mean value of the width of the fracture, m.

3.3. Boundary and Initial Conditions
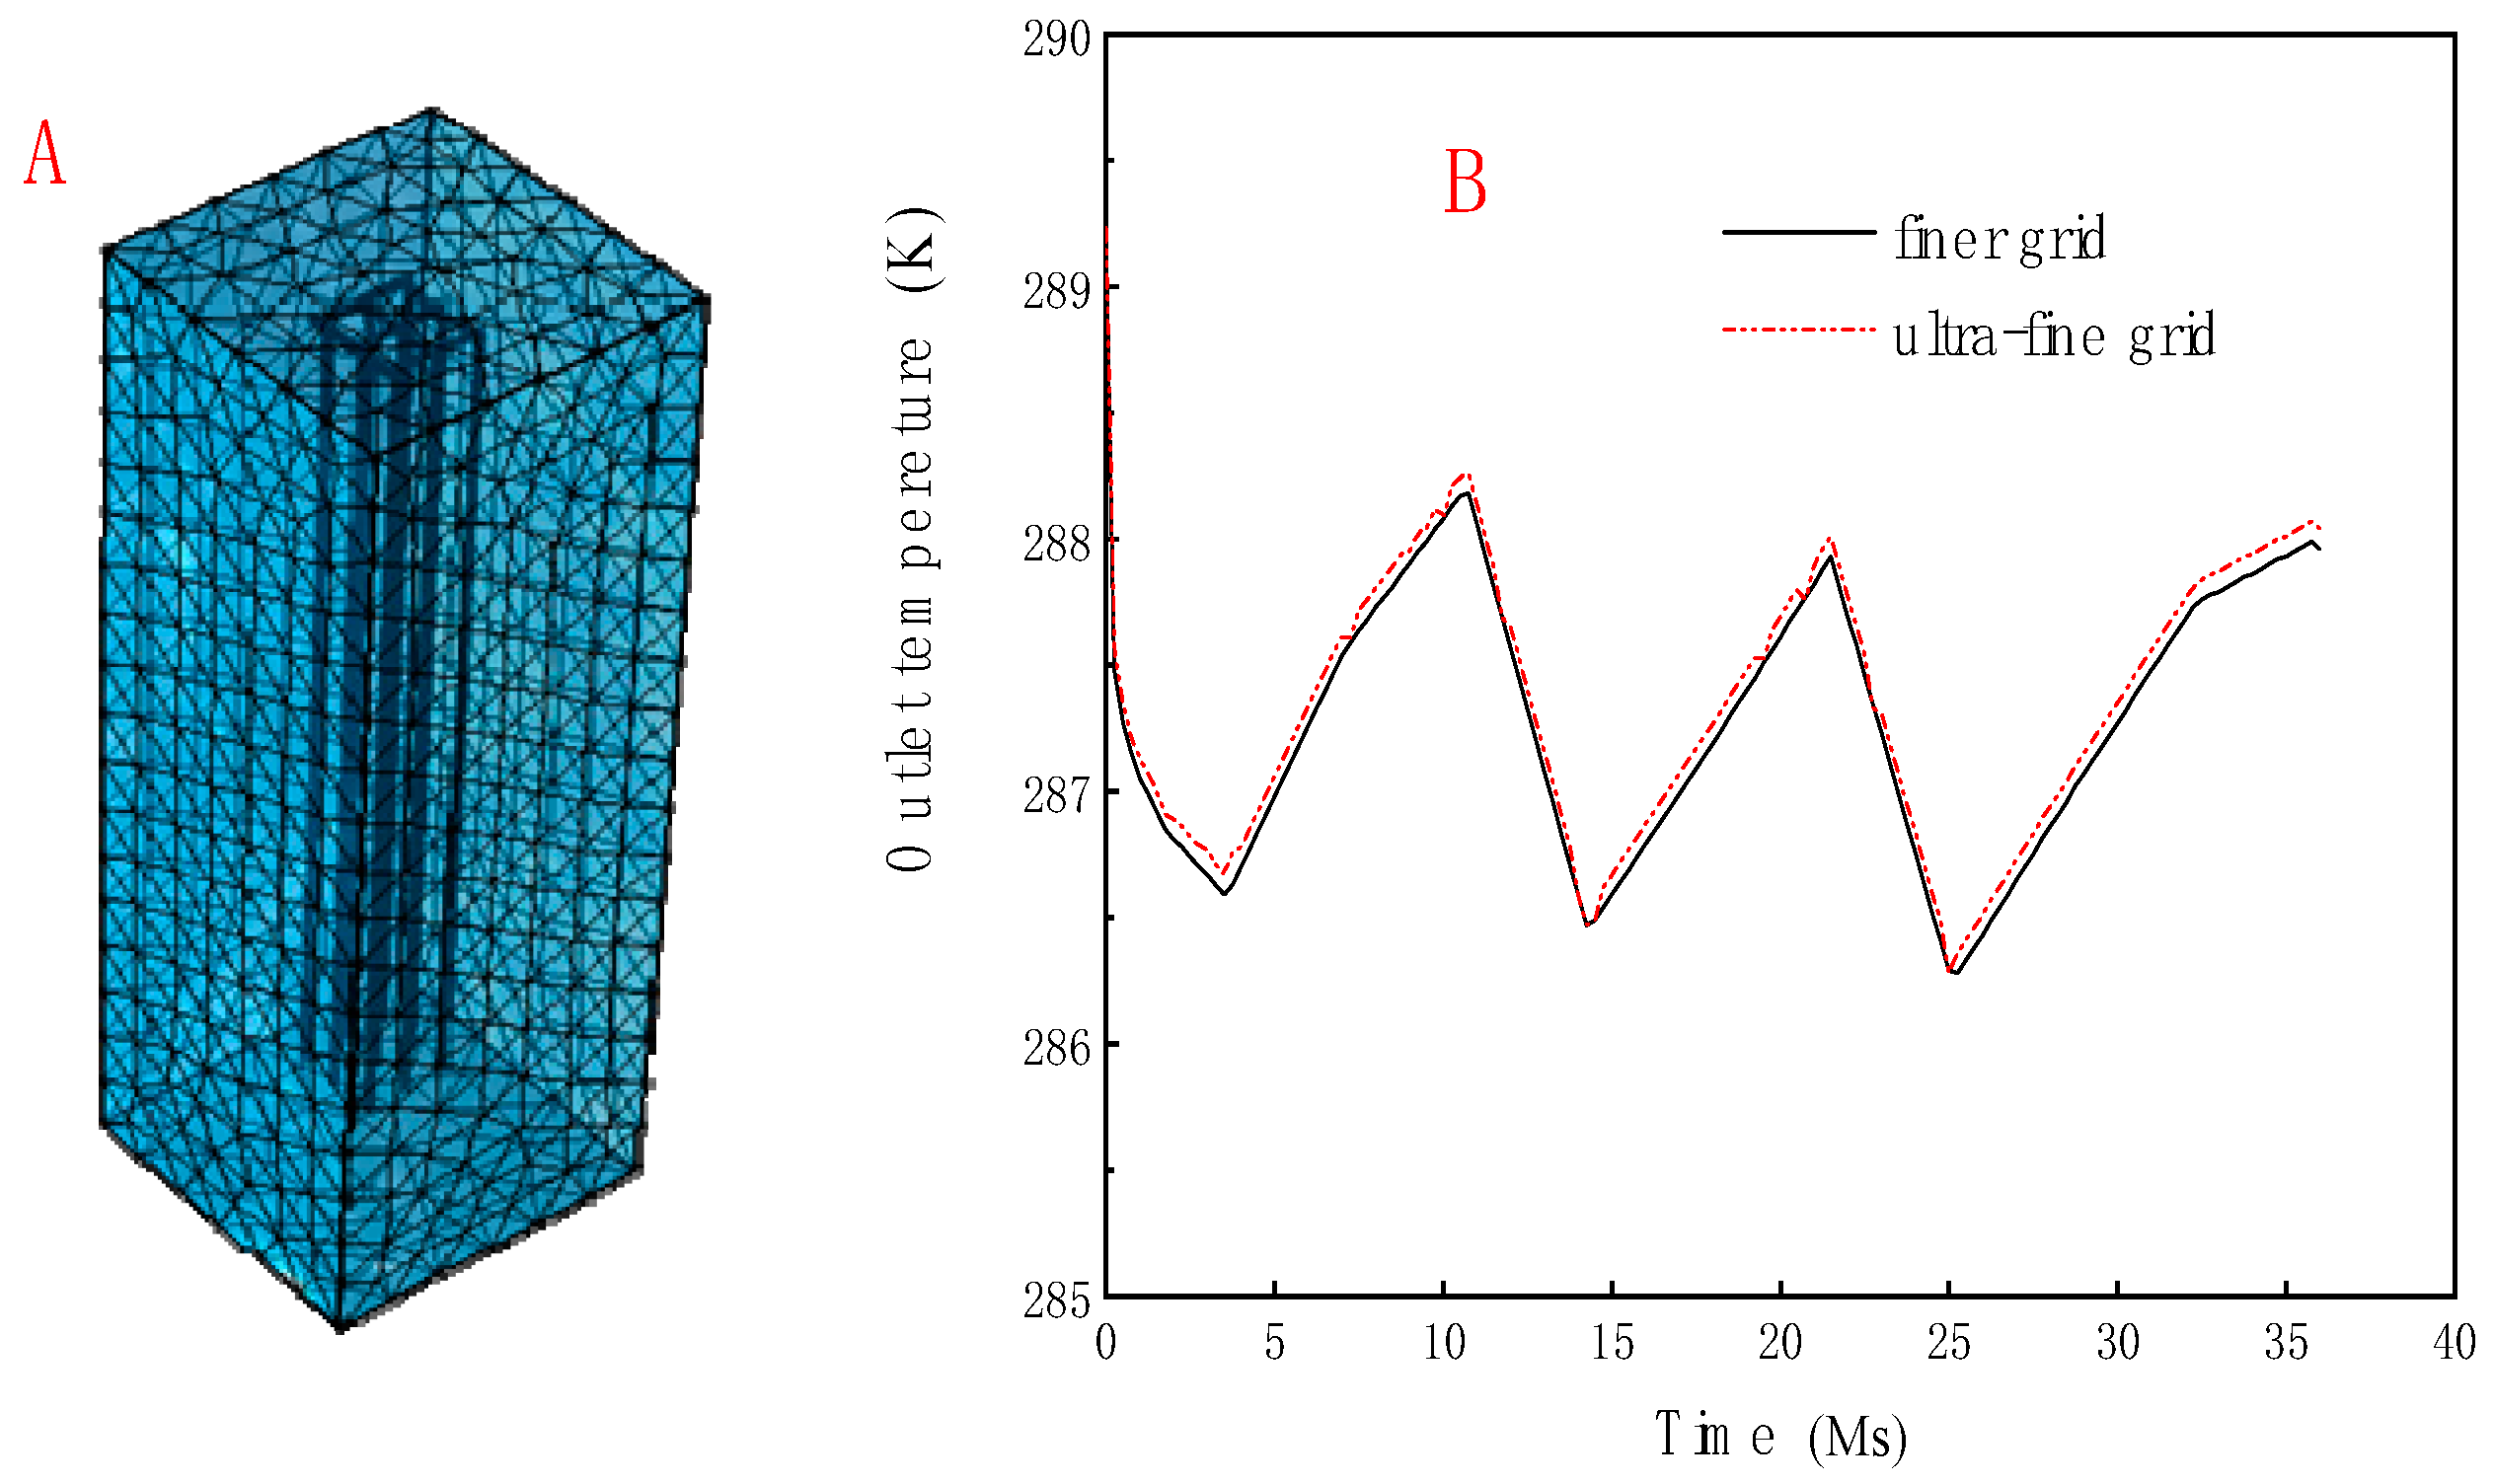
The top surface of the model was set as no mass and energy flux, and the other sides were set as open boundaries. The porous pressure gradient was established by assigning initial pressures on each boundary. Both the initial temperatures of the rock mass and the U pipes were set as 289.15 K [18]. The hydraulic head different was set as 10 m.

3.4. Meshing

The area with a gentler temperature gradient far away from the U pipes was meshed by a regular grid, and the area where a greater temperature gradient existed was meshed by a finer grid (Figure 8A).
The out temperatures in different mesh division formed near the U pipes were simulated to select the most suitable mesh method. It was found that similar results were acquired from the finer and ultra-fine meshes (Figure 8B), while the running time under the ultra-fine mesh was three times that of the finer mesh. Coupled failure or the non-convergence of the calculation also appeared, so it can be considered that the finer meshing was sufficient. The mesh unit was from 0.6 m to 6.6 m.

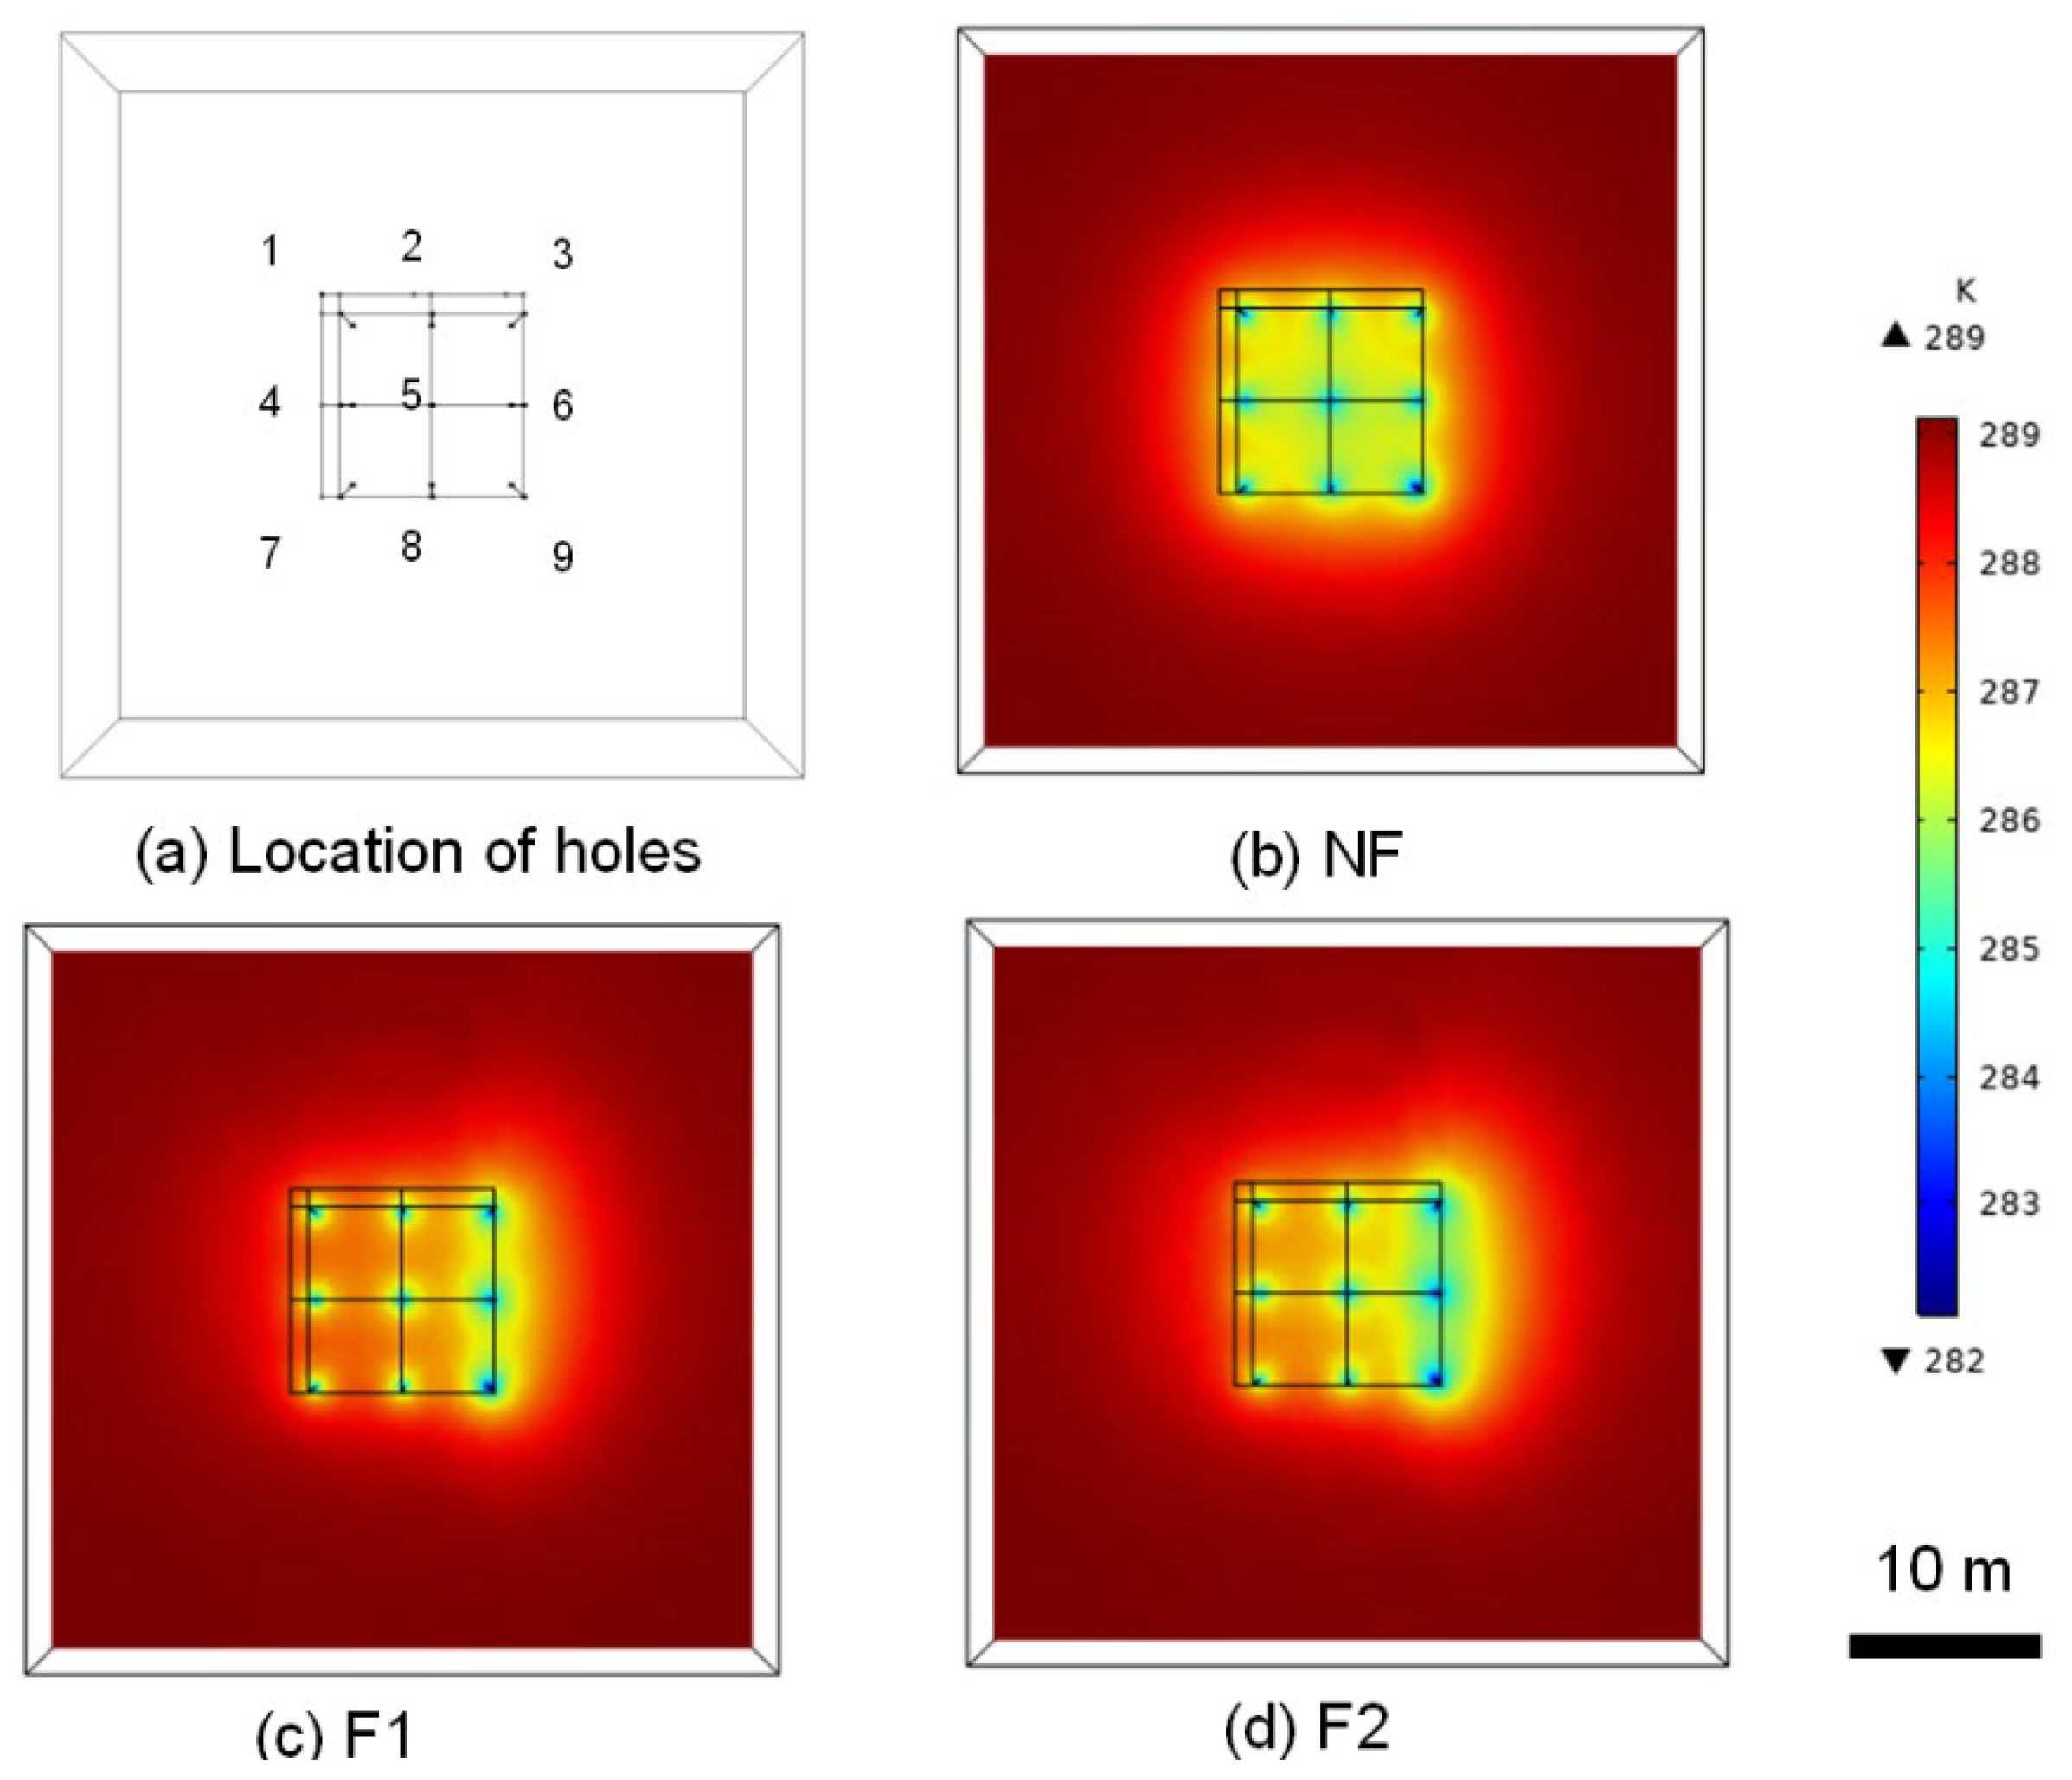
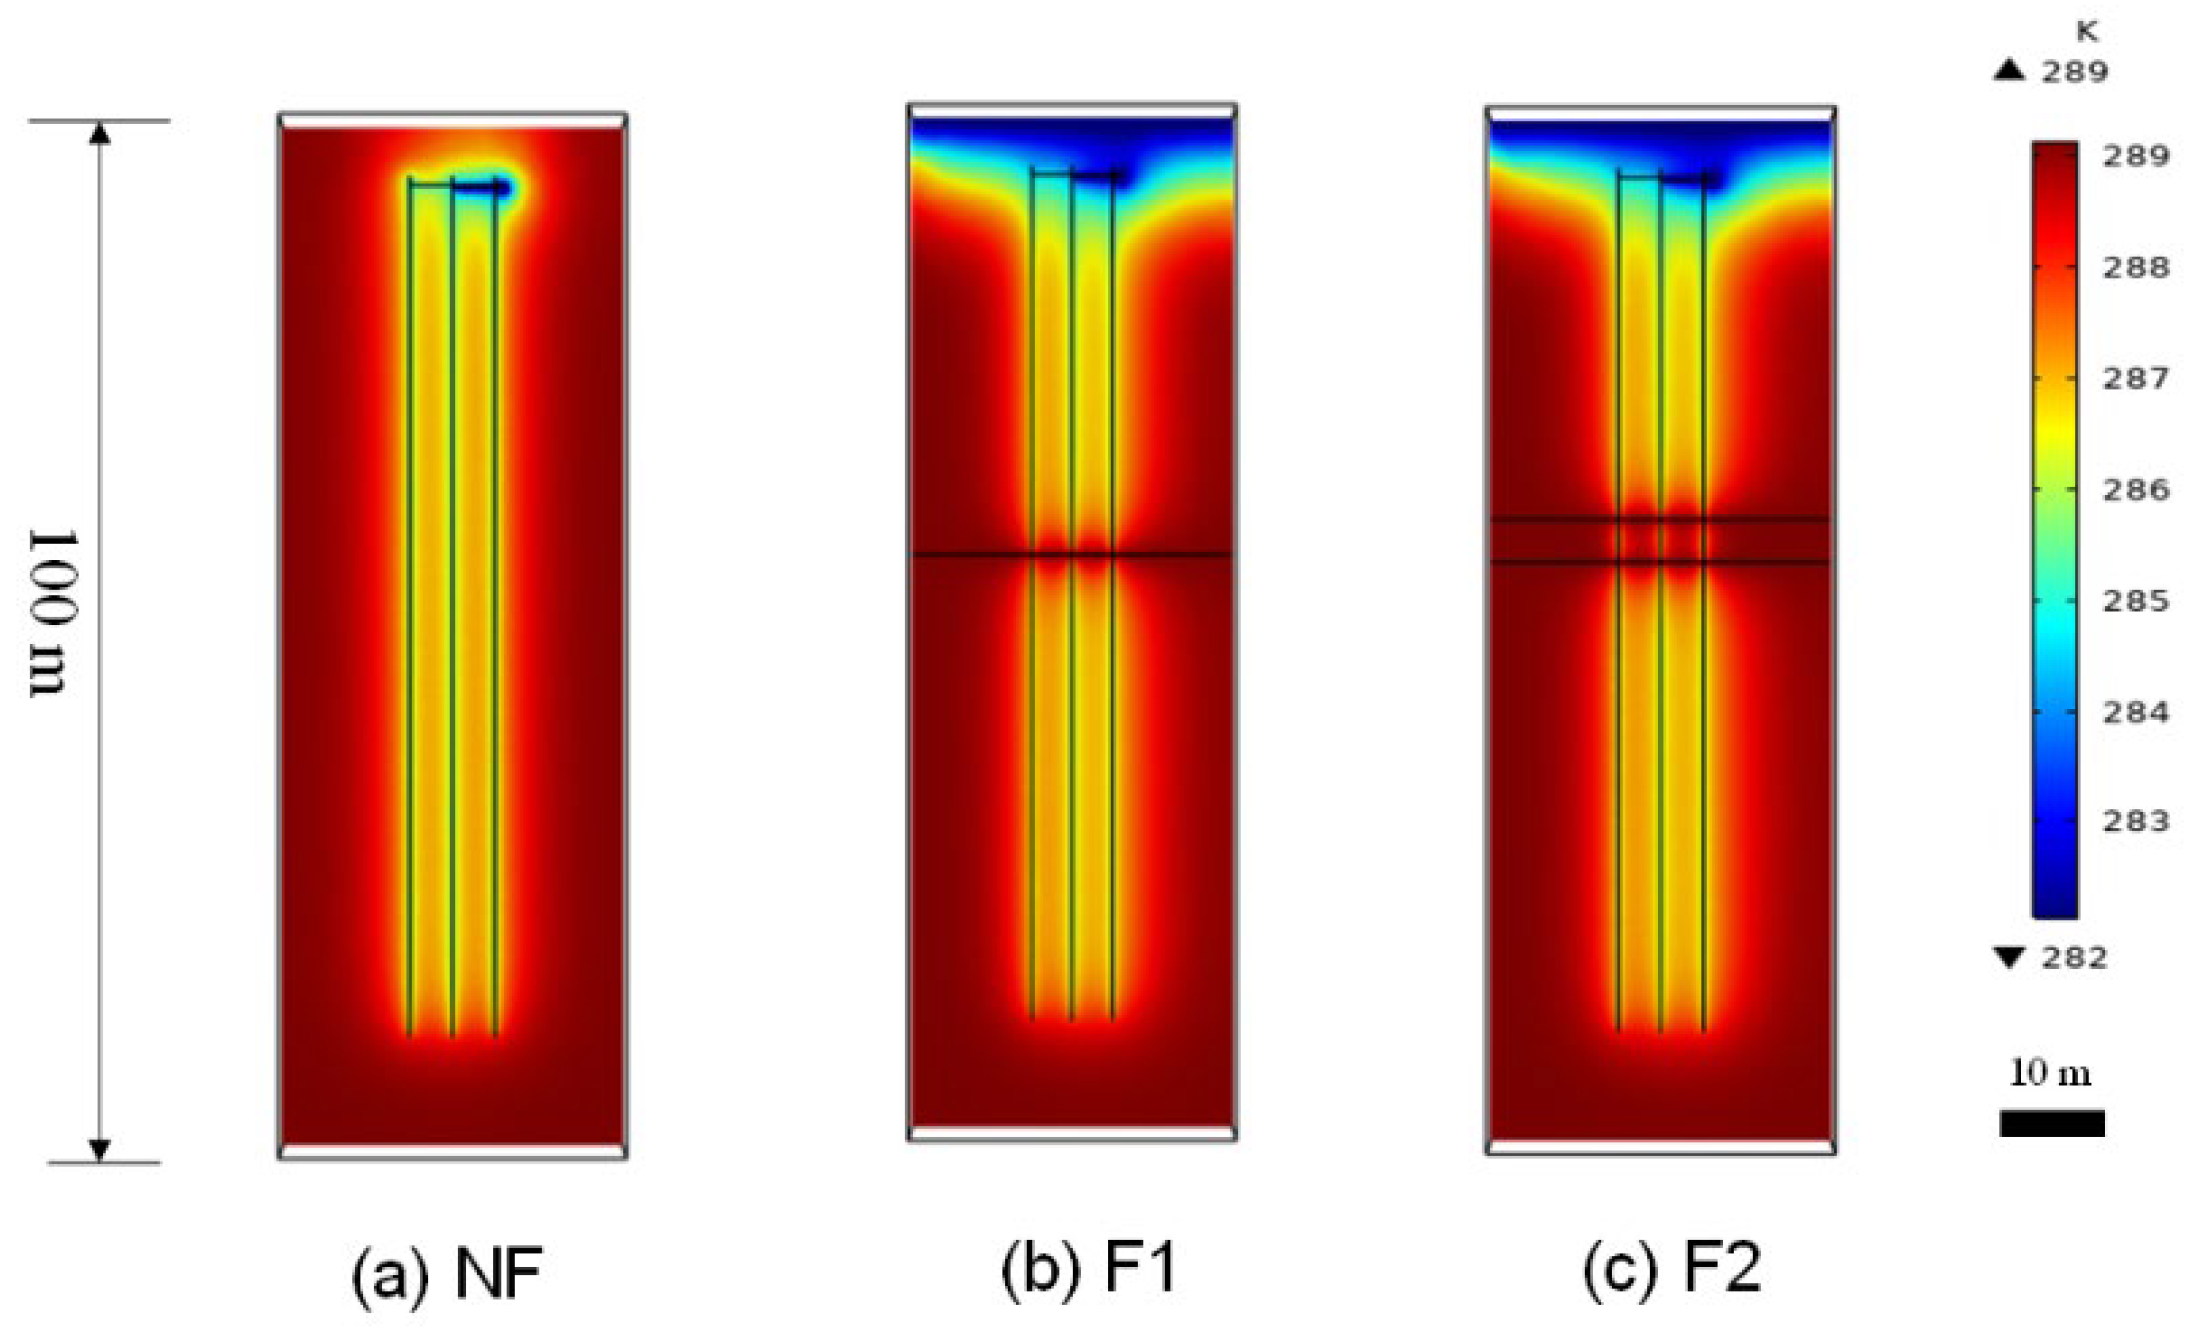
3.5. Numerical Results and Discussion

The temperature field on the X-Y plane and the Y-Z plane of the rock mass without a fracture, with one horizontal fracture, and with two horizontal fractures are shown in Figure 9 and Figure 10, respectively. Both Figure 9 and Figure 10 reflect the temperature field at the middle of the third heating period (the 26th month).
From Figure 9 and Figure 10, the temperatures around the penetrating fractures of the U pipes (①, ②, ④, ⑤, ⑦, and ⑧) were higher than that of the other U pipes (Figure 9a). No matter whether the rock mass was penetrated by one or two fractures, the temperature in the areas closer to the fractures was higher than that farther away from the fractures. In the case of no fracture, as the energy in the rock was extracted, the temperature around the borehole obviously dropped (Figure 9b). When the fracture water presented to supplement the heat, the temperature decrease around the borehole was mitigated (Figure 9c,d). From Figure 10, the high temperature field was dragged along the direction of fracture water flow. The mitigating effect of the fracture water on the ground temperature was restricted around the fractures, and it had less influence on the distant locations.
The inertia of the rock mass in maintaining its original temperature indicates its thermal recovery ability after the heating period operation of the heat pump. Figure 11 reflects the temperature field on the Y-Z plane of the rock mass during the 35th month of the simulation (the end of the third shutdown period in the cycle). The temperature of the rock mass around the fractures was higher than other areas due to the supplementary heat continuously brought by the fracture water. The energy carried by the fracture flow into the rock mass significantly enhanced the thermal recovery ability in the rock mass.
Figure 12 further demonstrates the continuous curve of the mean temperature of the rock mass throughout the operation and shutdown periods. During the heating operation (0–4 month), the decrease in the ground temperature in the rock mass with fractures was gentler than that of the rock without a fracture. The rock mass with two horizontal fractures (F2) had the smallest temperature fluctuation, while the rock mass without a fracture (NF) had a weaker ability in the shutdown period.
In general, convective heat transfer enhanced the heat transfer of the U pipes, and the heat supplementation brought by the flowing water, which was proportional to the cubic of the fracture width, significantly enhanced the thermal recovery ability. To compare, the non-fracture rock could only recover its temperature by heat conduction through its boundaries with the surrounding formation.

4. Conclusions

In this paper, an experiment and a numerical simulation were performed to investigate the influencing mechanism of fracture water on the temperature field in a rock mass during a GCHP operation under steady-state conditions. A heat exchange laboratorial platform of a rock mass with a fracture was built. The impact of the fracture water on the temperature field at cooling and heating conditions was investigated through a laboratorial experiment and a numerical simulation. The results of the physical experiments and numerical simulations support the following conclusions:
(1)
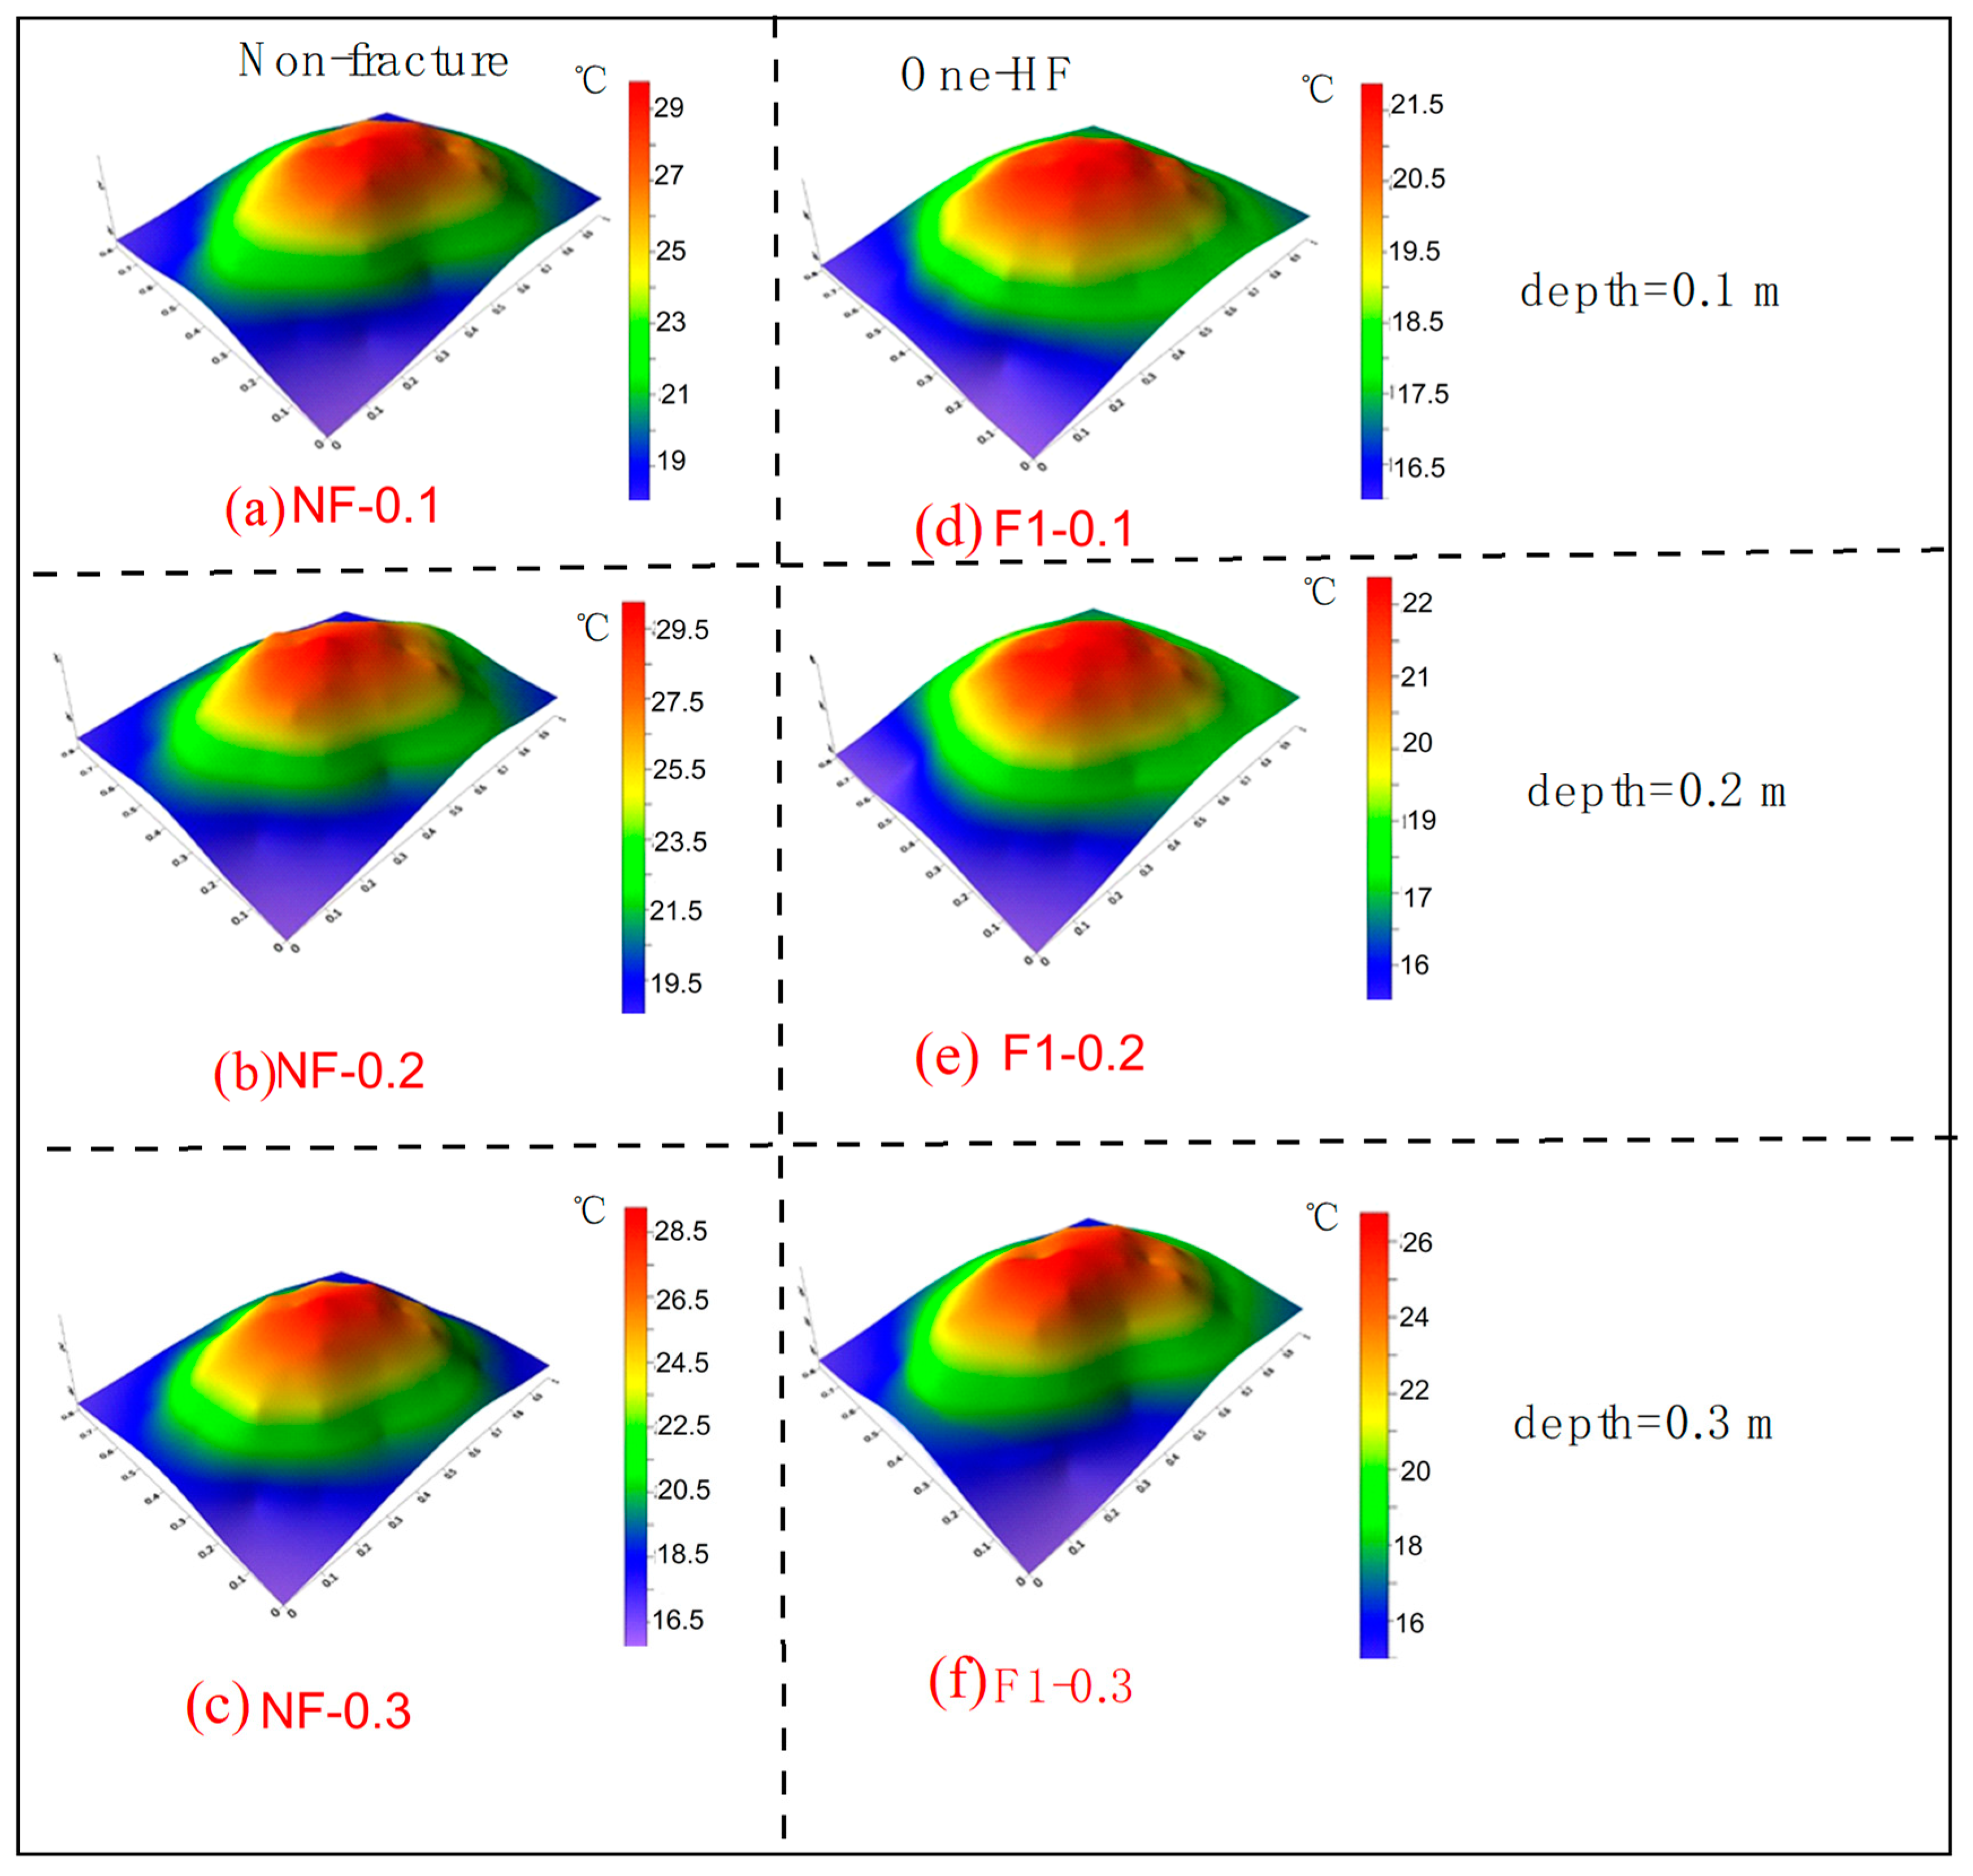
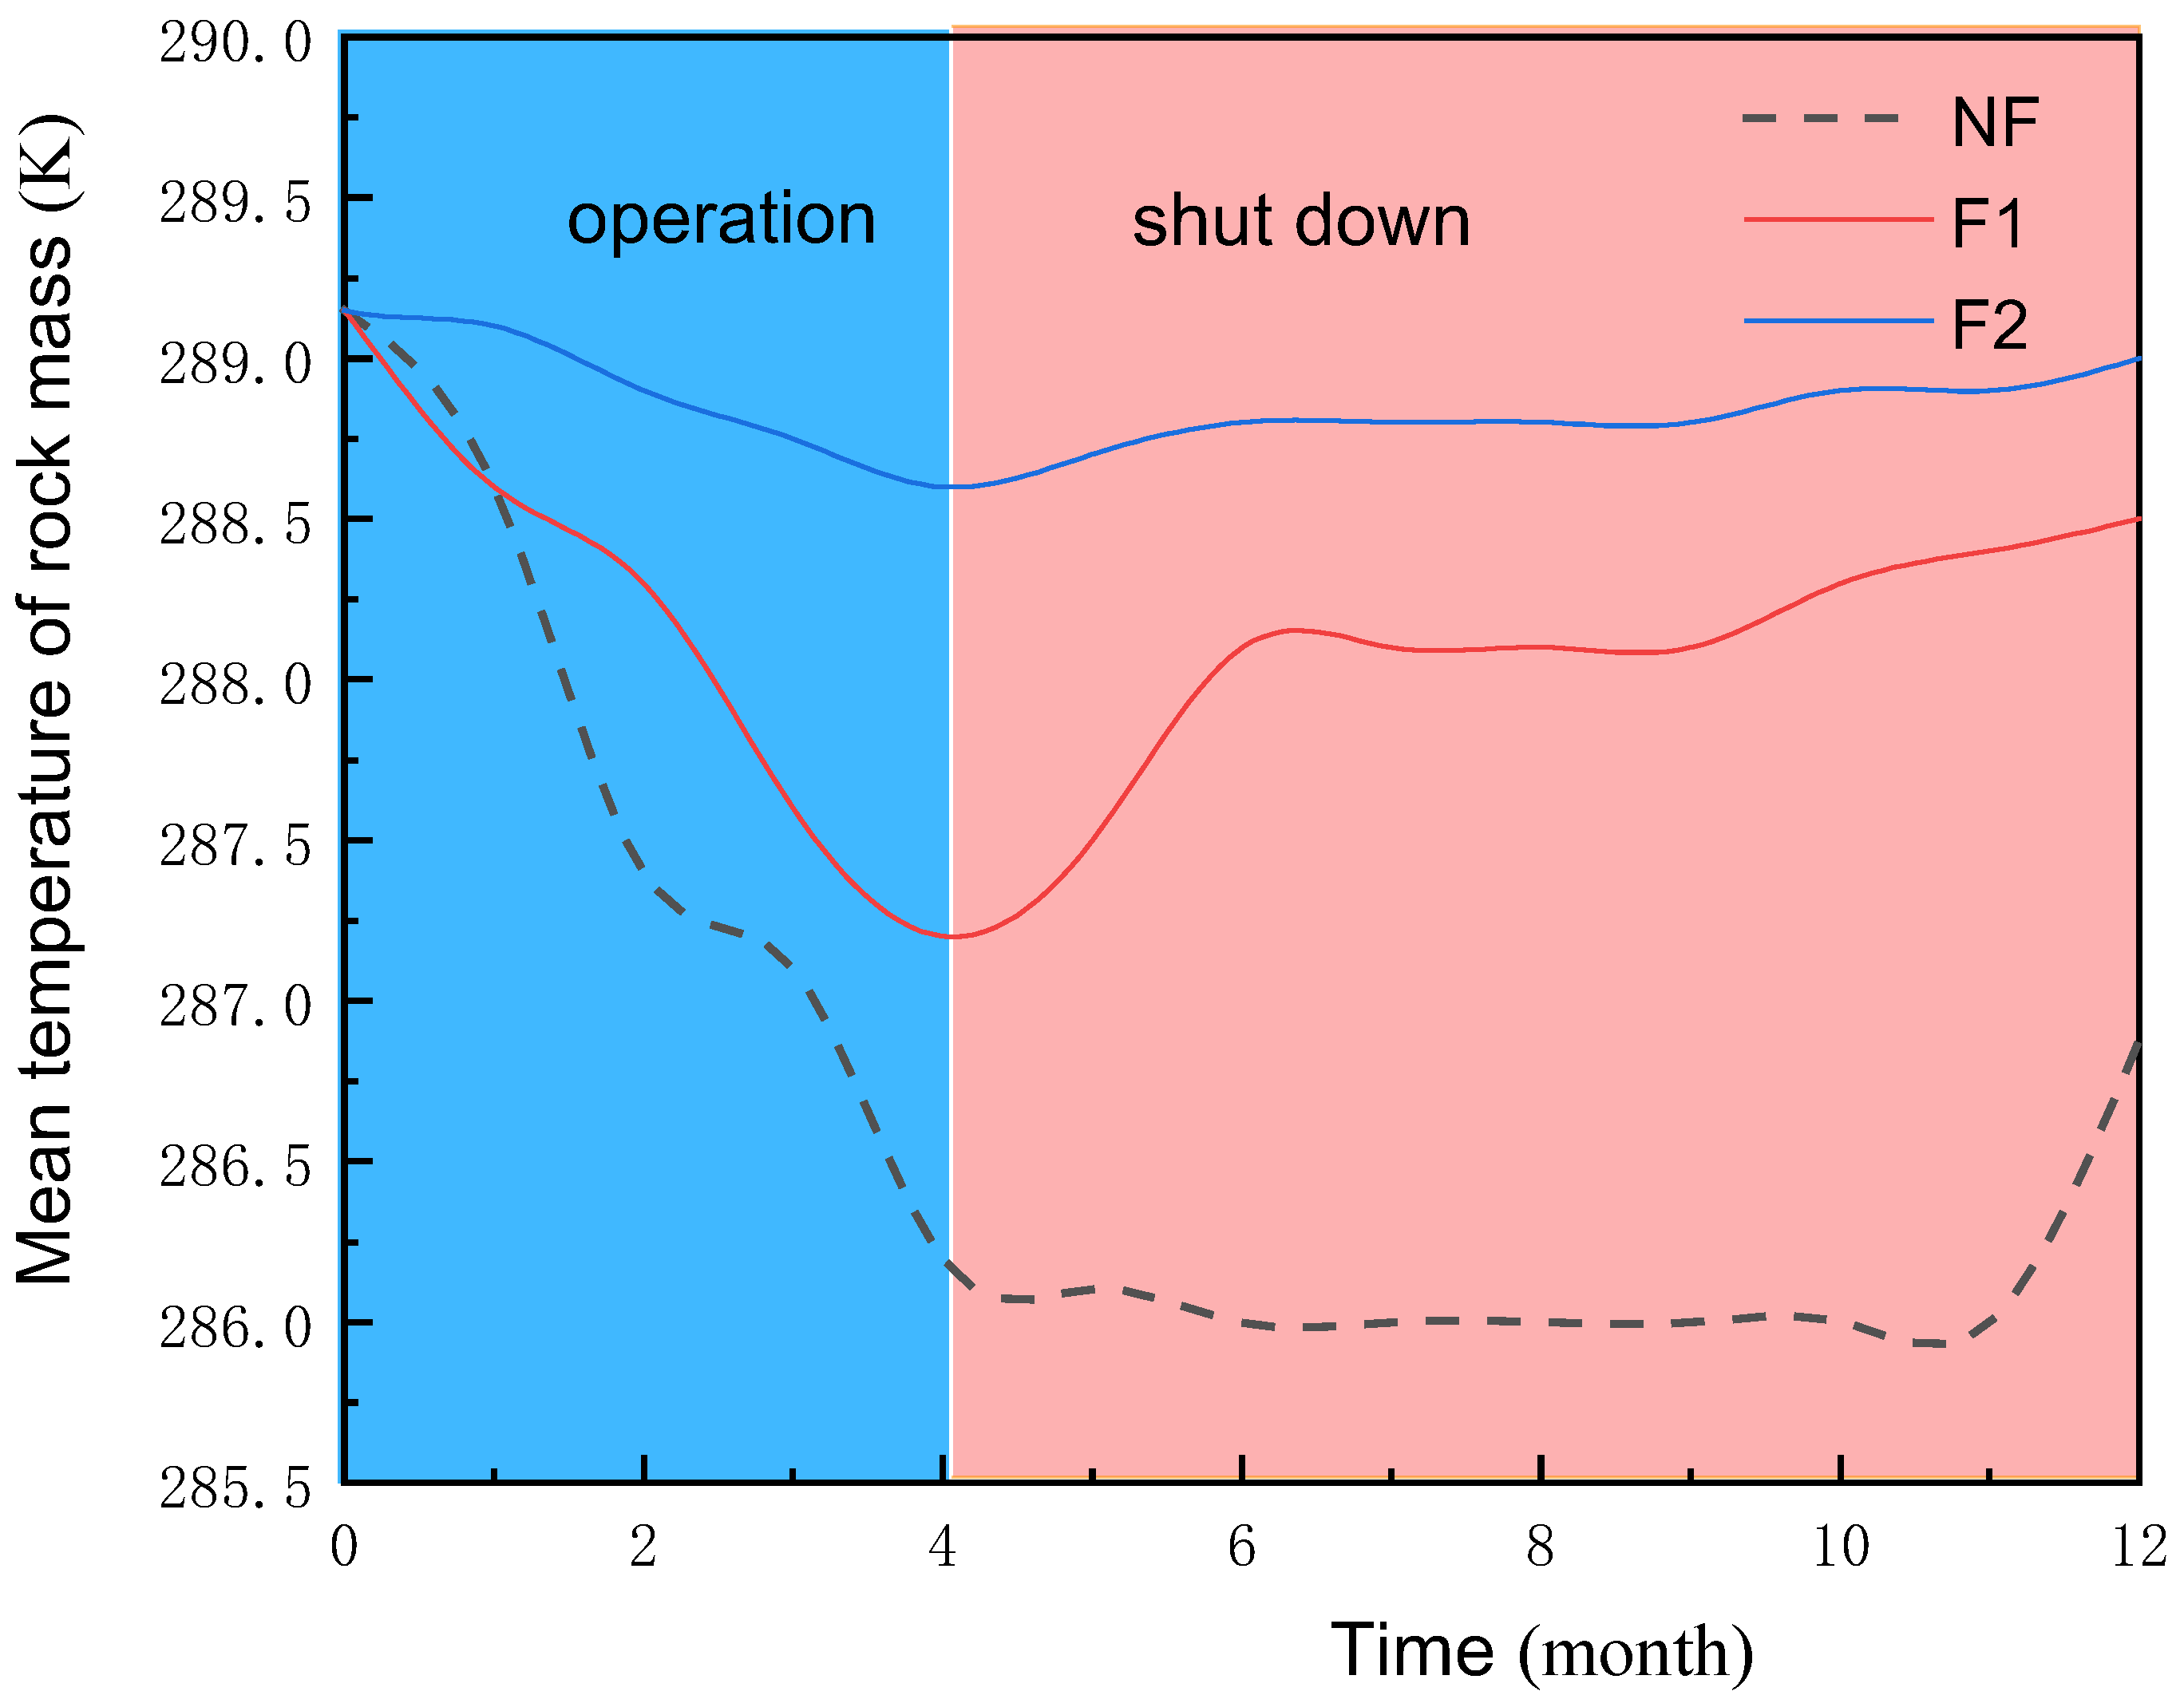
For U pipes buried in karst areas with dense and low-permeability carbonate rock masses, the heat transfer between the U pipes and the rock mainly depends on heat conduction instead of convection. Therefore, the energy in the rock mass is difficult to dissipate to the surrounding formations in time, and it is possible that a thermal imbalance in the underground heat exchange area will occur. However, a rock mass with abundant fracture groundwater offers opportunities to mitigate the thermal imbalance with convection brought by water flow. The contribution of fracture water to the thermal balance of the rock mass is obvious because the energy carried by the flow of water is tremendous. In the simulated cooling period in the experiment, the rock body with one horizontal fracture was heated, and the center temperature of the rock mass was affected by the existence of fracture water. The differences in temperature at different depths were 7.5 K, 7.5 K, and 2 K, respectively, compared with the non-fracture rock mass. However, the effect of the fracture water was constrained in areas close to the fracture.
(2)
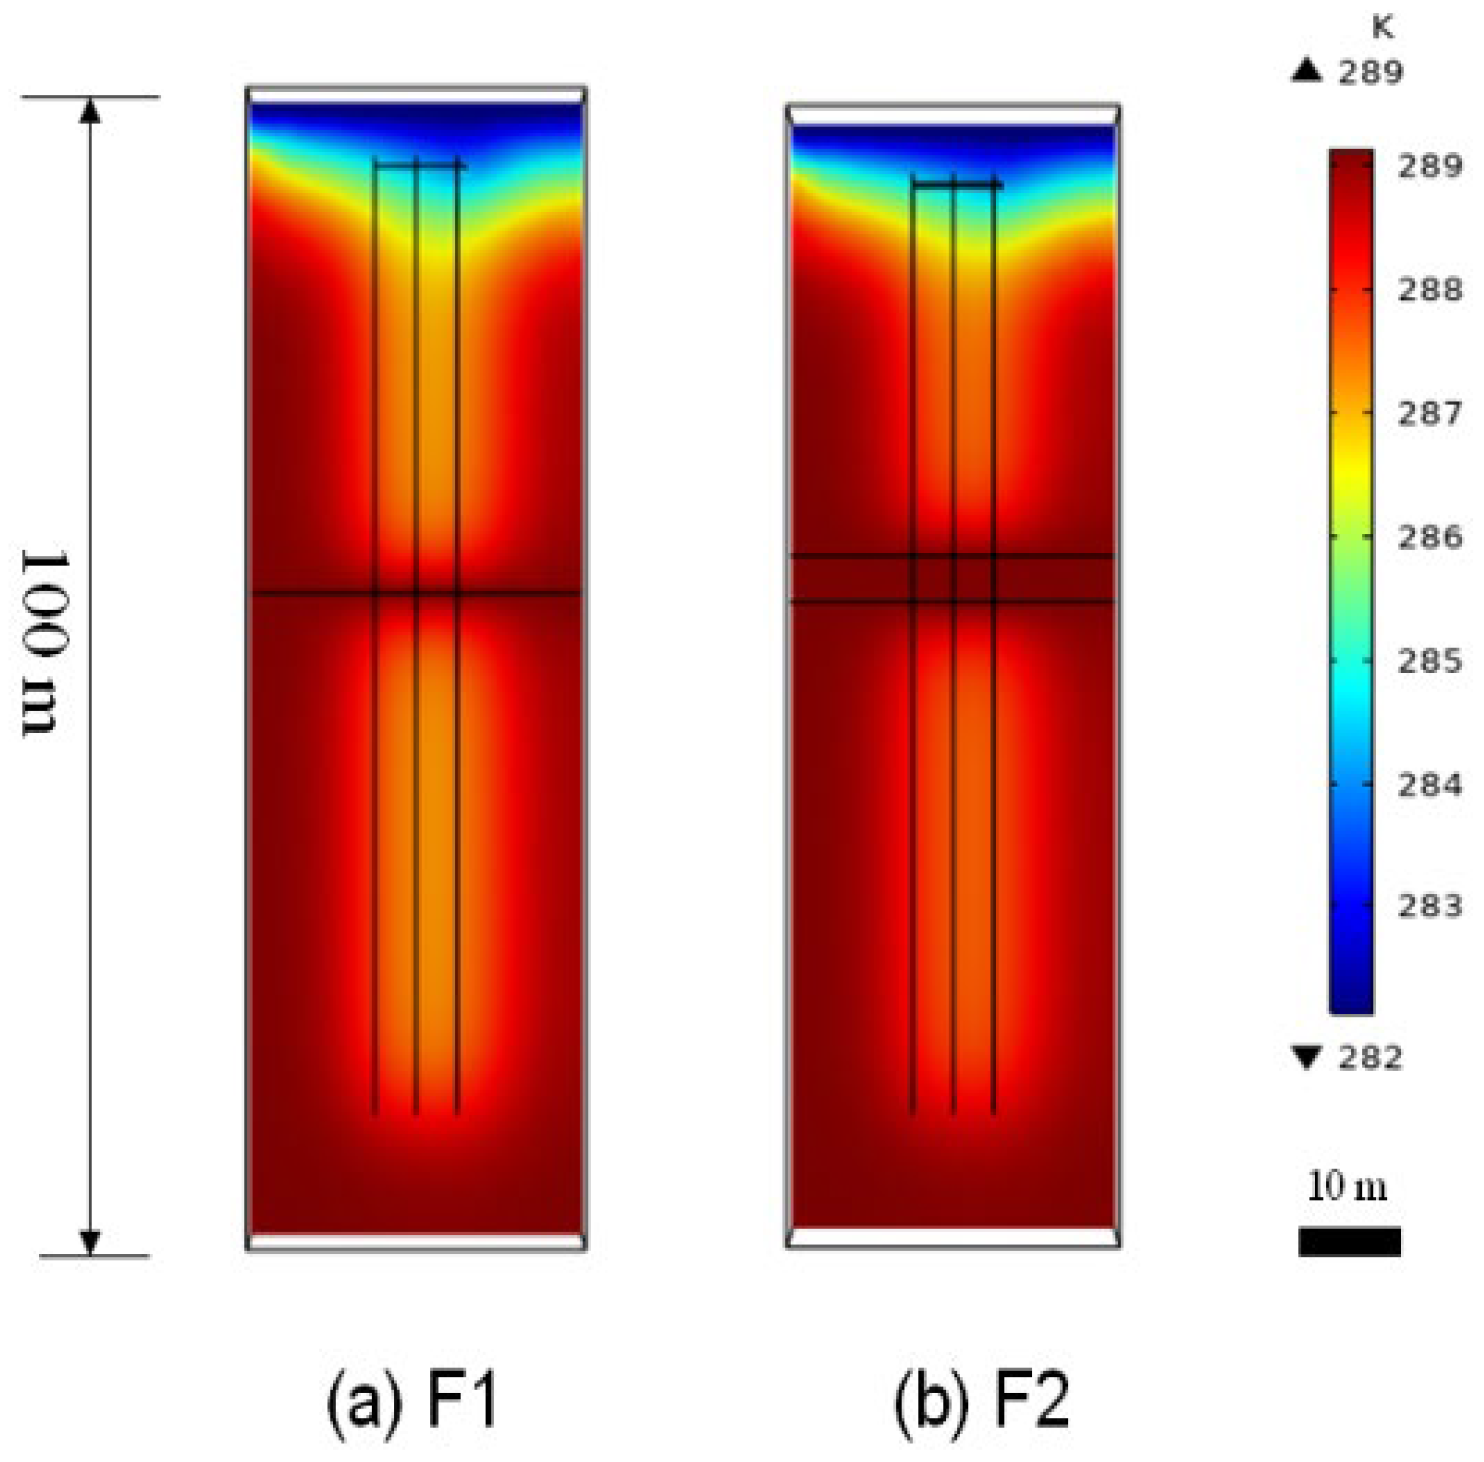
In the simulated heating period in winter, regardless of whether the rock mass had one fracture or two fractures, the temperature of the surrounding rock mass around the fracture was higher than that of the area without the fracture. The gradient of temperature curve of the rock mass nearby the fracture water was flattened due to the existence of the flowing fracture water. It is obvious that when the number of fractures increased, the effect was enhanced.
(3)
The rock mass with the fracture had a small temperature variation during the operation, and the temperature also recovered more quickly during the shutdown period. This is because the fracture water flow volume was proportional to the cubic of the fracture width, so the supplementary energy it carried was significant and effectively enhanced the thermal recovery ability of the rock mass.
(4)
Artificial fractures might be used to enhance water flow and heat transfer, but such an approach might be constrained or forbidden in project sites or urban areas. Therefore, it is proposed that the U pipes should be located at zones with abundant fracture water if the construction condition permits. U pipes that are near the fractures should share more of the load or a denser layout could be possible as their heat transfer capacity is improved by the water flow.

Author Contributions

Conceptualization, P.P.; Formal analysis, C.W.; Software, J.W.; Supervision, L.T.; Writing—original draft, T.L. All authors have read and agreed to the published version of the manuscript.

Funding

This work was supported by the National Natural Science Foundation of China (Grant Number: 52066005), the Natural Science Foundation of Guizhou Province (Grant Number: [2020]2Y025), and the Natural Science Foundation of Guizhou Province (Grant Number: [2022]232).

Institutional Review Board Statement

Review board has reviewed the manuscript and confirmed.

Informed Consent Statement

All authors have been informed and agreed to publish.

Data Availability Statement

All data, models, and codes generated or used during the study appear in the article.

Conflicts of Interest

All the authors have no conflict of interest.

References

  1. Luo, T.; Pei, P.; Chen, Y.; Hao, D.; Wang, C. Improvements in the Water Retention Characteristics and Thermophysical Parameters of Backfill Material in Ground Source Heat Pumps by a Molecular Sieve. Energies 2022, 15, 1801. [Google Scholar] [CrossRef]
  2. Zou, H.; Pei, P.; Zhang, J. Impacts of hydrogeological characters of fractured rock on thermodynamic performance of ground-coupled heat pump. PLoS ONE 2021, 16, e0252056. [Google Scholar] [CrossRef] [PubMed]
  3. Luo, J.; Wang, H.; Zhang, H.; Yan, Z. A geospatial assessment of the installation potential of shallow geothermal systems in a graben basin. Renew. Energy 2021, 165, 553–564. [Google Scholar] [CrossRef]
  4. Zhou, W.; Pei, P.; Hao, D.; Wang, C. A Numerical Study on the Performance of Ground Heat Exchanger Buried in Fractured Rock Bodies. Energies 2020, 13, 1647. [Google Scholar] [CrossRef]
  5. Zhang, H.; Han, Z.; Li, X.; Ji, M.; Zhang, X.; Li, G.; Yang, L. Study on the influence of borehole spacing considering groundwater flow and freezing factors on the annual performance of the ground source heat pump. Appl. Therm. Eng. 2020, 182, 116042. [Google Scholar] [CrossRef]
  6. Pastore, N.; Cherubini, C.; Giasi, C.I. Analysis of gravel back-filled borehole heat exchanger in karst fractured limestone aquifer at local scale. Geothermics 2020, 89, 101971. [Google Scholar] [CrossRef]
  7. Zhao, Z.; Lin, Y.-F.; Stumpf, A.; Wang, X. Assessing impacts of groundwater on geothermal heat exchangers: A review of methodology and modeling. Renew. Energy 2022, 190, 121–147. [Google Scholar] [CrossRef]
  8. He, W.; Xiang, X.; Li, Y.; Li, C. Application and research on buried ground-source heat pump technology in karst area of Guizhou. Drill. Eng. 2014, 41, 62–65. [Google Scholar]
  9. You, T.; Li, X.; Cao, S.; Yang, H. Soil thermal imbalance of ground source heat pump systems with spiral-coil energy pile groups under seepage conditions and various influential factors. Energy Convers. Manag. 2018, 178, 123–136. [Google Scholar] [CrossRef]
  10. Zhou, W.; Pei, P.; Mao, R.; Qian, H.; Hu, Y.; Zhang, J. Selection and techno-economic analysis of hybrid ground source heat pumps used in karst regions. Sci. Prog. 2020, 103, 0036850420921682. [Google Scholar] [CrossRef] [PubMed]
  11. You, T.; Wu, W.; Shi, W.; Wang, B.; Li, X. An overview of the problems and solutions of soil thermal imbalance of ground-coupled heat pumps in cold regions. Appl. Energy 2016, 177, 515–536. [Google Scholar] [CrossRef]
  12. Zeng, Z.; Xu, Y.; Zhao, Y.; Liu, H.; Tang, S. Development of experimental platform on soil heat and moisture migration of ground source heat pump system in karst region. J. Guangxi Univ. (Nat. Sci. Ed.) 2016, 41, 178–186. [Google Scholar] [CrossRef]
  13. Li, Y.; Du, Z.; Xiao, B. Study of characteristics of soil temperature recover under intermittent operation of ground-source heat pump. Acta Energ. Sol. Sin. 2017, 38, 1268–1274. [Google Scholar]
  14. Dacquay, C.; Fujii, H.; Lohrenz, E.; Holländer, H.M. Feasibility of thermal load control from electrochromic windows for ground coupled heat pump optimization. J. Build. Eng. 2021, 40, 102339. [Google Scholar] [CrossRef]
  15. Chung, E.; Ting, K.K.; Aljaaidi, O. Karst modeling of a miocene carbonate build-up in central luconia SE Asia. In Challenges in Seismic Characterization and Geological Model Building; International Petroleum Technology Conference: Bangkok, Thailand, 2011. [Google Scholar]
  16. John, H.A. Engineering Rock Mechanics; Pergamon: London, UK, 1997. [Google Scholar]
  17. Su, C. Advanced Engineering Thermodynamics; Higher Education Press: Beijing, China, 1987. [Google Scholar]
  18. Ma, Z.; Li, Y. Design and Application of Ground Source Heat Pump System; Machinery Industry Press: Beijing, China, 2007. [Google Scholar]
  19. Snow, D.T. Anisotropic permeability of fractured media. Water Resour. Res. 1969, 5, 1273–1289. [Google Scholar] [CrossRef]
  20. Yang, S.; Tao, W. Heat Transfer, 4th ed.; Higher Education Press: Beijing, China, 2006. [Google Scholar]
Figure 1. Flowchart of the experiment system.
Energies 15 06385 g001
Figure 2. Distribution of the drilling positions. The red points are the heater’s locations, and the black points are the thermometer locations. (A) diagram of the top plan of the rock mass experiment; (B) distribution chart of temperature monitoring points.
Energies 15 06385 g002
Figure 3. Specifications of the experimental rock mass with one horizontal fracture.
Energies 15 06385 g003
Figure 4. Plane temperature distribution of the rock mass at depths of 0.1 m, 0.2 m, and 0.3 m: the left column is a rock mass without a fracture (NF); the right column is rock mass with one horizontal fracture (F1), and the rows correspond to different depths.
Energies 15 06385 g004
Figure 5. Curve of temperature change of the rock mass at different depths with time. (A) curve of the center temperature of the monitoring hole with time in one horizontal fracture model; (B) curve of the center temperature of the monitoring hole with time in a non-horizontal fracture model.
Energies 15 06385 g005
Figure 6. Simulated rock mass with U pipes and model specifications. (A) rock mass without a fracture (NF). (B) rock mass with a single horizontal fracture (F1). (C) rock mass with two horizontal fractures (F2).
Energies 15 06385 g006
Figure 7. Layout of the heat exchange pipes in the model. (A) water inlet point; (B) water outlet point; The number values are the location of holes.
Energies 15 06385 g007
Figure 8. Illustration of the model meshing. (A) chart of meshing way; (B) comparison chart of the fine grid and ultra-fine grid.
Energies 15 06385 g008
Figure 9. The temperature field on the X-Y plane at Z = −47.5 m (fracture plane) at the 26th month: (NF) non-fracture rock mass; (F1) rock mass with one horizontal fracture; (F2) rock mass with two horizontal fractures.
Energies 15 06385 g009
Figure 10. The temperature field in the Y-Z plane at X = 20 m at the 26th month: (NF) rock mass without cracks; (F1) one horizontal crack; (F2) two horizontal fractures.
Energies 15 06385 g010
Figure 11. The temperature field in the Y-Z plane at X = 20 m at the 35th month: (F1) one horizontal fracture; (F2) two horizontal fractures.
Energies 15 06385 g011
Figure 12. Mean temperature of the rock mass in one operation–shutdown circle. NF is the non-fracture case, F1 is the one horizontal fracture case, and F2 is the two horizontal fractures case.
Energies 15 06385 g012
Table 1. Definition of the physical parameters in the numerical model.
ParameterDescription of Physical ParametersValueUnit
T_init_mInitial temperature of rock mass289.15 [16]K
C_p_effSpecific heat capacity of rock mass890 [16]J/(kg·K)
k_eff
k_air
Thermal conductivity of rock mass
Thermal conductivity of air
2.95 [17]
0.026 [17]
W/(m·K)
W/(m·K)
Kappa_mPermeability of rock mass1 × 10−15 [16]m2
u_pipeVelocity of fluid in U pipe0.70 [18]m/s
Tjin_wInput temperature of
working fluid in winter
280.15 [1]K
T_init_pInitial temperature of U pipe289.15 [18]K
k_pipeThermal conductivity of U pipe0.43 [18]W/(m·K)
ϕPorosity of matrix0.01 [16]/
r_WDensity of groundwater1000 [17]Kg/m3
w_fWidth of fracture1 × 10−4 [17]m
k_wThermal conductivity of water0.59 [17]W/(m(K)
Cp_wSpecific heat capacity of water 2400 [17]J/(kg(K)
Cp_fSpecific heat capacity of fracture930 [17]J/(kg(K)
T_cDaily cooling time24 [18]h
T_ftTemperature of fracture water289.15 [16]K
Publisher’s Note: MDPI stays neutral with regard to jurisdictional claims in published maps and institutional affiliations.

