
Achieving Carbon Neutrality Pledge through Clean Energy Transition: Linking the Role of Green Innovation and Environmental Policy in E7 Countries
 ,
, 

 ,
,  and
and 
Abstract
:1. Introduction
2. Literature Review
3. Methodology and Data
3.1. Theoretical Motivation
3.2. Data Description
3.3. Model Specification
- Model-1
- Model-2
- Model-3
- Model-4
- Model-5
3.4. Econometric Approaches
3.4.1. Cross-Section Dependence and Slope Heterogeneity
3.4.2. Panel Unit Root
3.4.3. Panel Cointegration Test
3.5. Dynamic Common Correlated Effects (DCCE)
4. Conclusions and Policy Implications
4.1. Concluding Remarks
4.2. Policy Recommendation and Directions for Further Research
Author Contributions
Funding
Data Availability Statement
Conflicts of Interest
Abbreviations
References
- Hossain, E.; Rej, S.; Saha, S.M.; Onwe, J.C.; Nwulu, N.; Bekun, F.V.; Taha, A. Can Energy Efficiency Help in Achieving Carbon-Neutrality Pledges? A Developing Country Perspective Using Dynamic ARDL Simulations. Sustainability 2022, 14, 7537. [Google Scholar] [CrossRef]
- EEA. The Sustainability Transition in Europe in an Age of Demographic and Technological Change; European Environment Agency: Copenhagen, Denmark, 2020. [Google Scholar]
- OECD. Tax and Fiscal Policies after the COVID-19 Crisis: OECD Report for G20 Finance Ministers and Central Bank Governors; Organisation for Economic Co-operation and Development: Rome, Italy, 2021. [Google Scholar]
- EEA. The Role of (Environmental) Taxation in Supporting Sustainability Transitions; European Environment Agency: Copenhagen, Denmark, 2022; Available online: https://www.eea.europa.eu/publications/the-role-of-environmental-taxation (accessed on 2 August 2022).
- LSE. Can We Have Economic Growth and Tackle Climate Change at the Same Time? The London School of Economics and Political Science: London, UK, 2022; Available online: https://www.lse.ac.uk/granthaminstitute/explainers/can-we-have-economic-growth-and-tackle-climate-change-at-the-same-time/ (accessed on 22 August 2022).
- Adebayo, T.S. Revisiting the EKC hypothesis in an emerging market: An application of ARDL-based bounds and wavelet coherence approaches. SN Appl. Sci. 2020, 2, 1945. [Google Scholar] [CrossRef]
- Tang, T.; Shahzad, F.; Ahmed, Z.; Ahmad, M.; Abbas, S. Energy transition for meeting ecological goals: Do economic stability, technology, and government stability matter? Front. Environ. Sci. 2022, 10, 955494. [Google Scholar] [CrossRef]
- Udemba, E.N.; Alola, A.A. Asymmetric inference of carbon neutrality and energy transition policy in Australia: The (de)merit of foreign direct investment. J. Clean. Prod. 2022, 343, 131023. [Google Scholar] [CrossRef]
- Stern, D.I. Progress on the environmental Kuznets curve? Environ. Dev. Econ. 1998, 3, 173–196. [Google Scholar] [CrossRef]
- Usman, M.; Jahanger, A.; Makhdum, M.S.A.; Balsalobre-Lorente, D.; Bashir, A. How do financial development, energy consumption, natural resources, and globalization affect Arctic countries’ economic growth and environmental quality? An advanced panel data simulation. Energy 2022, 241, 122515. [Google Scholar] [CrossRef]
- Yang, B.; Jahanger, A.; Khan, M.A. Does the inflow of remittances and energy consumption increase CO2 emissions in the era of globalization? A global perspective. Air Qual. Atmos. Health 2020, 13, 1313–1328. [Google Scholar] [CrossRef]
- Yang, B.; Jahanger, A.; Usman, M.; Khan, M.A. The dynamic linkage between globalization, financial development, energy utilization, and environmental sustainability in GCC countries. Environ. Sci. Pollut. Res. 2021, 28, 16568–16588. [Google Scholar] [CrossRef]
- Kamal, M.; Usman, M.; Jahanger, A.; Balsalobre-Lorente, D. Revisiting the Role of Fiscal Policy, Financial Development, and Foreign Direct Investment in Reducing Environmental Pollution during Globalization Mode: Evidence from Linear and Nonlinear Panel Data Approaches. Energies 2021, 14, 6968. [Google Scholar] [CrossRef]
- Qiang, O.; Tian-Tian, W.; Ying, D.; Zhu-Ping, L.; Jahanger, A. The impact of environmental regulations on export trade at provincial level in China: Evidence from panel quantile regression. Environ. Sci. Pollut. Res. 2021, 29, 24098–24111. [Google Scholar] [CrossRef]
- Kirikkaleli, D.; Sowah, J.K. A wavelet coherence analysis: Nexus between urbanization and environmental sustainability. Environ. Sci. Pollut. Res. 2020, 27, 30295–30305. [Google Scholar] [CrossRef]
- Chen, W.-M.; Kim, H.; Yamaguchi, H. Renewable energy in eastern Asia: Renewable energy policy review and comparative SWOT analysis for promoting renewable energy in Japan, South Korea, and Taiwan. Energy Policy 2014, 74, 319–329. [Google Scholar] [CrossRef]
- Wu, C.-H.; Tsai, S.-B.; Liu, W.; Shao, X.-F.; Sun, R.; Wacławek, M. Eco-Technology and Eco-Innovation for Green Sustainable Growth. Ecol. Chem. Eng. 2021, 28, 7–10. [Google Scholar] [CrossRef]
- Umar, M.; Ji, X.; Kirikkaleli, D.; Xu, Q. COP21 Roadmap: Do innovation, financial development, and transportation infrastructure matter for environmental sustainability in China? J. Colloid Interface Sci. 2020, 271, 111026. [Google Scholar] [CrossRef]
- Jiang, T.; Yu, Y.; Jahanger, A.; Balsalobre-Lorente, D. Structural emissions reduction of China’s power and heating industry under the goal of “double carbon”: A perspective from input-output analysis. Sustain. Prod. Consum. 2022, 31, 346–356. [Google Scholar] [CrossRef]
- Cheng, H. Future Earth and Sustainable Developments. Innovation 2020, 1, 100055. [Google Scholar] [CrossRef]
- Tong, T.; Ortiz, J.; Xu, C.; Li, F. Economic growth, energy consumption, and carbon dioxide emissions in the E7 countries: A bootstrap ARDL bound test. Energy Sustain. Soc. 2020, 10, 2–17. [Google Scholar] [CrossRef]
- Qayyum, M.; Ali, M.; Nizamani, M.; Li, S.; Yu, Y.; Jahanger, A. Nexus between Financial Development, Renewable Energy Consumption, Technological Innovations and CO2 Emissions: The Case of India. Energies 2021, 14, 4505. [Google Scholar] [CrossRef]
- Usman, M.; Anwar, S.; Yaseen, M.R.; Makhdum, M.S.A.; Kousar, R.; Jahanger, A. Unveiling the dynamic relationship between agriculture value addition, energy utilization, tourism and environmental degradation in South Asia. J. Public Aff. 2021, e2712. [Google Scholar] [CrossRef]
- Zhang, L.; Yang, B.; Jahanger, A. The role of remittance inflow and renewable and non-renewable energy consumption in the environment: Accounting ecological footprint indicator for top remittance-receiving countries. Environ. Sci. Pollut. Res. 2021, 29, 15915–15930. [Google Scholar] [CrossRef]
- Wan, X.; Jahanger, A.; Usman, M.; Radulescu, M.; Balsalobre-Lorente, D.; Yu, Y. Exploring the Effects of Economic Complexity and the Transition to a Clean Energy Pattern on Ecological Footprint From the Indian Perspective. Front. Environ. Sci. 2022, 9, 816519. [Google Scholar] [CrossRef]
- Rehman, A.; Ma, H.; Ozturk, I.; Radulescu, M. Revealing the dynamic effects of fossil fuel energy, nuclear energy, renewable energy, and carbon emissions on Pakistan’s economic growth. Environ. Sci. Pollut. Res. 2022, 29, 48784–48794. [Google Scholar] [CrossRef]
- Sheraz, M.; Deyi, X.; Sinha, A.; Mumtaz, M.Z.; Fatima, N. The dynamic nexus among financial development, renewable energy and carbon emissions: Moderating roles of globalization and institutional quality across BRI countries. J. Clean. Prod. 2022, 343, 130995. [Google Scholar] [CrossRef]
- Sun, Y.; Li, H.; Andlib, Z.; Genie, M.G. How do renewable energy and urbanization cause carbon emissions? Evidence from advanced panel estimation techniques. Renew. Energy 2022, 185, 996–1005. [Google Scholar] [CrossRef]
- Raihan, A.; Tuspekova, A. Toward a sustainable environment: Nexus between economic growth, renewable energy use, forested area, and carbon emissions in Malaysia. Resour. Conserv. Recycl. Adv. 2022, 15, 20096. [Google Scholar] [CrossRef]
- Khan, Y.; Hassan, T.; Kirikkaleli, D.; Zhang, X.; Cai, S. The impact of economic policy uncertainty on carbon emissions: Evaluating the role of foreign capital investment and renewable energy in East Asian economies. Environ. Sci. Pollut. Res. 2022, 29, 18527–18545. [Google Scholar] [CrossRef]
- Khan, I.; Han, L.; Khan, H. Renewable energy consumption and local environmental effects for economic growth and carbon emission: Evidence from global income countries. Environ. Sci. Pollut. Res. 2022, 29, 13071–13088. [Google Scholar] [CrossRef]
- Lu, Y. Modelling the role of eco innovation, renewable energy, and environmental taxes in carbon emissions reduction in E–7 economies: Evidence from advance panel estimations. Renew. Energy 2022, 190, 309–318. [Google Scholar] [CrossRef]
- Jahanger, A.; Usman, M.; Murshed, M.; Mahmood, H.; Balsalobre-Lorente, D. The linkages between natural resources, human capital, globalization, economic growth, financial development, and ecological footprint: The moderating role of technological innovations. Resour. Policy 2022, 76, 102569. [Google Scholar] [CrossRef]
- Yang, B.; Jahanger, A.; Ali, M. Remittance inflows affect the ecological footprint in BICS countries: Do technological innovation and financial development matter? Environ. Sci. Pollut. Res. 2021, 28, 23482–23500. [Google Scholar] [CrossRef]
- Lin, B.; Ma, R. Green technology innovations, urban innovation environment and CO2 emission reduction in China: Fresh evidence from a partially linear functional-coefficient panel model. Technol. Forecast. Soc. Chang. 2022, 176, 121434. [Google Scholar] [CrossRef]
- Ma, Q.; Tariq, M.; Mahmood, H.; Khan, Z. The nexus between digital economy and carbon dioxide emissions in China: The moderating role of investments in research and development. Technol. Soc. 2022, 68, 101910. [Google Scholar] [CrossRef]
- Abid, A.; Mehmood, U.; Tariq, S.; Haq, Z.U. The effect of technological innovation, FDI, and financial development on CO2 emission: Evidence from the G8 countries. Environ. Sci. Pollut. Res. 2022, 29, 11654–11662. [Google Scholar] [CrossRef]
- Obobisa, E.S.; Chen, H.; Mensah, I.A. The impact of green technological innovation and institutional quality on CO2 emissions in African countries. Technol. Forecast. Soc. Chang. 2022, 180, 121670. [Google Scholar] [CrossRef]
- Chishti, M.Z.; Sinha, A. Do the shocks in technological and financial innovation influence the environmental quality? Evidence from BRICS economies. Technol. Soc. 2022, 68, 101828. [Google Scholar] [CrossRef]
- Usman, M.; Hammar, N. Dynamic relationship between technological innovations, financial development, renewable energy, and ecological footprint: Fresh insights based on the STIRPAT model for Asia Pacific Economic Cooperation countries. Environ. Sci. Pollut. Res. 2021, 28, 15519–15536. [Google Scholar] [CrossRef]
- Adebayo, T.S.; Oladipupo, S.D.; Kirikkaleli, D.; Adeshola, I. Asymmetric nexus between technological innovation and environmental degradation in Sweden: An aggregated and disaggregated analysis. Environ. Sci. Pollut. Res. 2022, 29, 36547–36564. [Google Scholar] [CrossRef]
- Xu, L.; Fan, M.; Yang, L.; Shao, S. Heterogeneous green innovations and carbon emission performance: Evidence at China’s city level. Energy Econ. 2021, 99, 105269. [Google Scholar] [CrossRef]
- Razzaq, A.; Fatima, T.; Murshed, M. Asymmetric effects of tourism development and green innovation on economic growth and carbon emissions in top 10 GDP countries. J. Environ. Plan. Manag. 2021, 1–30. [Google Scholar] [CrossRef]
- Meng, Y.; Wu, H.; Wang, Y.; Duan, Y. International trade diversification, green innovation, and consumption-based carbon emissions: The role of renewable energy for sustainable development in BRICST countries. Renew. Energy 2022. [Google Scholar] [CrossRef]
- Liu, J.; Duan, Y.; Zhong, S. Does green innovation suppress carbon emission intensity? New evidence from China. Environ. Sci. Pollut. Res. 2022, 1–22. [Google Scholar] [CrossRef]
- Koseoglu, A.; Yucel, A.G.; Ulucak, R. Green innovation and ecological footprint relationship for a sustainable development: Evidence from top 20 green innovator countries. Sustain. Dev. 2022. [Google Scholar] [CrossRef]
- Latief, R.; Sattar, U.; Javeed, S.A.; Gull, A.A.; Pei, Y. The Environmental Effects of Urbanization, Education, and Green Innovation in the Union for Mediterranean Countries: Evidence from Quantile Regression Model. Energies 2022, 15, 5456. [Google Scholar] [CrossRef]
- Doğan, B.; Chu, L.K.; Ghosh, S.; Truong, H.H.D.; Balsalobre-Lorente, D. How environmental taxes and carbon emissions are related in the G7 economies? Renew. Energy 2022, 187, 645–656. [Google Scholar] [CrossRef]
- Huang, Y.; Haseeb, M.; Usman, M.; Ozturk, I. Dynamic association between ICT, renewable energy, economic complexity and ecological footprint: Is there any difference between E-7 (developing) and G-7 (developed) countries? Technol. Soc. 2022, 68, 101853. [Google Scholar]
- Dogan, E.; Hodžić, S.; Šikić, T.F. A way forward in reducing carbon emissions in environmentally friendly countries: The role of green growth and environmental taxes. Econ. Res.-Ekon. 2022, 1–16. [Google Scholar] [CrossRef]
- Hao, L.-N.; Umar, M.; Khan, Z.; Ali, W. Green growth and low carbon emission in G7 countries: How critical the network of environmental taxes, renewable energy and human capital is? Sci. Total Environ. 2021, 752, 141853. [Google Scholar] [CrossRef]
- Khan, S.A.R.; Ponce, P.; Yu, Z. Technological innovation and environmental taxes toward a carbon-free economy: An empirical study in the context of COP-21. J. Environ. Manag. 2021, 298, 113418. [Google Scholar] [CrossRef]
- Safi, A.; Chen, Y.; Wahab, S.; Zheng, L.; Rjoub, H. Does environmental taxes achieve the carbon neutrality target of G7 economies? Evaluating the importance of environmental R&D. J. Environ. Manag. 2021, 293, 112908. [Google Scholar] [CrossRef]
- Ma, Q.; Murshed, M.; Khan, Z. The nexuses between energy investments, technological innovations, emission taxes, and carbon emissions in China. Energy Policy 2021, 155, 112345. [Google Scholar] [CrossRef]
- Hsu, C.-C.; Zhang, Y.; Ch, P.; Aqdas, R.; Chupradit, S.; Nawaz, A. A step towards sustainable environment in China: The role of eco-innovation renewable energy and environmental taxes. J. Environ. Manag. 2021, 299, 113609. [Google Scholar] [CrossRef]
- Usman, M.; Jahanger, A. Heterogeneous effects of remittances and institutional quality in reducing environmental deficit in the presence of EKC hypothesis: A global study with the application of panel quantile regression. Environ. Sci. Pollut. Res. 2021, 28, 37292–37310. [Google Scholar] [CrossRef]
- Jahanger, A. Impact of globalization on CO2 emissions based on EKC hypothesis in developing world: The moderating role of human capital. Environ. Sci. Pollut. Res. 2022, 29, 20731–20751. [Google Scholar] [CrossRef]
- Li, S.; Yu, Y.; Jahanger, A.; Usman, M.; Ning, Y. The Impact of Green Investment, Technological Innovation, and Globalization on CO2 Emissions: Evidence From MINT Countries. Front. Environ. Sci. 2022, 156, 868704. [Google Scholar] [CrossRef]
- Koc, S.; Bulus, G.C. Testing validity of the EKC hypothesis in South Korea: Role of renewable energy and trade openness. Environ. Sci. Pollut. Res. 2020, 27, 29043–29054. [Google Scholar] [CrossRef]
- Massagony, A. Budiono Is the Environmental Kuznets Curve (EKC) hypothesis valid on CO2 emissions in Indonesia? Int. J. Environ. Stud. 2022, 1–12. [Google Scholar] [CrossRef]
- Pata, U.K.; Aydin, M. Testing the EKC hypothesis for the top six hydropower energy-consuming countries: Evidence from Fourier Bootstrap ARDL procedure. J. Clean. Prod. 2020, 264, 121699. [Google Scholar] [CrossRef]
- Jahanger, A.; Yang, B.; Huang, W.-C.; Murshed, M.; Usman, M.; Radulescu, M. Dynamic linkages between globalization, human capital, and carbon dioxide emissions: Empirical evidence from developing economies. Environ. Dev. Sustain. 2022, 1–29. [Google Scholar] [CrossRef]
- Li, W.; Qiao, Y.; Li, X.; Wang, Y. Energy consumption, pollution haven hypothesis, and Environmental Kuznets Curve: Examining the environment–economy link in belt and road initiative countries. Energy 2022, 239, 122559. [Google Scholar] [CrossRef]
- Maranzano, P.; Bento, J.P.C.; Manera, M. The Role of Education and Income Inequality on Environmental Quality: A Panel Data Analysis of the EKC Hypothesis on OECD Countries. Sustainability 2022, 14, 1622. [Google Scholar] [CrossRef]
- Jahanger, A.; Yu, Y.; Awan, A.; Chishti, M.Z.; Radulescu, M.; Balsalobre-Lorente, D. The Impact of Hydropower Energy in Malaysia Under the EKC Hypothesis: Evidence From Quantile ARDL Approach. SAGE Open 2022, 12, 21582440221109580. [Google Scholar] [CrossRef]
- Boubellouta, B.; Kusch-Brandt, S. Driving factors of e-waste recycling rate in 30 European countries: New evidence using a panel quantile regression of the EKC hypothesis coupled with the STIRPAT model. Environ. Dev. Sustain. 2022, 1–28. [Google Scholar] [CrossRef]
- Balsalobre-Lorente, D.; Ibáñez-Luzón, L.; Usman, M.; Shahbaz, M. The environmental Kuznets curve, based on the economic complexity, and the pollution haven hypothesis in PIIGS countries. Renew. Energy 2022, 185, 1441–1455. [Google Scholar] [CrossRef]
- Alola, A.A.; Okere, K.I.; Muoneke, O.B.; Dike, G.C. Do bureaucratic policy and socioeconomic factors moderate energy utilization effect of net zero target in the EU? J. Environ. Manag. 2022, 317, 115386. [Google Scholar] [CrossRef]
- Gulati, S.; Gholami, Z. Estimating the Impact of Carbon Tax on Natural Gas Demand in British Columbia; Smart Prosperity Institute: Ottawa, ON, Canada, 2015. [Google Scholar]
- Beck, M.; Rivers, N.; Wigle, R.; Yonezawa, H. Carbon tax and revenue recycling: Impacts on households in British Columbia. Resour. Energy Econ. 2015, 41, 40–69. [Google Scholar] [CrossRef]
- Ke, J.; Jahanger, A.; Yang, B.; Usman, M.; Ren, F. Digitalization, Financial Development, Trade, and Carbon Emissions; Implication of Pollution Haven Hypothesis During Globalization Mode. Front. Environ. Sci. 2022, 10, 973880. [Google Scholar] [CrossRef]
- Friedrichs, J.; Inderwildi, O.R. The carbon curse: Are fuel-rich countries doomed to high CO2 intensities? Energy Pol. 2013, 62, 1356–1365. [Google Scholar]
- Qin, L.; Kirikkaleli, D.; Hou, Y.; Miao, X.; Tufail, M. Carbon neutrality target for G7 economies: Examining the role of environmental policy, green innovation and composite risk index. J. Environ. Manag. 2022, 295, 113119. [Google Scholar] [CrossRef]
- WDI. World Bank Database. 2021. Available online: https://data.worldbank.org/ (accessed on 12 May 2022).
- OECD. OECD Databases. 2021. Available online: https://data.oecd.org/ (accessed on 14 March 2022).
- Tenaw, D.; Beyene, A.D. Environmental sustainability and economic development in sub-Saharan Africa: A modified EKC hypothesis. Renew. Sustain. Energy Rev. 2021, 143, 110897. [Google Scholar] [CrossRef]
- Pesaran, M.H.; Yamagata, T. Testing slope homogeneity in large panels. J. Econ. 2008, 142, 50–93. [Google Scholar] [CrossRef]
- Im, K.S.; Pesaran, M.; Shin, Y. Testing for unit roots in heterogeneous panels. J. Econ. 2003, 115, 53–74. [Google Scholar] [CrossRef]
- Pesaran, M.H. A simple panel unit root test in the presence of cross-section dependence. J. Appl. Econ. 2007, 22, 265–312. [Google Scholar] [CrossRef] [Green Version]
- Westerlund, J. Testing for Error Correction in Panel Data. Oxf. Bull. Econ. Stat. 2007, 69, 709–748. [Google Scholar] [CrossRef]
- Chudik, A.; Pesaran, M.H. Common correlated effects estimation of heterogeneous dynamic panel data models with weakly exogenous regressors. J. Econ. 2015, 188, 393–420. [Google Scholar] [CrossRef]
- Pesaran, M.; Smith, R. Estimating long-run relationships from dynamic heterogeneous panels. J. Econ. 1995, 68, 79–113. [Google Scholar] [CrossRef]
- Pesaran, M.H.; Shin, Y.; Smith, R.J. Bounds testing approaches to the analysis of level relationships. J. Appl. Econom. 2001, 16, 289–326. [Google Scholar]
- Sharma, R.; Shahbaz, M.; Sinha, A.; Vo, X.V. Examining the temporal impact of stock market development on carbon intensity: Evidence from South Asian countries. J. Environ. Manag. 2021, 297, 113248. [Google Scholar] [CrossRef]
- Chaudhry, I.S.; Ali, S.; Bhatti, S.H.; Anser, M.K.; Khan, A.I.; Nazar, R. Dynamic common correlated effects of technological innovations and institutional performance on environmental quality: Evidence from East-Asia and Pacific countries. Environ. Sci. Policy 2021, 124, 313–323. [Google Scholar] [CrossRef]
- Ali, S.; Yusop, Z.; Kaliappan, S.R.; Chin, L. Trade-environment nexus in OIC countries: Fresh insights from environmental Kuznets curve using GHG emissions and ecological footprint. Environ. Sci. Pollut. Res. 2021, 28, 4531–4548. [Google Scholar] [CrossRef]
- Eberhardt, M.; Bond, S. Cross-section dependence in nonstationary panel models: A novel es-timator. In MPRA Paper No. 17692; University of Oxford, Department of Economics: Oxford, UK, 2009. [Google Scholar]
- Dumitrescu, E.-I.; Hurlin, C. Testing for Granger non-causality in heterogeneous panels. Econ. Model. 2012, 29, 1450–1460. [Google Scholar] [CrossRef]
- Gyamfi, B.A.; Bein, M.A.; Udemba, E.N.; Bekun, F.V. Renewable energy, economic globalization and foreign direct investment linkage for sustainable development in the E7 economies: Revisiting the pollution haven hypothesis. Int. Soc. Sci. J. 2022, 72, 91–110. [Google Scholar] [CrossRef]
- Kilinc-Ata, N.; Likhachev, V.L. Validation of the environmental Kuznets curve hypothesis and role of carbon emission policies in the case of Russian Federation. Environ. Sci. Pollut. Res. 2022, 1–16. [Google Scholar] [CrossRef] [PubMed]
- Wu, X.; Sadiq, M.; Chien, F.; Ngo, Q.-T.; Nguyen, A.-T.; Trinh, T.-T. Testing role of green financing on climate change mitigation: Evidences from G7 and E7 countries. Environ. Sci. Pollut. Res. 2021, 28, 66736–66750. [Google Scholar] [CrossRef] [PubMed]
- Cao, L. How green finance reduces CO2 emissions for green economic recovery: Empirical evidence from E7 economies. Environ. Sci. Pollut. Res. 2022, 1–14. [Google Scholar] [CrossRef]
- Dogan, E.; Ozturk, I. The influence of renewable and non-renewable energy consumption and real income on CO2 emissions in the USA: Evidence from structural break tests. Environ. Sci. Pollut. Res. 2017, 24, 10846–10854. [Google Scholar] [CrossRef]
- Hassan, S.T.; Khan, D.; Zhu, B.; Batool, B. Is public service transportation increase environmental contamination in China? The role of nuclear energy consumption and technological change. Energy 2022, 238, 121890. [Google Scholar] [CrossRef]
- Baek, J.; Pride, D. On the income–nuclear energy–CO2 emissions nexus revisited. Energy Econ. 2014, 43, 6–10. [Google Scholar] [CrossRef]
- Komal, R.; Abbas, F. Linking financial development, economic growth and energy consumption in Pakistan. Renew. Sustain. Energy Rev. 2015, 44, 211–220. [Google Scholar] [CrossRef]
- Usman, M.; Balsalobre-Lorente, D.; Jahanger, A.; Ahmad, P. Pollution concern during globalization mode in financially resource-rich countries: Do financial development, natural resources, and renewable energy consumption matter? Renew. Energy 2022, 183, 90–102. [Google Scholar] [CrossRef]
- Jahanger, A.; Usman, M.; Balsalobre-Lorente, D. Autocracy, democracy, globalization, and environmental pollution in developing world: Fresh evidence from STIRPAT model. J. Public Aff. 2021, e2753. [Google Scholar] [CrossRef]
- Jahanger, A.; Usman, M.; Ahmad, P. A step towards sustainable path: The effect of globalization on China’s carbon productivity from panel threshold approach. Environ. Sci. Pollut. Res. 2022, 29, 8353–8368. [Google Scholar] [CrossRef]
- Bilal, A.; Li, X.; Zhu, N.; Sharma, R.; Jahanger, A. Green Technology Innovation, Globalization, and CO2 Emissions: Recent Insights from the OBOR Economies. Sustainability 2021, 14, 236. [Google Scholar] [CrossRef]
- Cheng, C.; Ren, X.; Wang, Z. The impact of renewable energy and innovation on carbon emission: An empirical analysis for OECD countries. Energy Procedia 2019, 158, 3506–3512. [Google Scholar] [CrossRef]
- Ahmad, U.S.; Usman, M.; Hussain, S.; Jahanger, A.; Abrar, M. Determinants of renewable energy sources in Pakistan: An overview. Environ. Sci. Pollut. Res. 2022, 29, 29183–29201. [Google Scholar] [CrossRef] [PubMed]
- Dong, K.; Sun, R.; Jiang, H.; Zeng, X. CO2 emissions, economic growth, and the environmental Kuznets curve in China: What roles can nuclear energy and renewable energy play? J. Clean. Prod. 2018, 196, 51–63. [Google Scholar] [CrossRef]
- Yang, B.; Ali, M.; Hashmi, S.H.; Jahanger, A. Do Income Inequality and Institutional Quality affect CO2 Emissions in Developing Economies? Environ. Sci. Pollut. Res. 2022, 29, 42720–42741. [Google Scholar] [CrossRef]
- Usman, M.; Jahanger, A.; Radulescu, M.; Balsalobre-Lorente, D. Do Nuclear Energy, Renewable Energy, and Environmental-Related Technologies Asymmetrically Reduce Ecological Footprint? Evidence from Pakistan. Energies 2022, 15, 3448. [Google Scholar] [CrossRef]
- Shahid, R.; Li, S.; Gao, J.; Altaf, M.A.; Jahanger, A.; Shakoor, A. The Carbon Emission Trading Policy of China: Does It Really Boost the Environmental Upgrading? Energies 2022, 15, 6065. [Google Scholar] [CrossRef]
- Usman, M. Do industrialization, economic growth and globalization processes influence the ecological footprint and healthcare expenditures? Fresh insights based on the STIRPAT model for countries with the highest healthcare expenditures. Sustain. Prod. Consum. 2021, 28, 893–910. [Google Scholar] [CrossRef]
- Jiang, T.; Yu, Y.; Yang, B. Understanding the carbon emissions status and emissions reduction effect of China’s transportation industry: Dual perspectives of the early and late stages of the economic “new normal”. Environ. Sci. Pollut. Res. 2022, 29, 28661–28674. [Google Scholar] [CrossRef]
- Yu, Y.; Jiang, T.; Li, S.; Li, X.; Gao, D. Energy-related CO2 emissions and structural emissions’ reduction in China’s agriculture: An input–output perspective. J. Clean. Prod. 2020, 276, 124169. [Google Scholar] [CrossRef]
- Jiang, T.; Li, S.; Yu, Y.; Peng, Y. Energy-related carbon emissions and structural emissions reduction of China’s construction industry: The perspective of input–output analysis. Environ. Sci. Pollut. Res. 2022, 29, 39515–39527. [Google Scholar] [CrossRef] [PubMed]
- Jiang, T.; Song, J.; Yu, Y. The influencing factors of carbon trading companies applying blockchain technology: Evidence from eight carbon trading pilots in China. Environ. Sci. Pollut. Res. 2022, 29, 28624–28636. [Google Scholar] [CrossRef]
- Zeng, B.; Xie, J.; Zhang, X.; Yu, Y.; Zhu, L. The impacts of emission trading scheme on China’s thermal power industry: A pre-evaluation from the micro level. Energy Environ. 2020, 31, 1007–1030. [Google Scholar] [CrossRef]
- Morina, F.; Ergün, U.; Hysa, E. Understanding Drivers of Renewable Energy Firm’s Performance. Environ. Res. Eng. Manag. 2021, 77, 32–49. [Google Scholar] [CrossRef]
- Hysa, E.; Kruja, A.; Rehman, N.U.; Laurenti, R. Circular Economy Innovation and Environmental Sustainability Impact on Economic Growth: An Integrated Model for Sustainable Development. Sustainability 2020, 12, 4831. [Google Scholar] [CrossRef]
- Jiang, X.; Akbar, A.; Hysa, E.; Akbar, M. Environmental protection investment and enterprise innovation: Evidence from Chinese listed companies. Kybernetes 2022. Ahead-of-Print. [Google Scholar] [CrossRef]


| Authors | Countries | Period | Methods | Findings |
|---|---|---|---|---|
| (A) Renewable Energy-Environment Nexus | ||||
| Qayyum et al. [22] | India | 1980–2019 | FMOLS, DOLS | |
| Usman et al. [23] | South Asia nations | 1995–2017 | FMOLS, DOLS | |
| Zhang et al. [24] | Top remittance-receiving nations | 1990–2018 | CUP-FM, CUP-BC | |
| Wan et al. [25] | India | 1990–2018 | VECM, ARDL | |
| Rehman et al. [26] | Pakistan | 1975–2019 | ARDL model | |
| Sheraz et al. [27] | 64 BRI countries | 2003–2019 | Second-generation approach | |
| Sun et al. [28] | MENA region | 1991–2019 | Second-generation approach | |
| Raihan and Tuspekova [29] | Malaysia | 1990–2019 | DOLS | |
| Khan et al. [30] | 4 East Asian economies | 1997–2020 | PMG | |
| Khan et al. [31] | Global economies | 2002–2019 | Second-generation approach | |
| Yunzhao, [32] | E-7 nations | 1985–2018 | CUP-FM, CUP-BC | |
| (B) Technology Innovation–Green Innovation-Environment Nexus | ||||
| Jahanger et al. [33] | 73 Developing nations | 1990–2016 | PMG approach | |
| Yang et al. [34] | BICS nations | 1990–2016 | Second-generation approach | |
| Lin and Ma, [35] | China | 2006–2017 | Quantile regression | |
| Ma et al. [36] | China | 2006–2017 | Second-generation approach | |
| Abid et al. [37] | G8 nations | 1990–2019 | FMOLS | |
| Obobisa et al. [38] | 25 African countries | 2000–2018 | CCEMG, AMG | |
| Chishti and Sinha, [39] | BRICS nations | 1990–2019 | CCEMG, AMG | |
| Usman and Hammar, [40] | APEC nations | 1990–2017 | CCEMG, AMG | |
| Adebayo et al. [41] | BRICS nations | 1990–2017 | Quantile regression | |
| Xu et al. [42] | China | 2007–2013 | Spatial econometric model | |
| Razzaq et al. [43] | Top 10 GDP countries | 1995–2018 | MMQR approach | |
| Meng et al. [44] | BRICST | 1995–2020 | CS-ARDL | |
| Liu et al. [45] | China | 2000–2019 | Fixed effect regression | |
| Koseoglu et al. [46] | Top 20 green innovator countries | 1993–2016 | Second-generation approach | |
| Latief et al. [47] | Mediterranean countries | 2001–2016 | Quantile regression, GMM | |
| (C) Environment Tax-Environment Nexus | ||||
| Doğan et al. [48] | G7 nations | 1994–2014 | Second-generation approach | |
| Yunzhao, [49] | E-7 nations | 1995–2018 | CUP-FM, CUP-BC | |
| Dogan et al. [50] | 25 nations | 1994–2018 | Quantile regression | |
| Hao et al. [51] | G7 nations | 1991–2017 | CS-ARDL | |
| Khan et al. [52] | 19 EU nations | 1990–2019 | MMQR approach | |
| Safi et al. [53] | G7 nations | 1990–2019 | Second-generation approach | |
| Ma et al. [54] | China | 1995–2019 | Second-generation approach | |
| Hsu et al. [55] | China | 1990–2019 | QARDL approach | |
| (D) Economic Growth-Environment Nexus | ||||
| Usman and Jahanger [56] | 93 Nations | 1990–2016 | Quantile regression | |
| Jahanger, [57] | 78 Nations | 1990–2016 | GMM approach | |
| Li et al. [58] | MINT nations | 2000–2020 | FMOLS, DOLS approaches | |
| Koc and Bulus, [59] | Korea nation | 1971–2017 | ARDL | |
| MassagonyandBudiono, [60] | Indonesia | 1970–2019 | FMOLS, DOLS | |
| Pata and Aydin, [61] | Top six hydropower energy-consuming nations | 1965–2016 | Fourier Bootstrap ARDL procedure | |
| Jahanger et al. [62] | 78 Nations | 1990–2016 | 2SLS approach | |
| Li et al. [63] | 89 OBOR nations | 1995–2017 | Second-generation approach | |
| Maranzano et al. [64] | 17 OECD nations | 1950–2015 | 2SLS regression | |
| Jahanger et al. [65] | Malaysia | 1965–2018 | QARDL approach | |
| Boubelloutaand Kusch-Brandt, [66] | 30 European countries | 2008–2018 | Panel quantile regression | |
| Balsalobre-Lorente et al. [67] | PIIGS countries | 1990–2019 | DOLS | |
| Variables | Symbol | Unit of Measurement | Sources |
|---|---|---|---|
| Carbon emissions | CO2 | Kiloton (kt) | [75] WDI 2021 |
| GDP per capita | GDP | In constant 2010 USD | [75] WDI 2021 |
| GDP2 | GDP2 | GDP Squared | Author’s computation |
| Renewable energy | REN | Metric tons | [75] WDI 2021 |
| Technology innovation | TECH | Patent of resident | [75] WDI 2021 |
| Environment tax | ETAX | % of GDP | [76] OECD 2021 |
| Green innovations | GINNO | Environmental patents and technologies | [76] OECD 2021 |
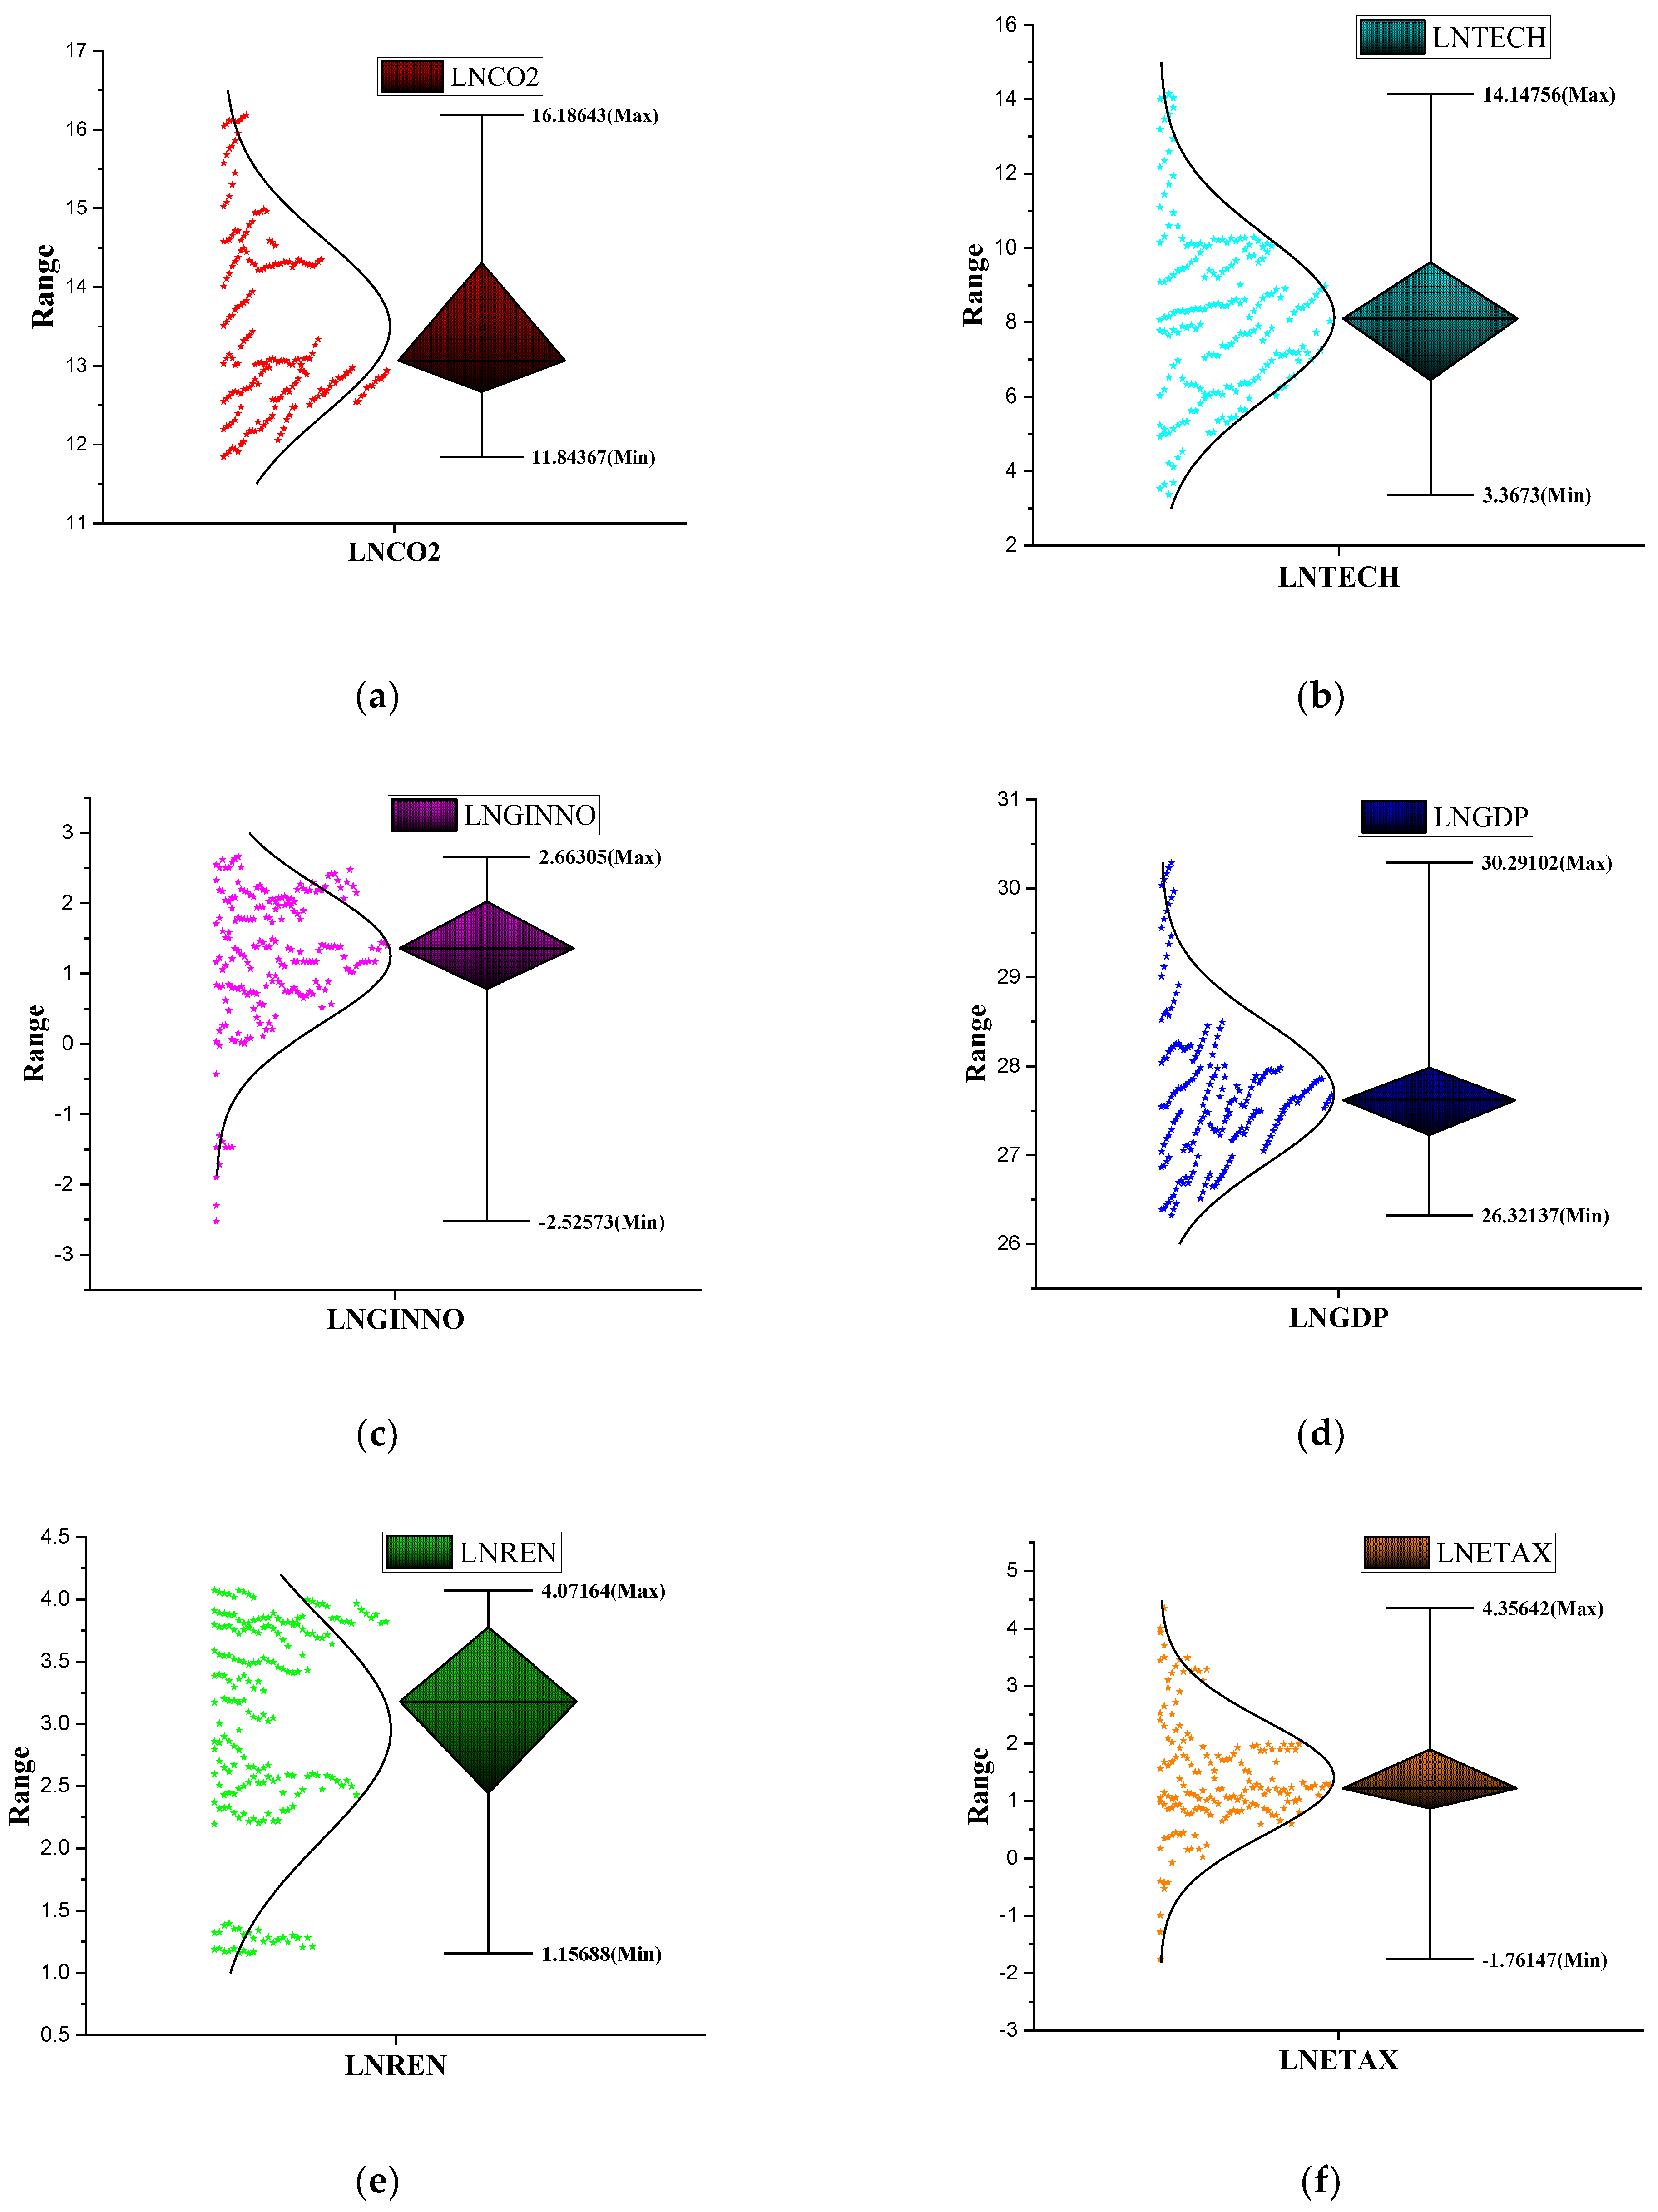
| LNCO2 | LNGDP | LNREN | LNGINNO | ETAX | LNTECH | |
|---|---|---|---|---|---|---|
| Mean | 13.496 | 27.697 | 2.9531 | 1.2495 | 1.4065 | 8.1384 |
| Median | 13.065 | 27.619 | 3.1789 | 1.3558 | 1.2173 | 8.1017 |
| Maximum | 16.186 | 30.291 | 4.0716 | 2.6630 | 4.3564 | 14.147 |
| Minimum | 11.843 | 26.321 | 1.1568 | −2.5257 | −1.7614 | 3.3672 |
| Std. Dev. | 1.1076 | 0.7976 | 0.8903 | 0.9583 | 0.9880 | 2.1931 |
| Skewness | 0.7334 | 1.0909 | −0.6698 | −1.3196 | 0.3780 | 0.4426 |
| Kurtosis | 2.6323 | 4.6338 | 2.3276 | 5.4530 | 4.0367 | 3.2609 |
| Jarque-Bera | 20.010 | 65.013 | 19.659 | 113.60 | 11.799 | 7.3101 |
| Correlation Matrix | ||||||
| CO2 | 1 | |||||
| GDP | 0.8453 | 1 | ||||
| REN | −0.3262 | −0.0828 | 1 | |||
| GINNO | 0.1139 | −0.1584 | −0.1193 | 1 | ||
| ETAX | −0.1697 | −0.3407 | −0.2077 | 0.3324 | 1 | |
| TECH | 0.8887 | 0.8744 | −0.3848 | −0.0863 | −0.0567 | 1 |
| Slope Heterogeneity Test | ||||||
| (test) | 21.19 | 19.09 | 20.31 | 15.90 | 10.55 | 9.63 |
| () | 23.22 | 20.12 | 22.25 | 17.78 | 12.48 | 11.77 |
| CD Test | CIPS Level | First Diff | Results | CADF Level | First Diff | Results | |
|---|---|---|---|---|---|---|---|
| GDP | 23.14 *** | −0.783 | −3.325 *** | 1 (1) | 17.683 | 35.256 *** | 1 (1) |
| REN | 17.19 *** | 1.417 | −5.783 *** | 1 (1) | 11.466 | 62.270 *** | 1 (1) |
| GINNO | 14.38 *** | −0.216 * | −5.307 *** | 1 (0) | 16.745 ** | 57.490 *** | 1 (0) |
| ETAX | 8.23 *** | 0.157 | −5.082 *** | 1 (1) | 17.601 | 53.020 *** | 1 (1) |
| TECH | 19.13 *** | −0.563 | −4.289 *** | 1 (1) | 14.523 | 44.448 *** | 1 (1) |
| Models | ||||
|---|---|---|---|---|
| Model 1 | −0.140 (0.445) | 0.171 (0.568) | −0.769 ** (0.049 | −1.660 ** (0.032) |
| Model 2 | −3.238 ** (0.011) | −3.250 ** (0.035) | −3.563 (0.345) | −4.234 *** (0.000) |
| Model 3 | −1.232 (0.874) | −5.278 *** (0.000) | −2.295 (0.345) | −2.121 (0.347) |
| Model 4 | −1.847 (0.876) | −7.672 *** (0.000) | −4.721 *** (0.000) | −7.184 *** (0.000) |
| Model 5 | −9.237 *** (0.000) | −3.944 *** (0.003) | −6.324 *** (0.000) | −4.323 ** (0.023) |
| Variables | Model-1 Coefficients (Std. Errors) | Model-2 Coefficients (Std. Errors) | Model-3 Coefficients (Std. Errors) | Model-4 Coefficients (Std. Errors) | Model-5 Coefficients (Std. Errors) |
|---|---|---|---|---|---|
| Short Run ∆GDP | 2.090 *** (1.508) | 3.341 *** (10.924) | 1.277 *** (10.872) | 10.590 *** (7.853) | 6.672 *** (6.684) |
| ∆GDPSQ | −0.033 *** (0.274) | −0.056 ** (0.199) | −0.018 ** (0.198) | −0.190 ** (0.141) ** | −0.120 *** (0.120) |
| ∆REN | - | −0.433 *** (0.107) | −0.421 *** (0.093) | −0.465 ** (0.139) | −0.554 *** (0.122) |
| ∆GINNO | - | - | −0.007 *** (0.010) | −0.007 *** (0.023) | −0.002 *** (0.012) |
| ∆ETAX | - | - | - | −0.022 *** (0.017) | −0.060 *** (0.054) |
| ∆TECH | - | - | - | - | −0.014 ** (0.041) |
| ECM(-1) | −0.417 *** (0.000) | −0.662 *** (0.000) | −0.687 *** (0.000) | −0.7834 *** (0.000) | −0.9723 *** (0.000) |
| Long-Run | |||||
| GDP | 20.440 *** (28.138) | 0.619 *** (17.30) | 3.695 ** (1.697) | 7.544 *** (6.864) | 6.827 *** (6.251) |
| GDPSQ | 0.3932 ** (0.514) | −0.017 ** (0.316) | −0.073 ** (0.073) | −0.135 ** (0.124) | −0.122 *** (0.113) |
| REN | - | −0.642 *** (0.145) | −0.618 * (0.142) | −0.516 ** (0.163) | −0.580 *** (0.154) |
| GINNO | - | - | −0.009 *** (0.014) | −0.006 *** (0.023) | −0.001 *** (0.013) |
| ETAX | - | - | - | −0.018 *** (0.014) | −0.043 *** (0.037) |
| TECH | - | - | - | - | −0.004 *** (0.154) |
| Brazil | India | China | Turkey | Russia | Mexico | Indonesia | |
|---|---|---|---|---|---|---|---|
| GDP | 46.786 *** | 3.469 * | 3.531 ** | 0.716 * | 6.450 | 22.877 ** | 23.595 *** |
| GDPSQ | −0.820 *** | −0.063 ** | −0.042 | 0.214 * | 0.120 | −0.406 ** | −0.440 *** |
| REN | −1.310 *** | −0.514 ** | −0.933 *** | −0.338 *** | −0.176 | −0.455 *** | −0.589 *** |
| GINNO | 0.003 *** | 0.005 | 0.062 * | −0.088 * | −0.031 ** | 1.510 *** | −0.026 * |
| ETAX | −0.061 * | −0.131 * | 0.042 *** | −0.012 | −0.014 ** | −0.016 ** | −0.009 |
| TECH | −0.135 ** | −0.561 ** | −0.028 ** | −0.019 | 0.029 ** | −0.026 * | 0.031 *** |
| Null Hypothesis | W-Stat. | Z-Bar | p-Value | Decision |
|---|---|---|---|---|
| lnGDP → lnCO2 | 2.69080 | 2.60408 | 0.0092 | Unidirectional |
| LnCO2 → lnGDP | 5.84892 | 7.72021 | 1.0914 | |
| GDPSQ → lnCO2 | 2.58149 | 2.42700 | 0.0152 | Unidirectional |
| lnCO2 → GDPSQ | 6.02637 | 8.00768 | 1.0915 | |
| lnREN → lnCO2 | 3.82300 | −0.42173 | 0.0032 | Unidirectional |
| lnCO2 → lnREN | 1.54586 | 0.74929 | 0.4537 | |
| lnGINNO → lnCO2 | 4.66219 | 0.93774 | 0.0084 | Unidirectional |
| lnCO2 → lnGINNO | 2.11776 | 1.67577 | 0.0938 | |
| lnETAX → lnCO2 | 0.89258 | −0.34357 | 0.7312 | No causality |
| lnCO2 → lnETAX | 1.99181 | 1.31307 | 0.1892 | |
| InTech → lnCO2 | 3.55697 | 3.98887 | 0.0005 | Bidirectional |
| lnCO2 → lnTECH | 6.02898 | 7.97860 | 0.0005 |
Publisher’s Note: MDPI stays neutral with regard to jurisdictional claims in published maps and institutional affiliations. |
© 2022 by the authors. Licensee MDPI, Basel, Switzerland. This article is an open access article distributed under the terms and conditions of the Creative Commons Attribution (CC BY) license (https://creativecommons.org/licenses/by/4.0/).
Share and Cite
Yu, Y.; Radulescu, M.; Ifelunini, A.I.; Ogwu, S.O.; Onwe, J.C.; Jahanger, A. Achieving Carbon Neutrality Pledge through Clean Energy Transition: Linking the Role of Green Innovation and Environmental Policy in E7 Countries. Energies 2022, 15, 6456. https://doi.org/10.3390/en15176456
Yu Y, Radulescu M, Ifelunini AI, Ogwu SO, Onwe JC, Jahanger A. Achieving Carbon Neutrality Pledge through Clean Energy Transition: Linking the Role of Green Innovation and Environmental Policy in E7 Countries. Energies. 2022; 15(17):6456. https://doi.org/10.3390/en15176456
Chicago/Turabian StyleYu, Yang, Magdalena Radulescu, Abanum Innocent Ifelunini, Stephen Obinozie Ogwu, Joshua Chukwuma Onwe, and Atif Jahanger. 2022. "Achieving Carbon Neutrality Pledge through Clean Energy Transition: Linking the Role of Green Innovation and Environmental Policy in E7 Countries" Energies 15, no. 17: 6456. https://doi.org/10.3390/en15176456
APA StyleYu, Y., Radulescu, M., Ifelunini, A. I., Ogwu, S. O., Onwe, J. C., & Jahanger, A. (2022). Achieving Carbon Neutrality Pledge through Clean Energy Transition: Linking the Role of Green Innovation and Environmental Policy in E7 Countries. Energies, 15(17), 6456. https://doi.org/10.3390/en15176456