Article

The Weighted Average Cost of Capital and Its Universality in Crisis Times: Evidence from the Energy Sector

by
Zbysław Dobrowolski
1,*,
Grzegorz Drozdowski
2,
Mirela Panait
3,5 and
Simona Andreea Apostu
4,5
1
Institute of Public Affairs, Jagiellonian University, 30-348 Kraków, Poland
2
Department of Economics and Finance, Jan Kochanowski University in Kielce, 25-369 Kielce, Poland
3
Department of Cybernetics, Economic Informatics, Finance and Accounting, Petroleum-Gas University of Ploiesti, 100680 Ploiesti, Romania
4
Department of Statistics and Econometrics, Bucharest University of Economic Studies, 010552 Bucharest, Romania
5
Institute of National Economy, 050771 Bucharest, Romania
*
Author to whom correspondence should be addressed.
Energies 2022, 15(18), 6655; https://doi.org/10.3390/en15186655
Submission received: 28 July 2022 / Revised: 31 August 2022 / Accepted: 8 September 2022 / Published: 12 September 2022

Abstract

:
Recent economic anomalies, including the unprecedented lockdown generated by the COVID-19 crisis, have demonstrated that the weighted average cost of capital (WACC) remains an actual topic in the financial literature and in practice. Companies operate in an increasingly volatile environment, due to twin transitions and interlinked crises, and so they must have specific tools for measuring risk and profitability, in order to enable them to have a sound financial policy. Based on the earlier results obtained by Modigliani and Miller (1963), Harris and Pringle (1985), and Farber, Gillet, and Szafarz (2006), this study shows the relationship between WACC and interest rate. It offers a modified WACC formula that considers unstable market circumstances. The new redefined WACC can be a valuable tool in business planning for companies from different fields. The companies in the energy sector are very interested in the topic of WACC, considering not only the complex nature of the investments made and the long-term nature of investment recovery but also the multiple risks that have an impact on their activity and that can be found in different economic, social, and geopolitical spheres.

1. Introduction

Most firms are operating in an increasingly complex and volatile environment, and financial innovation is becoming more and more intense, with new tools and techniques being available as the fintech phenomenon expands. The modern world’s variability, uncertainty, complexity, and ambiguity (VUCA) generates many challenges for companies and financial institutions that need to tailor and constantly rethink their business strategy to stay in the market despite current events. The stability of financial institutions is an essential element, with repercussions on the financing structure of companies and the cost of capital used [1,2,3,4,5,6]. In certain fields of activity, such as the energy sector, the problem of the sources of financing and the cost of capital are more specialized, considering the characteristics of the investment projects in this field, namely, their complex nature, the long investment recovery period, and the high risks that affect investment profitability and that can be identified economically, socially, and geopolitically.
Despite the complexity of such economic activity, a fundamental problem posed by the shareholders and managers of the companies is the company’s market value, which becomes a topic of the utmost importance in the context of an understanding of mergers and acquisitions. The theory developed by Modigliani and Miller in the 1960s and 1970s [7,8,9] established that the market value of a company is independent, under certain conditions, of its degree of indebtedness in terms of the structure of capital. The market value of an enterprise does not change if it belongs entirely to the shareholders or if it is divided between the shareholders or creditors. If there were a difference between the value of an indebted firm and the value of a non-indebted firm (of the same risk class) that makes the same operating profit, their values would be approximate, due to arbitrage. In the case of the existence of the fiscal system, characterized by the asymmetry of the taxation of income obtained by investors (shareholders or creditors), indebted companies achieve a fiscal economy, which then translates into lowering the cost of capital. Thus, the value of an indebted enterprise is equal to that of the indebted firm, plus the tax economy. The tax savings that are due to the shareholders of the indebted company thus offset the increased risk to which they were subject because of indebtedness [10].
In choosing the sources of financing, companies must also take into account certain economic realities. Borrowed capital can be relatively cheap but it must be used sparingly. As the company borrows, the value of the business will increase up to a point, after which we will see a continuous decline due to the occurrence of costs related to bankruptcy (or opportunity costs). In this category, specific issues could be included: tightening credit conditions by imposing insolvency risk premiums, the decreased trust of business partners, leaving the company without its best employees, difficulties in successfully concluding primary public offerings for the sale of shares or bonds due to the distrust of potential investors. In insolvency, the declaration of bankruptcy will lead to new costs: administrative costs and the costs related to prosecution. Therefore, managers will not pursue the maximum indebtedness of the company but instead the achievement of that optimal level of financial structure. The optimal borrowing structure is obtained when the marginal costs of bankruptcy, for each additional percentage of indebtedness, are equal to the marginal tax savings of the same increase in indebtedness. In addition to capital cost issues, capital structure is also influenced by other factors: the development of the financial system, the stability of the company’s sales, and the structure of the assets, which will be able to support the guarantee of bank or bond loans profitability of the company, how to distribute the dividend (residual policy, interest rate policy, and stabilized policy), and the tax regime that may favor the use of loan capital [11,12,13,14,15].
Financial analytics use many indicators in the decision-making process [16,17,18,19,20]. One of them is the weighted average cost of capital (WACC), as is widely presented in the literature [21,22,23,24,25,26,27,28,29,30]. This indicator can assist decision-makers in assessing the attractiveness of an investment. However, one may argue that such an indicator is characterized by relativism. Such an interpretation may differ, depending on who makes such an assessment. For an investor interested in purchasing shares or stocks, WACC determines the minimum expected rate of return on an investment at a given level of risk characteristic of the operation of a given enterprise. In turn, for an entrepreneur who analyzes the profitability of an investment project, this simply means the price of obtaining capital. Therefore, WACC is a tool used by issuing companies, by portfolio investors, and also by financial institutions who calculate this indicator to substantiate specific decisions.
Different studies for specific economies or industrial fields have demonstrated that WACC is important for corporate investment [31,32,33,34,35]. We do not discuss the legitimacy of using WACC in the investment process or which of the rules adopted for calculating the WACC are more or less reasonable. We assume that investors can use either the Miles and Ezzell [36], Harris and Pringle [37], or Modigliani and Miller [8] approaches. We also do not discuss the relationship between WACC and risk, noting that such a reliance exists [38]. Instead, we are looking for answers to the following research question of whether the nature of WACC is universal. We argue that the cost of debt consists of intervening variables. Therefore, it cannot be perceived as a universal financial indicator. This study covers a gap between the theory and empirical studies on WACC. The results showed that the WACC model needs to change to better fit companies from emerging markets and crisis situations. Energy companies are subject to pressures generated by the authorities’ desire to accelerate the transition to a low-carbon economy and by the crises affecting the world economy (the COVID-19 crisis and the energy crisis triggered by the war in Ukraine). In the course of a few months after the start of the war in Ukraine, the European authorities have reconfigured their position toward renewable energy; priorities have been reset, and now the main concerns are energy security vis-à-vis Russia and reducing the spectrum of energy poverty for the population. For these reasons, investment projects have been rethought; in some countries in the European Union, there are intentions to re-enter the circuit of coal mines and make new investments to access cheap energy sources from other areas, in order to reduce energy dependence on Russia. Thus, the main contribution of this paper is to offer a new formula of WACC that can be used in unstable market circumstances by companies in the field of energy supply that are under economic, social, and political pressures.
This manuscript is organized into five parts. After the introductory section, the authors present the main studies on WACC. The methodology section is followed by the Section 4, in which the authors comment on the proposed WACC formula that can be used in conditions of uncertainty. Finally, the authors present the conclusions of the study, the limits of the research, and future research directions.

2. Literature Review

Modigliani and Miller [7] showed the WACC to be a tool helping with capital structure decision problems. They underlined that debt-financing could positively influence a company’s outcomes, due to the tax shield effect. However, the tax effect on equity financing may reduce the rationality of the decision process. Miller [39] showed that the WACC is only a linear approximation of a nonlinear relationship. Meyers [40] pointed out the necessity of establishing the target debt level to achieve the tax benefit, combined with the cost of capital. All these activities lead to determining the optimal capital structure that maximizes a company’s market value while minimizing its cost of capital [40].
Leverage can help in determining the optimal debt structure. Leverage examines the impact of changing the financial structure on the fluctuation of the rate of return on equity. It is assumed that if an increase in indebtedness leads to a rise in the profitability of equity, then there is a positive financial leverage effect. At the same time, when an increase in indebtedness lowers the profitability of equity, there is a negative financial leverage effect.
The equation of degree of financial leverage (DFL) is the following:
D F L = E B I T E B I T 1
where EBIT refers to earnings before interest and taxes.
As the degree of leverage increases, so does the company’s financial risk. A negative leverage ratio means that the company generates an operating profit lower than the interest owed. One may state that financial theory does not provide information on the target leverage value at which the capital structure is optimized [41,42].
The decision-makers should consider the tax risk, which means that tax policies that are friendly for investors can change in the future, and the tax shield may not be as effective as before. One should also consider inflation risk. This influences decisions regarding capital cost because of monetary and fiscal policies engaged in reducing excessive inflation. This has made investment projects questionable from the long-term perspective and is assessed at a high discount rate. Inflation depends on consumer trust in the stability of the market. In other words, financial factors influencing companies should be considered through the prism of the companies’ demographic, cultural, and legal environment. Therefore, one needs to agree with researchers [43,44,45] that non-financial determinants also influence the capital structure.
The WACC formula is as follows:
W A C C = ( E V × R e ) + ( D V × R d × ( 1 T c ) )
where:
E = Market value of the company’s equity;
D = Market value of the company’s debt;
Re = Cost of equity;
Rd = Cost of debt;
Tc = Corporate tax rate.
From the investors’ point of view, the value of the levered company is the sum of the equity (E) and the debt (D), both being calculated at market value:
V = E + D
Starting from Equation (3), the expected return is:
r v = r e E V + r d D V
where re and rd are the expected return of the equity and the debt.
The value of the all-equity company (VU) is obtained by discounting the free cash flows at the opportunity cost of capital, noted as “ra”. Tax savings discounted at the “rts” yield is the present value of the tax shield. Therefore, the value of the levered company (V) is the value of the all-equity firm (VU), plus the present value of the tax shield (VTS):
V = VU + VTS
whereby one may formulate the following expression:
r a V U V + r t s V T S V = r e E V + r d D V .
It means that
r e = r a + ( r a r d )   D V T S E .
If the tax shield has the same risk level as the assets of the firm, the Equation is as follows:
r e = r a + ( r a r d ) D E
Modigliani and Miller’s rule assumes that the level of debt is constant and the tax shield discount rate is: rts = rd. Based on Modigliani and Miller’s hypothesis [8], one may propose the following WACC formula and return of equity:
W A C C = r a ( 1 T c ) L
where:
L = D D + E
r e = r a   ( r a r d ) ( 1 T c ) L 1 L .
The second rule identified by Miles and Ezzel [36] and Harris and Pringle [37] supposes that ”all tax shields have the same risk as to the firm’s asset and should be discounted at the opportunity cost of capital [23]. The hypothesis is that: D is proportional to VU, so rts = ra. Taking into account the results of Harris and Pringle [37], these may be summarized in the following way for WACC [37] and the expected return on equity (re):
W A C C = r e ( 1 L ) + r d ( ( 1 T c ) L = r a r d T c L
r e = r a ( r a r d ) L 1 L
The paradigm shift regarding the role of companies in society has generated the appearance of studies on capturing the elements of sustainability in the process of evaluating the value of companies and the cost of capital used. Under pressure from stakeholders, companies are increasingly concerned with reporting their performance. A sustainability report is a complex tool that captures detailed information on social responsibility programs and concrete actions to manage the impact on the environment and society, especially by companies that generate negative externalities [38,46,47,48,49,50,51,52]. In addition, from those perspectives, proper financial planning based on credible financial indicators plays an important role.
The increase in the uncertainty of economic activity under the impact of various events has led to an increase in researchers’ concerns with regard to the relationship between the cost of capital, the capital structure, and the economic policy uncertainty. Again, financial indicators play a crucial role [53,54,55,56,57,58,59]. Taking into account that WACC is the essential rate for all investment projects (they can be accepted by the management team and can be implemented by the firms, depending on WACC), studies demonstrate the importance of WACC, not only in the selection of investment projects but also in its relativity [60]. “Because the costs of its component capital sources vary over time, a firm might reject a project during a period when its costs of capital are higher than it would have accepted during a period when its costs of capital were lower” [61]. The uncertainty that has manifested in times of crisis affects the cost of capital at which companies can be financed, the reaction of financial markets (the equity market volatility registered hit levels that have been unknown since the 2007–2008 financial crisis), and the measures promoted by the public authorities (such as state aid) having a significant impact on the financial behavior of companies. The reaction of the capital markets to the COVID-19 crisis has been dramatic, with declining stock prices and investor confidence, which has led to declining returns on equities. From the perspective of the cost of equity, the COVID-19 crisis led to a “negative cost of equity” and implies a “negative or very small WACC, depending, of course, on the cost of debt for the firm and their relative capital structure weights” [61]. However, the decrease in the cost of equity will not generate an attempt by companies to use this method of financing because the interest of investors in shares was reduced under the conditions of the COVID-19 crisis.
Given the impact of the COVID-19 crisis on the banking market, where there are dramatic increases in interest rates “during periods of uncertainty, the cost of capital tends to increase due to constrained investment on innovation” [62], similar conclusions being made by Xu [56].
The specialists consider that the level of uncertainty implied by the COVID-19 crisis “makes it hard enough to accurately estimate the few inputs needed to calculate the WACC without injecting untestable intuitions into the calculations” [63]. The uncertainty associated with the inputs during times of crisis is also highlighted by researchers such as Liu [64] or Muir [65], but that uses the WACC indicator to evaluate companies. The importance of this indicator is essential during this period (WACC being used as the discount rate for cash flows), considering the need to (1) re-evaluate the companies, both for reconfiguring the restructuring plans and for preparing the companies for possible takeovers and to (2) revise the investment plans [34,56,59,66,67,68,69,70,71,72,73,74,75,76,77,78,79,80]. The companies in the field of energy face, on the one hand, technical challenges that are generated by the need to produce energy from renewable sources and, on the other hand, difficulties induced by political risk [59,68,69,70,71,72,73,74,75,76]. In addition, the social and environmental performances of the energy companies are increasingly followed by the portfolio investors; they appreciate the entities that are interested in promoting the principles of sustainable development in their activity and that publish relevant information in the social responsibility reports that give sustainability [51,81,82,83,84].

3. Methods

We formulated the following research question of whether the nature of WACC is universal. The hypothesis is as follows: The WACC is not universal because it depends on the interest rate, which is not stable. To answer the research question, we used a systematic literature review, including bibliometrics. We analyzed the publications using the Web of Science research databases and then selected (while taking into account the research problems) the publications listed in this article’s bibliography. The literature review showed that little is known about whether the same WACC formula can be used in any country, regardless of economic stability. To resolve the research problem, we also analyzed the central banks’ data on a 10-year history of interest-rate changes in Poland, Brazil, Tanzania, Nigeria, the USA, the United Kingdom, countries in the Euro Zone, and Japan. Our analysis of the interest rates in countries with stable loan rates over the long term and countries where interest rates are volatile was because the interest rate is a significant variable in the WACC formula.

4. Results and Discussion

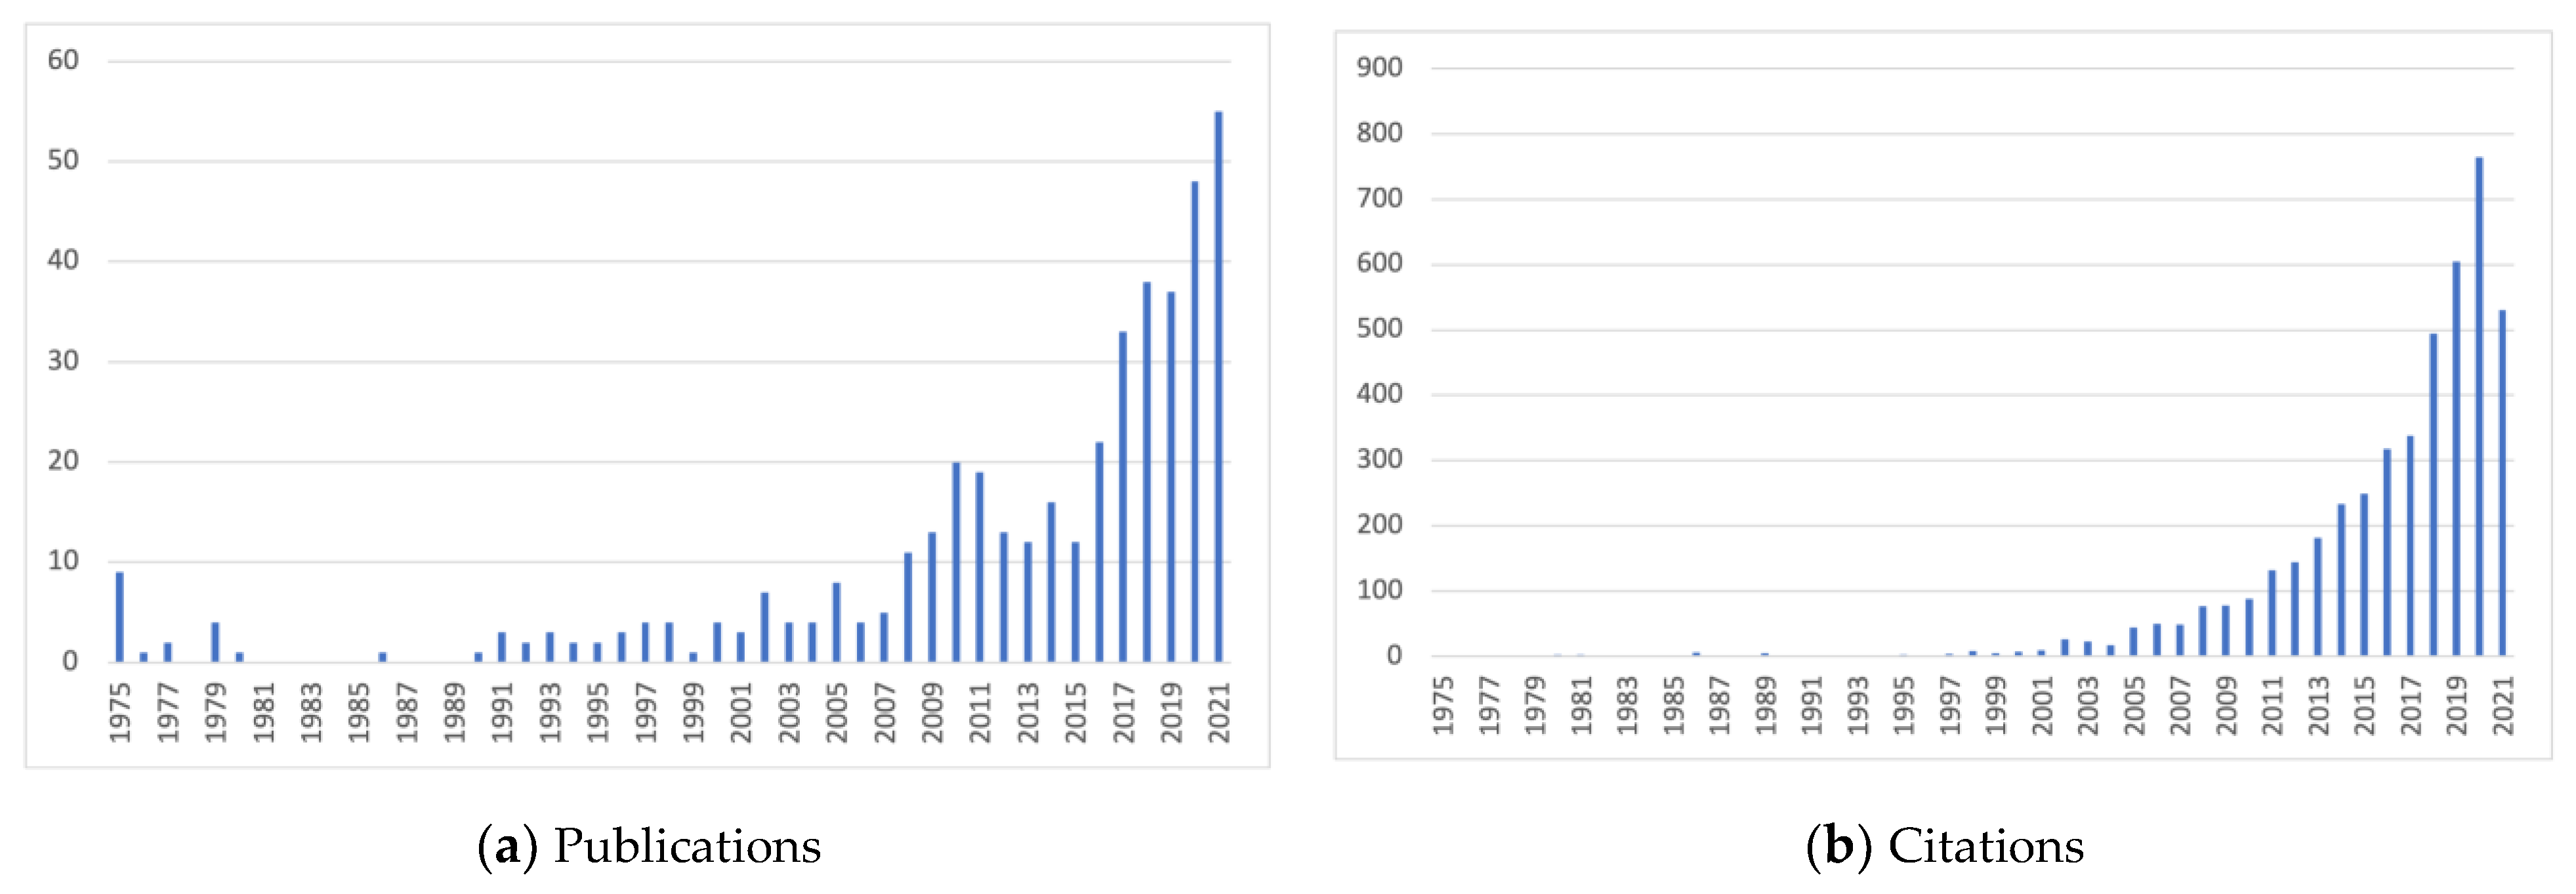
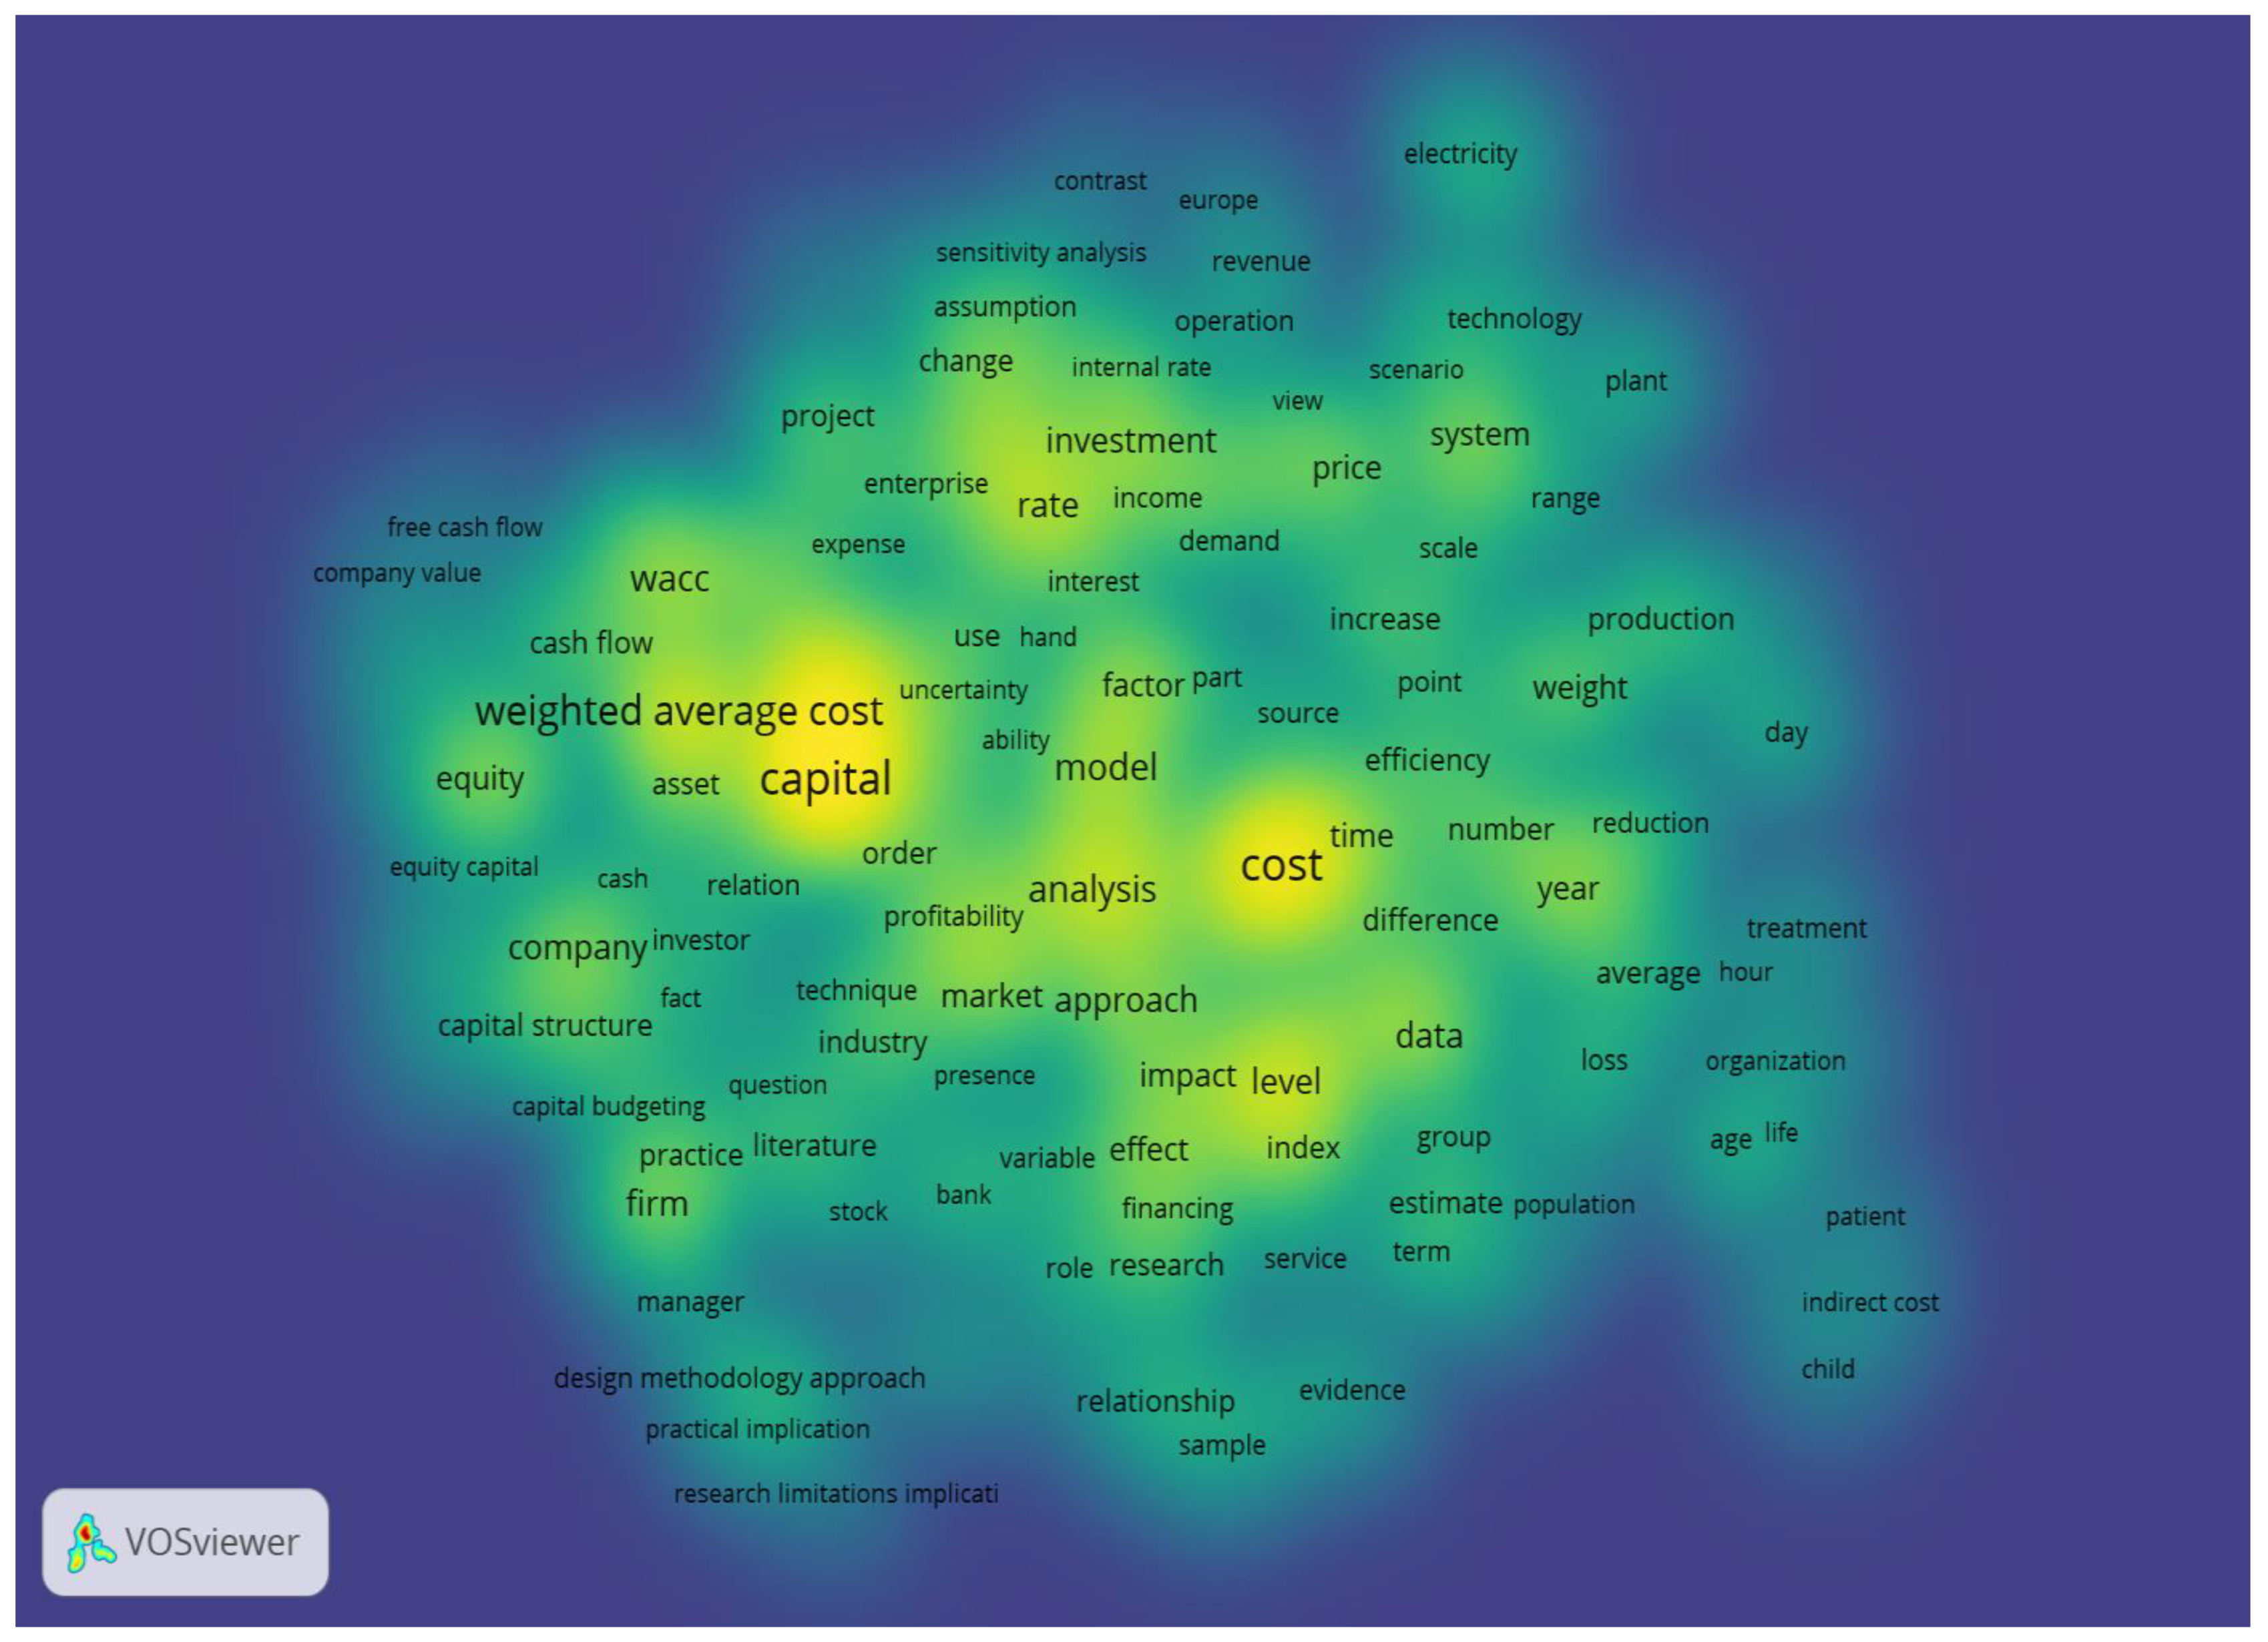
4.1. Bibliomegric Analysis

In order to set up a comprehensive image of the literature regarding the weighted average cost of capital, we used bibliometric analysis. All published papers in the Web of Science database, related to the association of the words “weighted”, “average”, “cost”, and “capital”, were investigated, the result being represented by 455 articles from 1975 until 2021.
As can be observed in Figure 1, the number of published papers and the number of citations in the area highlight a progression; there is a jump in the number of publications after 2007 and a huge rise in the number of citations after 2011. Thus, there has been growing interest in the field in the last decade, when taking into account the number of publications and citations.
Analyzing the countries’ interest in the “weighted average cost of capital” topic, the most influential countries in the field are the countries in cluster 5 (Figure 2). The top 5 of the most productive countries, according to previous publications are: the USA, Australia, the UK, China, and Russia, registering the most intense participation in the field, with 117, 30, 30, and 23, respectively—23 papers.
Using the information offered by the 455 scientific articles, we identified the most common words. The co-occurrence of the authors’ words used in the publications was investigated, taking into account a frequency of at least 20 times, using a correlation degree that was greater than 0.5, and a threshold of 0.5. The analysis has been conducted using the Vos program.
In Figure 3, the most encountered words in this field are presented, apart from the keywords used: investment, rate, price, demand, impact, market, approach, and analysis.
The combinations of the most encountered words were explored by the most correlated words within the selection of articles. The empirical results (Figure 4) highlighted 5 significant clusters of the most common combinations in the selected studies in the field. These are:
Cluster 1: activity, age, cost, data, decision maker, difference, efficiency, estimate, evidence, facility, indirect cost, information, child, family, life, loss, management, organization, performance, population, productivity, quality, service, treatment, work, and world;
Cluster 2: account, advantage, application, asset, calculation, cash flow, choice, development, discount rate, enterprise, estimation, evaluation, interest, investment decision, leverage, market value, opportunity, process, and tool;
Cluster 3: assumption, capital cost, demand, electricity, implementation, income, interest rate, investment, levelized cost, net present value, reduction, sensitivity analysis, and uncertainty;
Cluster 4: addition, analysis, bank, benefit, capital budgeting, capital market, decision, effect, financing, firm, government, impact, improvement, investor, limitation, manager, risk, strategy, and technique;
Cluster 5: ability, amount, average cost, business, capital structure, company, debt, economic value, equity, expense, growth, influence, loan, profitability, and ratio.

4.2. Analysis of Central Bank Interest Rates

The cost of debt is related to the interest rate, which is not stable:
R d = r   ( 1 T c )
When calculating the cost of capital in a bank loan, the overall interest rate should be considered. This depends on the interest rate on loans set by central banks as part of the state’s monetary policy, the investment risk assessment made by the bank, the borrower’s financial condition, commitment fee, and bank margin. Thus, one needs to consider many variables related to the bank loan. In the following discussion, we ignore the above endogenous and exogenous factors and focus on the interest rate that is determined by the central banks. We assume that investments should only be accepted if the positive net present value (NPV) is at discount rates [84].
An analysis of central bank interest rates showed that interest rate fluctuations in many countries were significant, due to the scale and frequency of the changes. The interest rates illustrate this problem in four selected countries with unstable discount rate policies (January 2010 to December 2021), compared to interest rates in the US, the Euro Zone, the UK, and Japan (see below (Figure 5 and Figure 6)).
An analysis of the statistics provided confirms the high volatility of interest rates in the selected countries (Poland, Brazil, Nigeria, and Tanzania). In the case of Poland, the base interest rate (reference interest rate) fluctuated from 0.1% (29 May 2020) to 4.75% (10 May 2012) over the reference period (11 years). The difference was 4.65%. Moreover, the interest rate fluctuated upward and downward. After a period of growth, the monetary authorities lowered the reference rate (in November 2012) to 4.5% and lowered it to 0.1% (in May 2020), then raised it significantly again. Currently (March 2022), it is at 3.5%. It should be noted that the discount rates and the WIBOR (Warsaw Interbank Offer Rate) are the interest rates to which the bank’s interest rates, which form the basis for calculating the cost of capital, are indexed [85,86,87,88,89,90,91].
In the other countries selected for this research, Brazil, Nigeria, and Tanzania, this is even more pronounced due to the volatility of interest rates. For example, during the period considered, the parameter “r” variation was between the lowest and highest values of 11% in Tanzania and 12% in Brazil. Also noteworthy is the frequency of changes during the year (e.g., the Brazilian interest rate changed nine times in 2013).
The examination of these data shows the high stability of the interest rate over time. The development of the interest rate is small. The example of the UK can illustrate the level of interest rate volatility in established market economies. Between 2010 and 2021, changes in the interest rate in the UK economy were in the range of 0.25%. The level of change in discount rates can be considered very small and insignificant in terms of indexing bank interest rates. In the USA, the Euro Zone, and Japan, the interest rate changes did not exceed three percentage points from 2010 to 2021. For example, in the case of Japan, the difference between the interest rate level in 2010 and 2021 is 0.10%. This situation means that there is virtually no problem with interest rate volatility. In the USA, the base rate level was subject to fluctuations (2.25%). However, it is noticeable that the base rate level has persisted for extended periods (2010–2016) at the same level. During that period, the interest rate was 0.25%. An analysis of data in the Euro Zone indicates high interest rate stability over time. Changes in the interest rate level are symbolic, and, in the period from 2015 to 2021, they did not exceed 0.1%.
Comparing the conditions described above with the situation of unstable economies, the following conclusions can be formulated:
(a)
interest rates change in each economy, irrespective of the degree of stabilization;
(b)
the difference between interest rate volatility, however, is the frequency and the extent of changes;
(c)
assuming a proportional change in bank lending rates, compared with the evolution of base rates, the objectivity of the financial calculations in favor of the stabilized economies is very low.
Assuming that the parameter “r” would be subject to change each year, the equation should take the following form:
r = ( 1 + r 1 ) + ( 1 + r 1 ) ( 1 + r 2 ) + + ( 1 + r 1 ) ( 1 + r 2 ) ( 1 + r n )
where: r1, r2rn represent the discount rates for particular years.
Rd = ((1 + r_1) + (1 + r_1)(1 + r_2) +⋯+ (1 + r_1)(1 + r_2)…(1 + r_n))(1 − T)
R d = ( ( 1 + r 11 t 11 360 ) ( 1 + r 12 t 12 360 )   ( 1 + r 1 m t 1 m 360 ) + ( 1 + r 11 t 11 360 ) ( 1 + r 12 t 12 360 )   ( 1 + r 1 m t 1 m 360 ) ( 1 + r 21 t 21 360 ) ( 1 + r 22 t 22 360 )   ( 1 + r 2 m t 2 m 360 ) + ( 1 + r 11 t 11 360 ) ( 1 + r 12 t 12 360 )   ( 1 + r 1 m t 1 m 360 ) ( 1 + r 21 t 21 360 ) ( 1 + r 22 t 22 360 )   ( 1 + r 2 m t 2 m 360 )   ( 1 + r n m t n m 360 ) ) ×   ( 1 T )
where:
r11r1m—annual interest rates (1 to m) in the first year of the investment,
t11t1m—the duration of the annual interest rate term during the first year of the investment, expressed in days (the sum of t11 to equals 360 days),
r21r2m—annual interest rates (1 to m) in the second calculation year of the investment to be made,
t21t2m—the duration of the annual interest rate term in the second calculation year, expressed in days (the sum of t21 to t2m equals 360 days),
rn1rnm—annual interest rates (1 to m) in the nth year of the investment,
tn1tnm—the duration of the annual interest rate term in the calculation year of the nth investment to be made (the sum of tn1 to tnm, equal to 360 days).
The new calculation of the cost of debt should be used in the calculation of WACC and should better reflect the economic environment. Finally, here is the new WACC formula:
W A C C   =   ( E V   x   R e ) + ( D v   x   ( ( 1 + r 11 t 11 360 ) ( 1 + r 12 t 12 360 )   ( 1 + r 1 m t 1 m 360 ) + ( 1 + r 11 t 11 360 ) ( 1 + r 12 t 12 360 )     ( 1 + r 1 m t 1 m 360 ) ( 1 + r 21 t 21 360 ) ( 1 + r 22 t 22 360 )   ( 1 + r 2 m t 2 m 360 ) + ( 1 + r 11 t 11 360 ) ( 1 + r 12 t 12 360 )   ( 1 + r 1 m t 1 m 360 ) ( 1 + r 21 t 21 360 ) ( 1 + r 22 t 22 360 )   ( 1 + r 2 m t 2 m 360 )   ( 1 + r n m t n m 360 ) ) ×   ( 1 T c ) )

5. Conclusions

The WACC is a fundamental concept in corporate finance. We agree with Farber, Gillet, and Szafarz [23] that its formula, based on the average cost of capital coming from both the equity and the debt, looks simple but it is quite a challenging issue. The cost of capital can be seen as an opportunity cost and must be at least equal to the profitability of the alternative opportunities that have been given up. The choice of a financing source is determined both by its cost and by the company’s financial structure. The firm aims to achieve an optimal structure of capital, for which the weighted average capital cost is minimal. In determining the WACC, certain aspects must be taken into account. When determining the weights for the WACC calculation, a choice must be made between either the book values or the market values of the funding sources. Market values would be more appropriate, as WACC can be used as a discount rate in evaluating investment projects, which is in line with the way funding sources are formed. Book values can be constant over time, instead of the more frequently changing market values. Using nominal rates based on actual inflation rates should also be considered, wherein cash flows are expressed in nominal terms. Another issue is identifying and estimating the impact of the costs of using a funding source. For example, increasing the share of equity may reduce the cost of debt. On the contrary, a high degree of indebtedness will lead to the request by the shareholders of a premium for the additional risk induced by the increase in indebtedness, perceived as a negative point to the company’s detriment.
The last two years of the COVID-19 crisis have made theorists and practitioners aware or instead reminded them that the stability of the world economy, measured by the relative stability of interest rates, is fragile. Therefore, the practical implementation of the WACC formula yields several questions linked to the distinction between stable and unstable markets. This paper addresses interest rate valuation and establishes a general formula that remains valid for any market. The newly redefined WACC can be a valuable tool in business planning from such a perspective. The COVID-19 crisis has generated major turbulence in the financial markets, this increase in volatility being felt both by portfolio investors and by financial institutions and companies. The financial decisions of the energy companies had to be reconsidered in terms of the instability of the sales, the uncertainty regarding the collection of receivables, and the increase in the interest rate. The investment plans have been reconfigured both from the perspective of the need to recalculate the WACC to stop certain investment projects or to direct the available funds toward other investments. The re-evaluation of companies has become necessary in the context of intensifying the process of taking over companies, which is natural in times of crisis because it increases the number of companies that can be bought at low prices. Therefore, the COVID-19 crisis has led not only to the metamorphosis of the world but has also necessitated a reconsideration of the financial instruments that are used for the evaluation of companies, investment projects, and access to funds on the financial market.
As with any research, this study also has some limitations. The business reality includes many factors related to culture and behavioral factors. In addition, there is a need to study WACC usage in all African and Latin countries, where unstable markets differ from one to another. Therefore, the generalizations of this paper in such complex situations seem to be premature. As a future research direction, the authors consider studying the impact of non-financial reporting on this financial indicator. Considering the need for the involvement of companies in promoting sustainable development, more and more economic agents focus on WACC, which is a vital factor in determining the relative cost of low versus high carbon sources.

Author Contributions

Conceptualization, Z.D.; methodology, Z.D.; validation, Z.D., G.D., M.P. and S.A.A.; writing—original draft preparation, Z.D.; writing—review and editing, Z.D., G.D., M.P. and S.A.A.; visualization, Z.D., G.D., M.P. and S.A.A., supervision, Z.D.; project administration, Z.D. All authors have read and agreed to the published version of the manuscript.

Funding

This research received no external funding.

Institutional Review Board Statement

Not applicable.

Informed Consent Statement

Not applicable.

Data Availability Statement

Not applicable.

Conflicts of Interest

The authors declare no conflict of interest.

References

  1. Dobrowolski, Z. Why some countries win and others loose from the COVID-19 pandemic? Navigating the uncertainty. Eur. Res. Stud. J. 2021, 24, 1217–1226. [Google Scholar] [CrossRef]
  2. Chrysafis, K.A.; Papadopoulos, B.K. Decision Making for Project Appraisal in Uncertain Environments: A Fuzzy-Possibilistic Approach of the Expanded NPV Method. Symmetry 2020, 13, 27. [Google Scholar] [CrossRef]
  3. Akkaya, B.; Jermsittiparsert, K.; Abid Malik, M.; Kocyigit, Y. Emerging Trends in and Strategies for Industry 4.0 During and Beyond Covid-19; De Gruyter: Berlin, Germany, 2021; p. 167. [Google Scholar]
  4. Akkaya, B.; Gunsel, A.; Yikilmaz, I. Digital Management Towards Society 5.0: A Review of the Framework for Kurt Lewin Theory During COVID-19 Pandemic. In Emerging Challenges, Solutions, and Best Practices for Digital Enterprise Transformation; IGI Global: Hershey, PA, USA, 2021; pp. 20–137. [Google Scholar]
  5. Khalatur, S.; Velychko, L.; Pavlenko, O.; Karamushka, O.; Huba, M. A model for analyzing the financial stability of banks in the VUCA-world conditions. Banks Bank Syst. 2021, 16, 182–194. [Google Scholar] [CrossRef]
  6. Nurdiani, T.W. Integrating Marketing and Finance to Increase Company Performance in Vuca World: A Case Study on Banking State-Owned Enterprise in Indonesia (MANDIRI, BRI, BTN, BNI). Eur. J. Bus. Innov. Res. 2021, 9, 27–32. [Google Scholar]
  7. Modigliani, F.; Miller, M.H. The cost of capital, corporation finance and the theory of investment. Am. Econ. Rev. 1958, 48, 261–297. [Google Scholar]
  8. Modigliani, F.; Miller, M.H. Corporate income taxes and the cost of capital: A correction. Am. Econ. Rev. 1963, 53, 433–443. [Google Scholar]
  9. Miller, M.H.; Modigliani, F. Some estimates of the cost of capital to the electric utility industry, 1954–1957. Am. Econ. Rev. 1966, 56, 333–391. [Google Scholar]
  10. Dragotă, V.; Braşoveanu, M.L.O.; Dragotă, I.M. Management Financiar; Editura Economică: Bucharest, Romania, 2012. [Google Scholar]
  11. Brusov, P.; Filatova, T.; Orehova, N.; Brusov, P.; Brusova, N. From Modigliani–Miller to general theory of capital cost and capital structure of the company. Res. J. Econ. Bus. ICT 2011, 2, 16–21. [Google Scholar]
  12. Tannous, K.; Le, T.P.V. The impact of ownership structure on capital structure decision: Empirical evidence from Vietnamese listed firms. In Proceedings of the 27th Australasian Finance and Banking Conference, Shangri-la Hotel, Sydney, Australia, 16–18 December 2014. [Google Scholar]
  13. Brusov, P.; Filatova, T.; Orekhova, N.; Eskindarov, M. New Mechanism of Formation of the Company’s Optimal Capital Structure, Different from Suggested by Trade-Off Theory. In Modern Corporate Finance, Investments and Taxation; Springer: Cham, Switzerland, 2015; pp. 73–92. [Google Scholar]
  14. Le, T.P.V.; Tannous, K. Ownership Structure and Capital Structure: A Study of Vietnamese Listed Firms. Aust. Econ. Pap. 2016, 55, 319–344. [Google Scholar] [CrossRef]
  15. Topyan, K. Levered-Beta and Cost of Capital Sensitivities: An Experimental Investigation in Capital Structure. J. Risk Financ. Manag. 2021, 14, 152. [Google Scholar] [CrossRef]
  16. Drozdowski, G. Economic Calculus Qua an Instrument to Support Sustainable Development under Increasing Risk. J. Risk Financ. Manag. 2021, 14, 15. [Google Scholar] [CrossRef]
  17. Dobrowolski, Z.; Drozdowski, G.; Dobrowolska, M.; Sobon, J.; Sobon, D. Economic Calculus and Weak Signals: Prevention Against Foggy Bottom. Eur. Res. Stud. J. 2021, 24, 165–174. [Google Scholar] [CrossRef]
  18. Dobrowolski, Z.; Drozdowski, G. Does the Net Present Value as a Financial Metric Fit Investment in Green Energy Security? Energies 2022, 15, 353. [Google Scholar] [CrossRef]
  19. Dobrowolski, Z.; Drozdowski, G.; Panait, M.; Babczuk, A. Can the Economic Value Added Be Used as the Universal Financial Metric? Sustainability 2022, 14, 2967. [Google Scholar] [CrossRef]
  20. Filatova, T.; Brusov, P.; Orekhova, N. Impact of Advance Payments of Tax on Profit on Effectiveness of Investments. Mathematics 2022, 10, 666. [Google Scholar] [CrossRef]
  21. Leland, H.E. Corporate debt value, bond covenants, and optimal capital structure. J. Financ. 1994, 49, 1213–1252. [Google Scholar] [CrossRef]
  22. Arnold, T.; Crack, T.F. Using the WACC to Value Real Options. Financ. Anal. J. 2004, 60, 78–82. [Google Scholar] [CrossRef]
  23. Farber, A.; Gillet, R.L.; Szafarz, A.A. General Formula for the WACC. Int. J. Bus. 2006, 11, 212–218. [Google Scholar]
  24. Fernandez, P. A General Formula for the WACC: A Comment. Int. J. Bus. 2007, 12, 1–5. [Google Scholar]
  25. Fernandez, P. The value of tax shields is NOT equal to the present value of tax shields. J. Financ. Econ. 2004, 73, 145–165. [Google Scholar] [CrossRef]
  26. Fernández, P. WACC: Definition, Misconceptions, and Errors. Bus. Valuat. Rev. 2010, 29, 138–144. [Google Scholar] [CrossRef]
  27. Mian, M.A.; Velez-Pareja, I. Applicability of the Classic WACC Concept in Practice. Lat. Am. Bus. Rev. 2008, 8, 19–40. [Google Scholar] [CrossRef]
  28. Koziol, C. A simple correction of the WACC discount rate for default risk and bankruptcy costs. Rev. Quant. Financ. Account. 2014, 42, 653–666. [Google Scholar] [CrossRef]
  29. Magni, C.A. Investment, financing and the role of ROA and WACC in value creation. Eur. J. Oper. Res. 2015, 244, 855–866. [Google Scholar] [CrossRef]
  30. Krüger, P.; Landier, A.; Thesmar, D. The WACC Fallacy: The Real Effects of Using a Unique Discount Rate. J. Financ. 2015, 70, 1253–1285. [Google Scholar] [CrossRef]
  31. Frank, M.Z.; Shen, T. Investment and the weighted average cost of capital. J. Financ. Econ. 2016, 119, 300–315. [Google Scholar] [CrossRef]
  32. Vartiainen, E.; Masson, G.; Breyer, C.; Moser, D.; Román Medina, E. Impact of weighted average cost of capital, capital expenditure, and other parameters on future utility-scale PV levelised cost of electricity. Prog. Photovolt. Res. Appl. 2020, 28, 439–453. [Google Scholar] [CrossRef] [Green Version]
  33. Pavel, Z. The Impact of Cash Flows and Weighted Average Cost of Capital to Enterprise Value in the Oil and Gas Sector. J. Rev. Glob. Econ. 2018, 7, 138–145. [Google Scholar] [CrossRef]
  34. Ortiz, H. Political Imaginaries of the Weighted Average Cost of Capital: A Conceptual Analysis. Valuat. Stud. 2021, 8, 5–36. [Google Scholar] [CrossRef]
  35. Morrone, D.; Schena, R.; Conte, D.; Bussoli, C.; Russo, A. Between saying and doing, in the end there is the cost of capital: Evidence from the energy sector. Bus. Strat. Environ. 2022, 31, 390–402. [Google Scholar] [CrossRef]
  36. Miles, J.A.; Ezzell, J.R. The weighted average cost of capital, perfect capital markets, and project life: A clarification. J. Financ. Quant. Anal. 1980, 15, 719–730. [Google Scholar] [CrossRef]
  37. Harris, R.S.; Pringle, J.J. Risk-Adjusted Discount Rates-Extensions from the Average-Risk Case. J. Financ. Res. 1985, 8, 237–244. [Google Scholar] [CrossRef]
  38. Sharfman, M.P.; Fernando, C.S. Environmental risk management and the cost of capital. Strategy Manag. J. 2008, 29, 569–592. [Google Scholar] [CrossRef]
  39. Miller, R.A. The weighted average cost of capital is not quite right. Q. Rev. Econ. Financ. 2009, 49, 128–138. [Google Scholar] [CrossRef]
  40. Myers, S.C. Capital Structure. J. Econ. Perspect. 2001, 15, 81–102. [Google Scholar] [CrossRef]
  41. Gahlon, J.M.; Gentry, J.A. On the Relationship between Systematic Risk and the Degrees of Operating and Financial Leverage. Financ. Manag. 1982, 11, 15. [Google Scholar] [CrossRef]
  42. Wnuczak, P. Zastosowanie ekonomicznej wartości dodanej (EVA) w procesie optymalizacji struktury kapitału przedsiębiorstwa. Zesz. Nauk. Uniw. Szczec. 2011, 640, 505–516. [Google Scholar]
  43. Harris, M.; Raviv, A. The Theory of Capital Structure. J. Financ. 1991, 46, 297–355. [Google Scholar] [CrossRef]
  44. Siminica, M.; Cristea, M.; Sichigea, M.; Noja, G.G.; Anghel, I. Well-Governed Sustainability and Financial Performance: A New Integrative Approach. Sustainability 2019, 11, 4562. [Google Scholar] [CrossRef]
  45. Siminica, M.; Motoi, A.G.; Dumitru, A. Financial Management as Component of Tactical Management. Pol. J. Manag. Stud. 2017, 15, 206–217. [Google Scholar] [CrossRef]
  46. Jain, M.; Sharma, G.D.; Srivastava, M. Can Sustainable Investment Yield Better Financial Returns: A Comparative Study of ESG Indices and MSCI Indices. Risks 2019, 7, 15. [Google Scholar] [CrossRef]
  47. Khan, S.A.; Yu, Z.; Panait, M.; Janjua, L.R.; Shah, A. (Eds.) Global Corporate Social Responsibility Initiatives for Reluctant Businesses; IGI Global: Hershey, PA, USA, 2021. [Google Scholar] [CrossRef]
  48. Jankalová, M.; Kurotová, J. Sustainability Assessment Using Economic Value Added. Sustainability 2019, 12, 318. [Google Scholar] [CrossRef]
  49. Atan, R.; Alam, M.M.; Said, J.; Zamri, M. The impacts of environmental, social, and governance factors on firm performance: Panel study of Malaysian companies. Manag. Environ. Qual. Int. J. 2018, 29, 182–194,. [Google Scholar] [CrossRef]
  50. Gjergji, R.; Vena, L.; Sciascia, S.; Cortesi, A. The effects of environmental, social and governance disclosure on the cost of capital in small and medium enterprises: The role of family business status. Bus. Strat. Environ. 2021, 30, 683–693. [Google Scholar] [CrossRef]
  51. Mariani, M.; Pizzutilo, F.; Caragnano, A.; Zito, M. Does it pay to be environmentally responsible? Investigating the effect on the weighted average cost of capital. Corp. Soc. Responsib. Environ. Manag. 2021, 28, 1854–1869. [Google Scholar] [CrossRef]
  52. Felix, P.; Mirela, P.; Vasile, A.J.; Iza, G. Non-financial Performance of Energy Companies Listed on the Bucharest Stock Exchange and Relevance for Stakeholders. In Digitalization and Big Data for Resilience and Economic Intelligence; Springer: Cham, Switzerland, 2022; pp. 183–201. [Google Scholar] [CrossRef]
  53. Zhang, G.; Han, J.; Pan, Z.; Huang, H. Economic policy uncertainty and capital structure choice: Evidence from China. Econ. Syst. 2015, 39, 439–457. [Google Scholar] [CrossRef] [Green Version]
  54. Drobetz, W.; El Ghoul, S.; Guedhami, O.; Janzen, M. Policy uncertainty, investment, and the cost of capital. J. Financ. Stab. 2018, 39, 28–45. [Google Scholar] [CrossRef]
  55. Pham, A.V. Political risk and cost of equity: The mediating role of political connections. J. Corp. Financ. 2019, 56, 64–87. [Google Scholar] [CrossRef]
  56. Xu, Z. Economic policy uncertainty, cost of capital, and corporate innovation. J. Bank. Financ. 2020, 111, 105698. [Google Scholar] [CrossRef]
  57. Paudyal, K.; Thapa, C.; Koirala, S.; Aldhawyan, S. Economic policy uncertainty and cross-border mergers and acquisitions. J. Financ. Stab. 2021, 56, 100926. [Google Scholar] [CrossRef]
  58. Tabot Lious, N.A.; Cecilio, H.G.; Felix, P.G. Capital structure determinants: Evidence from Spanish listed firms. Corp. Ownersh. Control 2016, 13, 506–519. [Google Scholar] [CrossRef]
  59. Enríquez-Díaz, J.; Castro-Santos, L.; Puime-Guillén, F. (Eds.) Financial Management and Risk Analysis Strategies for Business Sustainability; IGI Global: Hershey, PA, USA, 2021. [Google Scholar]
  60. Reiter, K.L.; Wheeler, J.R.C.; Smith, D.G. Liquidity Constraints on Hospital Investments when Credit Markets are Tight. J. Health Care Financ. 2008, 35, 24–33. [Google Scholar]
  61. Holcomb, A.J.; Smith, D.G. Hospital capital budgeting during a public health crisis. J. Health Care Financ. 2020, 46, 23–35. [Google Scholar]
  62. Rizvi, S.K.A.; Yarovaya, L.; Mirza, N.; Naqvi, B. The impact of COVID-19 on the valuations of non-financial European firms. Heliyon 2022, 8, e09486. [Google Scholar] [CrossRef] [PubMed]
  63. Morrison, E.; Okie, A.; Leonhardt, K. Valuing Firms in a World of Pandemic-Induced Bankruptcies. Annalisys Group, Laws 360. Available online: https://www.analysisgroup.com/globalassets/insights/publishing/2020_valuing_firms_in_world_of_pandemic_bankruptcies.pdf (accessed on 2 April 2022).
  64. Liu, Y. Valuation of Walt Disney Company under Influence of COVID-19. In Proceedings of the 2nd International Conference on the Frontiers of Innovative Economics and Management (FIEM 2021), Suzhou, China, 21–22 August 2021; pp. 139–146. [Google Scholar]
  65. Muir, B. The Discount Rate in Business Valuations during the COVID-19 Pandemic. Baltim. Bus. Rev. A Md. J. 2021, 31. Available online: https://www.cfasociety.org/baltimore/Documents/Muir.pdf (accessed on 12 April 2022).
  66. Setiawan, G.E.; Sumirat, E. Stock Valuation of Indonesia Pharmaceutical Company with COVID-19 Vaccination Development Prospects Amidst Pandemic Situation (Case Study of PT. Kalbe Farma, Tbk.). Eur. J. Bus. Manag. Res. 2021, 6, 127–131. [Google Scholar] [CrossRef]
  67. Ikeda, N.; Inoue, K.; Yamasa, T. How COVID-19 Affects Corporate Investment Plans in the US and Japan. J. Behav. Econ. Financ. 2020, 13, S8–S11. [Google Scholar]
  68. Kaczmarek, T.; Perez, K.; Demir, E.; Zaremba, A. How to survive a pandemic: The corporate resiliency of travel and leisure companies to the COVID-19 outbreak. Tour. Manag. 2021, 84, 104281. [Google Scholar] [CrossRef]
  69. Fernández-González, R.; Pérez-Pérez, M.I.; Pérez-Vas, R. Real options for a small company in a context of market concentration: A case study of investment in a turbot farming plant in Spain. Mar. Policy 2021, 134, 104828. [Google Scholar] [CrossRef]
  70. Franc-Dąbrowska, J.; Mądra-Sawicka, M.; Milewska, A. Energy Sector Risk and Cost of Capital Assessment—Companies and Investors Perspective. Energies 2021, 14, 1613. [Google Scholar] [CrossRef]
  71. Olleik, M.; Hamie, H.; Auer, H. Using Natural Gas Resources to De-Risk Renewable Energy Investments in Lower-Income Countries. Energies 2022, 15, 1651. [Google Scholar] [CrossRef]
  72. Prabatha, T.; Hewage, K.; Sadiq, R. An Energy Performance Contract Optimization Approach to Meet the Competing Stakeholder Expectations under Uncertainty: A Canadian Case Study. Sustainability 2022, 14, 4334. [Google Scholar] [CrossRef]
  73. Pavlovic, N.; Ignjatovic, D.; Subaranovic, T. Possibility of Using Wind and Solar Sources for Electric Power Generation on Serbian Opencast Coal Mines. Mater. Proc. 2021, 5, 50. [Google Scholar] [CrossRef]
  74. Fernández-González, R.; Puime-Guillén, F.; Vila-Biglieri, J.E. Environmental strategy and the petroleum industry: A sustainability balanced scorecard approach. J. Pet. Explor. Prod. Technol. 2022, 11, 1–12. [Google Scholar] [CrossRef]
  75. Castro-Santos, L.; Bento, A.R.; Guedes Soares, C. The Economic Feasibility of Floating Offshore Wave Energy Farms in the North of Spain. Energies 2020, 13, 806. [Google Scholar] [CrossRef]
  76. Coelho Junior, L.M.; Fonseca, A.J.; Castro, R.; Mello, J.C.; Santos, V.H.; Pinheiro, R.B.; Sousa, W.L.; Santos Júnior, E.P.; Ramos, D.S. Empirical Evidence of the Cost of Capital under Risk Conditions for Thermoelectric Power Plants in Brazil. Energies 2022, 15, 4313. [Google Scholar] [CrossRef]
  77. Castro-Santos, L.; Silva, D.; Bento, A.R.; Salvação, N.; Guedes Soares, C. Economic feasibility of wave energy farms in Portugal. Energies 2018, 11, 3149. [Google Scholar] [CrossRef]
  78. Kopecky, K.J.; Li, Z.; Sugrue, T.F.; Tucker, A.L. Revisiting M&M with Taxes: An Alternative Equilibrating Process. Int. J. Financ. Stud. 2018, 6, 10. [Google Scholar] [CrossRef]
  79. Barrientos, J.H. Regionalized discount rate to evaluate renewable energy projects in Colombia. Int. J. Energy Econ. Policy 2020, 10, 670216917. [Google Scholar]
  80. Saługa, P.W.; Kamiński, J. The cost of equity in the energy sector. Polit. Energ. 2018, 21, 81–96. [Google Scholar] [CrossRef]
  81. Evdokimova, M.; Kuzubov, S. Non-Financial Reporting and the Cost of Capital in BRICS Countries; Paper No. WP BRP 83/FE/2021; Higher School of Economics: Moscow, Russia, 2021. [Google Scholar]
  82. Ahmetshina, A.; Vagizova, V.; Kaspina, R. The Use of Management Accounting Information in Non-financial Reporting and Interaction with Stakeholders of Public Companies. In The Impact of Globalization on International Finance and Accounting; Springer: Cham, Switzerland, 2018; pp. 433–439. [Google Scholar] [CrossRef]
  83. Madra-Sawicka, M. Differences in the cost of capital: The case of food companies from emerging and developed european economies. Acta Sci. Pol. Oecon. 2020, 19, 49–56. [Google Scholar] [CrossRef]
  84. NBP. Podstawowe Stopy Procentowe NBP w Latach 1998–2020. 2021. Available online: www.nbp.pl/home.aspx?f=/dzienne/stopy_archiwum.htm (accessed on 23 August 2021).
  85. Japan Interest Rate. 2021. Available online: www.tradingeconomics.com/japan/interest-rate (accessed on 12 March 2021).
  86. United Kingdom Interest Rate. 2021. Available online: www.tradingeconomics.com/united-kingdom/interest-rate (accessed on 4 March 2021).
  87. Romania Interest Rate. 2021. Available online: https://tradingeconomics.com/romania/interest-rate (accessed on 6 August 2021).
  88. Euro Area Interest Rate. 2021. Available online: www.tradingeconomics.com/euro-area/interest-rate (accessed on 11 August 2021).
  89. The United States Fed Funds Rate. 2021. Available online: https://tradingeconomics.com/united-states/interest-rate (accessed on 10 March 2021).
  90. Hungary Interest Rate. 2021. Available online: www.tradingeconomics.com/hungary/interest-rate (accessed on 3 July 2021).
  91. Croatia Overnight Credit Rate. 2021. Available online: www.tradingeconomics.com/croatia/interest-rate (accessed on 21 July 2021).
Figure 1. Dynamics on (a) publications and (b) citations in the field. Source: Authors’ selection from the WoS database, based on selected words and using Excel.
Energies 15 06655 g001
Figure 2. Country analysis. Source: Authors’ selection from the WoS database, based on selected words, using the Tableau program.
Energies 15 06655 g002
Figure 3. Most common words in the field. Source: Authors’ selection from the WoS database, based on selected words, using the VOS program.
Energies 15 06655 g003
Figure 4. Most common words and the word network in terms of scientific publications’ content. Source: Authors’ selection from the WoS database, based on selected words, using the VOS program.
Energies 15 06655 g004
Figure 5. The level of the base rate (%) in the years 2010–2021. Source [78,79,80,81,82,83,84,85].
Energies 15 06655 g005
Figure 6. Changes in the base rate (%) in the years 2010–2021. Source [78,79,80,81,82,83,84,85].
Energies 15 06655 g006
Publisher’s Note: MDPI stays neutral with regard to jurisdictional claims in published maps and institutional affiliations.

