Article

An Empirical Investigation of Ecological Footprint Using Nuclear Energy, Industrialization, Fossil Fuels and Foreign Direct Investment

by
Muhammad Usman
1,
Atif Jahanger
2,
Muhammad Sohail Amjad Makhdum
3,
Magdalena Radulescu
4,5,*,
Daniel Balsalobre-Lorente
6,7,* and
Elena Jianu
8
1
Institute for Region and Urban-Rural Development, Center for Industrial Development and Regional Competitiveness, Wuhan University, Wuhan 430072, China
2
School of Economics, Hainan University, Haikou 570228, China
3
Department of Economics, Government College University, Faisalabad 38000, Pakistan
4
Department of Finance, Accounting and Economics, University of Pitesti, 110040 Pitesti, Romania
5
Institute for Doctoral and Post-Doctoral Studies, University “Lucian Blaga” Sibiu, Bd. Victoriei, No. 10, 550024 Sibiu, Romania
6
Department of Political Economy and Public Finance, Economic and Business Statistics and Economic Policy, University of Castilla La-Mancha, 13001 Ciudad Real, Spain
7
Department of Applied Economics, University of Alicante, 03690 Alicante, Spain
8
Department of Management and Business Administration, University of Pitesti, 110040 Pitesti, Romania
*
Authors to whom correspondence should be addressed.
Energies 2022, 15(17), 6442; https://doi.org/10.3390/en15176442
Submission received: 16 July 2022 / Revised: 25 August 2022 / Accepted: 31 August 2022 / Published: 3 September 2022

Abstract

:
The G-7 economies comprise a few of the global, mainly economically developed countries. On the other hand, in conjunction with these high economic development performances, the ecological behaviors in G-7 anions have concurrently provoked to elevate deep apprehensions among the stakeholders. Therefore, the present research aims to empirically investigate the environmental influences of nuclear energy, industrialization, fossil fuel energy, and foreign direct investment (FDI) in the G-7 nations between 1991 and 2018. After checking the cross-sectional dependency, this study employed the first-generation ((full modified ordinary least square (FMOLS), dynamic ordinary least square (DOLS)) and second-generation (Driscoll and Kraay (D-K), feasible generalized least square (FGLS)) approaches for robust and reliable findings. The findings explore that nuclear energy production is ineffective in curbing the figure of ecological footprints in the long-run. Moreover, the industrialization process and fossil fuel energy consumption reduce environmental quality in the G-7 economies. More to the point, the empirical findings recommend that these nations can renovate their industrial production procedures in an eco-friendly behavior they can experience an unsoiled deployment of the energy transition. Similarly, the FDI also degrades environmental eminence in the long-run. This validates the pollution haven hypothesis in the G-7 countries. Based on these results, this study suggests the G-7 nations should reduce the production of nuclear energy levels, the transition from fossil fuels to renewable energy production in the industrial sector, reduce fossil fuel-based foreign investment, and assimilate ecological welfare strategies within their development planning.

1. Introduction

One of humanity’s biggest problems today is anthropogenic carbon dioxide (CO2) emissions. Environmental pollution, ecological disruptions, global warming, and climate change are all results of human activities that emit CO2. Most nations have recognized the detrimental effects of increasing atmospheric CO2 levels and are taking action to prepare for dangers and extreme weather-related climate change [
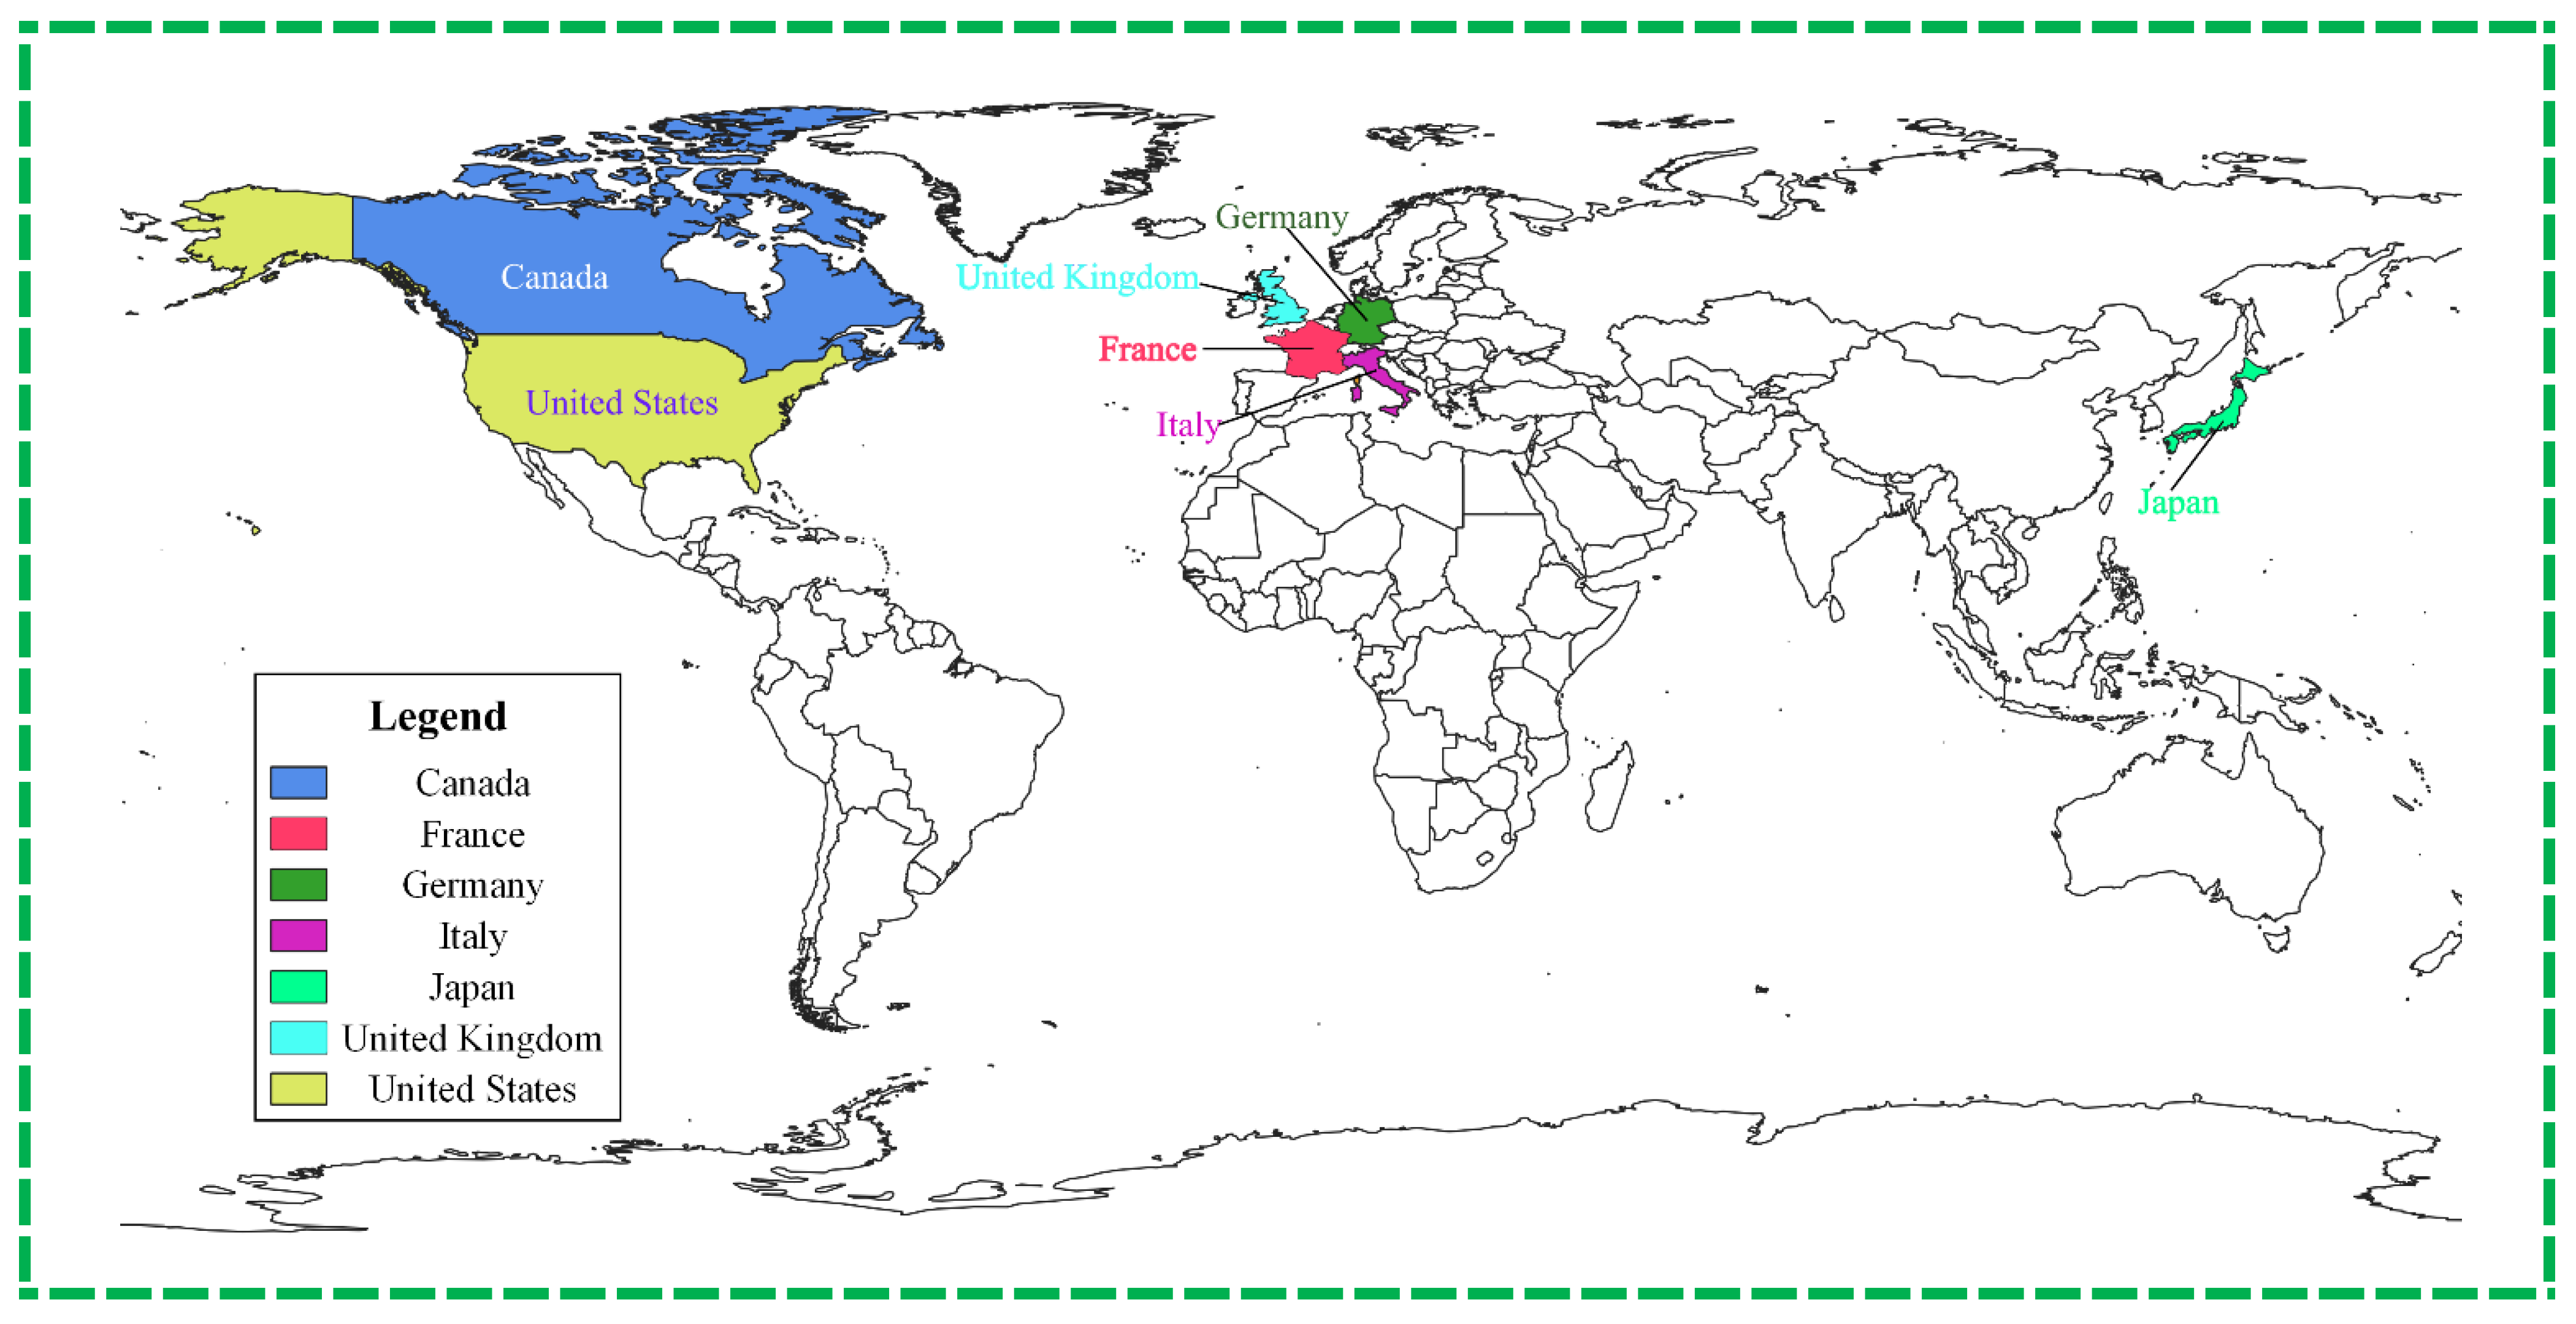
1]. More than 60% of the world’s net wealth and approximately 50% of its GDP are held by G-7 nations: the United Kingdom, France, The United States, Canada, Italy, Japan, and Germany [2]. This wealth could be traced to the rise in industrialization and technological advancement. Industrialization is crucial for sustained growth in any economy. These require enormous energy use, which without exception facilitates pollutant emission, igniting some policy concerns about the environment and economy [3]. Within the last two decades, countries worldwide, predominantly industrialized, have made specific advancements in technology, innovations, human capital development, and productive sectors to attain sustainable economic growth. However, the emergence of industrialization, technological progress, and economic growth has posed severe concerns to the world, leading to climate change and global warming [4,5]. Furthermore, nuclear energy consumption is generally considered another type of non-renewable energy source. Even though nuclear power itself is an imperative source of alternative and renewable energy; however, the materials utilized in nuclear power plants are non-renewable energy based. This energy is unconfined in the course of nuclear fission; somewhere in the procedure, the atom splits the nucleus. In this regard, the substance frequently utilized in nuclear energy plants is the constituent of uranium. As such, uranium is observed as a non-renewable source. Besides, nuclear energy plants have various other influences on the atmosphere, with the exception of the waste they generate. Uranium mining is not absolute in an eco-friendly and carbon-free process, and it further unfastens pits enduring after mining, which is unsafe and hazardous for everyone. Consequently, this procedure leads to pollution in close proximity to water sources, erosion, affecting crops and plants; furthermore, it harshly distresses miners and their common physical condition owing to the increased exposure to radiation at some point in processing and extraction.
Industrialization, globalization, and economic development are the resultant effects of rising pollutant emission levels, such as CO2 and greenhouse gas (GHG) emissions, amongst others within the atmosphere [6]. While considering the growth of industries, especially among the top ten industrialized countries with their level of technology innovation, the energy sources used for the industrial process are regarded as severe policy issues for pollutant emission [7]. Adedoyin et al. [8] and Acheampong [9] identified climate change and global warming as the “two evils” that have threatened the existence and survival of humans in recent times. However, the primary source of climate change and global warming has been linked to pollutant emissions, raising international concerns about reducing pollution emissions through programs and policies [10]. Acheampong [9] opines that over 5% of the GDP’s global contribution is a pollutant emission effect. If no action is taken, it will climb to 20% of global GDP, causing further environmental damage.
The rising use of fossil fuel energy resources as essential inputs necessary for extending the size of production of products and services for both domestic and international markets can be linked to their contribution to carbon emissions [11]. The choice that puts the majority of policymakers in a quandary is around the trade-off between economic growth and a sustainable environment [12]. These have led to a paradigm shift from fossil fuel to renewable sources as a pollution-reducing and environmentally benign option [13]. Renewable energy adoption amongst G-7 countries will cause negligible environmental deterioration and is the most effective way to counteract global warming [14]. One of the energy sources that stand out in this context is nuclear energy, whose role in preserving the environment’s quality has not been shown. There has been discussion of the benefits and setbacks of using nuclear energy. According to proponents, nuclear energy can be used to lessen reliance on foreign energy sources. Recent studies have shown that nuclear energy is less detrimental to carbon emissions than fossil fuel sources. In the first stand, some studies have agreed that nuclear energy plays a significant role in pollution minimization compared to renewable energy [15,16]. In the second research stand, some scholars have claimed that nuclear energy use is deteriorating the environment [17].
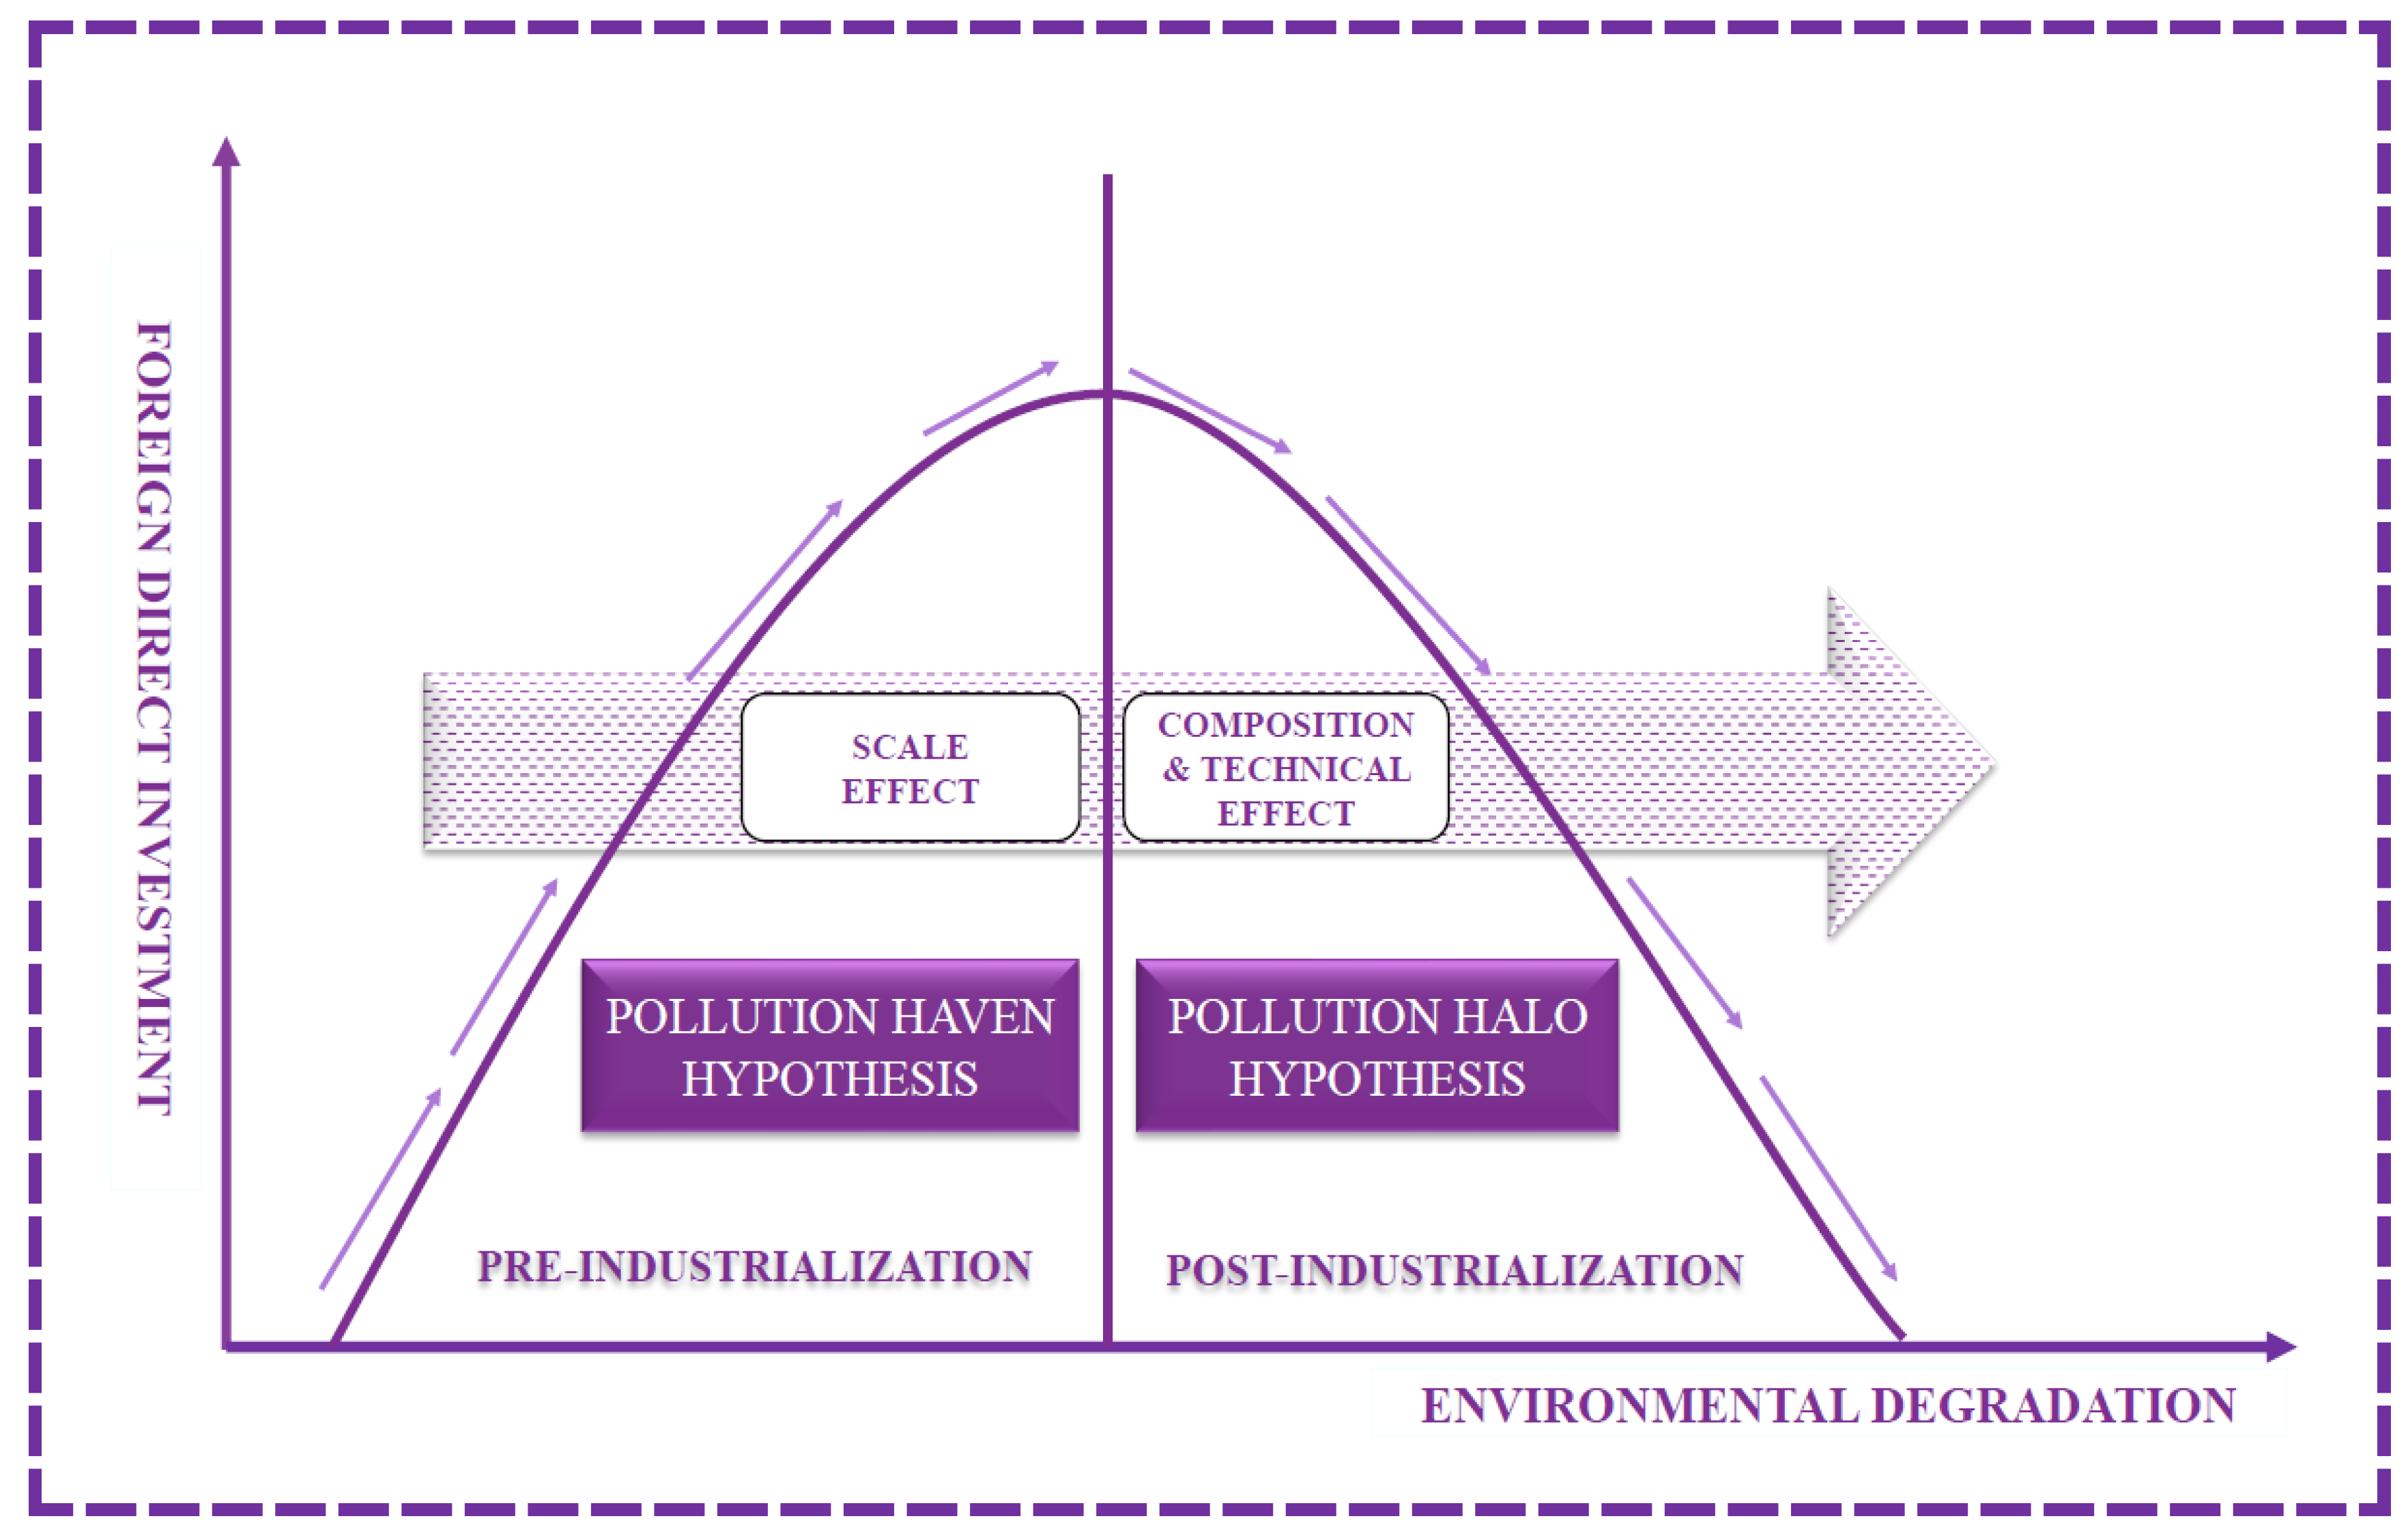
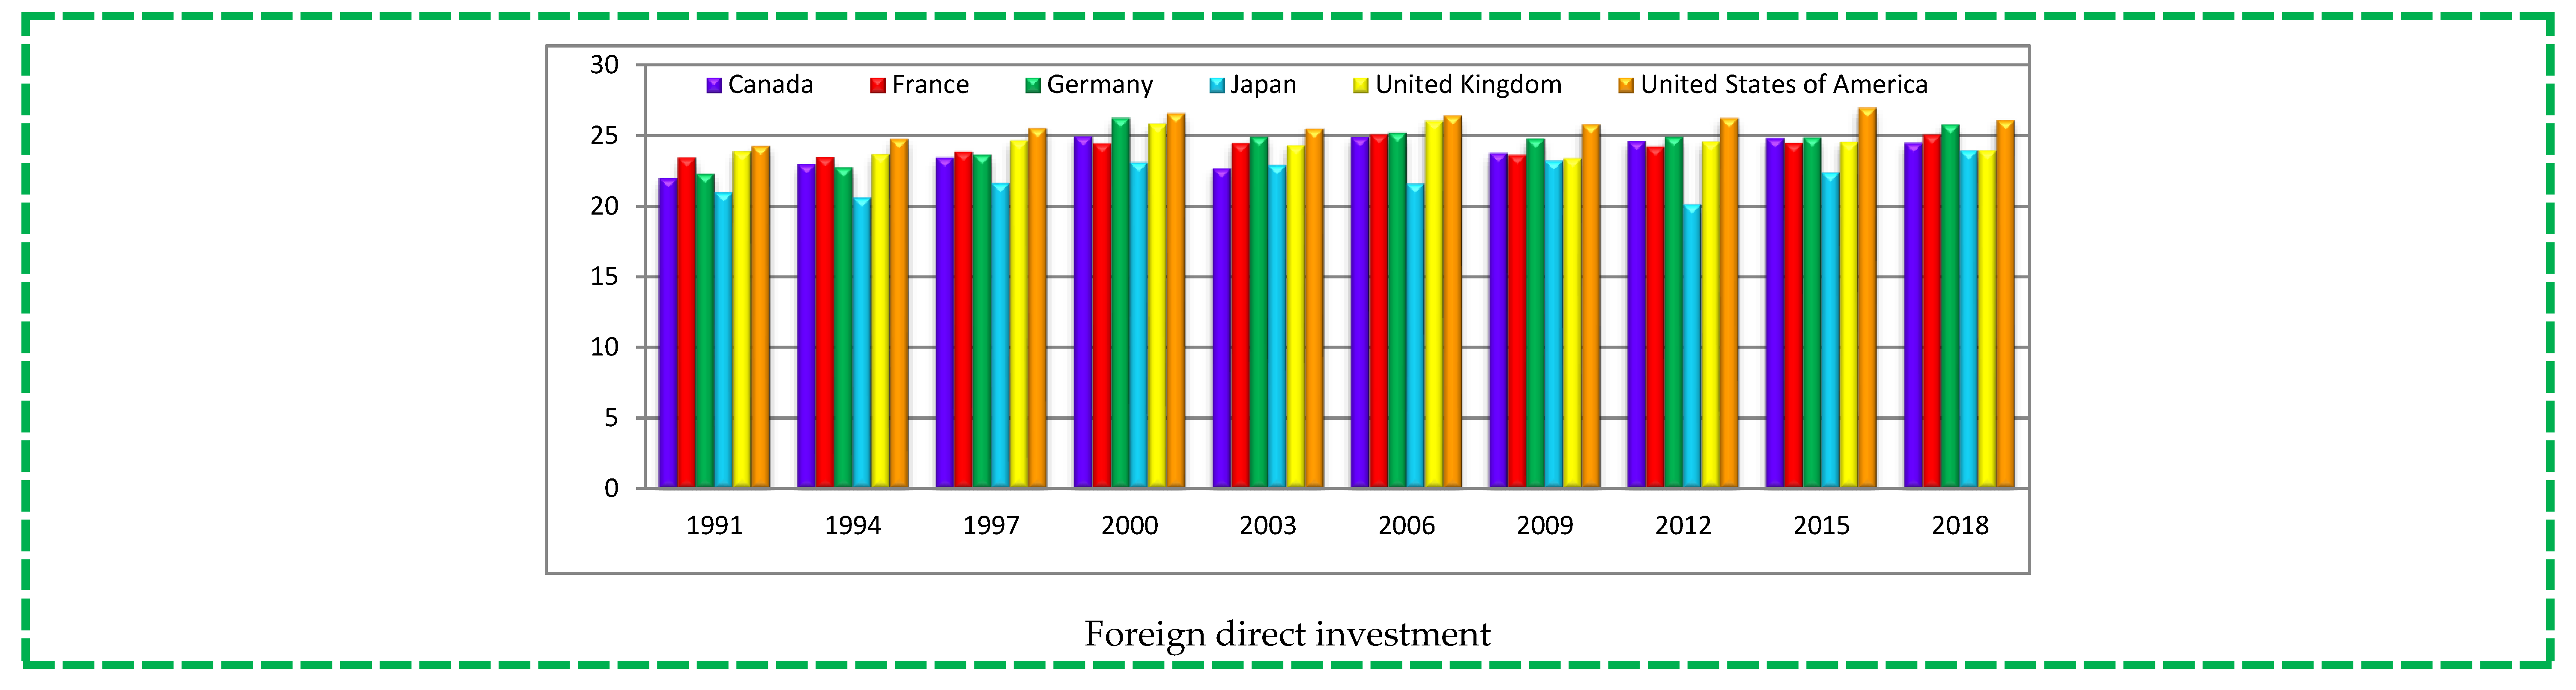
Foreign direct investment significantly impacts the growth of developed economies, such as the G7, much as increased industrialization. Given its favorable effects on the provision of financial resources, technology spillovers, the development of human capital, research and development, international trade integration, market expansion, and economies of scale, among other things, FDI has been considered a key driver of economic growth among others [18]. The pollution haven and halo hypothesis can be considered after recognizing foreign direct investment as a driving force for environmental damage. According to the pollution haven hypothesis, foreign nations may benefit from the severity of environmental rules and regulations in host nations by shifting heavy (dirty) industries to these nations through foreign direct investment, enhancing environmental contamination [4]. On the other hand, the pollution halo hypothesis claims that the production structure of these international firms is generally based on eco-friendly technologies [19,20]. Figure 1 displays the typical inverted U-shaped association between FDI and environmental contamination, reflecting pollution halo and haven hypotheses.
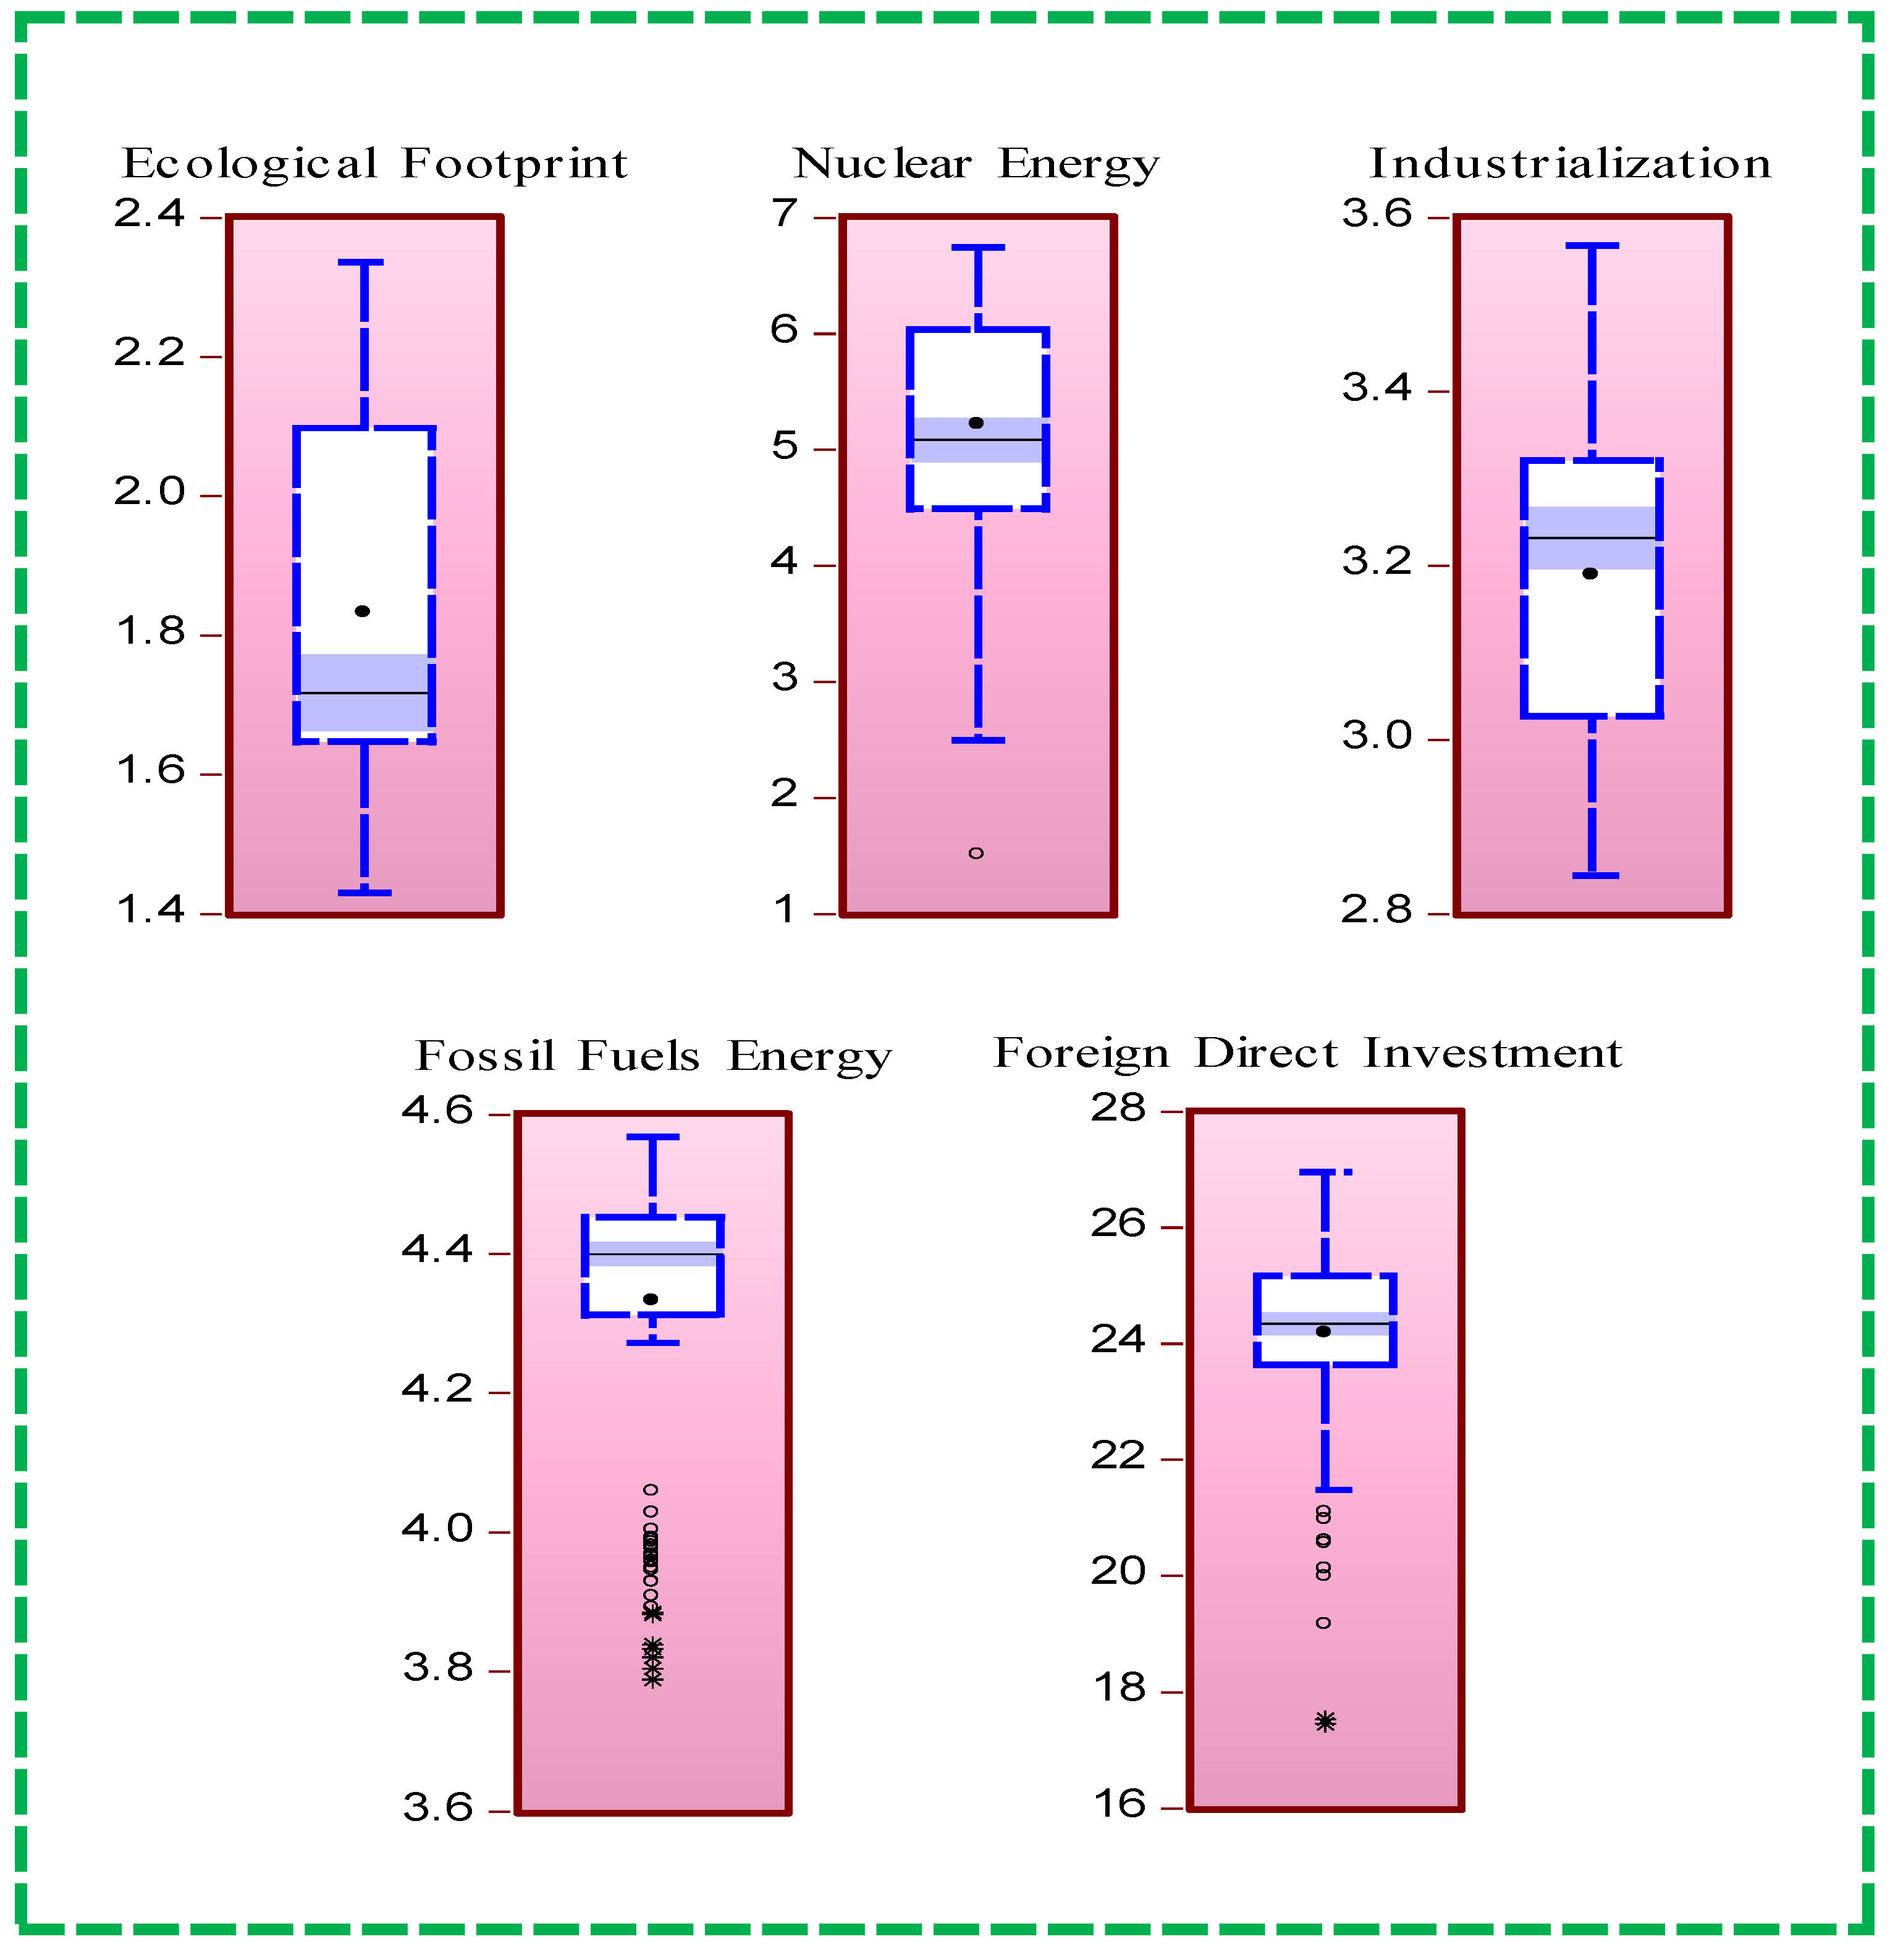
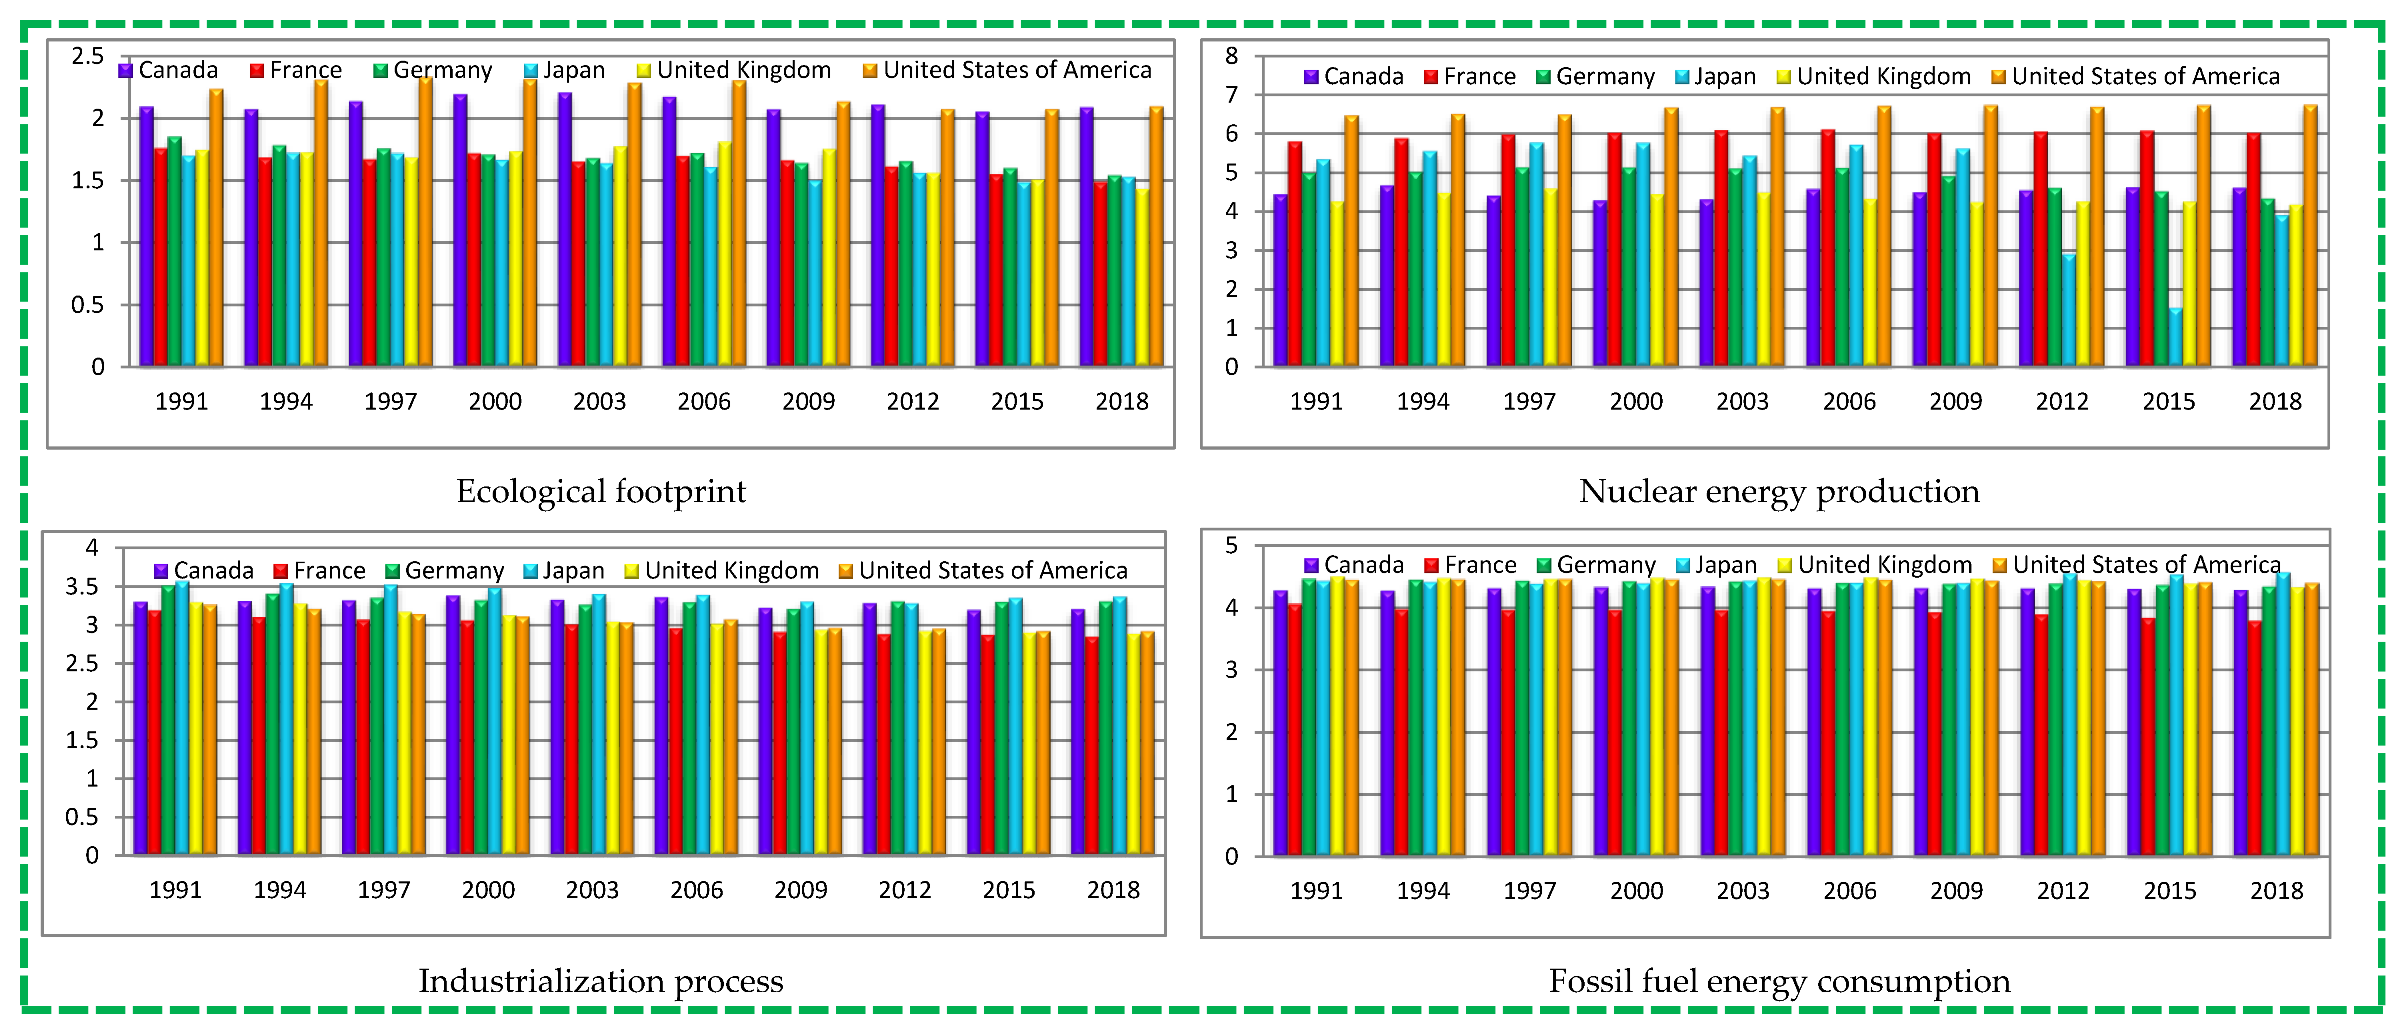
The ecological footprint measures anthropogenic actions on the ocean, crop land, carbon footprint, grazing land, forest products, and built-up land, calculated in hectares of land worldwide (gha). The ecological footprint has been used in recent studies to gauge the impact of human activity on the environment. Over time, linking fossil fuel energy and ecological footprints have generated enormous debates [22,23,24]. Where several productive activities in the economy bring economic growth as industrialization and foreign investment, which encourages fossil fuel extraction and its consumption and further worsens the environment by increasing its ecological footprint [25].
This study investigates the role of industrialization, foreign direct investment, nuclear energy and fossil fuel in the G-7 countries. Four reasons motivated the choice of the G-7 countries. First, in terms of the economy, the G-7 accounts for approximately 57% of the world’s gross domestic product (GDP) [26]. Second, the G-7 countries’ overall energy usage accounts for almost 42% of global energy consumption. Third, the Group of Seven has committed to supporting environmentally friendly technology and lowering waste created during the past 20 years through its annual conference [27]. As a result, the G-7 countries have recorded a sizeable portion of global investments in research and development (R & D) and industrialization [28]. Fourth, despite the progress toward achieving a green economy, the G-7 countries continue to face grave dangers from environmental pollution [13].
This study represents the first attempt to determine the causal relationship between these variables because there has not been a thorough investigation of the subject that adequately handles entire G-7 nations, while considering other variables, such as industrialization, fossil fuel, nuclear energy, and foreign direct investment, and ecological footprint. The G-7 nations have long been attempting to address the problem of climate change and environmental contamination over the last couple of decades to upsurge their trade volume and sustainable economic growth. Furthermore, the impact of foreign direct investment (FDI) on environmental contamination is also scrutinized; thus, the validity of the pollution haven/halo hypothesis is also estimated. Moreover, complementary estimates from the fully modified ordinary least square (FMOLS), dynamic ordinary least square (DOLS), the Driscoll–Kraay method and feasible generalized least square (FGLS) approaches.
Hereafter, the other sections of this paper are organized into four sections in the following order: the literature review is presented in Section 2, the data information and methodology specification are systematized in Section 3, and Section 4 presents the preliminary analysis, main results, and explanations. Furthermore, Section 5 discusses the empirical finding of this paper and, finally, Section 6 explores the conclusions.

2. Literature Review

The first strand reviews the existing published literature on the nexus between nuclear energy and the environment and has two different arguments. Some scholars have agreed that nuclear energy can help to mitigate environmental damages [15,29,30,31,32]. In the second strand of existing literature, nuclear energy use deteriorates the environment quality evidenced by [17,33]. Some scholars argue that nuclear energy use does not influence the environment [34,35,36]. Meanwhile, industrialization is an extensively used indicator of environmental contamination. Several authors argued that industrialization contributes to pollution [4,37,38]. Several recent studies have scrutinized the association between renewable and nonrenewable energy use and environmental contamination. Many researchers argue that renewable energy mitigates environmental contamination, whereas nonrenewable energy boosts environmental pollution [4,39,40]. Additional, FDI is another vital variable affecting environmental contamination. Nevertheless, the influence of FDI on environmental contamination varies. Some scholars observed that the association between FDI and environmental dilapidation is positive, thus supporting the pollution haven hypothesis [40,41,42]. On the other side, some other researchers found that FDI adversely affects environmental dilapidation because FDI brings in advanced and eco-friendly technology. Based on the Table.1, we are developing the following hypothesis.
The study provides an inclusive review of a list of existing studies, such as the nexus between nuclear energy and the environment, the nexus between industrialization and environment, and the nexus between fossil fuel energy utilization and the environment and nexus between foreign direct investment and environment (as shown in Table 1). Still, none of them have explored industrialization, fossil fuel, nuclear energy, foreign direct investment, and ecological footprint in the pollution haven hypothesis framework, especially in the context of G-7 nations. Hence, the primary purpose of our paper is to curtail the research gap in the extant literature.

3. Data and Methodological Framework

3.1. Data and Descriptive Statistics

In order to explore the long-run influence of nuclear energy production (NEP), industrialization process (IND), fossil fuel energy (FFE), and foreign direct investment (FDI) on the ecological footprint (EFP), the authors use the balanced longitudinal data of the Group of Seven (G-7) nations (e.g., Germany, United States, Italy, France, the United Kingdom, Canada, and Japan) from 1991 to 2018. The authors excluded Italy due to the unavailability of the nuclear energy generation data. The ecological footprint data is measured as global hectares acre per person (Gha per person) gathered from the global footprint network Global Footprint Network (GFPN) [60]. The measurement unit of nuclear energy is terawatt hour (TWh), extracted from British Petroleum (BP) [61]. Industrialization data is taken in the form of industry (including construction), value added (% of GDP), fossil fuel energy indicator is taken as (% of total), and FDI data is measured in the form of FDI net inflows (BoP, current US$). IND, FFE, and FDI data are taken from the World Development Indicator (WDI) [62]. The G-7 nations accounted for approximately 25% of global carbon emissions in 2019 and, to some extent, reduced to 23.2% in 2020 [63]. Consequently, enclosing environmental variations is of greatest significance to their proposals. The explained variable in the current research is EFP; the regressors are NEP, IND, FFE, and FDI. The econometric function of this study is reported in Equation (1) as:
EFP it =   f NEP it ,   IND it ,   FFE it ,   FDI it
However, to acquire a further precise evaluation, all variables are transformed into natural logarithms form. The empirical EFP function is expressed in Equation (2) as:
ln ( EFP it ) = δ 0 + δ 1 ln NEP it + δ 2 ln IND it + δ 3 ln FFE it + δ 4 ln FDI it + μ it
In Equation (2), after natural logarithmic transformation, the ecological footprint, nuclear energy production, industrialization, fossil fuel energy, and foreign direct investment indicate the LEFP, LNEP, LIND, LFFE, and LFDI, respectively. The term δ 0   shows the constant term. The terms δ 1 δ 4 show the coefficients for elasticity to be anticipated in the model, μ shows the error terms, i shows the cross-sections (countries), and t denotes the time period. Figure 2 represents the geographical coverage of G-7 nations.
The descriptive statistics for the selected series are provided in Table 2. Based on the descriptive information statistics, the FDI has the uppermost average value (24.19275), followed by all other variables, while the EFP has the lowest average value (1.832627). The EFP has the lowest median value (1.719978), and the highest median value is related to FDI (24.37685). Furthermore, FDI is vastly volatile, whereas FFE is the slightest volatile. Moreover, all the variables are negatively skewed except EFP. Figure 3 explores the box chart graphical presentation of the selected five variables, and Figure 4 explores the trend analysis of each variable over the selected period from 1991 to 2018.
Table 3 illustrates the correlation analysis of all the selected series that explores the level of ecological footprint positively correlates with all the selected variables LNEP, LIND, LFFE, and LFDI. Moreover, LNEP is adversely interrelated with LIND and LFFE, while positively correlated with LFDI. Furthermore, the LIND series is positively correlated with LFFE and adversely correlated with LFDI. Lastly, LFFE is positively correlated with the LFDI indicator.

3.2. Methodological Framework

3.2.1. Cross-Sectional Dependence Tests

The cross-sectional dependency (CSD) is publicized as confronted in the analysis of panel data assessment. The CSD occurrence in the data might be the boulevard for incompetence and contradiction in investigated coefficient/elasticity. Therefore, such problems may occur owing to different factors, such as standard shocks, latent country-specific indicators, and spatial effects. Therefore, checking the possible CSD amongst the time series is vital because it assists in surmounting contradictory findings and business [45]. For that reason, in the present study, the authors applied the Breusch–Pagan LM, Pesaran scaled LM, bias-corrected scaled LM, and Pesaran CSD tests to detect CSD.

3.2.2. Panel Unit Root Tests

After that, an econometric process is applied to check the panel series’ unit root issue. Specific to the deep-seated interdependence of all economies due to economic, political, and social globalization, first-generation stationary tests are worthless as there are no deliberations for CSD influences, slope heterogeneity, lack of size properties, and over-reject the H0. Such issues are tackled by employing second-generation stationary approaches, for instance, the Cross-sectional Im, Pesaran and Shin (CIPS), and Cross-sectional Augmented Dickey-Fuller (CADF), established by [64]. In Equation (3), the CADF test statistic is expressed as:
Δ X i t = β i + π i x i , t 1 + λ i x ¯ t 1 + δ i Δ x ¯ t + ε i t
Incorporating the one lag value (t − 1) in the findings of Equation (3), Equation (4) is denoted as:
Δ X i t = β i + π i x i , t 1 + λ i x ¯ t 1 + j = 0 p δ i j Δ x ¯ t j + j = 1 p Φ i j Δ x i , t j + ε i t  
where   Δ x i , t j   denote the difference of the average value of the lag level of cross-section i. Furthermore, the CIPS test is reported in Equation (5) as:
C I P S = N 1 i = 1 N π i N , T  
where the term, π i N , T denotes the CADF test, which might be reinstated by the term explored in Equation (6) as:
C I P S = N 1 i = 1 N C A D F i

3.2.3. Panel Cointegration Test

After verifying all selected series’ trend components and integration order, we continued our empirical analysis by detecting the long-run linkages between the selected variables. The recognition of the panel’s long-run association develops among policymakers and scholars owing to its high power. Moreover, the panel cointegration analysis is essential to scrutinize the bidirectional long-run association between non-stationary series [43]. To do this, we applied two-panel cointegration methods from Pedroni and Kao cointegration tests developed by Pedroni [65] and Kao, [66], respectively. Pedroni cointegration test conceded eleven test statistics that tolerate the coefficients of heterogeneous intercepts and trends across all individuals. The functional form of the Pedroni cointegration test is expressed in Equation (7) as:
y i t = θ i + β i m + δ 1 i z 1 i , t + δ 2 i z 2 i , t + δ 3 i z 3 i , t + δ q i z q i , t + μ i , t
where θ i denotes the intercept term, which can fluctuate across cross-sections, m shows the time dimension, and the slope parameters are denoted by   δ 1 i , ,   δ q i . The estimated error term μ i , t should be stationary at the first-order integration for H0 of no cointegration process. To explore and check whether the error term is stationary at I(1), it is imperative to estimate the subsequent ordinary regression for all individual i:
μ i , t = π i μ i , t 1 + μ i , t
Or
μ i , t = π i μ i , t 1 + j = 1 π i λ i , j Δ μ i , t j + ε i , t
Pedroni cointegration test considers two kinds of H1: the heterogeneous alternative hypothesis (group statistics tests or between-dimension) and the homogeneous alternative hypothesis (panel statistics test or within-dimension). In summary, all the Pedroni cointegration test statistics are constructed from the estimated error term. Though, only one test of long-run relationship may not present an accurate picture of reality and also not provide the full information about long-run cointegration association among the variables. In order to overcome this issue, this study applied another cointegration test named as Kao test developed by Kao [66]. This test is also a residual-based μ i , t test. In order to estimate these residuals, the Kao cointegration test adjusts the Augmented Dickey-Fuller (ADF) test in the panel version. Both (Pedroni and Kao) cointegration tests consider the null hypothesis of no long-run cointegration relationship between analyzed time series. In the case of bivariate relationships, the Kao cointegration test expressed the method as follows:
X i , t = Ψ i + θ Z i , t + ε i , t ,   i = 1 ,   2 ,   3 , ,   N ; a n d   t = 1 ,   2 ,   3 , ,   T  
X i , t = X i , t 1 + ν i , t
Z i , t = Z i , t 1 + μ i , t  
where   Ψ i   denotes the fixed effect that fluctuates between the individuals, the slope coefficient is represented by   Ψ , X i , t ,   and   Z i , t   are self-sufficient random strides across all cross-sections. With H0 of no long-run cointegration; as a result, the ADF test statistic is expressed as follows:
A D F = t A D F + 6 N σ ^ ν / 2 σ ^ 0 ν σ ^ 0 ν 2 / 2 σ ^ ν 2 + 3 σ ^ r ν 2   / 10 σ ^ 0 ν 2
where tADF is asymptotically normally distributed with zero mean and constant variance (N~(0,1)) specified by the sequential limit theorem.
The major issue of the Pedroni and Kao cointegration test is that it does not address the cross-sectional issue in the data. This study applies the Westerlund [67] long-run cointegration approach to tackle this issue. This test employs two different test statistics to discover the H1 of the existence of long-run cointegration for the whole group (Gt and Ga) and panel (Pt and Pa) statistics. The Westerlund test ignores the ordinary factor constraint problem. It is deliberated to verify the H0 of no long-run cointegration by assuming whether the error correction term (ECT) in a restricted error correction model is almost equal to zero. The following Equation (14) shows the general cointegration expression, which can be listed as follows:
Δ Z i , t = φ i d t + ϕ i Z i , t 1 λ i X i , t 1 + j = 1 qi π i , j Δ Z i , t j + j = 0 q η i , j Δ X i , t j + ε i , t
where ϕ i denotes the error correction coefficient term (ECT) for each cross-section.
G τ = 1 N i = 1 N λ i S . E .   λ ^ i  
G a = 1 N i = 1 N T λ i λ i 1  
The P τ   and   P a test statistics are applied to examine whether both long-run cointegration relationship prevails in the whole panel, and the mathematical expression can be reported in Equations (17) and (18) as follows:
P τ = λ ^ i S . E .   λ ^ i
P a = T   λ ^

3.2.4. Panel Long-Run Estimates

Further, the current research evaluated the long-run association. In this regard, the authors applied the Driscoll–Kraay standard error approach developed Driscoll–Kraay [68]. This approach is a non-parametric technique for investigating the link among the panel data. Driscoll–Kraay’s method provides a consistent, efficient, and accurate finding that stumbles upon CSD problems [68]. The residuals and mean values are first inspected to check the impact of candidate regressors on EFP. Afterward, the weighted heteroskedasticity and autocorrelation consistent estimator were analyzed, producing standard errors alongside the CSD problem [69]. Consequently, the Driscoll–Kraay standard errors linear model is denoted as:
Y i , t = X i , t λ + μ i , t   for   all   i = 1 , 2 , 3 , N t = 1 , 2 , 3 , T
where t and i show the time-series and cross-sectional units.
This study uses the feasible generalized least squares (FGLS) test to check the robustness of the Driscoll–Kraay method findings. This is owing to the FGLS test’s present long-run elasticity that tackles the problem of CSD [49]. Moreover, this approach performs superior findings when the number of cross-sections is lesser than the time periods (N < T). The FGLS estimator is reported in Equations (20) and (21) as:
Ψ ^ = Z δ ^ 1 Z 1 Z δ ^ 1 M
v a r Ψ ^ = Z δ ^ 1 Z 1
where,   δ ^   holds the robustness about possible CSD, heteroscedasticity, and serial correlation.
Finally, we used the fully modified ordinary least square (FMOLS) and dynamic ordinary least square procedure for robustness analysis. Pedroni [70] introduced these techniques to solve the endogeneity, heteroscedasticity, and serial correlation. Both FMOLS and DOLS model apply to this study because it is robust and assist in deriving consistent, unbiased, and accurate estimates. The mathematical form of the FMOLS approach is presented in Equation (22) following the study of Pedroni [64]:
β ^ F M O L S * = 1 N i = 1 N β ^ F M O L S , i *
where the term β ^ F M O L S , i * shows the FMOLS estimators, and the FMOLS estimator t-statistic is shown in Equation (23) as:
t β ^ F M O L S = N 1 / 2 n = 1 N t β F M O L S , n
where t β ^ F M O L S denotes the t-statistic of the FMOLS estimator.
Furthermore, the DOLS is preferable to the FMOLS method by utilizing the Monte Carlo simulation. The DOLS method can be written in Equation (24) as:
y it = β + λ X it j = N i N 2 Z ij Δ X it + j + μ it
where λ indicates the distribution of the maximum lag length of the OLS estimator.

3.2.5. Panel Causality Test

It is significant to recognize that the flow of causality links from one variable to another when a long-run association prevails between the variables. Depending on possible CSD among variables, the authors employed the Dumitrescu and Hurlin (D–H) non-causality approach developed by Dumitrescu and Hurlin [71]. This approach relies on Wald statistics that assume the nonexistence of causal association among variables. The Dumitrescu and Hurlin test also incorporates the average value of the Wald test statistic of non-causality across G-7 economies. The functional appearance of this D–H causality test is reported in Equation (25) as:
Y i t = θ i + j = 1 J π i j Y i t j + j = 1 J δ i j x i t j + µ i t
where X and Y show the variables and terms δ i j ,   and   π i j   show regression coefficients and the auto-regressive (AR) coefficient parameters, respectively. The H0 of this test is tested in the course of the Wald   ( W N . T H N C ) approach as explored in Equation (26):
W N . T H N C = N 1 i = 1 N W i , T
where H0 and the H1 hypotheses are expressed in Equations (27) and (28) as:
H 0 : θ i = 0   f o r     i  
H 1 :   θ i   0   f o r   a l l   i =   N 1 + 1 ,   2 , 3 , . . N θ i = 0   f o r   a l l   i = 1 ,   2 ,   3 ,   ,   N 1

4. Results and Discussion

4.1. Cross-Sectional Dependence Findings

The present research initiates the empirical analysis by checking the panel’s cross-sectional dependency; the findings are reported in Table 4. In the globalized era, economies are interlinked through trade agreements, financial integration, and sharing boarder. These nations generate economic, social, and financial dependence of nations with each other. As a result, this pushes us to scrutinize the possible CSD in the selected data. The authors can observe that all the candidate series (LEFP, LNEP, LIND, LFFE, and LFDI) are significant at a 1% level, indicating the occurrence of CSD in the data. Consequently, the authors reject the H0 and accept the H1. All CSD tests evidence denotes that the panel investigated is significantly cross-sectionally dependent, and these findings establish the accurateness of the empirical analysis applied in this study.

4.2. Panel Unit Root Findings

This study applies the different panel stationary (first and second-generation) tests to avoid generating biased and spurious regressions. The findings of panel root tests (CADF, CIPS, and IPS) are expressed in Table 5. The conventional IPS test is a first-generation unit root test that does not allow the CSD. The first and second-generation unit root tests are applied because the last column of Table 1 (Pesaran CD) shows the cross-sectional independence in FFE and FDI variables. However, the CADF and CIPS unit root test is appropriate in contrast to conventional unit root approaches because it tackles the cross-sectional dependence and slope heterogeneity between the variables. In this pursuit, Table 5 verified the no unit root of the series at their integration order or first difference, and none of the single variables is stationary at their second difference.

4.3. Panel Cointegration Findings

A panel long-run cointegration test is accomplished for the first integration process of the series by applying the Pedroni cointegration test. Pedroni’s long-run cointegration test determines whether there is a presence of long-run cointegration association or not between these selected variables since they are stationary at levels. Table 6 reveals the outcomes of the Pedroni cointegration test. The finding of this test rejects the null hypothesis of no long-run cointegration significant at a 1% level due to four tests of within-dimension (Panel PP, Panel ADF, Weighted panel PP, and Weighted panel ADF statistics) and two statistics from between-dimensions (i.e., Grouped PP and Grouped ADF statistics) hold them accepting of the alternative hypothesis of cointegration. Therefore, six out of eleven test statistics explored that the series contained a long-run association among the variables.
The second strand of Table 6 explores the findings of the Kao cointegration test for the G-7 panel. This test also confirms that there is a presence of long-run cointegration between the variables significant at a 1% level in BRICS countries.
The Pedroni and Kao tests are inappropriate for several critical matters, for instance, serial correlation, heteroscedasticity, systemic disruptions, and CSD of the economies, whereas Westerlund [67] is a superior approach to cointegration as all of such issues are resolved. The third strand of Table 6 explores the findings of the Westerlund cointegration test for the G-7 panel. Westerlund [67] introduced the cointegration test that covers the aforesaid issues. The results of the Westerlund test confirm the cointegration association among the selected series because the probability values of all test statistics (e.g., Gτ, Ga, Pa) cointegration tests are below the 5% significance level. This verifies to reject the null hypothesis and accept the alternative hypothesis. The findings of all tests explore that LEFP, LNEP, LIND, LFFE, and LFDI are strongly cointegrated.

4.4. Panel Long-Run Elasticity Estimates

In Table 6, the influence of nuclear energy, industrialization, fossil fuel energy, and FDI on ecological footprint has been explored employing D-K, FGLS, FMOLS, and DOLS findings. The outcomes reveal that the approximate four robust models’ statistical significance is quite analogous.
The empirical findings explore that all the candidate regressors are statistically significant and positively impact the figures of ecological footprints in all four specified models at a 1% significance level. All four applied models directly link nuclear energy production with an environmental footprint. More exclusively, for each percent increase in nuclear energy, the environmental footprint is boosted by 0.1109% in D-K, 0.0452% in FGLS, 0.0891% in FMOLS, and 0.0746% in DOLS estimator. This finding is analogous to other earlier literature, such as Ishida [72] for Japan, Sarkodie and Adams [17] for South Africa, Jaforullah and King [73] for the USA, and Mehmood et al. [46] for Pakistan. This positive relationship shows that nuclear energy production reduces the environmental quality in the case of the G-7 countries panel. The reason behind the positive effect of nuclear energy on ecological footprint is that due to technical lack of skill, ability, and various other limitations by the worldwide community, G-7 nations heavily depend on indigenous resources to manage and control nuclear power plants. This concern is more radioactive and harmful environmental toxic waste, which has more irreparable serious influences on the environment and human beings as well [36,46]. Emissions from nuclear power sources can be linked with the emanation of nuclear waste management and radioactive substances (disposal and handling). It comes into view that the influence of nuclear energy deployment on ecological footprint is inferior compared to distinctive nonrenewable energy-based technologies, such as coal, gas, and oil [17,74]. The main ecological concern connected to nuclear energy is the creation of radioactive wastes for instance exhausted (consumed) reactor fuel/energy, uranium mill tailings, and several other radioactive wastes. Such resources/materials are capable to remain dangerous and radioactive to human wellbeing and health for many years. Radioactive wastes and uranium mill tailings are caused to experience special rules and regulations that direct their handling, storage, transportation, and discarding to protect human wellbeing, health, and the environment. Furthermore, it is hypothetical to have processing arrangements and particular infrastructure to tackle nuclear toxic desecrate. The internationally established standards and practices organize this toxic waste for a long-run foundation in dehydrated storage amenities. In storage amenities, nuclear power waste is stored in reinforced cemented concrete and compressed steel serene drums underneath the earth’s surface.
The econometric results also demonstrate industrialization’s positive effect on the long-run ecological footprint. If industrialization development increases by 1%, the ecological footprint will also be boosted by 0.3351% in D-K, 0.2824% in FGLS, 0.2114% in FMOLS, and 0.3538% in DOLS estimator, respectively. For this reason, the industrialization process of G-7 countries reduces the environmental quality by increasing environmental pollution. The empirical outcomes show the significant and positive connection between industrialization and ecological footprint in G-7 economies. It was recommended that G-7 economies decrease the figure of ecological footprint by tackling the elucidation of industrial/manufacturing toxic waste. This will produce the operational costs for the G-7 consortia and raise long-term sustainable economic development. In addition, Usman and Balsalobre-Lorente [4] found that swift enhancement in economic and industrialization growth are two major factors for worsening ecological excellence. In the intervening time, the G-7 economies will transfer numerous contaminated industries to a foreign country, enhancing the environmental pollution levels among the host economies [4,50,51]. In addition, industrialization growth will depreciate the environmental eminence because, during output procedure, such industries release gigantic materials and smokes, by-products, the level that are the major source of atmospheric disaster; carried by the growth of industrialization process. Such by-products enclose hazardous toxic constituents that can demolish the environmental quality in the region. Furthermore, it is observed that many aspects can be proscribed by the industries, such as standard uncooked substance, safety laws, manufacturing, technology, and awareness to mitigate environmental pollution in the atmosphere. Many countries have to tolerate huge losses in labor productivity, production process, and well-being to cope with environmental quality.
The results explore the long-term positive influence of fossil fuel energy on the ecological footprint. Predominantly, if fossil fuel energy deployment boosts by 1%, the ecological footprint will also be increased by 0.3339% in D-K, 0.4096% in FGLS, 0.3473% in FMOLS, and 0.9627% in DOLS estimator respectively. As expected, the finding of fossil fuel energy utilization has a damaging influence on ecological footprint since nonrenewable energy sources are acquired fossil fuels burning that are the major GHGs and other pollution gases sources. Fossil fuel energy sources are unsustainable and finite, and their exhaustive deployment increases environmental pollution and global warming by escalating GHGs emissions. At the same time, alternative and renewables are sustainable, abundant, and profuse, mitigating emission levels.
In fact, there is widespread harmony on the adverse influence of nonrenewable-based power deployment on the atmosphere in the existing literature (Table 1). As a review of the influences of power consumption by sources, it is observed that an increase in cleaner and renewable energy sources in the energy mix reduces the burden on the environment, while boosts in fossil fuel energy use sources in the energy mix that led to environmental pollution for the G-7 countries. The G-7 countries should pay out an extra intention and sufficient efforts to achieve the specified threshold targets. One feasible alternative to continue a path of the schemes and ventures must be to economically sustain scientific foundations, public and private universities, and scholars to put effort into producing energy from alternative and renewable sources at low costs. Additionally, authoritarian strategies must be planned to amplify the public consciousness/awareness of alternative and renewable energy for a clean atmosphere. Bearing in mind the energy-intensive circumstances of G-7 countries, another substitute option is to enlarge energy effectiveness in reducing the ecological footprint and overall pollution level by encouraging energy-efficient technology, which is one of the most crucial factors of green growth for green growth the applied countries [75].
Finally, FDI was also observed to have a constructive influence on the environmental degradation of the G-7 nations. Notably, according to D-K approach, a 1% augmentation in FDI would lead to causing a 0.0548% increase in the ecological footprint in the long-run. Many other rudiments add to the application of foreign investment, for example, propinquity to the subdivision, availability and accessibility to cheaper labor, and a smaller amount of stringent strategies in calculating the mistreatment of foreign country investors make this finding further liable. The major empirical results explored from the all-applied regression analysis verified the subsistence of the pollution haven hypothesis for the panel of G-7 nations in the long-run. This result indicates that the candidate G-7 member countries have feeble ecological policies irrespective of their individual public revenue levels. Accordingly, such negligent atmospheric rules and laws have attracted high-polluting overseas firms to invest their income in G-7 economies; as a result, resulting in further releases of carbon emissions. This provides a prompt that G-7 countries’ economies are enduring emergent economic growth and operations while paying diminutive concentration to the well-being of their environment. This maintained the point of some detractors of FDI, predominantly those apprehensive about the long-run developing country’s viability [76]. The PHH finding is in line with the conclusion observed by Balsalobre-Lorente et al. [55], Jian et al. [77], and Ke et al. [20]. Figure 5 reveals the Actual, Fitted, and Residual plot of ecological footprint function in the long-run.
Finally, the ecological function is re-estimated by employing the FGLS, FMOLS, and DOLS estimators to test for the elasticity estimates robustness. The findings from these robustness analyses are also presented in Table 7. The coefficient sign similarities estimates, even though dissimilar in terms of their more or less magnitudes, institute the coefficient/elasticity estimates robustness crossways the regression approaches employed in the current research. A novel study by Qian et al. [78] provides evidence for more explanation of p-vales, regression models, validation (errors), and statistics.

4.5. Panel Causality Analysis

Testing the causality association employed the panel heterogeneous causality to examine the connection flows between the candidate series. All causality associations (unidirectional, bidirectional, and no causality) findings from the Dumitrescu and Hurlin causality are presented in Table 8. Initially, the D–H non-causality test results strongly offer the bidirectional (two-way) association between LNEP and LEFP, LIND and LEFP, LFDI and LEFP, and between LIND and LNEP, between LIND and LFFE, between LNEP and LFFE and finally, between LIND and LFFE in this study. It is in line with the study by Ramzan et al. [79] for Pakistan, Sadiq et al. [31] for BRICS countries, and in contrast with Usman and Radulescu [45] for top energy-producing countries. In addition, the D–H causality findings are also discovered to have a unidirectional (one-way) association from LEFP to LFFE, from LFDI to LNEP, and from LFDI to LIND. This result is similar to the finding of the unidirectional causality from ecological footprint to fossil fuel energy in BRICS-T countries [75] and the findings of Dogan et al. [80] in Asian economies. In combination with the empirical findings of the long-run estimation regressions, this study also proposed the confirmation of the Granger causality as an evocative part of the fact that a high proportion of alternative and cleaner energy can have some ability to protect the environment in any case over the time for which the study model.
Furthermore, an enhancement in the ecological footprint level has pressure on reliable fossil fuel energy, which is in line with the authors’ evidence. Therefore, the G-7 countries should incessantly augment the figure of renewable energy sources for the sake of ecological protection. Bearing in mind that there is unidirectional causality operating from LEFP to LFFE, the increase in fossil fuel energy harms the environmental quality of the G-7 countries. Generally, the G-7 countries can diminish the total amount of fossil fuel energy use without reducing the real economic growth. Finally, there is no causality relationship between LFFE and LFDI.

5. Discussion and Policy Options

The G-7 countries are fossil-fuel-rich economies; nevertheless, the energy assortment diversification by including clean and alternative energy sources will encourage ecological sustainability and environmental quality, while diminishing their economy’s exposure to price instability. Considering the policy suggestions of the impact of nuclear energy, industrialization, fossil fuel energy, and FDI on environmental degradation, the current study recommends, first, a paradigm transition from fossil fuel-based energy and pollution-intensive industries to a service leaning growth that will affect a structural economic transformation, in consequence, supporting in the diminishing environmental pollution, climate variations, and its impacts. Second, The G-7 country’s policy of transparency and precision might be reviewed within a nuclear social effects investigation; consequently, the communication with the people and other stockholders can be deliberate in terms of participation in area selection, decision making, design criterion, nuclear awareness, and satisfaction, and so forth. Third, investment in cleaner energy has a viable advantage against nuclear and fossil fuel energy. For clean energy equipment to be eye-catching, it requires consumption policies that equally include renewable energy, technological expansion (innovations, technological advancement, research, and development, etc.), industry growth (e.g., affordable cost, higher performance, and superior quality), and also market progression (easily accessible and available markets). Fourth, the nuclear power position in renewable energy sources ought to be preserved. Nevertheless, it must be highlighted that constructive assistance of a power source to ecological eminence does not necessitate reliance on this source of energy. Each country of the G-7 panel should put into practice a resource diversification policy by assessing the efficiency of its power resources. As a replacement for being reliant on a solitary power source, governments and policymakers of G-7 countries should take action to diminish the environmental costs of all energy/power sources by escalating clean technological investments.
Furthermore, there is a dire requirement for technological development in the industrialization process and energy sectors that install developed technologies, for instance, carbon-free equipment, carbon storage, and capture, among others, in other to endorse energy competence. The permutation of legislation, policies, inspection, and standards associated with the accomplishment of novel technologies and enhanced social consciousness is constructive to limit environmental pollution that has the ability to encourage and advantage domestic countries by avoiding ailment and fatalities in the production process, guaranteeing a country’s environmental stability. The G-7 economies must encourage foreign and local investors to invest in renewable and alternative energy supplies and maintain apparent safety and security measures. Finally, while doing this, the government and all stakeholders must also spotlight endogenous growth of cleaner energy elucidations, with the intention that fossil fuel-based clarifications dependence might be terminated. At the same time, policymakers will promote the creation of new alternative and green jobs, which will construct full deployment of the green output procedures. Furthermore, foreign trade strategies might be redesigned to accommodate the energy revolution, and the foreign trade policies will be intended for increasing ecological excellence, such as the countries will be moved toward cleaner and green trade strategies. The surplus energy can be preserved and sold to other countries with elevated energy demand. By doing so, real revenue might increase. This surplus revenue can be committed to detecting cleaner and other new renewable energy foundations and expanding cleaner and more sophisticated technologies and green energy solutions. In this fashion, G-7 economies might be capable of facilitating accomplishment of the SDGs objectives by 2030.

6. Conclusions

Environmental pollution and global warming are considered one of the most severe issues faced by global economies due to an increase in carbon emissions as a consequence of nonrenewable and many other fossil fuel-based energy deployments. In addition, renewable energy resources’ role in mitigating environmental pollution has been a subject matter enduring concentrated studies in the existing literature. Considering this, the major aim of this research is to scrutinize the influence of nuclear energy production, industrialization, fossil fuel energy use, and FDI on ecological footprints from 1991 to 2018 in the G-7 countries. In view of that, it is one of the most vital issues in the development movement and cross-country cooperation in this era. On the whole, the econometric findings, controlling for cross-sectional dependency issue, explore that a 1% augmentation in the nuclear energy generation and fossil fuel power consumption will increase levels of ecological footprints in the long-run for G-7 economies by approximately 0.1109% and 0.3339%, respectively. Additionally, the industrialization process was also observed to display adverse roles in protecting environmental quality by 0.3351% in the region. Similarly, the empirical evidence shows that FDI also increases the pollution level by 0.0548% in the long-run.
Furthermore, the findings of the D–H causality test discover bidirectional causality between LNEP, LIND, LFDI, with LEFP, LIND and LNEP, between LIND, and LFFE, and between LNEP and LFFE, and finally, between LIND and LFFE in this study. In addition, a unidirectional causality exists from LEFP to LFFE, from LFDI to LNEP, and from LFDI to LIND. As a result, the findings based on the present study enforce some key policy suggestions for the policymakers and central authorities in the G-7 economies and assist these nations in achieving low-ecological footprint growth all the way through the adoption of renewable energy use and carbon-free technologies for a sustainable environment.
The major limitation of this research is the small panel data set dimension applied owing to the unavailability of the relevant variables. Additionally, upcoming studies could widen this research by the ecological influences related to high shares of nuclear energy deployment in the overall energy mix volume of these G-7 economies. The possible research trends can be anticipated to facilitate the G-7 and some other world-polluted energy-intensive countries to ascertain the suitable pathways leading to a sustainable environment, particularly through the renewable energy evolution channel. Moreover, innovative and alternative environmental indicators can also be taken to approximate the functions to test for the results robustness across substitute environmental proxies in the G-7 economies. Besides, future studies could incorporate some other macroeconomic (environmental related) regressors, for instance, (renewable energy, total factor productivity, environmental-related technologies, economic complexity, agricultural productivity, export product diversification, energy innovations, aging factor, and human capital) and a large data set could make upcoming studies more reliable and attractive in tackling the SDGs.

Author Contributions

M.U. conceptualization, methodology, software, formal analysis, investigation, revised draft, writing—original draft; A.J. conceptualization; investigation; M.S.A.M. data curation, revised draft, writing—original draft; M.R. conceptualization, supervision, writing—original draft; D.B.-L. supervision, writing—original draft; E.J. writing—review, editing. All authors have read and agreed to the published version of the manuscript.

Funding

This research received no external funding.

Data Availability Statement

The datasets are available on requests from the corresponding authors. Data can be found at the links specified into the paper.

Conflicts of Interest

The authors declare no conflict of interest.

Abbreviations

ARDL, autoregressive distributed lag; VECM, vector error correction model; NEP, nuclear energy use; GMM, generalized methods of moments; OECD, organization for economic co-operation and development; OBOR, one belt and one road; CS-ARDL, cross-sectional autoregressive distributed lag; NR, natural resources; RENG, renewable energy use; NENG, nonrenewable energy use; OLS, ordinary least square; IND, industrialization; GDP, economic growth; D-K, Driscoll–Kraay; XDEBT, external debt; DCCE, dynamic common correlated effects; HC, human capital; SSA, sub-Saharan Africa; ENG, energy use; CUP-BC, continuously updated bias corrected; EF, ecological footprint; TECH, technology innovation; FMOLS, fully modified ordinary least square; DOLS, dynamic least square; FDI, foreign direct investment; MINT, Mexico, Indonesia, Nigeria, and Turkey; FD, financial development; CUP-FM, continuously updated fully modified; AMG, augmented mean group; CO2, carbon emission; CCEMG, common correlated effects mean group; GLO, globalization; F-GLO, financial globalization; BRICS, Brazil, Russia, India, China, and South Africa; MENA, Middle East and North Africa; PIIGS, Portugal, Italy, Ireland, Greece, and Spain; DARDL, dynamic nonlinear autoregressive distributed lag; PHH, pollution haven hypothesis; PHV, pollution halo hypothesis.

References

  1. Li, B.; Haneklaus, N. Reducing CO2 emissions in G7 countries: The role of clean energy consumption, trade openness and urbanization. Energy Rep. 2022, 8, 704–713. [Google Scholar] [CrossRef]
  2. Qin, L.; Kirikkaleli, D.; Hou, Y.; Miao, X.; Tufail, M. Carbon neutrality target for G7 economies: Examining the role of environmental policy, green innovation and composite risk index. J. Environ. Manag. 2021, 295, 113119. [Google Scholar] [CrossRef]
  3. Eregha, P.B.; Adeleye, B.N.; Ogunrinola, I. Pollutant emissions, energy use and real output in Sub-Saharan Africa (SSA) countries. J. Policy Model. 2021, 44, 64–82. [Google Scholar] [CrossRef]
  4. Usman, M.; Balsalobre-Lorente, D. Environmental concern in the era of industrialization: Can financial development, renewable energy and natural resources alleviate some load? Energy Policy 2022, 162, 112780. [Google Scholar] [CrossRef]
  5. Salari, M.; Javid, R.J.; Noghanibehambari, H. The nexus between CO2 emissions, energy consumption, and economic growth in the U.S. Econ. Anal. Policy 2020, 69, 182–194. [Google Scholar] [CrossRef]
  6. Ahmad, A.; Zhao, Y.; Shahbaz, M.; Bano, S.; Zhang, Z.; Wang, S.; Liu, Y. Carbon emissions, energy consumption and economic growth: An aggregate and disaggregate analysis of the Indian economy. Energy Policy 2016, 96, 131–143. [Google Scholar] [CrossRef]
  7. Ang, J.B. CO2 emissions, energy consumption, and output in France. Energy Policy 2007, 35, 4772–4778. [Google Scholar] [CrossRef]
  8. Adedoyin, F.; Ozturk, I.; Abubakar, I.; Kumeka, T.; Folarin, O.; Bekun, F.V. Structural breaks in CO2 emissions: Are they caused by climate change protests or other factors. ? J. Environ. Manag. 2020, 266, 110628. [Google Scholar] [CrossRef]
  9. Acheampong, A.O. Economic growth, CO2 emissions and energy consumption: What causes what and where? Energy Econ. 2018, 74, 677–692. [Google Scholar] [CrossRef]
  10. Adedoyin, F.F.; Gumede, M.I.; Bekun, F.V.; Etokakpan, M.U.; Balsalobre-Lorente, D. Modelling coal rent, economic growth and CO2 emissions: Does regulatory quality matter in BRICS economies? Sci. Total Environ. 2019, 710, 136284. [Google Scholar] [CrossRef]
  11. Ahmad, M.; Khattak, S.I.; Khan, A.; Rahman, Z.U. Innovation, foreign direct investment (FDI), and the energy–pollution–growth nexus in OECD region: A simultaneous equation modeling approach. Environ. Ecol. Stat. 2020, 27, 203–232. [Google Scholar] [CrossRef]
  12. Ibrahim, R.L.; Ajide, K.B. Trade Facilitation, Institutional Quality, and Sustainable Environment: Renewed Evidence from Sub-Saharan African Countries. J. Afr. Bus. 2020, 23, 281–303. [Google Scholar] [CrossRef]
  13. Khan, Z.; Ali, S.; Umar, M.; Kirikkaleli, D.; Jiao, Z. Consumption-based carbon emissions and International trade in G7 countries: The role of Environmental innovation and Renewable energy. Sci. Total Environ. 2020, 730, 138945. [Google Scholar] [CrossRef] [PubMed]
  14. Çakar, N.D.; Erdoğan, S.; Gedikli, A.; Öncü, M.A. Nuclear energy consumption, nuclear fusion reactors and environmental quality: The case of G7 countries. Nucl. Eng. Technol. 2021, 54, 1301–1311. [Google Scholar] [CrossRef]
  15. Saidi, K.; Omri, A. Reducing CO2 emissions in OECD countries: Do renewable and nuclear energy matter? Prog. Nucl. Energy 2020, 126, 103425. [Google Scholar] [CrossRef]
  16. Majeed, M.T.; Ozturk, I.; Samreen, I.; Luni, T. Evaluating the asymmetric effects of nuclear energy on carbon emissions in Pakistan. Nucl. Eng. Technol. 2022, 54, 1664–1673. [Google Scholar] [CrossRef]
  17. Sarkodie, S.A.; Adams, S. Renewable energy, nuclear energy, and environmental pollution: Accounting for political institutional quality in South Africa. Sci. Total Environ. 2018, 643, 1590–1601. [Google Scholar] [CrossRef]
  18. Chen, G.; Geiger, M.; Fu, M. Manufacturing FDI in Sub-Saharan Africa: Trends, Determinants (No. 97836). And Impact. Working Paper. 2015. Available online: http://hdl.handle.net/10986/22352 (accessed on 20 July 2022).
  19. Kamal, M.; Usman, M.; Jahanger, A.; Balsalobre-Lorente, D. Revisiting the Role of Fiscal Policy, Financial Development, and Foreign Direct Investment in Reducing Environmental Pollution during Globalization Mode: Evidence from Linear and Nonlinear Panel Data Approaches. Energies 2021, 14, 6968. [Google Scholar] [CrossRef]
  20. Ke, J.; Jahanger, A.; Yang, B.; Usman, M.; Ren, F. Digitalization, Financial Development, Trade, and Carbon Emissions; Implication of Pollution Haven Hypothesis during Globalization Mode. Front. Environ. Sci. 2022, 10, 211. [Google Scholar] [CrossRef]
  21. Jahanger, A.; Usman, M.; Balsalobre-Lorente, D. Linking institutional quality to environmental sustainability. Sustain. Dev. 2022, 1–17. [Google Scholar] [CrossRef]
  22. Nathaniel, S.P. Ecological footprint, energy use, trade, and urbanization linkage in Indonesia. GeoJournal 2020, 86, 2057–2070. [Google Scholar] [CrossRef]
  23. Jin, X.; Li, X.; Feng, Z.; Wu, J.; Wu, K. Linking ecological efficiency and the economic agglomeration of China based on the ecological footprint and nighttime light data. Ecol. Indic. 2020, 111, 106035. [Google Scholar] [CrossRef]
  24. Dogan, E.; Ulucak, R.; Kocak, E.; Isik, C. The use of ecological footprint in estimating the Environmental Kuznets Curve hypothesis for BRICST by considering cross-section dependence and heterogeneity. Sci. Total Environ. 2020, 723, 138063. [Google Scholar] [CrossRef]
  25. Murshed, M. Are Trade Liberalization policies aligned with Renewable Energy Transition in low and middle income countries? An Instrumental Variable approach. Renew. Energy 2019, 151, 1110–1123. [Google Scholar] [CrossRef]
  26. Khan, Z.; Malik, M.Y.; Latif, K.; Jiao, Z. Heterogeneous effect of eco-innovation and human capital on renewable & non-renewable energy consumption: Disaggregate analysis for G-7 countries. Energy 2020, 209, 118405. [Google Scholar] [CrossRef]
  27. Kirton, J. The G7/8 System and Evolution. G8 Information Centre, University of Toronto. 2004. Available online: http://www.g8.utoronto.ca/g8online/2004/english/lectures/lecture01 (accessed on 23 July 2022).
  28. Churchill, S.A.; Inekwe, J.; Ivanovski, K.; Smyth, R. The Environmental Kuznets Curve in the OECD: 1870–2014. Energy Econ. 2018, 75, 389–399. [Google Scholar] [CrossRef]
  29. Menyah, K.; Wolde-Rufael, Y. CO2 emissions, nuclear energy, renewable energy and economic growth in the US. Energy Policy 2010, 38, 2911–2915. [Google Scholar] [CrossRef]
  30. Pata, U.K.; Samour, A. Do renewable and nuclear energy enhance environmental quality in France? A new EKC approach with the load capacity factor. Prog. Nucl. Energy 2022, 149, 104249. [Google Scholar] [CrossRef]
  31. Sadiq, M.; Shinwari, R.; Usman, M.; Ozturk, I.; Maghyereh, A.I. Linking nuclear energy, human development and carbon emission in BRICS region: Do external debt and financial globalization protect the environment? Nucl. Eng. Technol. 2022, 54, 3299–3309. [Google Scholar] [CrossRef]
  32. Usman, A.; Ozturk, I.; Naqvi, S.M.M.A.; Ullah, S.; Javed, M.I. Revealing the nexus between nuclear energy and ecological footprint in STIRPAT model of advanced economies: Fresh evidence from novel CS-ARDL model. Prog. Nucl. Energy 2022, 148, 14220. [Google Scholar] [CrossRef]
  33. Azam, A.; Rafiq, M.; Shafique, M.; Zhang, H.; Yuan, J. Analyzing the effect of natural gas, nuclear energy and renewable energy on GDP and carbon emissions: A multi-variate panel data analysis. Energy 2020, 219, 119592. [Google Scholar] [CrossRef]
  34. Ben Mbarek, M.; Saidi, K.; Amamri, M. The relationship between pollutant emissions, renewable energy, nuclear energy and GDP: Empirical evidence from 18 developed and developing countries. Int. J. Sustain. Energy 2017, 37, 597–615. [Google Scholar] [CrossRef]
  35. Al-Mulali, U. Investigating the impact of nuclear energy consumption on GDP growth and CO2 emission: A panel data analysis. Prog. Nucl. Energy 2014, 73, 172–178. [Google Scholar] [CrossRef]
  36. Jin, T.; Kim, J. What is better for mitigating carbon emissions—Renewable energy or nuclear energy? A panel data analysis. Renew. Sustain. Energy Rev. 2018, 91, 464–471. [Google Scholar] [CrossRef]
  37. Rahman, M.M.; Alam, K. Impact of industrialization and non-renewable energy on environmental pollution in Australia: Do renewable energy and financial development play a mitigating role? Renew. Energy 2022, 195, 203–213. [Google Scholar] [CrossRef]
  38. Hussain, J.; Zhou, K. Globalization, industrialization, and urbanization in Belt and Road Initiative countries: Implications for environmental sustainability and energy demand. Environ. Sci. Pollut. Res. 2022, 1–19. [Google Scholar] [CrossRef]
  39. Omri, A.; Saidi, K. Factors influencing CO2 emissions in the MENA countries: The roles of renewable and nonrenewable energy. Environ. Sci. Pollut. Res. 2022, 1–12. [Google Scholar] [CrossRef]
  40. Musah, M.; Mensah, I.A.; Alfred, M.; Mahmood, H.; Murshed, M.; Omari-Sasu, A.Y.; Boateng, F.; Nyeadi, J.D.; Coffie, C.P.K. Reinvestigating the pollution haven hypothesis: The nexus between foreign direct investments and environmental quality in G-20 countries. Environ. Sci. Pollut. Res. 2022, 29, 31330–31347. [Google Scholar] [CrossRef]
  41. Li, W.; Qiao, Y.; Li, X.; Wang, Y. Energy consumption, pollution haven hypothesis, and Environmental Kuznets Curve: Examining the environment–economy link in belt and road initiative countries. Energy 2021, 239, 122559. [Google Scholar] [CrossRef]
  42. Chaudhry, I.S.; Yin, W.; Ali, S.A.; Faheem, M.; Abbas, Q.; Farooq, F.; Rahman, S.U. Moderating role of institutional quality in validation of pollution haven hypothesis in BRICS: A new evidence by using DCCE approach. Environ. Sci. Pollut. Res. 2021, 29, 9193–9202. [Google Scholar] [CrossRef]
  43. Ulucak, R.; Erdogan, S. The effect of nuclear energy on the environment in the context of globalization: Consumption vs production-based CO2 emissions. Nucl. Eng. Technol. 2021, 54, 1312–1320. [Google Scholar] [CrossRef]
  44. Hassan, S.T.; Khan, D.; Zhu, B.; Batool, B. Is public service transportation increase environmental contamination in China? The role of nuclear energy consumption and technological change. Energy 2021, 238, 121890. [Google Scholar] [CrossRef]
  45. Usman, M.; Radulescu, M. Examining the role of nuclear and renewable energy in reducing carbon footprint: Does the role of technological innovation really create some difference? Sci. Total Environ. 2022, 841, 156662. [Google Scholar] [CrossRef] [PubMed]
  46. Mahmood, N.; Wang, Z.; Zhang, B. The role of nuclear energy in the correction of environmental pollution: Evidence from Pakistan. Nucl. Eng. Technol. 2019, 52, 1327–1333. [Google Scholar] [CrossRef]
  47. Ahmed, F.; Ali, I.; Kousar, S.; Ahmed, S. The environmental impact of industrialization and foreign direct investment: Empirical evidence from Asia-Pacific region. Environ. Sci. Pollut. Res. 2022, 29, 29778–29792. [Google Scholar] [CrossRef]
  48. Kahouli, B.; Miled, K.; Aloui, Z. Do energy consumption, urbanization, and industrialization play a role in environmental degradation in the case of Saudi Arabia? Energy Strat. Rev. 2022, 40, 100814. [Google Scholar] [CrossRef]
  49. Rai, S.K.; Rawat, A. Exploring the nexus between environment quality, economic development and industrialization in BRICS nations: The role of technological innovation and income inequality. Environ. Sci. Pollut. Res. 2022, 29, 37842–37853. [Google Scholar] [CrossRef]
  50. Mentel, U.; Wolanin, E.; Eshov, M.; Salahodjaev, R. Industrialization and CO2 Emissions in Sub-Saharan Africa: The Mitigating Role of Renewable Electricity. Energies 2022, 15, 946. [Google Scholar] [CrossRef]
  51. Aslam, B.; Hu, J.; Shahab, S.; Ahmad, A.; Saleem, M.; Shah, S.S.A.; Javed, M.S.; Aslam, M.K.; Hussain, S.; Hassan, M. The nexus of industrialization, GDP per capita and CO2 emission in China. Environ. Technol. Innov. 2021, 23, 101674. [Google Scholar] [CrossRef]
  52. Rehman, A.; Ma, H.; Ozturk, I. Do industrialization, energy importations, and economic progress influence carbon emission in Pakistan. Environ. Sci. Pollut. Res. 2021, 28, 45840–45852. [Google Scholar] [CrossRef]
  53. Usman, M.; Balsalobre-Lorente, D.; Jahanger, A.; Ahmad, P. Pollution concern during globalization mode in financially resource-rich countries: Do financial development, natural resources, and renewable energy consumption matter? Renew. Energy 2021, 183, 90–102. [Google Scholar] [CrossRef]
  54. Li, S.; Yu, Y.; Jahanger, A.; Usman, M.; Ning, Y. The Impact of Green Investment, Technological Innovation, and Globalization on CO2 Emissions: Evidence from MINT Countries. Front. Environ. Sci. 2022, 10, 156. [Google Scholar] [CrossRef]
  55. Balsalobre-Lorente, D.; Ibáñez-Luzón, L.; Usman, M.; Shahbaz, M. The environmental Kuznets curve, based on the economic complexity, and the pollution haven hypothesis in PIIGS countries. Renew. Energy 2021, 185, 1441–1455. [Google Scholar] [CrossRef]
  56. Balsalobre-Lorente, D.; Gokmenoglu, K.K.; Taspinar, N.; Cantos-Cantos, J.M. An approach to the pollution haven and pollution halo hypotheses in MINT countries. Environ. Sci. Pollut. Res. 2019, 26, 23010–23026. [Google Scholar] [CrossRef]
  57. Ahmad, M.; Ahmad, M.; Jabeen, G.; Jabeen, G.; Wu, Y.; Wu, Y. Heterogeneity of pollution haven/halo hypothesis and Environmental Kuznets Curve hypothesis across development levels of Chinese provinces. J. Clean. Prod. 2020, 285, 124898. [Google Scholar] [CrossRef]
  58. Caetano, R.V.; Marques, A.C.; Afonso, T.L.; Vieira, I. A sectoral analysis of the role of Foreign Direct Investment in pollution and energy transition in OECD countries. J. Environ. Manag. 2021, 302, 114018. [Google Scholar] [CrossRef]
  59. Shao, Q.; Wang, X.; Zhou, Q.; Balogh, L. Pollution haven hypothesis revisited: A comparison of the BRICS and MINT countries based on VECM approach. J. Clean. Prod. 2019, 227, 724–738. [Google Scholar] [CrossRef]
  60. GFN. Global Footprint Network. 2021. Available online: https://www.footprintnetwork.org/our-work/ecological-footprint (accessed on 11 April 2022).
  61. BP. British Petroleum Statistical Review of World Energy. 2021. Available online: https://www.bp.com/content/dam/bp/business-sites/en/global/corporate/xlsx/energy-economics/statistical-review/bp-stats-review-2021-all-data.xlsx (accessed on 11 April 2022).
  62. WDI. World Bank (World Development Indicators). 2021. Available online: https://databank.worldbank.org/indicator/NY.GDP.PCAP.CD/%201ff4a498/%20Popular-Indicators (accessed on 11 April 2021).
  63. BP. Statistical Review of World Energy Report. Available online: http://www.bp.com/statisticalreview (accessed on 30 July 2022).
  64. Pesaran, M.H. A simple panel unit root test in the presence of cross-section dependence. J. Appl. Econ. 2007, 22, 265–312. [Google Scholar] [CrossRef]
  65. Pedroni, P. Panel cointegration: Asymptotic and finite sample properties of pooled time series tests with an application to the PPP hypothesis. Econom. Theory 2004, 20, 597–625. [Google Scholar]
  66. Kao, C. Spurious regression and residual-based tests for cointegration in panel data. J. Econ. 1999, 90, 1–44. [Google Scholar] [CrossRef]
  67. Westerlund, J. Testing for Error Correction in Panel Data. Oxf. Bull. Econ. Stat. 2007, 69, 709–748. [Google Scholar] [CrossRef] [Green Version]
  68. Driscoll, J.C.; Kraay, A.C. Consistent Covariance Matrix Estimation with Spatially Dependent Panel Data. Rev. Econ. Stat. 1998, 80, 549–560. [Google Scholar] [CrossRef]
  69. Heberle, J.; Sattarhoff, C. A Fast Algorithm for the Computation of HAC Covariance Matrix Estimators. Econometrics 2017, 5, 9. [Google Scholar] [CrossRef]
  70. Pedroni, P. Purchasing Power Parity Tests in Cointegrated Panels. Rev. Econ. Stat. 2001, 83, 727–731. [Google Scholar] [CrossRef]
  71. Dumitrescu, E.-I.; Hurlin, C. Testing for Granger non-causality in heterogeneous panels. Econ. Model. 2012, 29, 1450–1460. [Google Scholar] [CrossRef]
  72. Ishida, H. Can nuclear energy contribute to the transition toward a low-carbon Economy? Jpn. Case Int. J. Energy Econ. Policy 2018, 8, 62–68. [Google Scholar]
  73. Jaforullah, M.; King, A. Does the use of renewable energy sources mitigate CO2 emissions? A reassessment of the US evidence. Energy Econ. 2015, 49, 711–717. [Google Scholar] [CrossRef]
  74. Owusu, P.A.; Asumadu-Sarkodie, S. A review of renewable energy sources, sustainability issues and climate change mitigation. Cogent Eng. 2016, 3, 1167990. [Google Scholar] [CrossRef]
  75. Usman, M.; Makhdum, M.S.A. What abates ecological footprint in BRICS-T region? Exploring the influence of renewable energy, non-renewable energy, agriculture, forest area and financial development. Renew. Energy 2021, 179, 12–28. [Google Scholar] [CrossRef]
  76. Gyamfi, B.A.; Agozie, D.Q.; Bekun, F.V. Can technological innovation, foreign direct investment and natural resources ease some burden for the BRICS economies within current industrial era? Technol. Soc. 2022, 70, 102037. [Google Scholar] [CrossRef]
  77. Jiang, W.; Cole, M.; Sun, J.; Wang, S. Innovation, carbon emissions and the pollution haven hypothesis: Climate capitalism and global re-interpretations. J. Environ. Manag. 2022, 307, 114465. [Google Scholar] [CrossRef]
  78. Qian, X.; Lee, S.; Soto, A.-M.; Chen, G. Regression Model to Predict the Higher Heating Value of Poultry Waste from Proximate Analysis. Resources 2018, 7, 39. [Google Scholar] [CrossRef] [Green Version]
  79. Ramzan, M.; Raza, S.A.; Usman, M.; Sharma, G.D.; Iqbal, H.A. Environmental cost of non-renewable energy and economic progress: Do ICT and financial development mitigate some burden? J. Clean. Prod. 2021, 333, 130066. [Google Scholar] [CrossRef]
  80. Dogan, E.; Majeed, M.T.; Luni, T. Revisiting the nexus of ecological footprint, unemployment, and renewable and non-renewable energy for South Asian economies: Evidence from novel research methods. Renew. Energy 2022, 194, 1060–1070. [Google Scholar] [CrossRef]
Figure 1. Inverted U-shaped association between FDI and environmental contamination [21].
Energies 15 06442 g001
Figure 2. Geographical coverage of G-7 countries.
Energies 15 06442 g002
Figure 3. Box chart of the selected variables.
Energies 15 06442 g003
Figure 4. Trend analysis of each variable over a selected period (1991–2018).
Energies 15 06442 g004aEnergies 15 06442 g004b
Figure 5. Actual, Fitted, and Residual plot of ecological footprint function.
Energies 15 06442 g005
Table 1. Summary of the existing published literature between NEP -IND-FFC-FDI-environment.
AuthorsNationsDurationVariablesApproachesOutcomes
(A) Nexus between Nuclear energy and the environment
Saidi and Omri [15]15 OECD nations1990–2018NEP, RENG, CO2VECM approachesNEP and RENG decline environmental damages.
Menyah and Wolde-Rufael [29]USA1960–2007NEP, CO2Granger causality approachUnidirectional causality exists from NEP to CO2. Furthermore, NEP can help to mitigate CO2 emissions.
Ulucak and Erdogan [43]15 OECD nations2005–2016NEP, GLO, CO2D-K approachNEP and GLO are beneficial for the minimization of CO2 emissions.
Pata and Samour [30]France nation1977–2017NEP, CO2causality approach with Fourier transformsNEP decreases environmental contamination and raised the load capacity factor.
Majeed et al. [16]Pakistan nation1974–2019NEP, CO2DOLS, FMOLSNEP negatively influences environmental contamination in both the short-and long-term.
Hassan et al. [44]China nation1985–2018NEP, TECH, CO2DARDL lag simulationThe negative/positive simulation diagrams for NEP and TECH overcome the CO2 emissions.
Sadiq et al. [31]BRICS nations1990–2019F-GLO, EF, XDEBT, NEPCS-ARDL approachF-GLO accelerates ecological worsening, but NEP and XDEBT promote environmental sustainability.
Usman et al. [32]12 advanced economies1980–2015NEP, HC, EFCS-ARDL approachNEP and HC decrease environmental contamination
Usman and Radulescu [45]Top nuclear energy-producing nations1990–2019NEC, RENG, CFPAMG and CCEMG approachNuclear energy reduces the carbon footprint in the long-run.
Mahmood et el. [46]Pakistan nation1973–2017NEP, CO2ARDL approachNEP negatively affects CO2 emissions in the long-run.
Sarkodie and Adams [17]South Africa nation1971–2017NEP, CO2OLS approachNEP increases environmental contamination in the case of South Africa.
Azam et al. [33]10 highest CO2 emitting nations1990–2014RENG, NEP, CO2FMOLS approachRENG and NEP lead to significant increase in clean energy creation.
Ben Mbarek et al. [34]18 developed and developing nations1990–2013NEP, GDP, CO2VECM approachThere is no causality between NEP and GDP.
(B) Nexus between industrialization and the environment
Rahman and Alam [37]Australian Nation1990–2020IND, FD, NENG, RENG, CO2ARDL approachIND and NENG increase, while the square of IND, RENG, and FD decreases CO2 emissions.
Hussain and Zhou [38]OBOR nations1995–2018URB, FD, IND, GDP, CO2D-K approachURB, FD, IND and GDP significantly upsurge the energy demand and CO2
Ahmed et al. [47]55 Asia-Pacific regions1995–2020IND, GDP, FDI, CO2ARDL approachIND increases environmental contamination. Furthermore, the EKC and PHH are accepted.
Usman and Balsalobre-Lorente [4]Newly industrialized nations1990–2019IND, FD, NR, RENG, EFAMG approachIND and FD significantly drive environmental contamination, while NR and RENG significantly alleviate environmental contamination.
Kahouli et al. [48]Saudi Arabia nation1971–2019IND, URB, ENG, CO2ARDL approachIND and URB Granger causes ENG
Rai and Rawat [49]BRICS nations1996–2016TECH, IND, CO2DOLS approachTECH has a negative, while IND positively influences the dilapidation of environmental excellence.
Mentel et al. [50]44 SSA nations2000–2015IND, RENG, CO2GMM approachIND has a significant positive impact on CO2, while RENG reduces CO2
Aslam et al. [51]China nation1962–2018IND, CO2VCEM approachThe impact of IND on CO2 is significant, both positively and negatively.
Rehman and Ozturk [52]Pakistan nation1971–2019IND, CO2Quantile regressionIND increases the CO2 emissions.
(C) Nexus between Fossil fuel energy utilization and environment
Omri and Saidi [39]14 MENA nations1990–2018RENG, NENG, CO2FMOLS approachRENG enhances ecological excellence, whereas NENG deteriorates it.
Usman et al. [53]Top financially resource-rich nations1990–2018FD, NR, NENG, GLO, NENG, EFThe second-generation approachesFD, NR, and NENG positively affect the EF, while GLO and RENG reduce the EF.
Jahanger et al. [21]69 developing nations1990–2018RENG, FD, GLO, CO2FMOLS, DOLS approachesRENG significantly overcame the pressure on the environment, while FD and GLO significantly increased environmental damage.
Li et al. [54]MINT nations2000–2020NENG, TECH, CO2FMOLS, DOLS approachesNENG and TECH significantly upsurge environmental dilapidation
(D) Nexus between Foreign direct investment and environment
Balsalobre-Lorente et al. [55]PIIGS nations1990–2019GDP, FDI, CO2DOLS approachEKC and PHH are confirmed in PIIGS nations.
Musah et al. [40]G-20 nations1992–2018FDI, CO2CCEMG approachFDI surges CO2 emissions whereby the PHH is evidenced to grip for the G-20 economies of concern.
Li et al. [41]89 OBOR nations1995–2017FDI, GDP, CO2The second-generation approachesMixed outcomes for the EKC and the PHH were found in OBOR nations.
Balsalobre-Lorente et al. [56]MINT nations1990–2013FDI, GDP, EFFMOLS, DOLS approachesEKC, PHH and PHV are confirmed
Ahmad et al. [57]28 Chinese provinces1998–2016GDP, FDI, CO2CCEMG approachThe existence of EKC is verified in only five provinces, while PHH is confirmed in only fifteen provinces.
Chaudhry et al. [42]BRICS nations1995–2019FDI, CO2DCCE approachFDI is a source of PHH in this region.
Caetano et al. [58]15 OECD nations2005–2018FDI, CO2ARDL approachConfirmed the PHH, which was unanticipated for developed nations.
Ke et al. [20]77 developing nations1990–2016FDI, CO2GMM approachThe empirical conclusion confirms the existence of the PHH.
Shao et al. [59]BRICS and MINT nations1982–2014FDI, CO2VECM approachPHH does not stand in these nations.
Table 2. Descriptive information.
Stats.LEFPLNEPLINDLFFELFDI
Mean1.8326275.2214313.1893924.33261024.19275
Median1.7199785.0994883.2339844.40227824.37685
Maximum2.3363176.7447223.5684944.56896726.96048
Minimum1.4301491.5094862.8442343.78888817.45844
Std. Dev.0.2606450.9966650.1910310.1907261.620030
Skewness0.567343−0.345892−0.128063−1.471039−1.270640
Kurtosis1.8885943.2290251.9689213.9341905.903080
Jarque-Bera17.659153.7171257.90106266.69974104.2019
Probability0.0001460.1558970.0192440.0000000.000000
Sum307.8813877.2004535.8178727.87844064.383
Sum Sq. Dev.11.34531165.88816.0943136.074842438.2909
Observations168168168168168
Note: LEFP, LNEP, LIND, LFFE, and LFDI denote the ecological footprint, nuclear energy production, industrialization, fossil fuel energy, and foreign direct investment in logarithmic form.
Table 3. Correlation Analysis.
SeriesLEFPLNEPLINDLFFELFDI
LEFP1.0000
LNEP0.34171.0000
[4.5472]
(0.0000)
LIND0.0069−0.31611.0000
[1.3972][−3.7581]
(0.9296)(0.0002)
LFFE0.2065−0.33750.42081.0000
[2.6612][−4.8525][6.3977]
(0.0072)(0.0000)(0.0000)
LFDI0.28930.2278−0.6088−0.00591.0000
[3.7035][2.9431][−7.5983][−0.0948]
(0.0001)(0.0032)(0.0000)(0.9420)
Note: t-statistics are presented in [ ], and parentheses values show the p-values.
Table 4. Cross-section dependence results.
SeriesBreusch–Pagan LMPesaran Scaled LMBias-Corrected Scaled LMPesaran CD
StatisticProb.StatisticProb.StatisticProb.StatisticProb.
LEFP152.8445 *0.000024.07140 *0.000023.96029 *0.0000−3.924491 *0.0001
LNEP129.5454 *0.000019.81759 *0.000019.70648 *0.00009.422787 *0.0000
LIND125.0421 *0.000018.99540 *0.000018.88429 *0.0000−2.831969 *0.0046
LFFE117.5857 *0.000017.63405 *0.000017.52294 *0.0000−1.4677750.1422
LFDI86.23601 *0.000011.91041 *0.000011.79930 *0.0000−1.4977140.1572
Note: * denotes the significance at the 1% level.
Table 5. Panel unit root results.
VariablesInterceptIntercept and Trend
CADFCIPSIPSCADFCIPSIPS
LEFP−2.303 ***−1.3292.38795−2.067−2.0663.3912
ΔLEFP−4.269 *−5.274 *−26.025 *−4.194 *−5.257 *−30.251 *
LNEP−1.664−1.7131.30496−2.062−2.0970.27691
ΔLNEP−3.495 *−4.732 *−39.181 *−4.057 *−4.998 *−38.155 *
LIND−1.771−2.0160.09886−2.060−1.9113.30318
ΔLIND−3.289 *−4.691 *−60.037 *−3.608 *−5.232 *−84.398 *
LFFE−0.894−0.971−0.2651−1.227−1.3841.76224
ΔLFFE−3.170 *−5.029 *−195.94 *−3.805 *−5.574 *−142.39 *
LFDI−3.127 *−3.219 *−0.4272−3.454 *−3.135 **0.87776
ΔLFDI−4.478 *−5.602 *−17.258 *−4.433 *−5.674 *−17.667 *
Critical Values1%5%10%1%5%10%
−2.51−2.25−2.12−3.3−2.94−2.76
Note: *, ** & *** denote the significance at 1%, 5%, and 10% level. Δ shows the first difference operator.
Table 6. Long-run cointegration outcomes (Pedroni, Kao, and Westerlund).
(A) Pedroni cointegration test
Alternative hypothesis: common AR coefs. (Within-dimension)
Test StatisticStatisticProb.Weighted StatisticProb.
Panel v-Statistic−2.2259240.9870−3.2617760.9994
Panel rho-Statistic1.3485490.91131.6785720.9534
Panel PP-Statistic−4.625524 *0.0000−5.252614 *0.0000
Panel ADF-Statistic−6.588186 *0.0000−6.667216 *0.0000
Alternative hypothesis: individual AR coefs. (Between-dimension)
Group rho-Statistic2.1931150.9859
Group PP-Statistic−6.741938 *0.0000
Group ADF-Statistic−6.660171 *0.0000
(B) Kao cointegration test
ADF−3.228032 *0.0006
Residual variance0.057145
HAC variance0.006626
(C) Westerlund cointegration test
StatisticValueZ-valuep-valueRobust p-value
−4.043 *−2.5340.0310.000
Ga−10.974 **0.6340.7370.037
−6.349 ***−1.0050.1540.098
Pa−12.764 *−3.7940.0250.000
Note: *, ** & *** denotes the significance 1%, 5% and 10% level respectively.
Table 7. Results of long-run elasticity estimates.
VariablesD-K RegressionFGLS RegressionFMOLS RegressionDOLS Regression
Coeff.p-ValueCoeff.p-ValueCoeff.p-ValueCoeff.p-Value
Sum squared resid 6.933656 0.079756
LNEP0.1109 *0.0000.0452 *0.0010.0891 *0.0000.0746 **0.012
LIND0.3351 *0.0040.2824 *0.0000.2114 **0.0120.3538 *0.000
LFFE0.3339 *0.0000.4096 *0.0000.3473 *0.0000.9627 ***0.051
LFDI0.0548 *0.0000.0339 *0.0060.0672 *0.0000.0985 *0.000
Constant−2.5886 *0.000−2.4604 *0.000
Root MSE0.1264
F (4, 27)386.220.000
Wald chi2 (4) 242.660.000
R-squared0.6956 0.670534 0.792092
Adjusted R-squared 0.605862 0.782673
S.E. of regression 0.217924 0.034247
Long-run variance 0.012806 0.000651
Mean dependent var 1.831858 1.831921
S.D. dependent var 0.261566 0.260173
Note: *, ** & *** denotes the significance 1%, 5% and 10% level respectively.
Table 8. Panel Dumitrescu and Hurlin causality outcomes.
Null Hypothesis:W-Stat.Zbar-Stat.Prob.Decision
LNEP ⇏ LEFP22.5572 *20.28560.0000Bidirectional causality between LNEP and LEFP
LEFP ⇏ LNEP4.18634 **1.969890.0489
LIND ⇏ LEFP4.21991 **2.003350.0451Bidirectional causality between LIND and LEFP
LEFP ⇏ LIND11.4809 *9.242530.0000
LFFE ⇏ LEFP3.742781.527650.1266Unidirectional causality from LEFP to LFFE
LEFP ⇏ LFFE7.74842 *5.521270.0000
LFDI ⇏ LEFP4.20595 **1.989440.0467Bidirectional causality between LFDI and LEFP
LEFP ⇏ LFDI4.61820 **2.400450.0164
LIND ⇏ LNEP17.0717 *14.81650.0000Bidirectional causality between LNEP and LIND
LNEP ⇏ LIND52.5660 *50.20430.0000
LFFE ⇏ LNEP7.06867 *4.843560.0000Bidirectional causality between LNEP and LFFE
LNEP ⇏ LFFE25.6784 *23.39750.0000
LFDI ⇏ LNEP13.6561 *11.41130.0000Unidirectional causality from LFDI to LNEP
LNEP ⇏ LFDI3.392181.178110.2388
LFFE ⇏ LIND10.3762 *8.141210.0000Bidirectional causality between LIND and LFFE
LIND ⇏ LFFE4.715512.497470.0125
LFDI ⇏ LIND8.78390 *6.553650.0000Unidirectional causality from LFDI to LIND
LIND ⇏ LFDI3.577561.362940.1729
LFDI ⇏ LFFE2.887740.675180.4996No causality between LFFE and LFDI
LFFE ⇏ LFDI3.596811.382120.1669
* & ** denote the significance 1%, and 5% level respectively. The notation “⇏” denotes “does not granger cause”.
Publisher’s Note: MDPI stays neutral with regard to jurisdictional claims in published maps and institutional affiliations.

