
Carsharing Vehicle Fleet Selection from the Frequent User’s Point of View


Abstract
:1. Introduction
2. Materials and Methods
- Segment A—mini cars—cars designed for urban driving; they are characterized by small dimensions and low operating costs. Impractical to move on extra-urban routes. They can be two- or four-seater, five-seaters usually allocate three rear seats for children;
- Segment B—small cars—small cars offering more space for passengers than segment A and a practical trunk. These features allow them to be driven on routes outside the city, but they are more intended for use in the city as “another car” in the family. In addition to the hatchback version, some models are also offered in sedan or station wagon body versions;
- Segment C—compact; lower-medium class—medium-sized cars designed for driving around the city and on routes. They offer space for five adults and a trunk, as well as relatively comfortable travel conditions. Selected as both the first and the next vehicle in the family. A wide range of body versions;
- Segment D—middle class, family cars—large cars—cars providing comfortable conditions for five adults (with luggage) to travel over longer distances. Most often in body versions sedan (or close in size to sedan hatchback) and station wagon. Many of them are available in coupé versions, most often as sporty, exclusive versions of a given model;
- Segment E—upper-middle class—executive cars—large, comfortable and richly equipped cars, the purpose of which is not only to use by families but also as representative limousines for companies. The technology and equipment contained in them allows for long journeys—and the technical data of the leading versions can often compete even with typical sports cars;
- Segment F—luxury cars—limousines with the highest level of equipment and the best (often the largest) engines. Their features allow for a very comfortable journey for both the driver and passengers. Often used as representative limousines for heads of state, companies, etc., these cars are often driven better as a rear seat passenger rather than as a driver;
- Segment S—sport coupes—a class of cars covering a very large group of vehicles. As standard, there are vehicles with a two-door or three-door coupé body,
- Segment H—convertibles—cars with a folding, hard or soft roof, or completely without a roof. They can be open versions of cars included in the G segment, others are available only as convertibles or roadsters;
- Segment J—sport utility cars—cars presenting features enabling off-road driving;
- Segment M—multipurpose cars—a class of spacious cars that can take at least five people with large luggage.
- 1—same meaning;
- 2—very weak advantage;
- 3—weak advantage;
- 4—more than a weak advantage, less than strong;
- 5—strong advantage;
- 6—more than a strong advantage, less than very strong;
- 7—a very strong advantage;
- 8—more than a very strong advantage, less than an extreme;
- 9—extreme, total advantage.
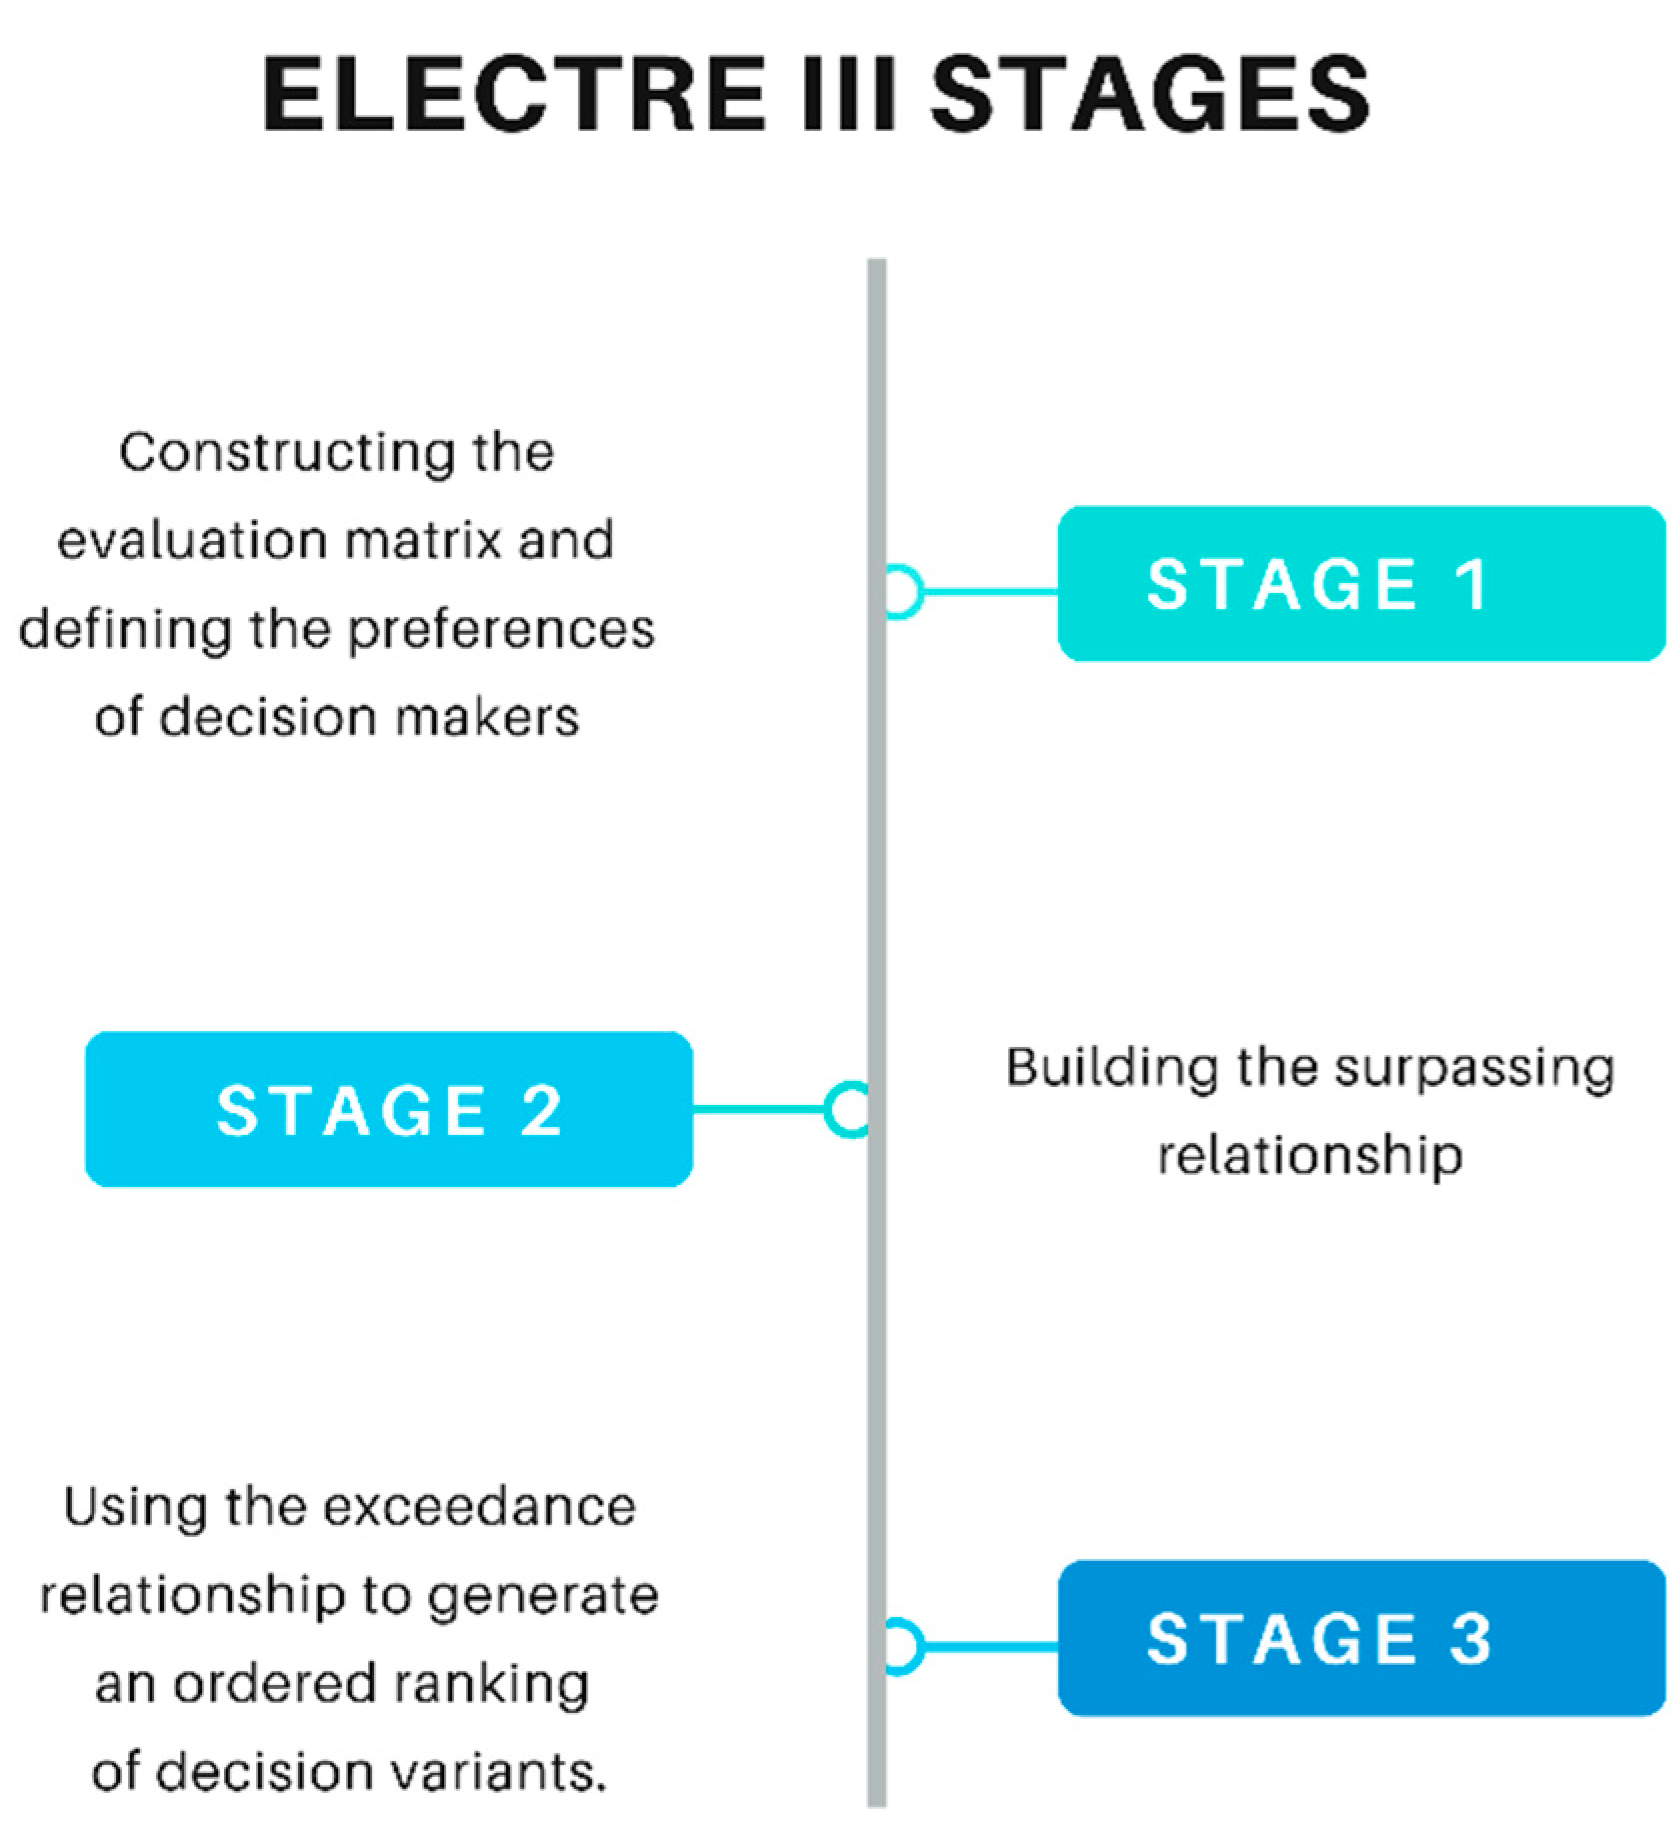
- Variant a is considered better than variant b, if in at least one order a is placed before b, and in the other a is at least as well classified as b;
- Variant a is assessed equally to b, if both variants belong to the same class in each of the two rankings;
- Variants a and b are incomparable if, in one of the two order lines, variant a is in a better position than b, and variant b is in a better position than a in the second order. The results are presented in the next chapter.
3. Results
4. Discussion
5. Conclusions
- When completing the fleet of vehicles for regular users, it is worth considering relatively large cars in the vehicle fleet representing the C or D segment;
- Focus on vehicles with the best engine performance and with the largest possible boot;
- Vehicles of good quality and high safety standards should be selected, incorporating as many safety systems as possible;
- Although the carsharing fleet should be diverse, the first choice of vehicles with the largest number of vehicles in the fleet should be directed towards conventional cars, electric and hybrid cars at the moment should constitute an additional supplement to the fleet;
- Although at the moment Polish carsharing fleets should focus on conventional vehicles (which is also confirmed by, among others, the insufficient number of vehicle charging stations), electric and hybrid vehicles should be included in vehicle fleets to properly prepare users for the transition to greener forms of transport;
- The criteria for the number of seats in the vehicle and the number of doors should not be crucial when it comes to good vehicles for frequent customers.
Funding
Institutional Review Board Statement
Informed Consent Statement
Data Availability Statement
Conflicts of Interest
Appendix A

| Demographic Variable | Gender | Quantity | Percent of Respondents |
|---|---|---|---|
| Gender | Male | 113 | 82% |
| Female | 27 | 18% | |
| Age | 18–30 | 114 | 76% |
| 31–40 | 24 | 16% | |
| 41–50 | 6 | 4% | |
| 51–60 | 4 | 3% | |
| 61–80 | 2 | 1% | |
| Education | Secondary education | 109 | 73% |
| Higher education | 41 | 27% |
References
- Esfandabadi, Z.S.; Diana, M.; Zanetti, M.C. Carsharing services in sustainable urban transport: An inclusive science map of the field. J. Clean. Prod. 2022, 357, 131981. [Google Scholar] [CrossRef]
- Global Market Insights. Car Sharing Market Size by Model (P2P, Station-Based, Free-Floating), By Business Model (Round Trip, One Way), By Application (Business, Private), COVID-19 Impact Analysis, Regional Outlook, Application Potential, Price Trend, Competitive Market Share & Forecast, 2021–2027. Available online: https://www.gminsights.com/industry-analysis/carsharing-market (accessed on 12 July 2022).
- 360 Research Reports. Global Carsharing Market Insights and Forecast to 2028. Available online: https://360researchreports.com/global-carsharing-market-19963041 (accessed on 12 July 2022).
- Martins Monteiro, C.; Soares Machado, C.A.; de Oliveira Lage, M.; Tobal Berssaneti, F.; Davis, C.A., Jr.; Quintanilha, J.A. Maximizing Carsharing Profits: An Optimization Model to Support the Carsharing Planning. Procedia Manuf. 2019, 39, 1968–1976. [Google Scholar] [CrossRef]
- Vanheusden, W.; van Dalen, J.; Mingardo, G. Governance and business policy impact on carsharing diffusion in European cities. Transp. Res. Part D Transp. Environ. 2022, 108, 103312. [Google Scholar] [CrossRef]
- Wali, B.; Khattak, A.J. A joint behavioral choice model for adoption of automated vehicle ride sourcing and carsharing technologies: Role of built environment & sustainable travel behaviors. Transp. Res. Part C Emerg. Technol. 2022, 136, 103557. [Google Scholar] [CrossRef]
- del Mar Alonso-Almeida, M. To Use or Not Use Car Sharing Mobility in the Ongoing COVID-19 Pandemic? Identifying Sharing Mobility Behaviour in Times of Crisis. Int. J. Environ. Res. Public Health. 2022, 19, 3127. [Google Scholar] [CrossRef] [PubMed]
- Wu, T.; Xu, M. Modeling and optimization for carsharing services: A literature review. Multimodal Transp. 2022, 1, 100028. [Google Scholar] [CrossRef]
- Turoń, K. Open Innovation Business Model as an Opportunity to Enhance the Development of Sustainable Shared Mobility Industry. J. Open Innov. Technol. Mark. Complex. 2022, 8, 37. [Google Scholar] [CrossRef]
- Xu, M.; Wu, T.; Tan, Z. Electric vehicle fleet size for carsharing services considering on-demand charging strategy and battery degradation. Transp. Res. Part C Emerg. Technol. 2021, 127, 103146. [Google Scholar] [CrossRef]
- Huang, K.; An, K.; de Almeida Correia, H.H. Planning station capacity and fleet size of one-way electric carsharing systems with continuous state of charge functions. Eur. J. Oper. Res. 2020, 287, 1075–1091. [Google Scholar] [CrossRef]
- Nourinejad, M.; Roorda, M.J. A dynamic carsharing decision support system. Transp. Res. Part E Logist. Transp. Rev. 2014, 66, 36–50. [Google Scholar] [CrossRef]
- Martin, L.; Minner, S. Feature-based selection of carsharing relocation modes. Transp. Res. Part E Logist. Transp. Rev. 2021, 149, 102270. [Google Scholar] [CrossRef]
- Barrios, J.A.; Godier, J.D. Fleet Sizing for Flexible Carsharing Systems: Simulation-Based Approach. Transp. Res. Rec. 2014, 2416, 1–9. [Google Scholar] [CrossRef]
- Carlier, A.; Munier-Kordon, A.; Klaudel, W. Optimization of a one-way carsharing system with relocation operations. In Proceedings of the 10th International Conference on Modeling, Optimization and SIMulation MOSIM 2014, Nancy, France, 5 November 2014. [Google Scholar]
- Firnkorn, J.; Müller, M. Free-floating electric carsharing-fleets in smart cities: The dawning of a post-private car era in urban environments? Environ. Sci. Policy 2015, 45, 30–40. [Google Scholar] [CrossRef]
- Doka, G.; Ziegler, S. Complete Life Cycle Assessment for Vehicle Models of the Mobility CarSharing Fleet Switzerland. In Proceedings of the Conference paper STRC 2001, Session Emissions, 1st Swiss Transport Research Conference, Monte Verità/Ascona, Switzerland, 1–3 March 2001; Available online: http://www.strc.ethz.ch/2001/doka.pdf (accessed on 14 July 2022).
- Chang, J.; Yu, M.; Shen, S.; Xu, M. Location Design and Relocation of a Mixed Car-Sharing Fleet with a CO2 Emission Constraint. Serv. Sci. 2017, 9, 205–218. [Google Scholar] [CrossRef]
- Migliore, M.; D’Orso, G.; Caminiti, D. The environmental benefits of carsharing: The case study of Palermo. Transp. Res. Procedia 2020, 48, 2127–2139. [Google Scholar] [CrossRef]
- Zhao, M.; Li, X.; Yin, J.; Cui, J.; Yang, L.; An, S. An integrated framework for electric vehicle rebalancing and staff relocation in one-way carsharing systems: Model formulation and Lagrangian relaxation-based solution approach. Transp. Res. Part B Methodol. 2018, 117, 542–572. [Google Scholar] [CrossRef]
- Xu, M.; Meng, Q.; Liu, Z. Electric vehicle fleet size and trip pricing for one-way carsharing services considering vehicle relocation and personnel assignment. Transp. Res. Part B Methodol. 2018, 111, 60–82. [Google Scholar] [CrossRef]
- Wappelhorst, S.; Sauer, M.; Hinkeldein, D.; Bocherding, A.; Glaß, T. Potential of Electric Carsharing in Urban and Rural Areas. Transp. Res. Procedia 2014, 4, 374–386. [Google Scholar] [CrossRef]
- Turoń, K.; Kubik, A.; Łazarz, B.; Czech, P.; Stanik, Z. Car-sharing in the context of car operation. IOP Conf. Ser. Mater. Sci. Eng. 2018, 421, 032027. [Google Scholar] [CrossRef]
- Turoń, K.; Kubik, A.; Chen, F. Operational Aspects of Electric Vehicles from Car-Sharing Systems. Energies 2019, 12, 4614. [Google Scholar] [CrossRef] [Green Version]
- Turoń, K.; Kubik, A.; Chen, F. What Car for Car-Sharing? Conventional, Electric, Hybrid or Hydrogen Fleet? Analysis of the Vehicle Selection Criteria for Car-Sharing Systems. Energies 2022, 15, 4344. [Google Scholar] [CrossRef]
- Roy, B. How Outranking Relation Halps Multiple Criteria Decision Making; University of South Carolina Press: Columbia, SC, USA, 1973. [Google Scholar]
- Ishizaka, A.; Nemery, P. Multi-Criteria Decision Analysis, Methods and Software; Wiley and Sons Ltd.: Chichester, UK, 2013. [Google Scholar]
- Jahan, A.; Edwards, K.L. Multi-criteria Decision-Making for Materials Selection. In Multi-Criteria Decision Analysis for Supporting the Selection of Engineering Materials in Product Design; Butterworth-Heinemann: Oxford, UK, 2013; pp. 31–41. [Google Scholar] [CrossRef]
- Ziemba, P. Multi-Criteria Stochastic Selection of Electric Vehicles for the Sustainable Development of Local Government and State Administration Units in Poland. Energies 2020, 13, 6299. [Google Scholar] [CrossRef]
- Istanbul Metropolitan Municipality & Japan International Cooperation Agency. The Study on Integrated Urban Transport Master Plan for Istanbul Metropolitan Area in the Republic of Turkey. Available online: https://openjicareport.jica.go.jp/pdf/11965720_01.pdf (accessed on 5 June 2022).
- Saaty, T. How to make decision: The analytic hierarchy process. Eur. J. Oper. Res. 1990, 48, 9–26. [Google Scholar] [CrossRef]
- Awasthi, A.; Breuil, D.; Singh Chauhan, S.; Parent, M.; Reveillere, T. A Multicriteria Decision Making Approach for Carsharing Stations Selection. J. Decis. Syst. 2007, 16, 57–78. [Google Scholar] [CrossRef]
- Li, W.; Li, Y.; Fan, J.; Deng, H. Siting of Carsharing Stations Based on Spatial Multi-Criteria Evaluation: A Case Study of Shanghai EVCARD. Sustainability 2017, 9, 152. [Google Scholar] [CrossRef]
- Lin, M.; Huang, C.; Xu, Z. Multimoora Based Mcdm model for site selection of car sharing station under picture fuzzy environment. Sustain. Cities Soc. 2020, 53, 101873. [Google Scholar] [CrossRef]
- Delloite. Shared Mobility in Poland, Overview. Available online: https://www.teraz-srodowisko.pl/media/pdf/aktualnosci/6982-mobility-in-poland-2019.pdf (accessed on 5 June 2022).
- Puzio, E. The development of shared mobility in Poland using the example of a city bike system. Res. Pap. Wrocław Univ. Econ. 2020, 64, 162–170. [Google Scholar] [CrossRef]
- Statista. Forecast Revenues from Carsharing Services in Poland from 2019 to 2025. Available online: https://www.statista.com/statistics/1059362/poland-carsharing-revenues/ (accessed on 5 June 2022).
- Auto Magazine. Top 20: The Most Popular Models of the 20 Brands in Europe. Available online: https://magazynauto.pl/wiadomosci/top-20-najpopularniejsze-modele-20-marek-w-europie,aid,1335 (accessed on 10 July 2022).
- Auto Base. The Most Popular Electric Cars in Europe. Available online: https://www.autobaza.pl/page/elektromobilnosc/najpopularniejsze-samochody-elektryczne-w-europie/ (accessed on 10 July 2022).
- Auto Motor and Sport Portal. TOP 10 Models in Europe. Available online: https://www.auto-motor-i-sport.pl/wydarzenia/TOP-10-modeli-w-Europie-Fiat-500-hitem-wsrod-elektrycznych,47787,1 (accessed on 10 July 2022).
- Statista. Purchase Criteria for Car in the US. Available online: https://www.statista.com/forecasts/997119/purchase-criteria-for-cars-in-the-us (accessed on 20 July 2022).
- Parumasur, S.B. Motor vehicle evaluative criteria: Using unmet expectations as signals for dissonance. J. Gov. Regul. 2015, 4, 115–127. [Google Scholar] [CrossRef]
- Infor Portal. Criteria for the Selection of Fleet Cars. Available online: https://mojafirma.infor.pl/moto/eksploatacja-auta/zakup/715108,Kryteria-wyboru-samochodow-flotowych.html (accessed on 20 July 2022).
- Figueira, J.R.; Greco, S.; Roy, B.; Słowiński, R. ELECTRE methods: Main features and recent developments. In Handbook of Multicriteria Analysis; Springer: Berlin/Heidelberg, Germany, 2010; pp. 51–89. [Google Scholar]
- Norese, M.F. ELECTRE III as a support for participatory decision-making on the localisation of waste-treatment plants. Land Use Policy 2006, 23, 76–85. [Google Scholar] [CrossRef]
- Battisti, F. ELECTRE III for Strategic Environmental Assessment: A “Phantom” Approach. Sustainability 2022, 14, 6221. [Google Scholar] [CrossRef]
- La Scalia, G.; Micale, R.; Certa, A.; Enea, M. Ranking of shelf life models based on smart logistic unit using the ELECTRE III method. Int. J. Appl. Eng. Res. 2015, 10, 38009–38015. [Google Scholar]
- Yu, X.; Zhang, S.; Liao, X.; Qi, X. ELECTRE methods in prioritized MCDM environment. Inf. Sci. 2018, 424, 301–316. [Google Scholar] [CrossRef]
- Sudarshan, P.; Sunil, N. A Study on Factors Influencing on Buying Behaviour of Customers. In Research Journal 2015—Institute of Science, Poona College of Computer Sciences ISSN2394-1774 Issue II. Available online: https://ssrn.com/abstract=2810090 (accessed on 11 June 2022).
- de Sa, J.D.S.; Mainardes, E.W.; Andrade, D.M.d. Buying a family car: Relevant factors for teenagers. Rev. Gestão 2020, 27, 21–36. [Google Scholar] [CrossRef]
- Rotaris, L.; Danielis, R. The Role for Carsharing in Medium to Small-Sized Towns and in Less-Densely Populated Rural Areas. Transp. Res. Part A Policy Pract. 2018, 115, 49–62. [Google Scholar] [CrossRef]
- Roblek, V.; Meško, M.; Podbregar, I. Impact of Car Sharing on Urban Sustainability. Sustainability 2021, 13, 905. [Google Scholar] [CrossRef]
- Glotz-Richter, M. Car-Sharing—“Car-on-call” for reclaiming street space. Procedia-Soc. Behav. Sci. 2012, 48, 1454–1463. [Google Scholar] [CrossRef] [Green Version]
- Transport Publiczny Portal, Paryż Autolib. Available online: https://www.transport-publiczny.pl/wiadomosci/paryz-upadek-autolib-dlaczego-najslynniejszy-car-sharing-zbankrutowal-58912.html (accessed on 16 August 2022).
- Automotive Blog—Autoblog, Car-Sharing in San Diego. Available online: https://www.autoblog.com/2016/11/21/car2go-san-diego-shut-down/ (accessed on 10 August 2022).
- Green Car Reports Portalssed—Electric Car-Sharing in San Diego. Available online: https://www.greencarreports.com/news/1102918_san-diego-car2go-car-sharing-service-drops-electric-smarts-for-gasoline-models (accessed on 11 August 2022).


| ID of Alternative | Segment | Engine Type | Vehicle Model |
|---|---|---|---|
| a1 | C | Classic | Volkswagen Golf |
| a2 | B | Classic | Peugeot 208 |
| a3 | B | Hybrid | Toyota Yaris |
| a4 | D | Hybrid | BMW Series 3 |
| a5 | B | Classic | Renault Clio |
| a6 | C | Hybrid | Toyota Corolla |
| a7 | C | Classic | Skoda Octavia |
| a8 | A | Electric | Dacia Spring |
| a9 | D | Hybrid | Hyundai IONIQ |
| a10 | A | Electric | Fiat 500 |
| a11 | D | Electric | Škoda Enyaq |
| a12 | D | Electric | Volkswagen ID.4 |
| Factor # | Factor Definition |
|---|---|
| f1 | Vehicle price—average between the highest and lowest equipment [€] |
| f2 | Engine power [kW] |
| f3 | Energy consumption/fuel consumption [kWh/100 km] |
| f4 | Battery charging time/time of refueling [min] |
| f5 | Boot capacity [l] |
| f6 | Number of seats in the vehicle [-] |
| f7 | Number of doors in the vehicle [-] |
| f8 | Vehicle length [m] |
| f09 | Euro NCAP rating [-] |
| f10 | Safety equipment [-] |
| f11 | Warranty period in years [-] |
| ID | Vehicle Price | Engine Power | Energy/ Fuel Consumption | Charging Time/ Refueling Time | Boot Capacity | Number of Seats | Number of Doors | Vehicle Length | Euro NCAP Rating | Safety Equipment | Warranty Period in Years |
|---|---|---|---|---|---|---|---|---|---|---|---|
| [€] | [kW] | [kWh/100 km] | [min] | [l] | [-] | [-] | [m] | [-] | [-] | [-] | |
| a1 | 23,173 | 81 | 38.5 | 2 | 380 | 5 | 5 | 4.28 | 5 | 10 | 2 |
| a2 | 14,762 | 74 | 37.8 | 2 | 311 | 5 | 5 | 4.05 | 4 | 9 | 2 |
| a3 | 18,180 | 74 | 28.7 | 1.5 | 286 | 5 | 3 | 3.94 | 5 | 8 | 3 |
| a4 | 39,597 | 215 | 13.3 | 2 | 480 | 5 | 4 | 4.70 | 5 | 11 | 2 |
| a5 | 15,050 | 48 | 29.4 | 1.5 | 391 | 5 | 5 | 4.05 | 5 | 10 | 2 |
| a6 | 21,354 | 90 | 29.4 | 2.5 | 361 | 5 | 4 | 4.37 | 5 | 10 | 3 |
| a7 | 23,196 | 110 | 37.8 | 2.5 | 600 | 5 | 5 | 4.68 | 5 | 10 | 3 |
| a8 | 16,870 | 33 | 13.9 | 90 | 300 | 5 | 5 | 3.73 | 1 | 6 | 2 |
| a9 | 33,170 | 104 | 23.8 | 2 | 443 | 5 | 5 | 4.47 | 5 | 8 | 5 |
| a10 | 25,620 | 70 | 11 | 240 | 363 | 5 | 3 | 3.63 | 4 | 8 | 2 |
| a11 | 48,888 | 109 | 14.4 | 360 | 585 | 5 | 5 | 4.49 | 5 | 8 | 2 |
| a12 | 43,818 | 128 | 17 | 450 | 543 | 5 | 5 | 4.58 | 5 | 8 | 3 |
| Factor # | Maximum Difference of Criteria Values | Equivalence Threshold | Preference Threshold | Veto Threshold |
|---|---|---|---|---|
| ∆ = max − min | Q = 0.25 × ∆ | p = 0.5 × ∆ | V = ∆ | |
| f1 | 34,126.61 | 8531.65 | 17,063.30 | 34,126.61 |
| f2 | 182 | 45.5 | 91 | 182 |
| f3 | 27.5 | 6.875 | 13.75 | 27.5 |
| f4 | 448.5 | 112.125 | 224.25 | 448.5 |
| f5 | 1289 | 322.25 | 644.5 | 1289 |
| f6 | 0 | 0 | 0 | 0 |
| f7 | 2 | 0.5 | 1 | 2 |
| f8 | 1.07 | 0.2675 | 0.535 | 1.07 |
| f9 | 4 | 1 | 2 | 4 |
| f10 | 5 | 1.25 | 2.5 | 5 |
| f11 | 3 | 0.75 | 1.5 | 3 |
| Concordance Matrix: | a1 | a2 | a3 | a4 | a5 | a6 | a7 | a8 | a9 | a10 | a11 | a12 |
|---|---|---|---|---|---|---|---|---|---|---|---|---|
| a1 | - | 1 | 0.9977 | 0.7777 | 1 | 0.9977 | 0.9288 | 1 | 0.9885 | 0.8775 | 0.8515 | 0.6889 |
| a2 | 1 | - | 0.9977 | 0.6518 | 1 | 0.9704 | 0.8587 | 1 | 0.8878 | 0.8704 | 0.7619 | 0.5512 |
| a3 | 0.788 | 0.8966 | - | 0.527 | 0.8538 | 0.7694 | 0.6934 | 0.918 | 0.7549 | 0.8775 | 0.6305 | 0.4688 |
| a4 | 0.852 | 0.852 | 0.9317 | - | 0.852 | 0.9317 | 0.8497 | 0.918 | 0.8762 | 0.8775 | 0.7932 | 0.6537 |
| a5 | 0.9786 | 0.9854 | 0.9977 | 0.716 | - | 0.9704 | 0.8009 | 1 | 0.8603 | 0.8713 | 0.7213 | 0.483 |
| a6 | 0.8966 | 0.9034 | 1 | 0.8225 | 0.918 | - | 0.8813 | 0.918 | 0.901 | 0.8775 | 0.7695 | 0.63 |
| a7 | 1 | 1 | 1 | 0.857 | 1 | 1 | - | 1 | 0.9886 | 0.8775 | 0.8515 | 0.712 |
| a8 | 0.5735 | 0.6917 | 0.7595 | 0.501 | 0.6917 | 0.5476 | 0.4953 | - | 0.5624 | 0.7858 | 0.4605 | 0.2795 |
| a9 | 0.8698 | 0.934 | 1 | 0.774 | 0.9358 | 0.9358 | 0.8698 | 1 | - | 0.8775 | 0.8556 | 0.7316 |
| a10 | 0.6488 | 0.7728 | 0.9096 | 0.5364 | 0.7086 | 0.6465 | 0.6465 | 0.918 | 0.7151 | - | 0.7444 | 0.4715 |
| a11 | 0.8698 | 0.934 | 0.9317 | 0.774 | 0.8698 | 0.8675 | 0.8675 | 1 | 0.9688 | 1 | - | 0.8582 |
| a12 | 0.8698 | 0.934 | 0.9537 | 0.7845 | 0.8828 | 0.8828 | 0.8698 | 1 | 0.993 | 1 | 1 | - |
| Dominance Matrix | a1 | a2 | a3 | a4 | a5 | a6 | a7 | a8 | a9 | a10 | a11 | a12 |
|---|---|---|---|---|---|---|---|---|---|---|---|---|
| a1 | - | I | P+ | R | P+ | P+ | P− | P+ | P− | P+ | I | P− |
| a2 | I | - | P+ | R | P+ | P+ | P− | P+ | P− | P+ | I | P− |
| a3 | P− | P− | - | P- | P− | P− | P− | P+ | P− | P− | P− | P− |
| a4 | R | R | P+ | - | R | R | P− | P+ | P− | P+ | R | P− |
| a5 | P− | P− | P+ | R | - | P− | P− | P+ | P− | R | P− | P− |
| a6 | P− | P− | P+ | R | P+ | - | P− | P+ | P− | P+ | P− | P− |
| a7 | P+ | P+ | P+ | P+ | P+ | P+ | - | P+ | P+ | P+ | P+ | P+ |
| a8 | P− | P− | P− | P− | P− | P− | P− | - | P− | P− | P− | P− |
| a9 | P+ | P+ | P+ | P+ | P+ | P+ | P− | P+ | - | P+ | P+ | P− |
| a10 | P− | P− | P+ | P− | R | P− | P− | P+ | P− | - | P− | P− |
| a11 | I | I | P+ | R | P+ | P+ | P− | P+ | P− | P+ | - | P− |
| a12 | P+ | P+ | P+ | P+ | P+ | P+ | P− | P+ | P+ | P+ | P+ | - |
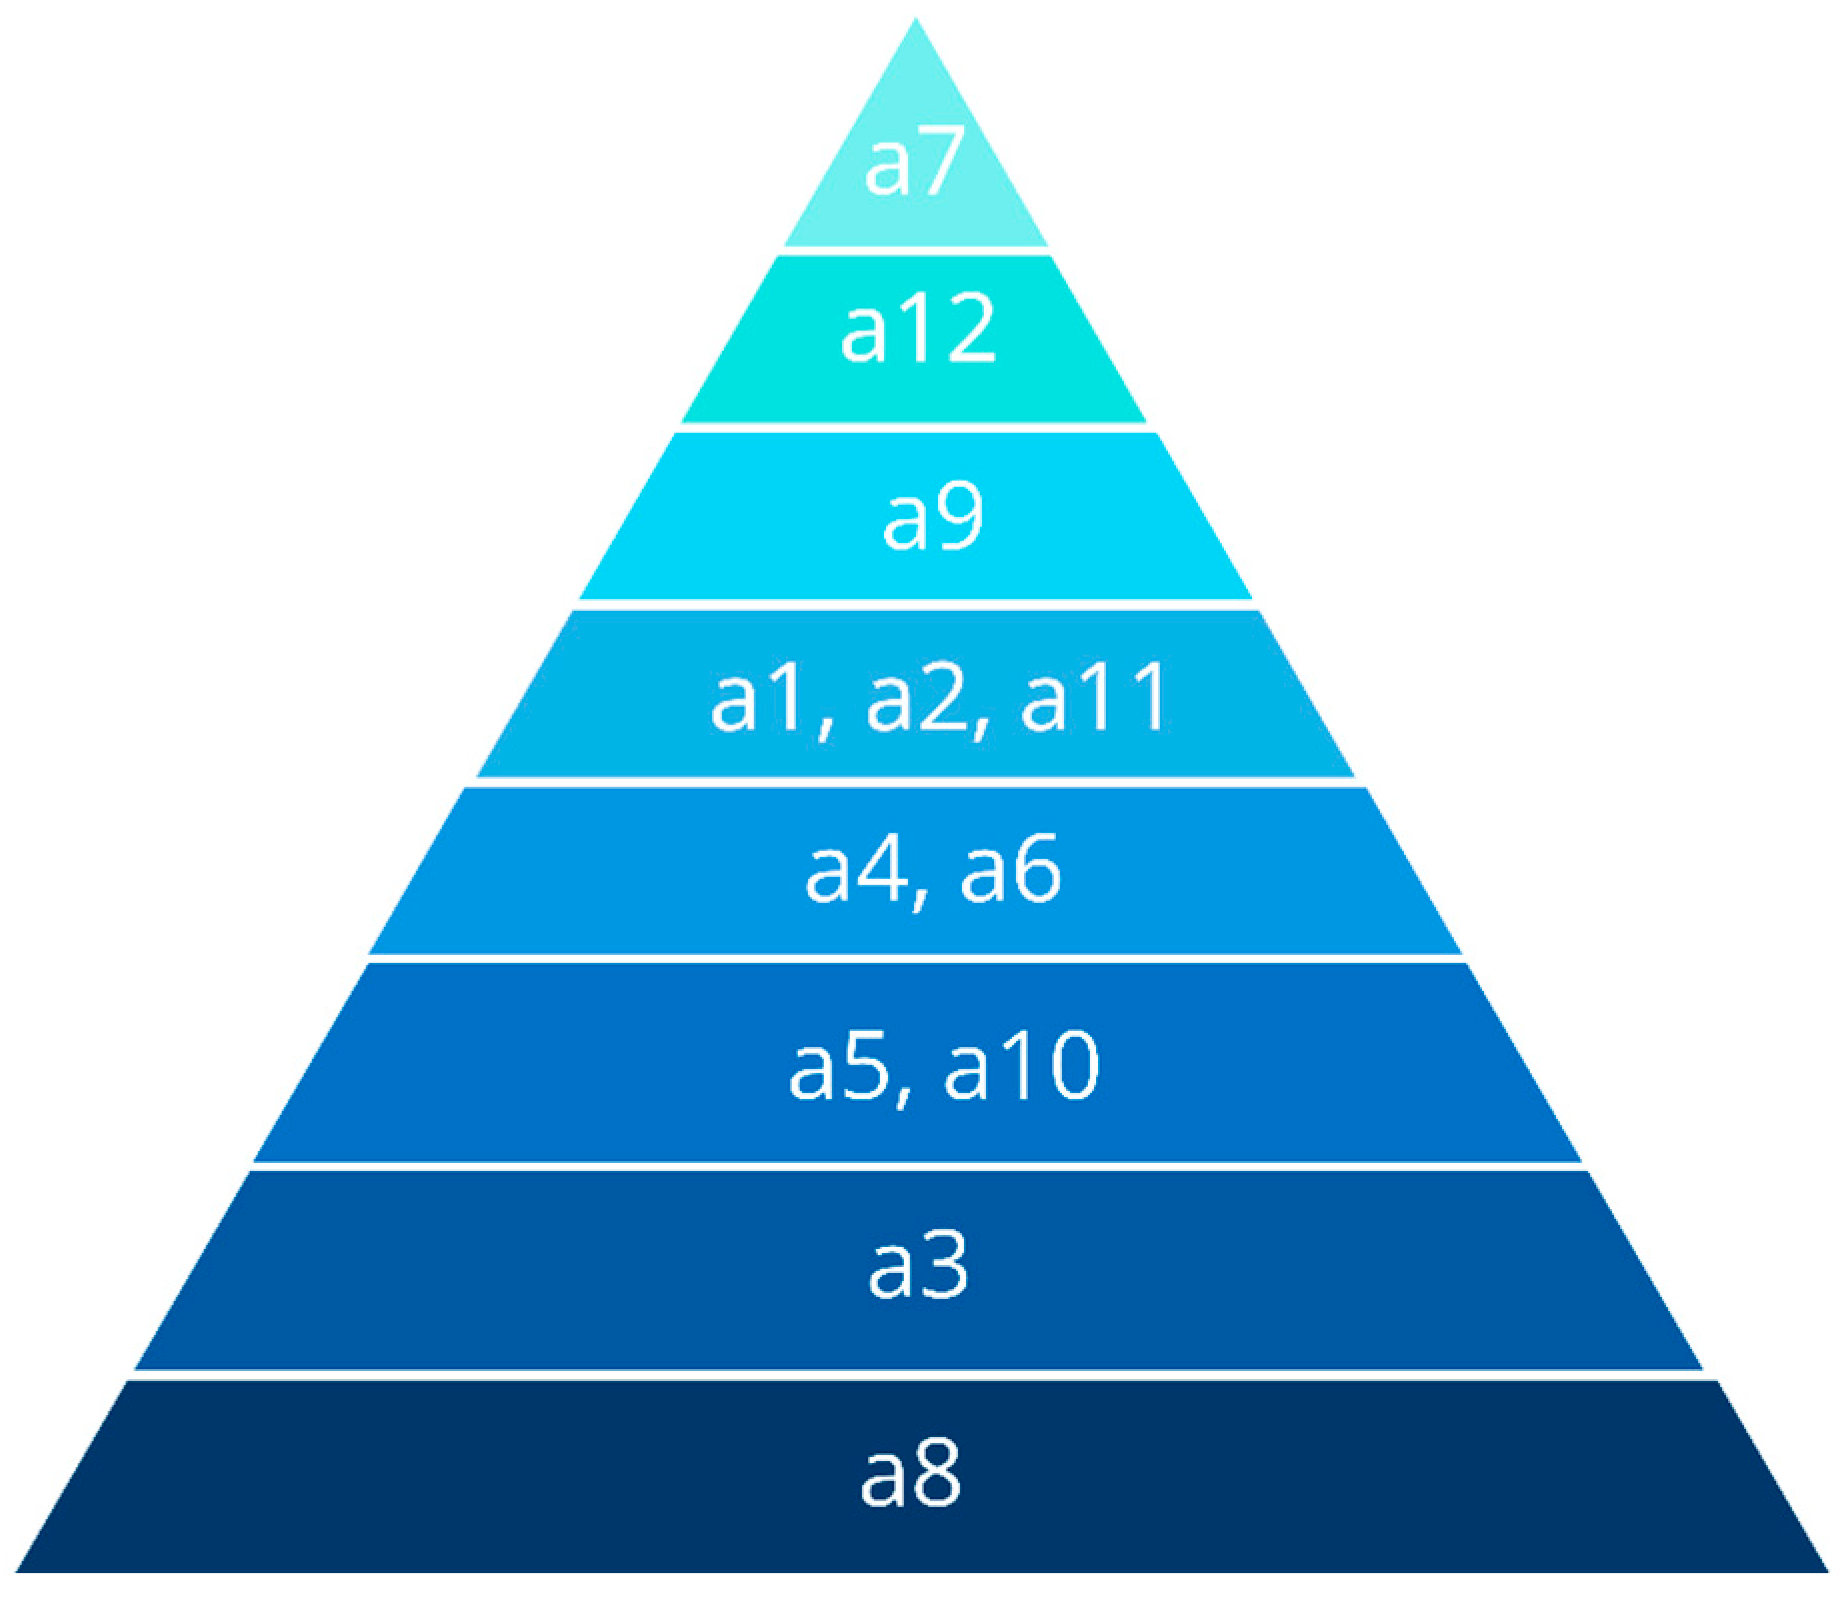
| Dominance Matrix | Ascend Distillation | Descend Distillation | Average |
|---|---|---|---|
| a1 | 2 | 3 | 2.5 |
| a2 | 2 | 3 | 2.5 |
| a3 | 4 | 5 | 4.5 |
| a4 | 1 | 5 | 3 |
| a5 | 4 | 4 | 4 |
| a6 | 2 | 4 | 3 |
| a7 | 1 | 1 | 1 |
| a8 | 5 | 5 | 5 |
| a9 | 1 | 3 | 2 |
| a10 | 3 | 5 | 4 |
| a11 | 2 | 3 | 2.5 |
| a12 | 1 | 2 | 1.5 |
Publisher’s Note: MDPI stays neutral with regard to jurisdictional claims in published maps and institutional affiliations. |
© 2022 by the author. Licensee MDPI, Basel, Switzerland. This article is an open access article distributed under the terms and conditions of the Creative Commons Attribution (CC BY) license (https://creativecommons.org/licenses/by/4.0/).
Share and Cite
Turoń, K. Carsharing Vehicle Fleet Selection from the Frequent User’s Point of View. Energies 2022, 15, 6166. https://doi.org/10.3390/en15176166
Turoń K. Carsharing Vehicle Fleet Selection from the Frequent User’s Point of View. Energies. 2022; 15(17):6166. https://doi.org/10.3390/en15176166
Chicago/Turabian StyleTuroń, Katarzyna. 2022. "Carsharing Vehicle Fleet Selection from the Frequent User’s Point of View" Energies 15, no. 17: 6166. https://doi.org/10.3390/en15176166
APA StyleTuroń, K. (2022). Carsharing Vehicle Fleet Selection from the Frequent User’s Point of View. Energies, 15(17), 6166. https://doi.org/10.3390/en15176166