Article

Voltage Rise Mitigation in PV Rich LV Distribution Networks Using DC/DC Converter Level Active Power Curtailment Method

1
Poornima College of Engineering, Jaipur 302022, Rajasthan, India
2
Indian Institute of Information Technology, Una 177209, Himachal Pradesh, India
3
Chitkara University School of Engineering and Technology, Chitkara University, Baddi 174103, Himachal Pradesh, India
4
SVCET Engineering College & Technology, Chittoor 517127, Andhra Pradesh, India
5
Department of Electronics and Communication Engineering, Kuwait College of Science and Technology (KCST), Doha Area, 7th Ring Road, Kuwait City 7207, Kuwait
6
College of Engineering and Applied Sciences, American University of Kuwait, Salmiya 20002, Kuwait
*
Authors to whom correspondence should be addressed.
Energies 2022, 15(16), 5901; https://doi.org/10.3390/en15165901
Submission received: 2 July 2022 / Revised: 8 August 2022 / Accepted: 9 August 2022 / Published: 15 August 2022
(This article belongs to the Special Issue Trends and Prospects in Photovoltaic Systems)

Abstract

:
In low voltage (LV) distribution systems, the problem of overvoltage is common during the lower load intervals. This problem arises because of the high value of R/X ration of these systems. Many techniques are available in literature to cope up with this problem at the converter level; mostly these methods control the reactive or active power of the photovoltaic (PV) systems. However, there are certain restrictions and complications with the reactive power control of PV systems. Most of the active power control methods have been implemented at the inverter stage of the PV system, resulting in implementation complexities and excessive oversizing of the converter. Therefore, in this paper, a simple, de-rating based voltage control algorithm is proposed to overcome the problem of overvoltage. So far de-rating technique has been used to enable frequency support functions in PVs; in a first of its kind, de-rating technique is used here to control the voltages in PV rich LV distribution systems. The entire control is implemented on the dc/dc converter stage of the PV system and the inverter stage is kept untouched. The effectiveness of the control is verified by simulating a sample PV-rich three bus LV distribution system on the MATLAB software. The proposed control avoids the overvoltage by approx. 700 V for the best-case scenario.

1. Introduction

The photovoltaic (PV) systems installed in residential and office buildings are connected on low-voltage (LV) distribution networks. During the peak load hours, this system maintains an optimal voltage profile; however, during the off-peak load hours, the voltages increase at the end of the line. The voltage rise problem is becoming a major setback for PV connected LV distribution systems [1], resulting in deterioration of the power quality of the system [2]. Sometimes, this voltage rise triggers the internal protection system in PVs which automatically disconnects the PV units from the network [3]. This leads to mandatory monitoring of the system to restore it to the original power capacity levels.
The literature is rich with solutions to the problem discussed above. These extend from active power curtailment and reactive power control (RPC) to usage of on load tap changer (OLTC) and energy storage systems. A modified damping based control was proposed in [4], wherein initially system damping is increased to control the voltages, and if the overvoltage persists, active power drooping is then used. A multi objective optimal (MOO) power flow to control the inverter active and reactive power was performed in [5]. The method improves the voltage profile and balances the voltage. Similar to [5], an optimal inverter dispatch (OID) strategy to control the active and reactive power set points of PV inverter was proposed in [6]. A reverse power flow based reactive power droop control was discussed in [7]; in this technique, the customers in a feeder causing the over voltages are made to absorb the excessive VARs to mitigate the overvoltage. An active power dependent (APD) voltage regulation method was proposed in [8], where the level of active power decides magnitude of reactive power. The voltage sensitivity matrix was further used in this method to quantify the magnitude of voltages w.r.t to active and reactive power. The researchers in [9] discuss a five-mode distributed control scheme to control the active and reactive power of PV inverters in a coordinated manner. In this scheme, communications between the controllers were used to update the inverters power points. A power–voltage (P–V) droop control based overvoltage mitigation control was coined in [10]; in this method, P–V droop control is used to find the set power of PVs. A sensitivity based active power curtailment method was discussed in [11] in which the amount of PV inverter active power to be curtailed is computed based upon the voltage/active power sensitivity calculation. Similar to [10], a droop based active power control (APC) method was coined in [12], where the active power is reduced upon the increase in the system voltage beyond the critical value. Active power–voltage (P–V) and reactive power–voltage (Q–V) droop control techniques were used in conjunction in [13,14] to limit the voltages; the effectiveness of the control was tested by collecting the real time data from various trial sites in [13]. With the increase in the system voltage, reactive power of the system was decreased in [15] using a pre-defined set of rules: if the reactive power curtailment is not sufficient, active power of the system is further contained in above technique. Sometimes the active power curtailment can result in unfair power reduction amongst PV inverters. To overcome this problem, a sensitivity matrix-based fairness power sharing algorithm is proposed in [16]. To make the optimal utilization of PV reactive power for overvoltage compensation, the parameters of the local controllers were updated in regular time intervals using a centralized optimization algorithm in [17]. A fair power sharing based real power capping method was discussed in [18]. The method aims at achieving the same percentage real power curtailments for PV units operating under diverse irradiance conditions. In [19], an adaptive droop based active and reactive power control strategy was proposed, wherein the reactive power is controlled first to reduce the voltages. The active power curtailment is used as the secondary option for controlling the PV voltages. A two-level overvoltage mitigation control was proposed in [20,21]; in lower-level control, Q-V and P–V droop controls are included, whereas in higher-level control a sparse based communication network is integrated in which the state variables of the PV inverters are shared with the neighboring units. A sensitivity analysis-based method where the location dependent power factors values are assigned to PV inverters was discussed in [22]. The method claims to achieve overvoltage mitigation with lesser reactive power consumption.
In recent methods, a power compensation algorithm was proposed in [23], where the RPC and APC order is obtained with the help of sensitivity comparison of the principal node. A new configuration of dynamic voltage restorer to cope with the unsymmetrical faults is given in [24]. The technique extensively utilizes the PID based control for accurate error estimation. A detailed investigation of the arising volt-var methods is given in [25]. Use of a grey wolf optimizer algorithm for tuning the PID controller of a dc/dc converter is illustrated in [26,27]
The overvoltage mitigation can be carried out using energy storage systems. In this context, [28] has compared various voltage mitigation techniques for the LV distribution system with high level of PV penetration. Post review, Chaudhary and Rizwan have indicated the usage of energy storage devices as the best solution to mitigate the voltage rise problem in such networks. However, the installation cost of these devices is very high and the overvoltage problem in not a permanent issue of the distribution networks. Therefore, the converter level control is most optimal. Various autonomous inverter control strategies were compared with some OLTC and grid reinforcement-based techniques in [29]; these were compared both on economic and technical aspects. The results indicated that the converter level controls are more efficient.
A comparison of the reviewed voltage rise mitigation methods is given in Table 1. Many of the methods have opted for the RPC to fulfill the purpose. However, there are certain issues with RPC in PV systems such as: (a) some national standards (IEEE 1547) forbid the reactive power control of low voltage inverters [6], (b) reactive power absorption by PV inverters may lead to overloading of the distribution transformers [30], (c) the provision of reactive power decreases the active power flow of PV generators [7], (d) the APC method is slightly more cost-effective as compared to a coordinated APC–RPC method [30], and (e) the reactive power support has a lower impact on the system voltage profile and moreover leads to additional losses in the feeder [5]. Moreover, there are some methods where the optimizations have been used; these methods require micro inverters which communicate with the power management system, and these micro inverter units add to the cost of the system [6]. In contrast, most of the APC methods were implemented on the inverter stage of the PV system, which results in: (a) implementation complexities, and (b) excessive oversizing of the converter.
Therefore, based upon the above-mentioned shortcomings, a simple, less complex de-rating based voltage control algorithm (VCA) is proposed in this paper to overcome the problem of overvoltage in LV distribution systems. So far, de-rating technique has been used to enable frequency support functions in PVs [31,32,33,34,35,36,37]; in a first of its kind, de-rating technique is used here to control the voltages in PV enrich LV distribution systems. The end-of-the-line voltage of the distribution system is continuously sensed and the de-rating of the PV system is coordinated with the sensed voltages. The entire control is implemented on the dc/dc converter stage of the PV system and the inverter stage is kept untouched. The effectiveness of the control is verified by simulating a sample three bus PV-rich LV distribution system on the MATLAB software.
The structure of the paper is as follow: Section 2 defines the problem and gives the overview of the proposed control, the detailed explanation of the de rating-based voltage control is given in Section 3, simulation results are accounted in Section 4, and conclusions are given in Section 5.

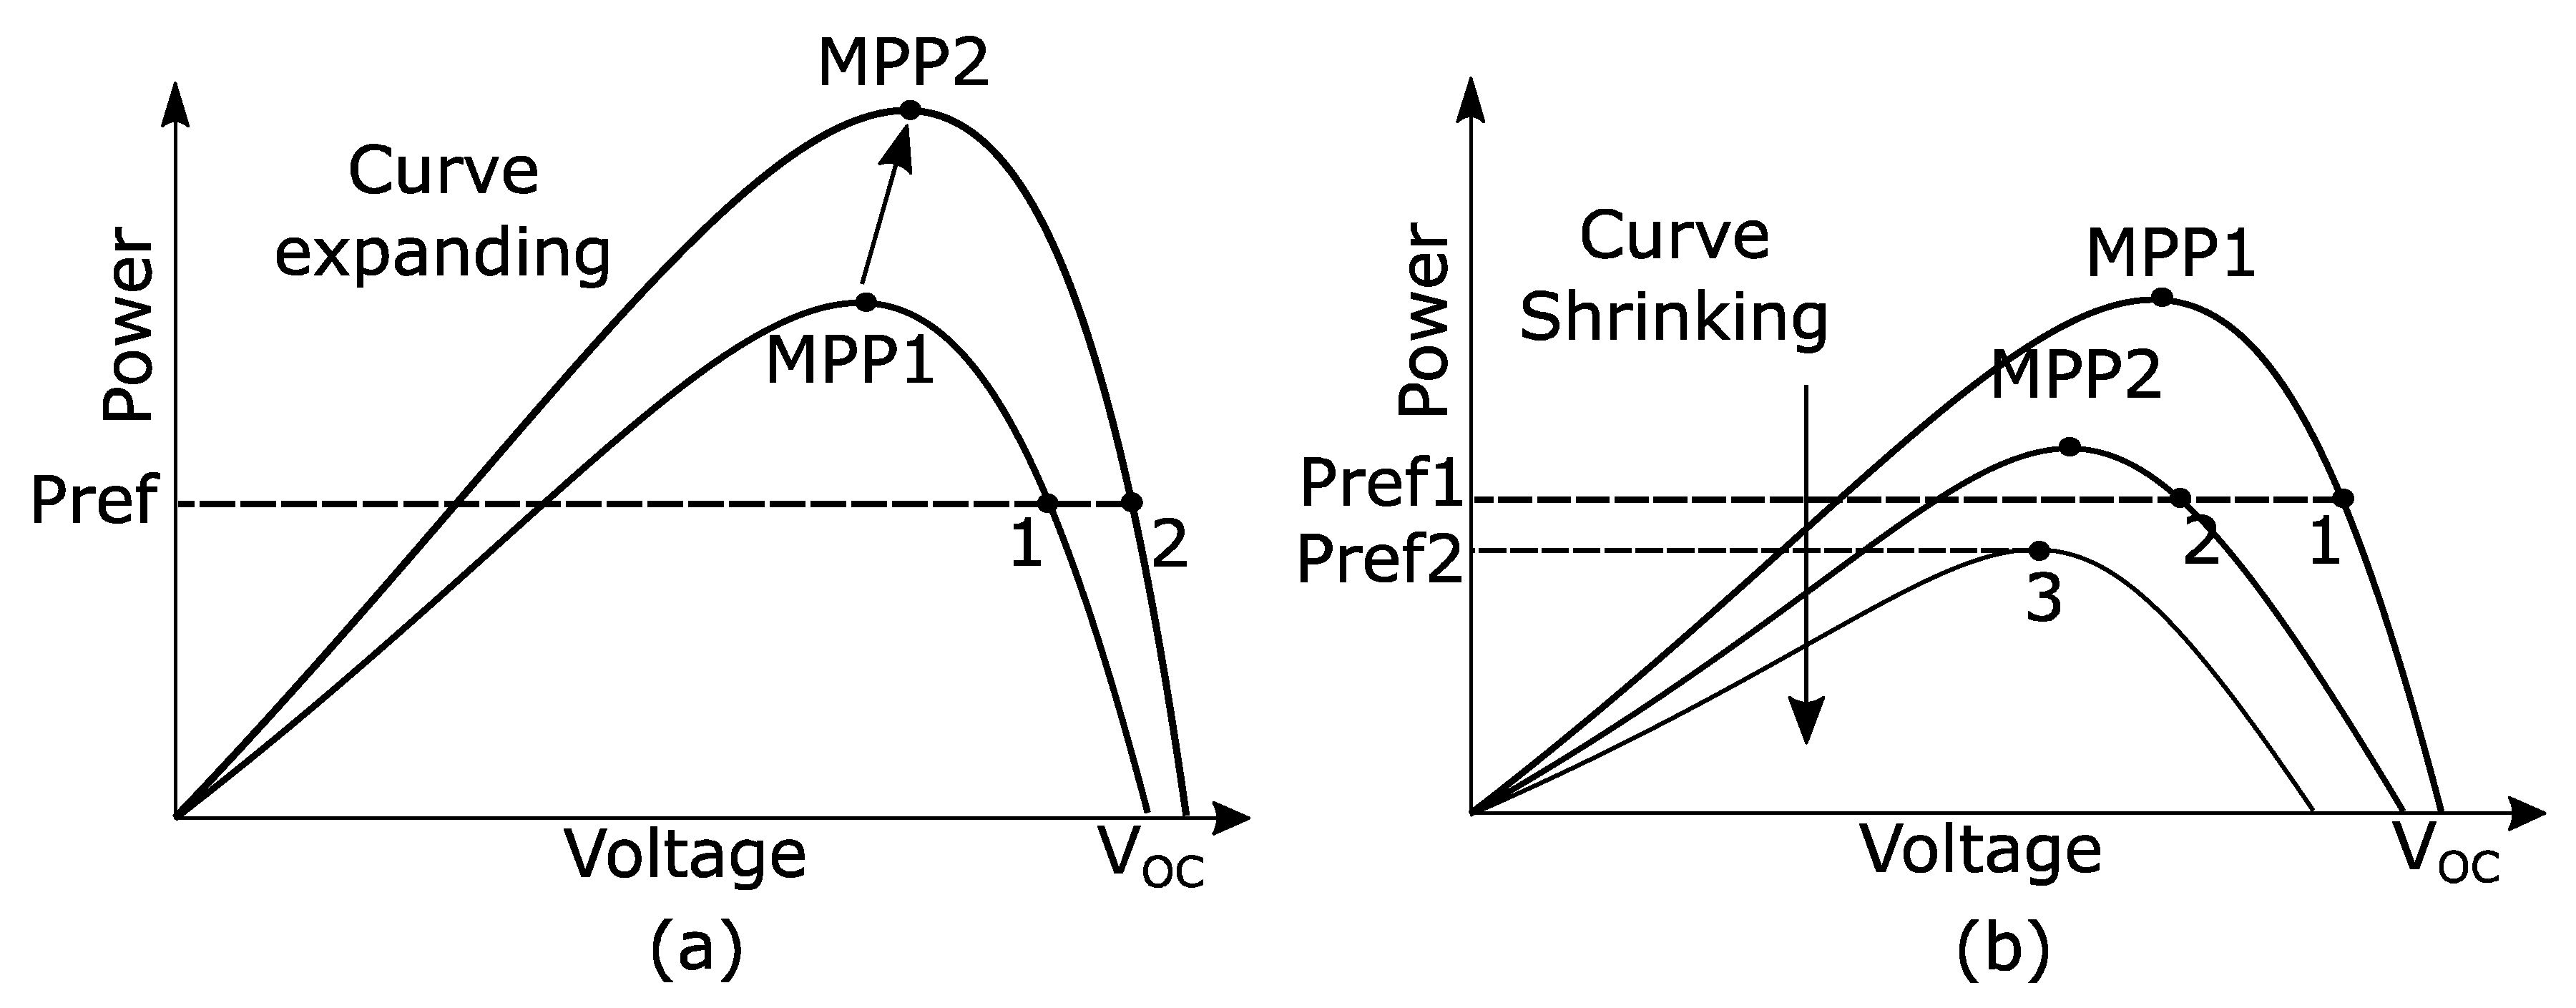
2. Problem Analysis and Overview of Proposed Control

The problem of voltage rise in high PV penetrated low voltage distribution system arises because of the high value of R/X ratio. The high value of this ratio causes a direct dependency of system voltages on the active power of the system. Whereas for high voltage (HV) transmission system, the value of ratio R/X is low, therefore the dependency of voltages is only on the reactive power of the system. The phenomenon can be illustrated by using the network shown in Figure 1.
With the line impedance of R + j X , the voltage difference between sending and receiving end can be expressed as:
Δ V = I ( R + j X ) = ( P + j Q ) * V R ( R + j X ) = P R + Q X V R + j P X Q R V R
For high voltage transmission system, the value of R/X is low, therefore, resistance effect can be ignored in Equation (1):
Δ V = Q X V R + j P X V R
Neglecting the imaginary part, Equation (2) transforms to:
Δ V Q X V R
Whereas, for LV distribution systems, the resistance cannot be ignored because of high value of R/X ration, Equation (1) transforms to:
Δ V P R + Q X V R
A close observation of Equations (3) and (4) depicts that for HV transmission systems, the voltage dependency is largely on the reactive power, whereas for LV distribution systems there is a direct dependency of system voltages on the active power. For LV distribution systems, the control of active power, reactive power or both can be practiced to control the system voltages.
Due to the reasons mentioned in Section 1, active power of the PV system is controlled in our proposed method to regulate the feeder voltages at the end of the line. The de-rating control method of PV systems is used here to control the active power of PVs at the dc/dc conversion stage. In de-rating control of PV systems, the operating point of PVs is not limited to only maximum power point (MPP); the PVs can be operated above or below MPP to control the flow of active power. Figure 2 depicts the de-rating regions on the power versus voltage (PV) curve of PVs. The region on the left side of MPP has a wider control area as compared to right side, however, in this region the rate of change of active power (ΔP) with system voltage (ΔV) is low. Therefore, the right side region is selected in our method because of convenience of high P V ratio. For precise control of ΔP with ΔV, the left side region is more suitable.
The de-rating technique of PVs is a well-used technique; a neural network based reserve generation algorithm was used in [31] for de-rating the PVs, and a Newton-quadratic interpolation algorithm was used in [32,33]. A PI controller for de-rating method was used in [34], and a fuzzy logic controller based de-rating scheme was discussed in [35,36,37]. However, in these techniques the PV system is de-rated with the aim to achieve frequency regulation capabilities, whereas in our proposed control de-rating is used to compensate the overvoltage at the line end. The feeder voltages are sensed and de-rating control is coordinated with the sensed voltages. For example, if the voltages on bus 2 of Figure 1 are above the rated value, the PV voltages are pushed above the maximum power point voltages V m p p to control the flow of active power in the distribution system. The detailed control is discussed in Section 3 of the paper.

3. De-Rating Based Voltage Control

The description of the model is given in Section 3.1 and the detailed discussion on the proposed voltage control algorithm (VCA) which de-rates the PVs is given in Section 3.2.

3.1. Description of the Model

The proposed control was implemented on a LV distribution system as shown in the Figure 3. Three buses ( B 1 , B 2 , and B 3 ) are considered in the system with corresponding voltages ( V 1 , V 2 , and V 3 , respectively). The system is connected to the utility grid using a step-up transformer. Two PV generators are considered in the system which are connected to bus B 1 and B 2 . Load L 3 is a variable load whereas loads L 1 and L 2 are the fixed load in the system. Normally the overvoltage problem arises at the end of the line, therefore, voltage V 3 is controlled by varying the active power generation of PV generators. The detailed rating and values of the parameters are given in the Appendix A of the paper.

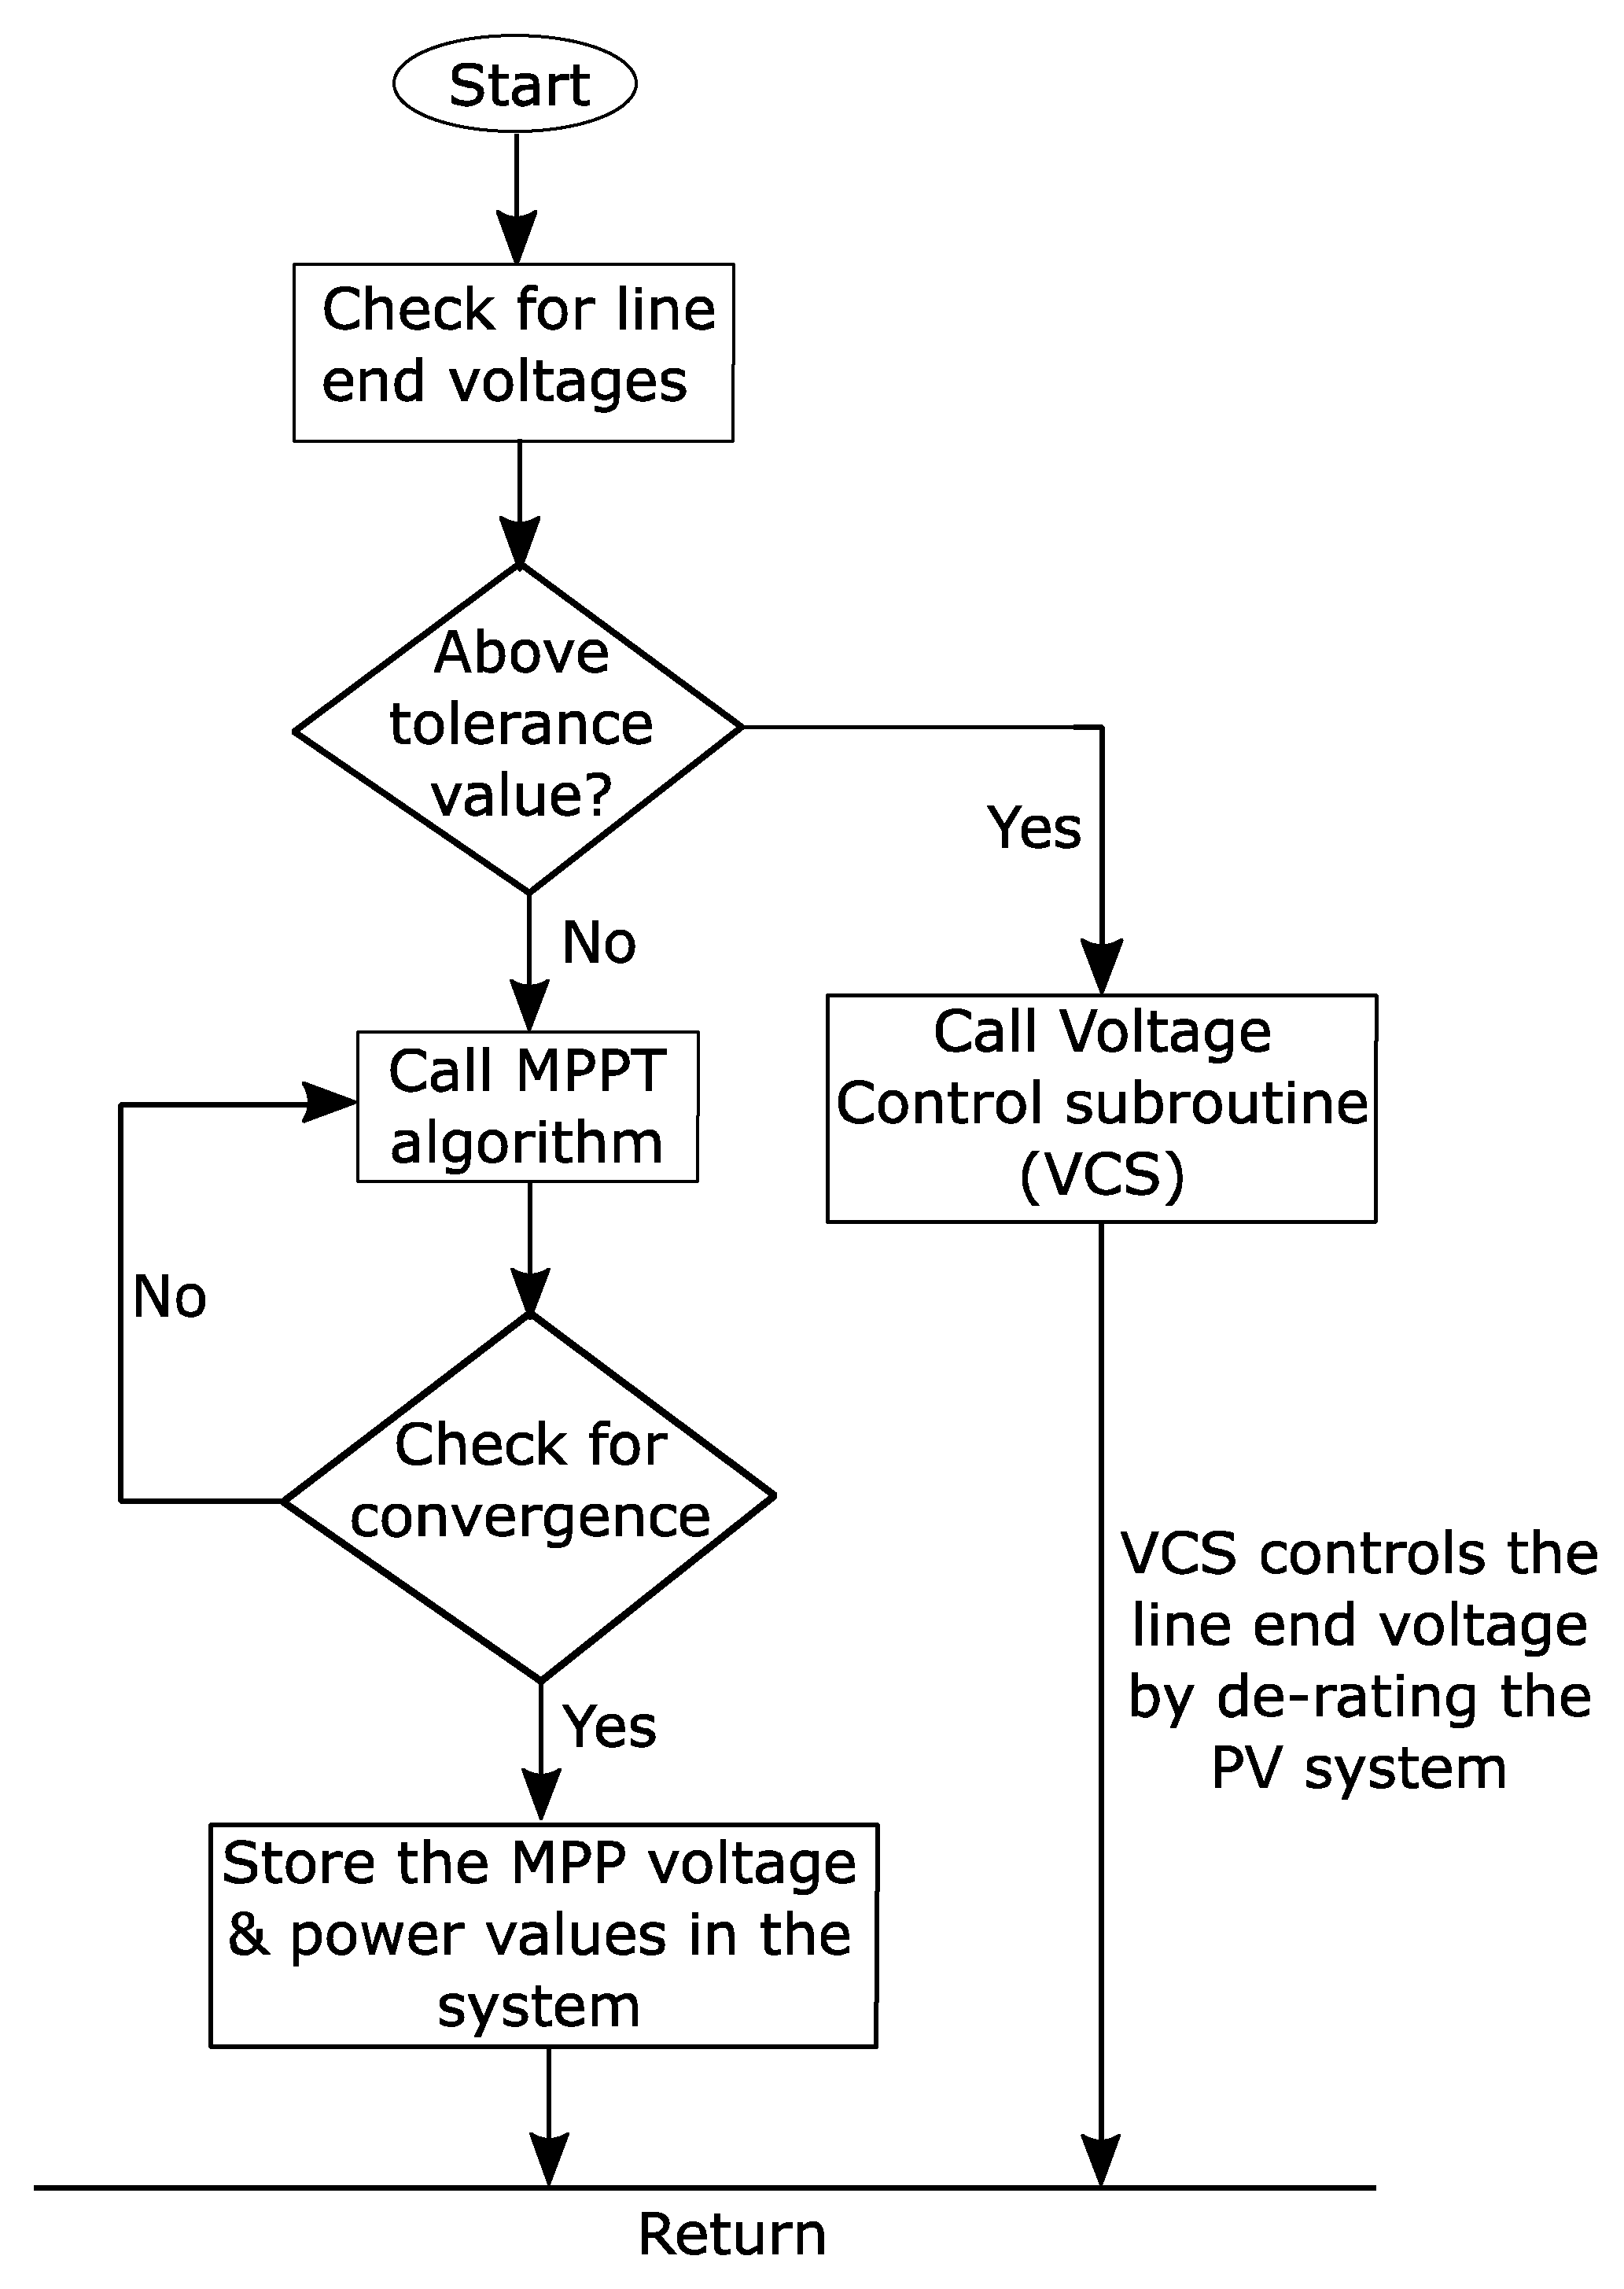
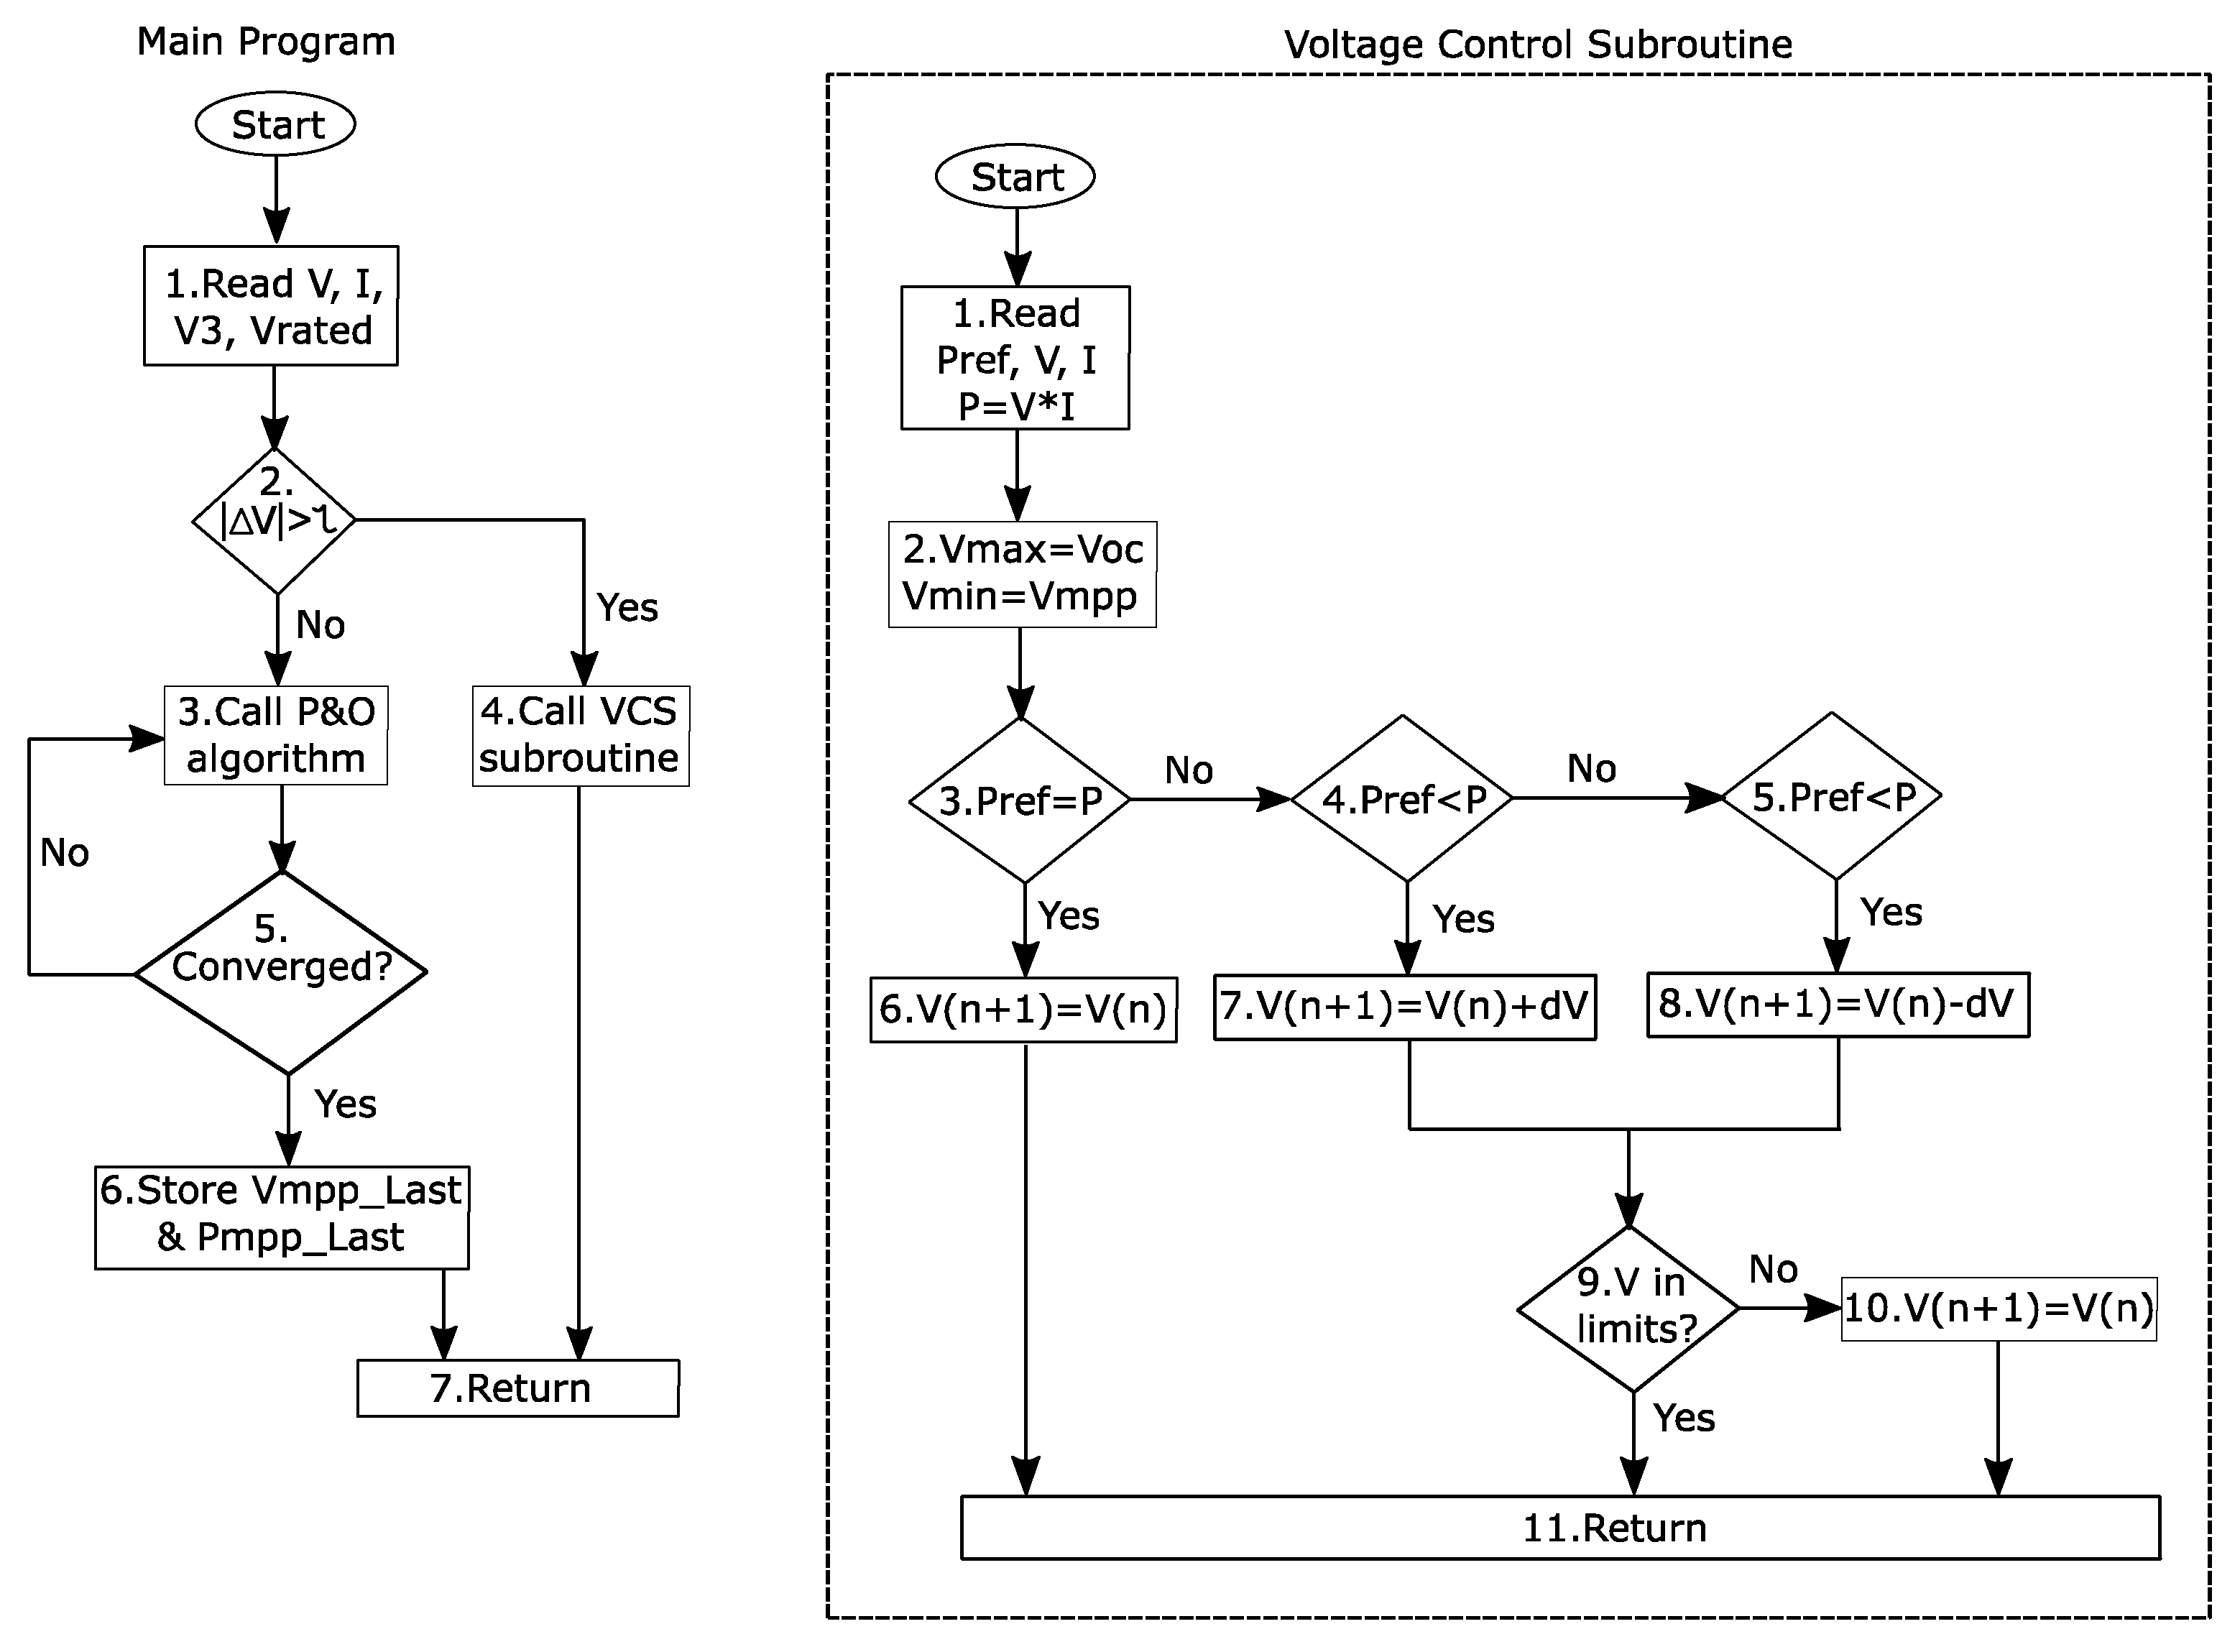
3.2. Voltage Control Algorithm

A detailed insight of the control is shown in Figure 4. A two-stage control is adopted for the PV system, wherein a step-up chopper is used for stage-I and a three-phase dc to ac inverter is used in stage-II. A simple d-q transformation-based control is adopted for the generation of PWM of the three phase inverter. For dc/dc converter, the end-of-line voltages V 3 are continuously sensed to control the output power flow of PV generator. The de-rating based voltage control algorithm (VCA) is used here to increase or decrease the active power flow from the PVs. The flowchart of the proposed control is shown in Figure 5. The steps involved in the control technique are: (1) checking of the line end voltages for limits violation, (2) calling MPPT or voltage control subroutine (VCS), and (3) storing the MPP values for MPPT or controlling the line end voltages for VCS. The detailed algorithm is shown in Figure 6. The algorithm has two main parts: Main program and Voltage control subroutine (VCS). In the main program, the system rated voltages are compared with the voltages of bus 3:
V = V 3 V r a t e d
If the value of V is below the set tolerance value, the traditional P and O algorithm [38] is called to trace the MPP. After convergence, the information of the MPP, i.e., corresponding voltage and power values, are stored in the system. When V exceeds the tolerance value τ, the voltage control subroutine is called to bring the system voltages back to rated. In VCS, the maximum and minimum voltage limits are set as PV open circuit voltage ( V O C ) and MPP voltage ( V M P P ), respectively. These voltage limits are set to de-rate the PV in the de-rating-region-I on the PV voltage curve; this region is shown in Figure 2. The PV power ( P ) is compared with the set reference power ( P r e f ); the value of P r e f should be below the P m p p to de-rate the PV system. Here P r e f is obtained from the voltage droop control (VDC). The mathematical expression is given as:
P r e f = P m p p ( 1 k V )
In this expression, the value of P r e f is restricted between 100 kW and 60 kW. These limits help in restraining the maximum de-rating of the PV to 60% of the rated capacity. The approximate range of k is obtained from the power versus voltage droop characteristics curve (shown in Appendix A). If P > P r e f , PV voltages are incremented with a step size of dV to achieve the required power value. Else if P < P r e f , the voltages are decremented to match the power levels. Post these two comparisons, the system voltages are checked for limits violations; if violation occurs, increment or decrement of the last step is rolled back. When P = P r e f , the PV is operated at the last step voltage.
Note: During the operation of voltage control subroutine in VCA, the irradiance and temperature conditions of the PVs may change. If the irradiance increases, the PV curve will expand, however, the value of P r e f will remain fixed because it is dependent on the last stored value of P m p p (Equation (6)). Therefore, the system will maintain the required voltage profile. Similarly, if irradiance decreases, the PV curve will shrink but the P r e f will remain fixed. However, a condition may prevail where the value of P r e f overshoots P m p p ; in this case the system will operate at maximum possible power P m p p , therefore maintaining the best possible voltage profile. These two scenarios are shown in Figure 7.

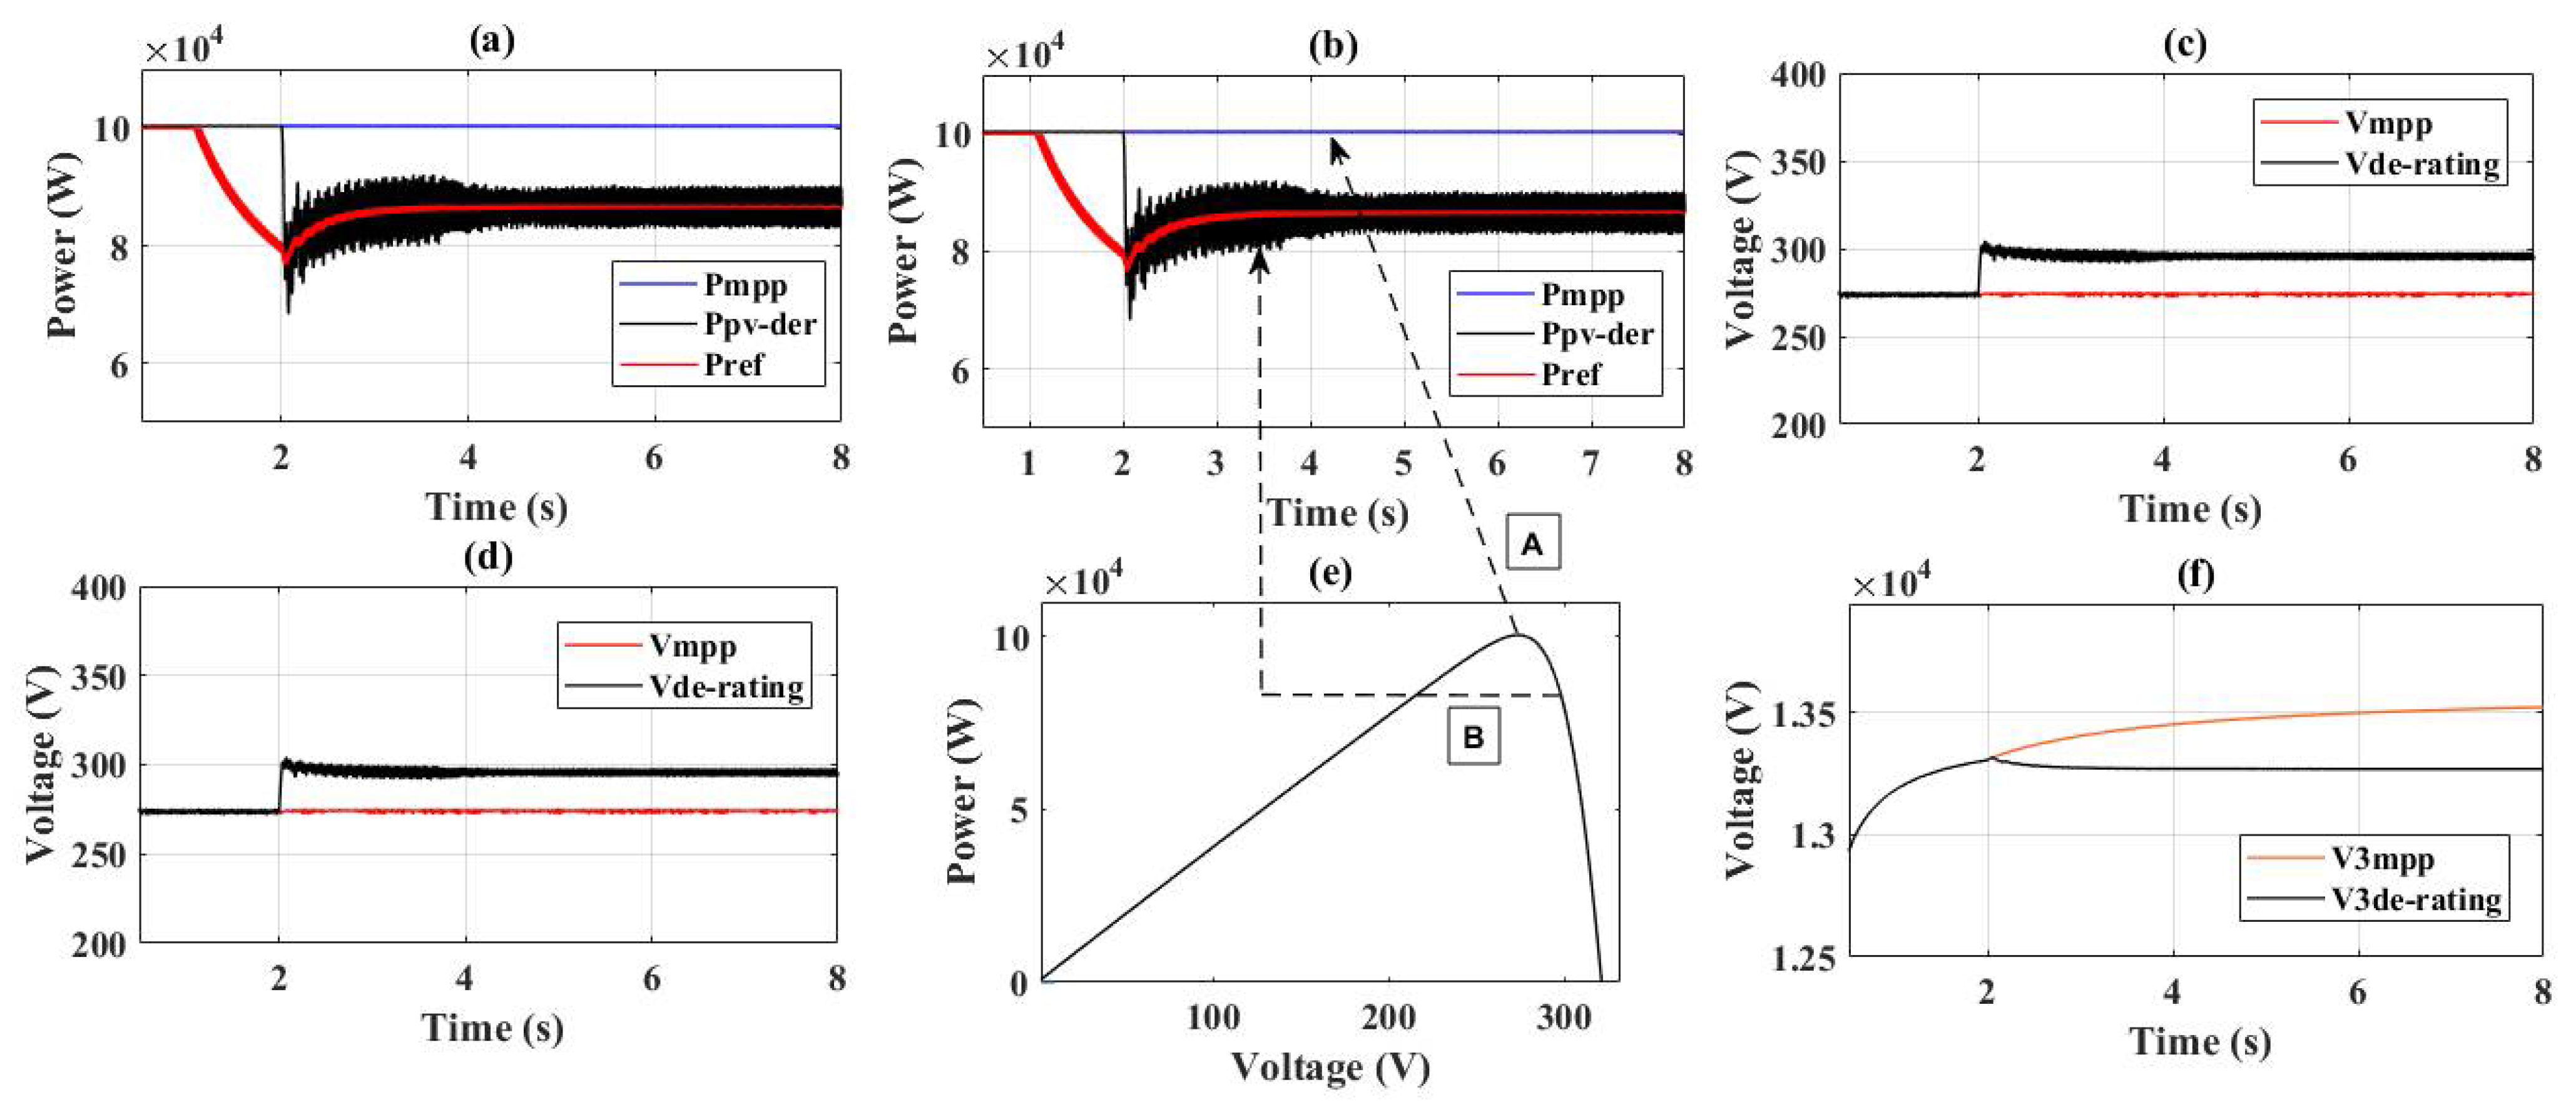
4. Simulation Results

To inspect the performance of the developed controls, the model of Figure 3 was simulated under two cases. In case-I, the operating conditions of the PV generators, i.e., the level of irradiance and ambient temperature were kept as constant and a significant amount of load was removed from the system. In case-II, the system load was kept as constant and irradiance was increased gradually. The detailed explanation of the simulation results for these two cases is given below and the details of the system parameters are given in the Table A1 of the Appendix A.

4.1. Case-I: Variable Load and Fixed Irradiance Levels

In this case, initially the load L3 on bus 3 (Figure 3) was 120 kW, and half of this load was removed from the system at t = 2 s. No change is made in the irradiance or temperature; the irradiance level was set at 1000 W/m2 and temperature at 25 °C. The simulation results for this case are given in Figure 8. To verify the performance of the proposed control, the PV system was operated with MPPT control and with the proposed VCA control. For operation in MPPT mode, upon load change, the PV system kept on following the maximum power (Figure 8a). This operating point is represented with “A” on the PV curve of the PVs (Figure 8e). The continuous MPPT operation led to an increase in the end of line voltage V 3 beyond the rated value, as shown in Figure 8f. When PVs were operated in the VCA mode, upon the increase in the voltage V 3 , the PV system was de-rated by increasing its voltage above MPP voltage (operation on point “B” in Figure 8e). P r e f is the reference power obtained from the voltage droop controller; a comparison of P r e f with the actual PV power in de-rating mode is shown in Figure 8a,b. This de-rating of the system led to a control in the terminal voltage V 3 ; a comparison of V 3 waveform (RMS value) with PV system operation in MPPT and de-rating mode in shown in Figure 8f. The voltage waveform of PV generator is shown in Figure 8c,d, the PV system voltages were increased above the MPP voltage to de-rate the PVs. The numerical data of this case simulation is given in Table 2.

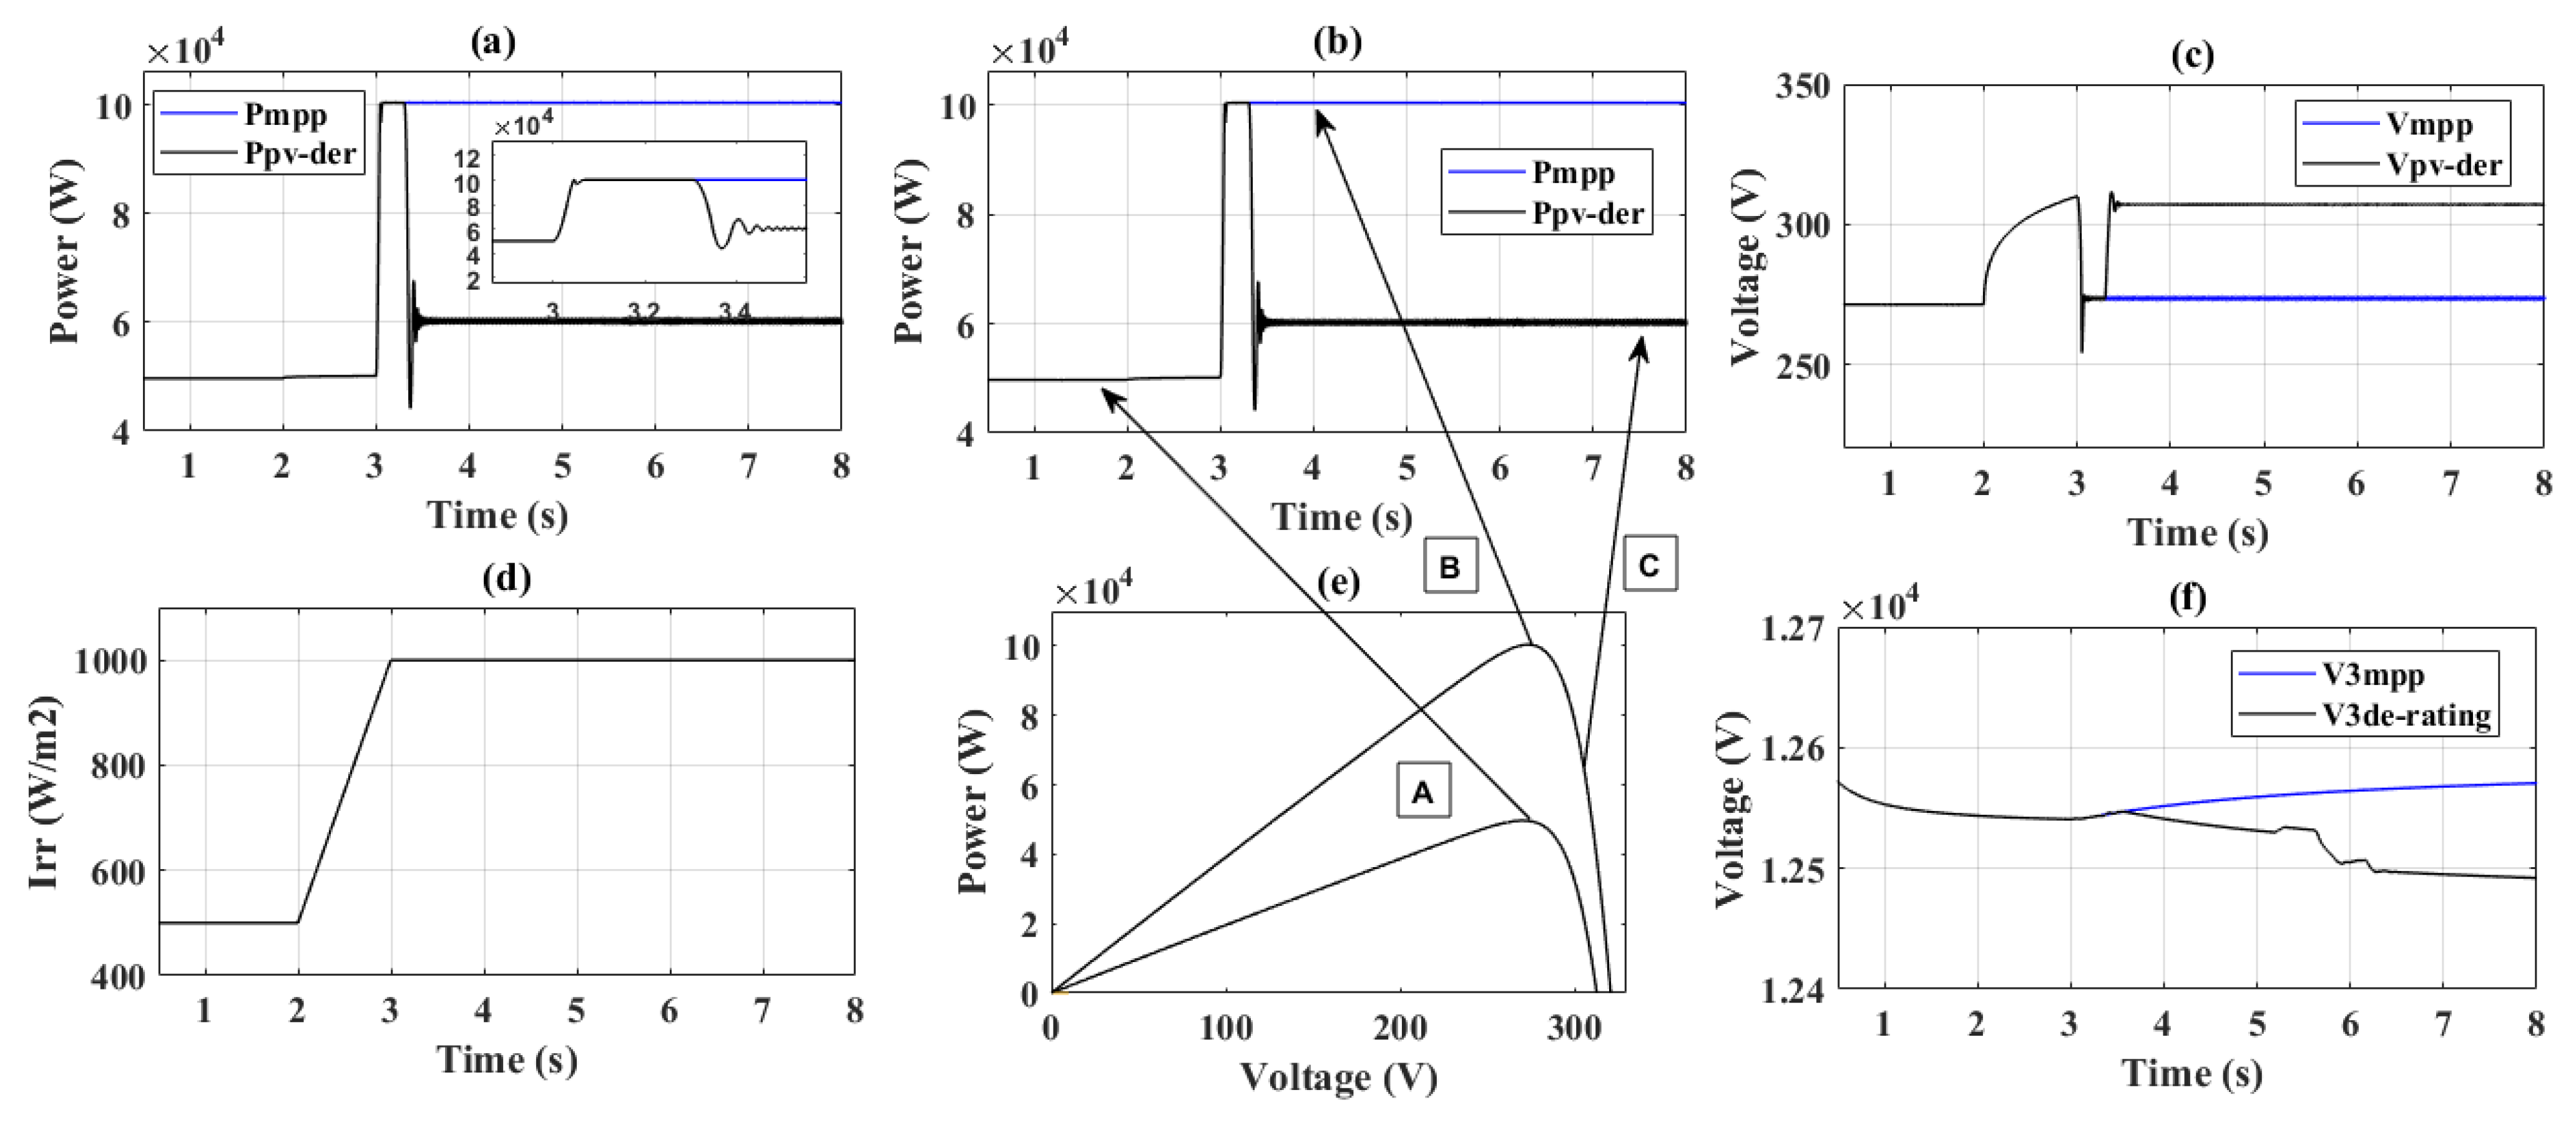
4.2. Case-II: Fixed Load and Variable Irradiance

In this case the value of irradiance was increased from 500 W/m2 to 1000 W/m2 from t = 2 s to t = 3 s, respectively (Figure 9d), while the system load was kept constant. The simulation results for this case are depicted in Figure 9. With the increase in the irradiance from 500 to 1000 W/m2, the maximum available PV power increased from 48 kW to 100 kW (Figure 9a) and the operating point of PV shifted from “A” to “B” on the PV curve (Figure 9e). Post irradiance change, for MPPT mode, the system operated on point “B” and the voltage V 3 started increasing, while for operation in de-rating based VCA mode, upon an increase in the voltage V 3 beyond a predetermined level, the system was de-rated with operation on point “C” on the PV curve (Figure 9e). Due to this de-rating the voltage V 3 remained within the prescribed limit. A comparison of the V 3 waveform (RMS value) with PV system operation in MPPT and de-rating mode is shown in Figure 9f. The numerical data of this case simulation is given in Table 3.

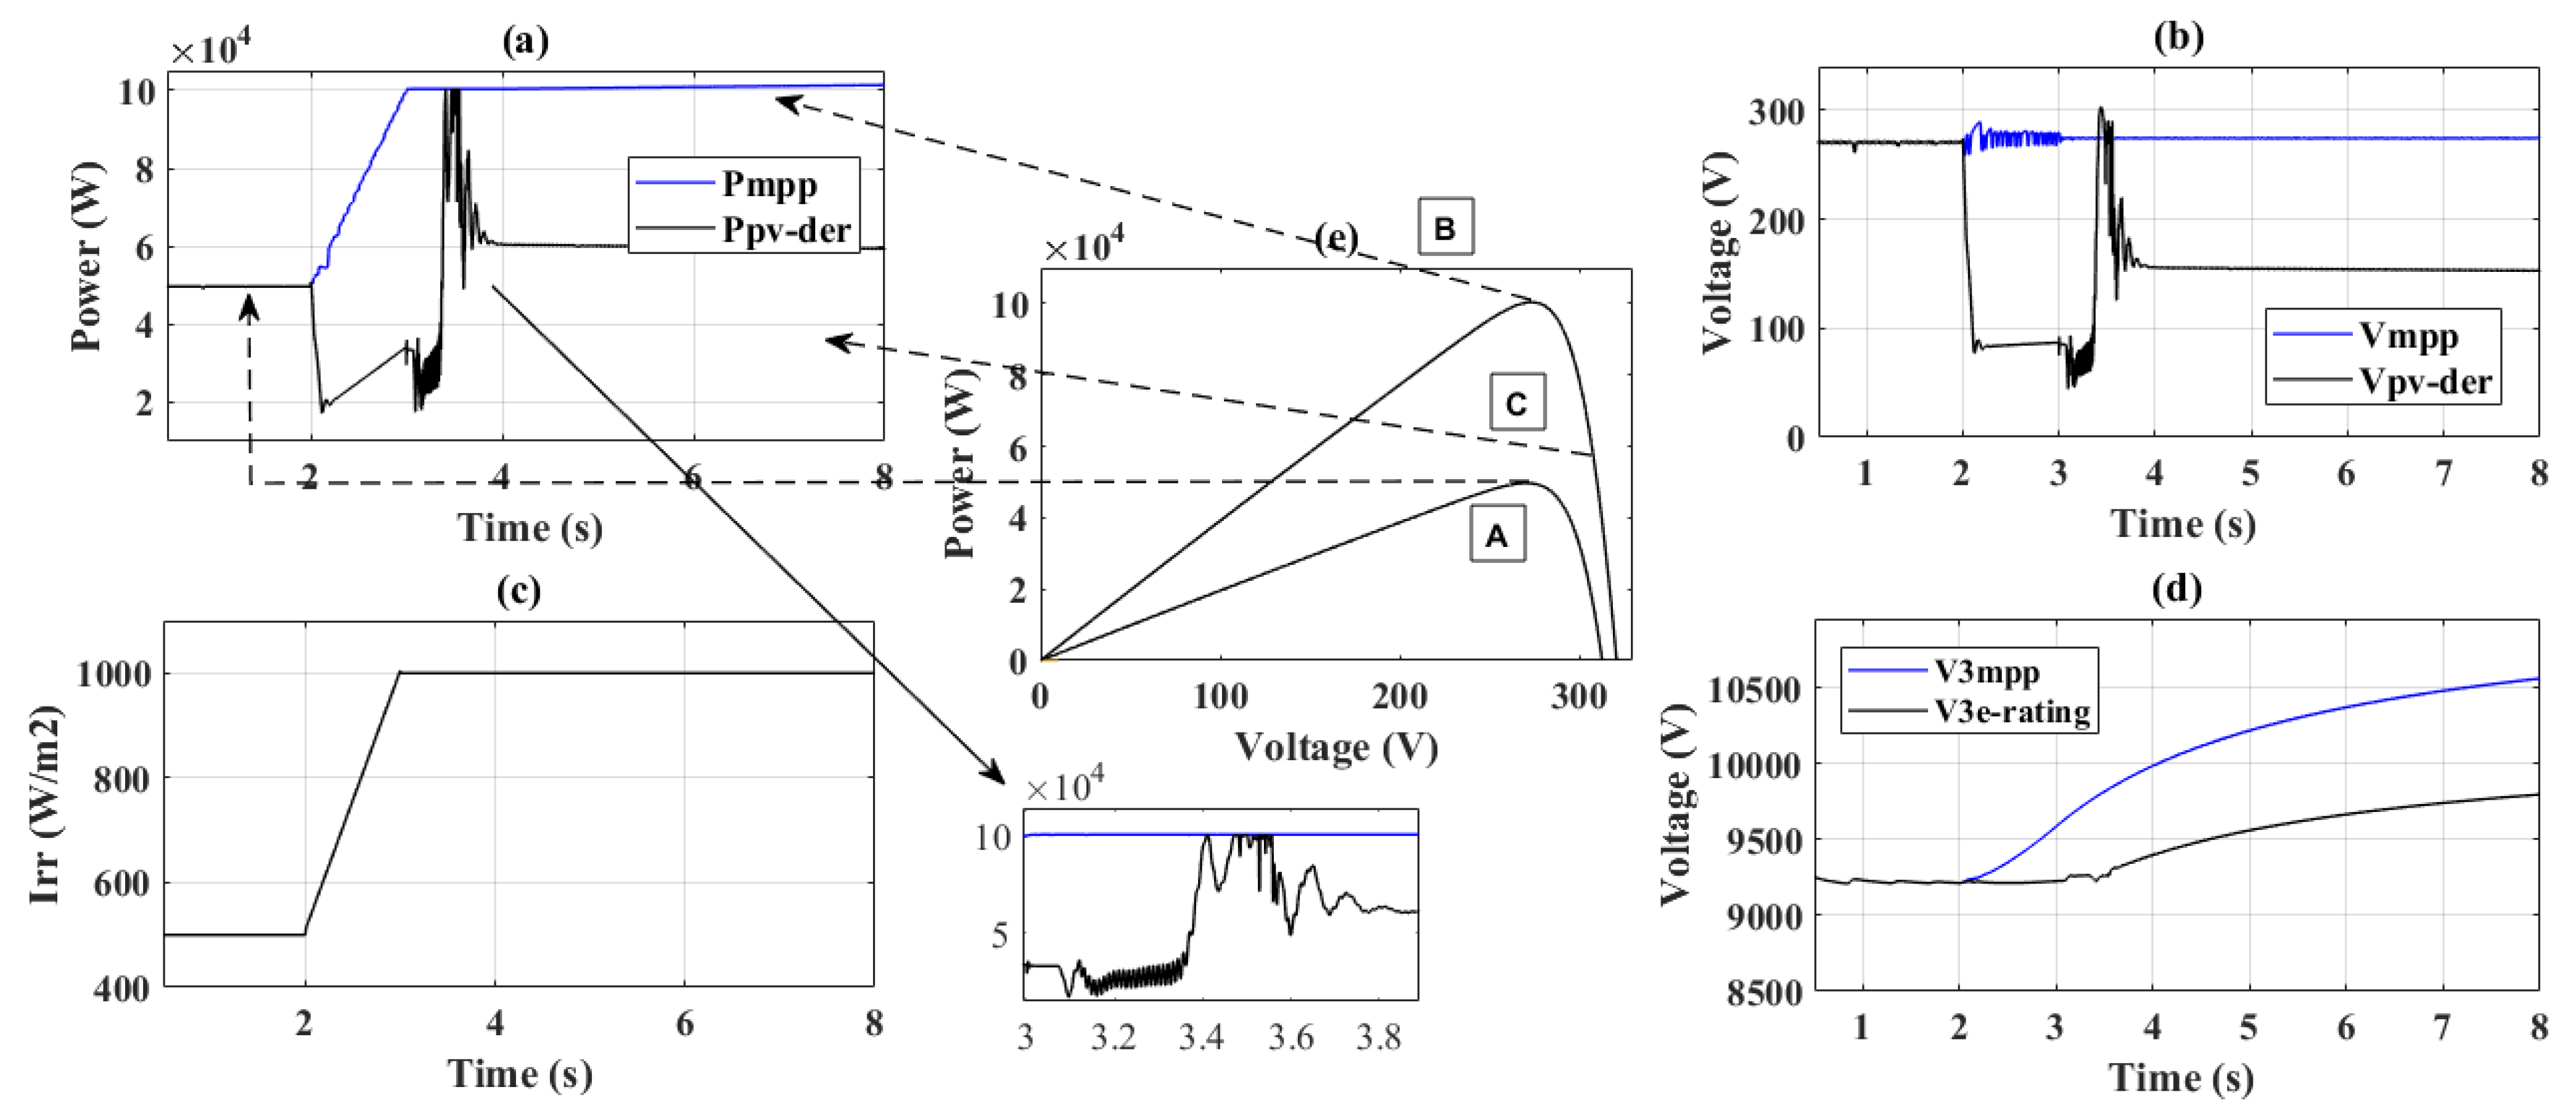
4.3. Case-III: Variable Load and Variable Irradiance

Here, both the irradiance and system load were varied to illustrate the operation of the voltage control algorithm. The value of irradiance was increased from 500 W/m2 to 1000 W/m2 (Figure 10c) from t = 2 s to t = 3 s, and the system load was also dropped from 40 kW (50 kVA, p.f. 0.8) to 20 kW during this time period. The simulation results for this case are given in Figure 10. With the increase in the irradiance, the PV power shot to 100 kW from the previous level of 48 kW (Figure 10a); this is depicted in Figure 10e (operating point shifts from point “A” to “B”). For MPPT operation, the system operated at point “B”, whereas for VCA mode operation, the system was de-rated to point “C” on the PV curve (Figure 10e). A comparison of the line end voltage V 3 for operation in two modes is given in Figure 10d. The difference between the two waveforms was higher for this case because of the increase in irradiance as well as the drop in the load. System voltage profile is given in Figure 10b. The numerical data of this case is given in Table 4.

5. Conclusions

To mitigate the problem of voltage rise in PV-rich LV distribution systems under lightly loaded conditions, a de-rating based voltage control algorithm is proposed in this paper. Unlike the rest of the active power control techniques for overvoltage mitigation, this technique is much simpler because of its implementation at the dc/dc converter stage of PV system. De-rating technique in PVs is generally used for enabling frequency regulation response in PVs, however, here, de-rating control is coordinated with the system voltages to limit the voltage variations. The simulation results depict that upon an increase in system voltage above nominal, the PV system is de-rated by increasing the PV voltages above MPP voltage, which aids in controlling the magnitude of end-of-line voltage. For variable load and fixed irradiance case, the de-rating control reduces the overvoltage by 200 V, by 50 V for the case of fixed load and variable irradiance, and by 700 V for the case of variable load and variable irradiance. For future works, artificial neural networks can be integrated with the control to overcome the time-delays in the control.

Author Contributions

Data curation, P.V.; Formal analysis, N.K., A.M. and J.L.W.; Funding acquisition, B.S. and J.L.W.; Investigation, N.K., S.C. and A.B.; Methodology, P.V. and B.S.; Project administration, B.S. and A.M.; Resources, S.C. and J.L.W.; Software, A.M. and A.B.; Validation, A.B.; Visualization, A.B.; Writing—original draft, P.V. and B.S.; Writing—review & editing, A.M. All authors have read and agreed to the published version of the manuscript.

Funding

This research received no external funding.

Institutional Review Board Statement

Not applicable.

Informed Consent Statement

Not applicable.

Data Availability Statement

There are no available data to be stated.

Conflicts of Interest

The authors declare no conflict of interest.

Nomenclature

AbbreviationDescription
PVPhotovoltaic
RPCReactive power control
APCActive power control
LVLow voltage
PVPower versus Voltage
MPPMaximum power point
MPPTMaximum power point tracking
VCSVoltage control subroutine
VCAVoltage control algorithm
VariablesDescription
PActive power
QReactive power
VratedRated voltage
PrefReference power
VmppMaximum power point voltage
V3Line end voltage
VOCOpen circuit voltage
PmppMaximum power point power

Appendix A

Figure A1. Power versus voltage droop characteristics curve, k = 1 100 × ( P m a x P m i n V m a x V m i n ) , P m a x = 100   kW , P m i n = 60   kW , V m a x = 25   kV , V m i n = 20   kV .
Energies 15 05901 g0a1
Table A1. System rating and parameter values.
LV Distribution SystemPV System
Load L1P2 kWPV array 1 and 2PMPP100 kW
Q0VMPP260 V
Vrms/pp25 kVISC400 A
Load L2P2 kWVOC320 V
Q0Dc/dc converterPV side capacitor100 µF
Vrms/pp25 e3Inverter side capacitor6000e µF
Load L3P60 kWInductor5 mH
Q4 k VarPV side T/F 1 and 2kVA100
Vrms/pp25 kVVP260 V
Grid side T/FkVA200VS25 kV
VP20 kVVoltage droop controlk0.002
VS25 kV

References

  1. Jahangiri, P.; Aliprantis, D.C. Distributed volt/VAr control by PV inverters. IEEE Trans. Power Syst. 2013, 28, 3429–3439. [Google Scholar] [CrossRef]
  2. Long, C.; Ochoa, L.F. Voltage control of PV-rich LV networks: OLTC-fitted transformer and capacitor banks. IEEE Trans. Power Syst. 2016, 31, 4016–4025. [Google Scholar] [CrossRef]
  3. Klonari, V.; Toubeau, J.F.; Vandoorn, T.L.; Meersman, B.; de Grève, Z.; Lobry, J.; Vallée, F. Probabilistic framework for evaluating droop control of photovoltaic inverters. Electr. Power Syst. Res. 2015, 129, 1–9. [Google Scholar] [CrossRef]
  4. Bozalakov, D.V.; Laveyne, J.; Desmet, J.; Vandevelde, L. Overvoltage and voltage unbalance mitigation in areas with high penetration of renewable energy resources by using the modified three-phase damping control strategy. Electr. Power Syst. Res. 2019, 168, 283–294. [Google Scholar] [CrossRef]
  5. Su, X.; Masoum, M.A.; Wolfs, P.J. Optimal PV inverter reactive power control and real power curtailment to improve performance of unbalanced four-wire LV distribution networks. IEEE Trans. Sustain. Energy 2014, 5, 967–977. [Google Scholar] [CrossRef]
  6. Dall’Anese, E.; Dhople, S.V.; Johnson, B.B.; Giannakis, G.B. Optimal dispatch of photovoltaic inverters in residential distribution systems. IEEE Trans. Sustain. Energy 2014, 5, 487–497. [Google Scholar] [CrossRef]
  7. Alam, M.J.; Muttaqi, K.M.; Sutanto, D. A multi-mode control strategy for VAr support by solar PV inverters in distribution networks. IEEE Trans. Power Syst. 2015, 30, 1316–1326. [Google Scholar] [CrossRef]
  8. Samadi, A.; Eriksson, R.; Rawn, B.; Söder, L. Coordinated active power-Dependent voltage regulation in distribution grids with PV systems. IEEE Trans. Power Deliv. 2014, 29, 1454–1464. [Google Scholar] [CrossRef]
  9. Olivier, F.; Aristidou, P.; Ernst, D.; Cutsem, T.V. Active management of low-Voltage networks for mitigating overvoltages due to photovoltaic units. IEEE Trans. Smart Grid 2016, 7, 926–936. [Google Scholar] [CrossRef]
  10. Ali, M.M.V.M.; Babar, M.; Nguyen, P.H.; Cobben, J.F. Overlaying control mechanism for solar PV inverters in the LV distribution network. Electr. Power Syst. Res. 2017, 145, 264–274. [Google Scholar] [CrossRef]
  11. Haaque, A.N.; Nguyen, P.H.; Vo, T.H.; Bliek, F.W. Agent-based unified approach for thermal and voltage constraint management in LV distribution network. Electr. Power Syst. Res. 2017, 143, 462–473. [Google Scholar] [CrossRef]
  12. Tonkoski, R.; Lopes, L.A.C.; El-fouly, T.H.M. Coordinated active power curtailment of grid connected PV inverters for overvoltage prevention. IEEE Trans. Sustain. Energy 2011, 2, 139–147. [Google Scholar] [CrossRef]
  13. Collins, L.; Ward, J.K. Real and reactive power control of distributed PV inverters for overvoltage prevention and increased renewable generation hosting capacity. Renew. Energy 2015, 81, 464–471. [Google Scholar] [CrossRef]
  14. Mai, T.T.; Haque, A.N.M.M.; Vo, T.; Nguyen, P.H. Coordinated active and reactive power control for overvoltage mitigation in physical LV microgrids. In Proceedings of the 2018 International Conference on Renewable Power Generation, Barcelona, Spain, 25–27 April 2018; pp. 1–6. [Google Scholar]
  15. Mousavi, S.Y.M.; Jalilian, A.; Savaghebi, M.; Guerrero, J.M. Coordinated control of multifunctional inverters for voltage support and harmonic compensation in a grid-connected microgrid. Electr. Power Syst. Res. 2018, 155, 254–264. [Google Scholar] [CrossRef]
  16. Ali, M.M.V.M.; Nguyen, P.H.; Kling, W.L.; Chrysochos, A.I.; Papadopoulos, T.A.; Papagiannis, G.K. Fair power curtailment of distributed renewable energy sources to mitigate overvoltages in low-voltage networks. In Proceedings of the IEEE PES Power Tech 2015 Eindhoven, Eindhoven, The Netherlands, 29 June–2 July 2015. [Google Scholar] [CrossRef]
  17. Weckx, S.; Gonzalez, C.; Driesen, J. Combined central and local active and reactive power control of PV inverters. IEEE Trans. Sustain. Energy 2014, 5, 776–784. [Google Scholar] [CrossRef]
  18. Alyami, S.; Wang, Y.; Wang, C.; Zhao, J.; Zhao, B. Adaptive real power capping method for fair overvoltage regulation of distribution networks with high penetration of PV systems. IEEE Trans. Smart Grid 2014, 5, 2729–2738. [Google Scholar] [CrossRef]
  19. Ghasemi, M.A.; Parniani, M. Prevention of distribution network overvoltage by adaptive droop-based active and reactive power control of PV systems. Electr. Power Syst. Res. 2016, 133, 313–327. [Google Scholar] [CrossRef]
  20. Mai, T.T.; Haque, A.N.M.M.; Nguyen, P.H. Consensus-Based Distributed Control for Overvoltage Mitigation in LV Microgrids. In Proceedings of the IEEE PES Powertech 2019 Milano, Milano, Italy, 23–27 June 2019. [Google Scholar]
  21. Mai, T.T.; Haque, A.N.M.M.; Vergara, P.P.; Nguyen, P.H.; Pemen, G. Adaptive coordination of sequential droop control for PV inverters to mitigate voltage rise in PV-Rich LV distribution networks. Electr. Power Syst. Res. 2021, 192, 106931. [Google Scholar] [CrossRef]
  22. Demirok, E.; Gonz´alez, P.C.; Frederiksen, K.H.; Sera, D.; Rodriguez, P.; Teodorescu, R. Local reactive power control methods for overvoltage prevention of distributed solar inverters in low-voltage grids. IEEE J. Photovoltaics 2011, 1, 174–182. [Google Scholar] [CrossRef]
  23. Zhang, Z.; Dou, C.; Yue, D.; Zhang, B.; Zhao, P. High-economic PV power compensation algorithm to mitigate voltage rise with minimal curtailment. Electr. Power Syst. Res. 2021, 125, 106401. [Google Scholar] [CrossRef]
  24. Farooqi, A.; Othman, M.M.; Radzi, M.A.M.; Musirin, I.; Noor, S.Z.M.; Abidin, I.Z. Dynamic voltage restorer (DVR) enhancement in power quality mitigation with an adverse impact of unsymmetrical faults. Energy Rep. 2022, 8, 871–882. [Google Scholar] [CrossRef]
  25. Gholami, K.; Islam, M.R.; Rahman, M.M.; Azizivahed, A.; Fekih, A. State-of-the-art technologies for volt-var control to support the penetration of renewable energy into the smart distribution grids. Energy Rep. 2022, 8, 8630–8651. [Google Scholar] [CrossRef]
  26. Leon, J.A.; Palacios, C.C.; Salgado, C.V.; Perez, E.H.; Garcia, E.X.M. Particle Swarm Optimization, Genetic Algorithm and Grey Wolf Optimizer Algorithms Performance Comparative for a DC-DC Boost Converter PID Controller. Adv. Sci. Technol. Eng. Syst. J. 2021, 6, 619–625. [Google Scholar] [CrossRef]
  27. Leon, J.A.; Palacios, C.C.; Salgado, C.V.; Perez, E.H.; Garcia, E.X.M. Optimal PID Parameters Tunning for a DC-DC Boost Converter. In Proceedings of the 2020 IEEE Conference on Technology for Sustainability (SusTech), Santa Ana, CA, USA, 23–25 April 2020. [Google Scholar]
  28. Chaudhary, P.; Rizwan, M. Voltage regulation mitigation techniques in distribution system with high PV penetration: A review. Renew. Sustain. Energy Rev. 2018, 82, 3279–3287. [Google Scholar] [CrossRef]
  29. Stetz, T.; Marten, F.; Braun, M. Improved low voltage grid-Integration of photovoltaic systems in germany. IEEE Trans. Sustain. Energy 2013, 4, 534–542. [Google Scholar] [CrossRef]
  30. Vergara, P.P.; Salazar, M.; Mai, T.T.; Nguyen, P.H.; Slootweg, H. A comprehensive assessment of PV inverters operating with droop control for overvoltage mitigation in LV distribution networks. Renew. Energy 2020, 159, 172–183. [Google Scholar] [CrossRef]
  31. Verma, P.; Kaur, T.; Kaur, R. Power control strategy of an integrated PV system for active power reserve under dynamic operating conditions. Sustain. Energy Technol. Assess. 2021, 45, 101066. [Google Scholar] [CrossRef]
  32. Xin, H.; Liu, Y.; Wang, Z.; Gan, D.; Yang, T. A new frequency regulation strategy for photovoltaic systems without energy storage. IEEE Trans. Sust. Energy 2013, 4, 985–993. [Google Scholar] [CrossRef]
  33. Liu, Y.; Xin, H.; Wang, Z.; Yang, T. Power control strategy for photovoltaic system based on the newton quadratic interpolation. IET Renew. Power Gen. 2014, 8, 611–620. [Google Scholar] [CrossRef]
  34. Zarina, P.P.; Mishra, S.; Sekhar, P.C. Exploring frequency control capability of a PV system in a hybrid PV-rotating machine-without storage system. Int. J. Elect. Power Energy Syst. 2014, 60, 258–267. [Google Scholar] [CrossRef]
  35. Rajan, R.; Fernandez, F.M. Power control strategy of photovoltaic plants for frequency regulation in a hybrid power system. Elect. Power Energy Syst. 2019, 110, 171–183. [Google Scholar] [CrossRef]
  36. Rajan, R.; Fernandez, F.M. Fuzzy based control of grid-connected photovoltaic system for enhancing system inertial response. In Proceedings of the 53rd International Universities Power Engineering Conference (UPEC), Glasgow, UK, 4–7 September 2018; pp. 1–6. [Google Scholar]
  37. Rajan, R.; Fernandez, F.M. Grid inertia based frequency regulation strategy of photovoltaic system without energy storage. In Proceedings of the International CET Conference on Control, Communication, and Computing (IC4), Trivandrum, India, 5–7 July 2018; pp. 106–111. [Google Scholar]
  38. Esram, T.; Chapman, P.L. Comparison of Photovoltaic Array Maximum Power Point Tracking Techniques. IEEE Trans. Energy Conv. 2007, 22, 439–448. [Google Scholar] [CrossRef]
Figure 1. Network structure.
Energies 15 05901 g001
Figure 2. De-rating regions on the PV curve.
Energies 15 05901 g002
Figure 3. Model of LV distribution system.
Energies 15 05901 g003
Figure 4. Detailed insight of the proposed control.
Energies 15 05901 g004
Figure 5. Flowchart of the control technique.
Energies 15 05901 g005
Figure 6. De-rating based voltage control algorithm.
Energies 15 05901 g006
Figure 7. (a) Depiction of reference and maximum power points during the expansion of PV curve. (b) Depiction of reference and maximum power points during the shrinking of PV curve.
Energies 15 05901 g007
Figure 8. Simulation results for the case of variable load and fixed irradiance for (a) PV generator 1 output power, (b) PV generator 2 output power, (c) PV generator 1 voltage waveform, (d) PV generator 2 voltage waveform, (e) PV curve of PVs, and (f) RMS waveform of voltage V 3 .
Energies 15 05901 g008
Figure 9. Simulation results for the case of fixed load and variable irradiance for (a) PV generator 1 output power, (b) PV generator 2 output power, (c) PV generator 1 voltage waveform, (d) irradiance waveform, (e) PV curves of PVs under irradiance of 500 W/m2 and 1000 W/m2 with fixed temperature value, and (f) RMS waveform of voltage V 3 .
Energies 15 05901 g009
Figure 10. Simulation results for the case of variable load and variable irradiance for (a) PV generator 1 output power, (b) PV generator 1 voltage waveform, (c) irradiance waveform, (d) RMS waveform of voltage V 3 , and (e) PV curves of PVs under the irradiance of 500 W/m2 and 1000 W/m2 with fixed temperature value.
Energies 15 05901 g010
Table 1. General comparison of voltage rise mitigation methods.
S. No.Ref. No.Adopted ControlPower
Controlled
(P or Q)
Implementation StageCritical RemarksYear of Publication
1[4]Modified damping based controlP (Active)Inverter
  • The implementation of the control leads to an 22% oversizing of the power electronic converter.
2019
2[5]Multi objective optimal power flowP and Q (both active and reactive)Inverter
  • The method is based on optimization.
  • The control lacks the illustration that how the active and reactive power can be controlled at converter level.
2014
3[6]Optimal inverter dispatch controlP and Q (both active and reactive)Inverter
  • Micro inverters are required to implement this control.
  • Micro inverter units shoot up the cost of the PV system.
2014
4[7]Reverse power flow based droop characteristic controlQ (Reactive)Inverter
  • The implementation will lead to a very complex design of the inverter.
2015
5[8]Active power dependent voltage regulationQ (Reactive)Inverter
  • The calculation burden of this methods is very high.
  • Actual implementation is complex.
2014
6[9]5-Mode distributed control schemeP and Q (both active and reactive)Inverter
  • Use of communication network b/w controllers increases the system cost.
  • The control scheme is bulky and complex.
2016
7[10]A power-voltage (P–V) droop control based overvoltage mitigationP (Active)Inverter
  • The TCP/IP communication links suggested in the method indicate towards a higher implementation cost.
2017
8[12]Droop based APCP (Active)Inverter
  • The method lacks the illustration of the implementation of controls on the converter level.
2011
9[13]P–V and Q-V conjunction controlP and Q (both active and reactive)Inverter
  • The implementation of the control may lead to bulky size of the inverter.
2015
10[15]Voltage support technique for VSIP and Q (both active and reactive)Inverter
  • Controlling both reactive and active power from PVs increases the design complexity of converter controls.
2018
11[16]Fairness power sharing algorithmP (Active)Inverter
  • The complexity of the method is high due to the usage of sensitive matrix-based algorithm.
2015
12[17]Optimal reactive power utilization technique for overvoltage compensationP and Q (both active and reactive)
  • Same as 2
2014
13[18]Fair real power curtailment methodP (Active)Inverter
  • Same as 9
2014
14[19]Adaptive-droop based active and reactive power controlP and Q (both active and reactive)Unspecified
  • Same as 8
2016
15[21]Two-level overvoltage mitigation controlP and Q (both active and reactive)Inverter
  • The use of the sparse communication network adds up to the total cost and complexity of the system.
2021
16[23]Power Compensation algorithm P and Q (both active and reactive)NA
  • The method is based on the power flow analysis.
  • The control lacks the illustration of how the active and reactive power can be controlled at converter level.
2021
17[24]A new DVR configurationQ (Reactive)Inverter
  • The control deals with the voltage control only for the unsymmetrical faults.
  • In high PV penetrated systems, the voltage may rise due to many other reasons.
2022
18 Proposed methodP (Active)Dc/dc converter
  • The method is easy to implement.
  • The complexity of the method is low.
Table 2. Numerical data for Figure 8.
S. No.Time (s)Power (kW)-Figure 8aVoltage (VPV)-Figure 8cV3 (kV) MPP-Figure 8fV3 (kV) De-Rating Figure 8f
11.210027013.213.2
21.410027013.213.2
33.58030013.413.2
44.58629413.413.3
56.58229613.513.3
Table 3. Numerical data for Figure 9.
S. No.Time (s)Power (kW)-Figure 9aIrr. (W/m2)-Figure 9dVoltage (VPV)-Figure 9cV3 (kV) MPP-Figure 9fV3 (kV) De-Rating Figure 9f
11.24850027112.512.5
21.44850027112.512.5
33.560100031012.512.5
44.560100031012.5612.53
56.560100031212.5612.51
Table 4. Numerical data for Figure 10.
S. No.Time (s)Power (kW)-Figure 10aIrr. (W/m2)-Figure 10cVoltage (VPV)-Figure 10bV3 (kV) MPP-Figure 10dV3 (kV) De-Rating Figure 10d
11.2495002719.229.22
21.4495002709.229.22
33.510110002729.829.26
44.560100015510.129.49
56.559.7100015410.439.70
Publisher’s Note: MDPI stays neutral with regard to jurisdictional claims in published maps and institutional affiliations.

