Article

Advances in Energy Hybridization for Resilient Supply: A Sustainable Approach to the Growing World Demand

1
Department of Chemical and Biochemical Engineering, Missouri University of Science and Technology, Rolla, MO 65409, USA
2
Petroleum Engineering Department, Koya University, Koya KOY45 AB64, Kurdistan Region, Iraq
3
Manufacturing Science Division, Oak Ridge National Laboratory, Oak Ridge, TN 37830, USA
4
Economics Department, Missouri University of Science and Technology, Rolla, MO 65409, USA
*
Author to whom correspondence should be addressed.
Energies 2022, 15(16), 5903; https://doi.org/10.3390/en15165903
Submission received: 27 June 2022 / Revised: 8 August 2022 / Accepted: 8 August 2022 / Published: 15 August 2022

Abstract

:
Energy poverty, defined as a lack of access to reliable electricity and reliance on traditional biomass resources for cooking, affects over a billion people daily. The World Health Organization estimates that household air pollution from inefficient stoves causes more premature deaths than malaria, tuberculosis, and HIV/AIDS. Increasing demand for energy has led to dramatic increases in emissions. The need for reliable electricity and limiting emissions drives research on Resilient Hybrid Energy Systems (RHESs), which provide cleaner energy through combining wind, solar, and biomass energy with traditional fossil energy, increasing production efficiency and reliability and reducing generating costs and emissions. Microgrids have been shown as an efficient means of implementing RHESs, with some focused mainly on reducing the environmental impact of electric power generation. The technical challenges of designing, implementing, and applying microgrids involve conducting a cradle-to-grave Life Cycle Analysis (LCA) to evaluate these systems’ environmental and economic performance under diverse operating conditions to evaluate resiliency. A sample RHES was developed and used to demonstrate the implementation in rural applications, where the system can provide reliable electricity for heating, cooling, lighting, and pumping clean water. The model and findings can be utilized by other regions around the globe facing similar challenges.

1. Introduction

Energy poverty is defined as not having access to reliable electricity and reliance on traditional biomass resources for cooking [1]. On a global scale, over 1.3 billion lack access to electricity (85% in rural areas), and approximately 2.8 billion people rely on traditional biomass for cooking [2]. The World Health Organization estimates that household air pollution from inefficient stoves causes 4000 premature deaths/day (greater than malaria, tuberculosis, and HIV/AIDS) [3]. The need for reliable electricity and reduced greenhouse gas and particulate emissions drives research on resilient energy hybrid systems that provide low-carbon electric power through combining wind, solar, and biomass energy and traditional gas-fired systems, which increases production efficiency and resilience, while reducing generating costs and emissions. Through a case study analysis of a microgrid in rural Missouri, USA, this study provides insightful findings and implications that can be utilized to address energy poverty in rural areas worldwide where the conventional grid cannot reach. The microgrid is also shown to generate reasonable emissions as energy consumption increases.
Hybrid energy systems that combine conventional with renewable energy sources can be designed to provide much-needed reliable electric power to rural areas using available energy resources. Microgrids have been implemented worldwide [3,4,5] with the main focus on reducing environmental impacts [6]. The main technical challenges of designing, implementing, and applying microgrids have been studied by several others [2,7,8,9,10,11]. The U.S. Department of Energy demonstrated the positive economic impact microgrids could provide in rural regions [12]. Additional work has focused on analyzing microgrid performance and assessing economic and environmental sustainability. Unlike the conventional grid, the microgrid’s carbon footprint is extremely low, and the electricity cost is also invulnerable to environmental regulations such as carbon taxes [13,14].
This work considered rural locations in the United States with different types and amounts of renewable and conventional energy. This work resulted in an optimized microgrid design for resilient operation and reduced the Levelized Cost of Electricity (LCOE) for each location. Microgrid resilience was evaluated using a Life Cycle Assessment (LCA) (see Figure 1) using the Greenhouse Gases, Regulated Emissions, and Energy Use in Transportation (GREET) (see https://greet.es.anl.gov/index.php; accessed on 10 August 2022) software package developed by the U.S. Department of Energy. This tool provided data for the microgrid to assess economic performance using wind and solar energy resources available in rural regions.
The GREET software tool estimates energy use and emissions for vehicle/fuel systems. It has been used to conduct life cycle analyses of electricity production to assess emissions during generation, transmission, and distribution, considering various renewable energy resources with their respective technologies and distribution to end-users. Wu et al. [16] used GREET to assess life cycle energy and greenhouse gas emission from the production of corn-based butanol as a transportation fuel. Wang et al. [17] studied the energy and greenhouse gas emission effects of corn and cellulosic ethanol using GREET. GREET was used to estimate energy and emissions at every stage in the LCA for the solar microgrid. Emissions data procured from GREET included concentrations of volatile organic compounds, carbon monoxide, carbon dioxide, nitrogen oxides, sulfur oxides, methane, and particulate matter. An economic analysis examined the net value of using solar microgrids versus other options for generating electricity in terms of the broader social net benefit of avoided greenhouse gas emissions from fossil-fired power plants. Issues such as the availability of other energy forms, including wind and biomass, and the scale size efficiencies of solar microgrids based on the number of homes included in the microgrid were analyzed to estimate the optimal microgrid-based size of the hybrid energy system for geographically diverse locations.
Advanced design features considered in the present work included the evaluation of various energy storage technologies and the number of wind turbines and solar photovoltaic (PV) panels and smart sensors for monitoring and controlling the microgrid. An LCA examined various configurations considering combinations of specific thermal and PV solar equipment with different battery backup systems and inverter/power management components. Ongoing research involves testing the solar microgrid at the Missouri University of Science and Technology (Missouri S&T) to optimize dynamic performance. Future work will expand the LCA to consider the full environmental and economic impact of energy/water uses and emissions associated with manufacturing, transportation, operation, and eventual disposal of all components in the microgrid.

2. Microgrid Energy Storage Cost Analysis

An existing microgrid system (see Figure 2) at the Missouri S&T combines photovoltaic and thermal solar energy with battery storage in rural Missouri. This system has been analyzed by Fikru et al. [18] to identify the economic performance of the microgrid. As shown in Figure 2, this microgrid includes four small homes equipped with photovoltaic and thermal solar equipment connected to a lithium-ion battery backup system operated with smart power management (for a description of the solar microgrid located at the Missouri University of Science and Technology, see https://cree.mst.edu/laboratories/; accessed on 10 August 2022). The microgrid is also connected to an Electric Vehicle (EV) charging station. The recent cost reduction in photovoltaic panels to generate electricity has made this design common. Because of the intermittency of both wind and solar energy, energy storage was also included in this analysis.
As shown in Figure 2, the Missouri S&T microgrid employs lithium-ion batteries for energy storage. Although lightweight, this battery is very expensive and difficult to maintain. For the present study, other types of energy storage devices were considered. Various mechanical equipment can also store energy, including flywheels, which store energy by spinning a large disk with the angular momentum of the spinning flywheel converted into electricity. The present study considered a detailed analysis of these energy storage devices.
The “best” storage option can be determined by assessing which provides sufficient energy to operate the microgrid independently of the national grid (e.g., islanding) for up to 24 h. This factor is closely tied to the power discharge level required to support a nominal load profile for a typical microgrid operation. Additional factors to consider include time to charge the storage device and expected capital cost (CAPEX) and operating cost (O&M) for each storage technology. Lastly, equipment replacement cost and expected operational lifetime, required footprint, system weight, and roundtrip efficiency (Energy storage typically consumes electricity and saves it in some manner, then hands it back to the grid. The ratio of energy put in (in MWh) to energy retrieved from storage (in MWh) is the round-trip efficiency, expressed in percent (%) (see https://energymag.net; accessed on 10 August 2022) must also be considered [19].
Our initial analysis showed the following results for standard Lead-Acid (Pb-A) battery storage compared to Carbon-enhanced Lead acid batteries (Pb-C). More expensive batteries considered included Lithium-Ion batteries (Li-Ion), Sulfur–Sulfur batteries (S-S), Zinc–Bromide batteries (Zn-Br), and Vanadium-Redox flow batteries (V-Redox). Flywheels were also compared to battery storage, as shown in Table 1 [19,20,21,22,23,24,25].
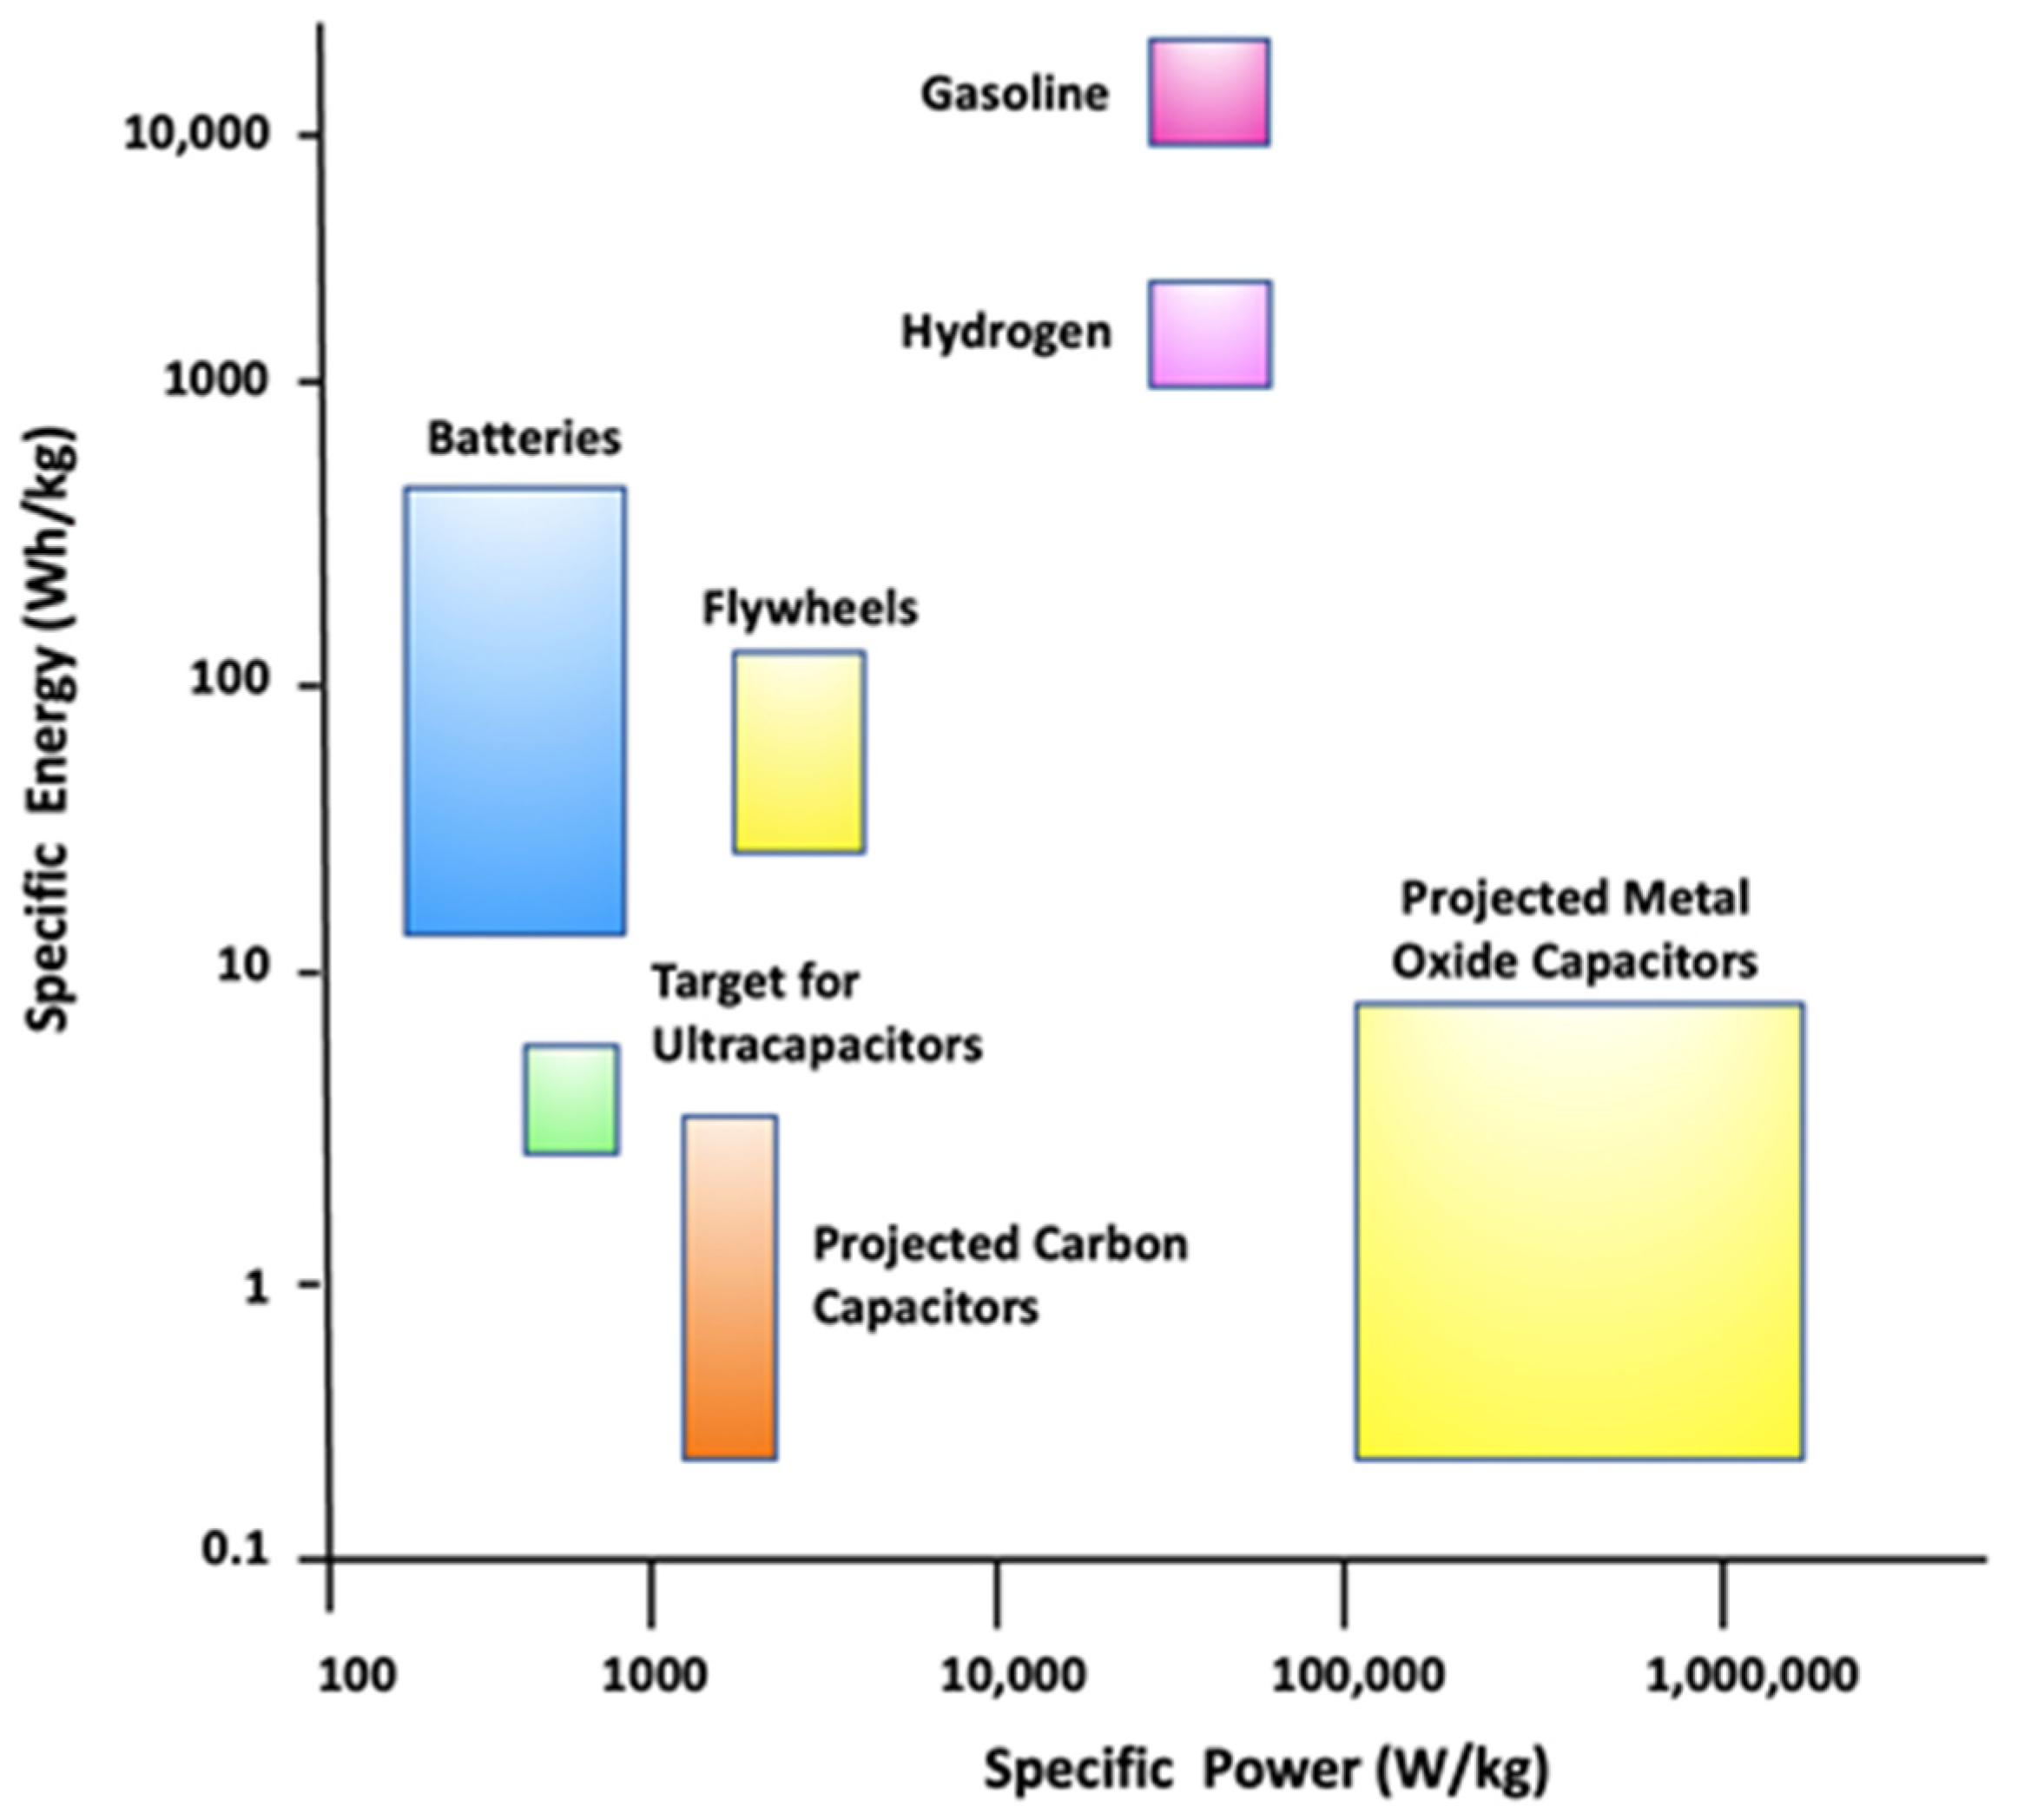
Specific details for each energy storage technology in terms of specific power (W/kg) versus specific energy (Wh/kg) are in Figure 3. A comparison of energy production costs (USD/kW) is shown in Figure 4 [21].
As shown in Table 1 and Figure 3 and Figure 4, the analysis was conducted to determine the “best” storage technology for the Missouri S&T microgrid. Based on Table 1 and Table 2, with factors from previous studies [21], the economic analysis of the various energy storage technologies considered provided the LCOE in terms of net present value/kWh provided (see Table 3). Lead-acid batteries, including carbon-enhanced lead-acid batteries, represented a significantly more economical energy storage technology than all other types of battery technologies considered and flywheel technology.
For the Missouri S&T solar microgrid, lead-acid batteries were selected as the most efficient energy storage method based on this cost analysis. This battery can meet the energy and power requirements for the residential setting of a microgrid. This battery can sustain multiple discharges per day, has low self-discharge and parasitic energy requirements, has high efficiency, and most importantly, has relatively low CAPEX and O&M costs. Although they do not have a relatively low energy density, they work well for stationary applications. Furthermore, even though these batteries have a relatively short lifetime, their low cost offsets this drawback [19].

3. Microgrid Analysis

To examine various microgrid configurations, a standard method was developed and used. Critical assumptions used during this analysis are shown in Table 4.
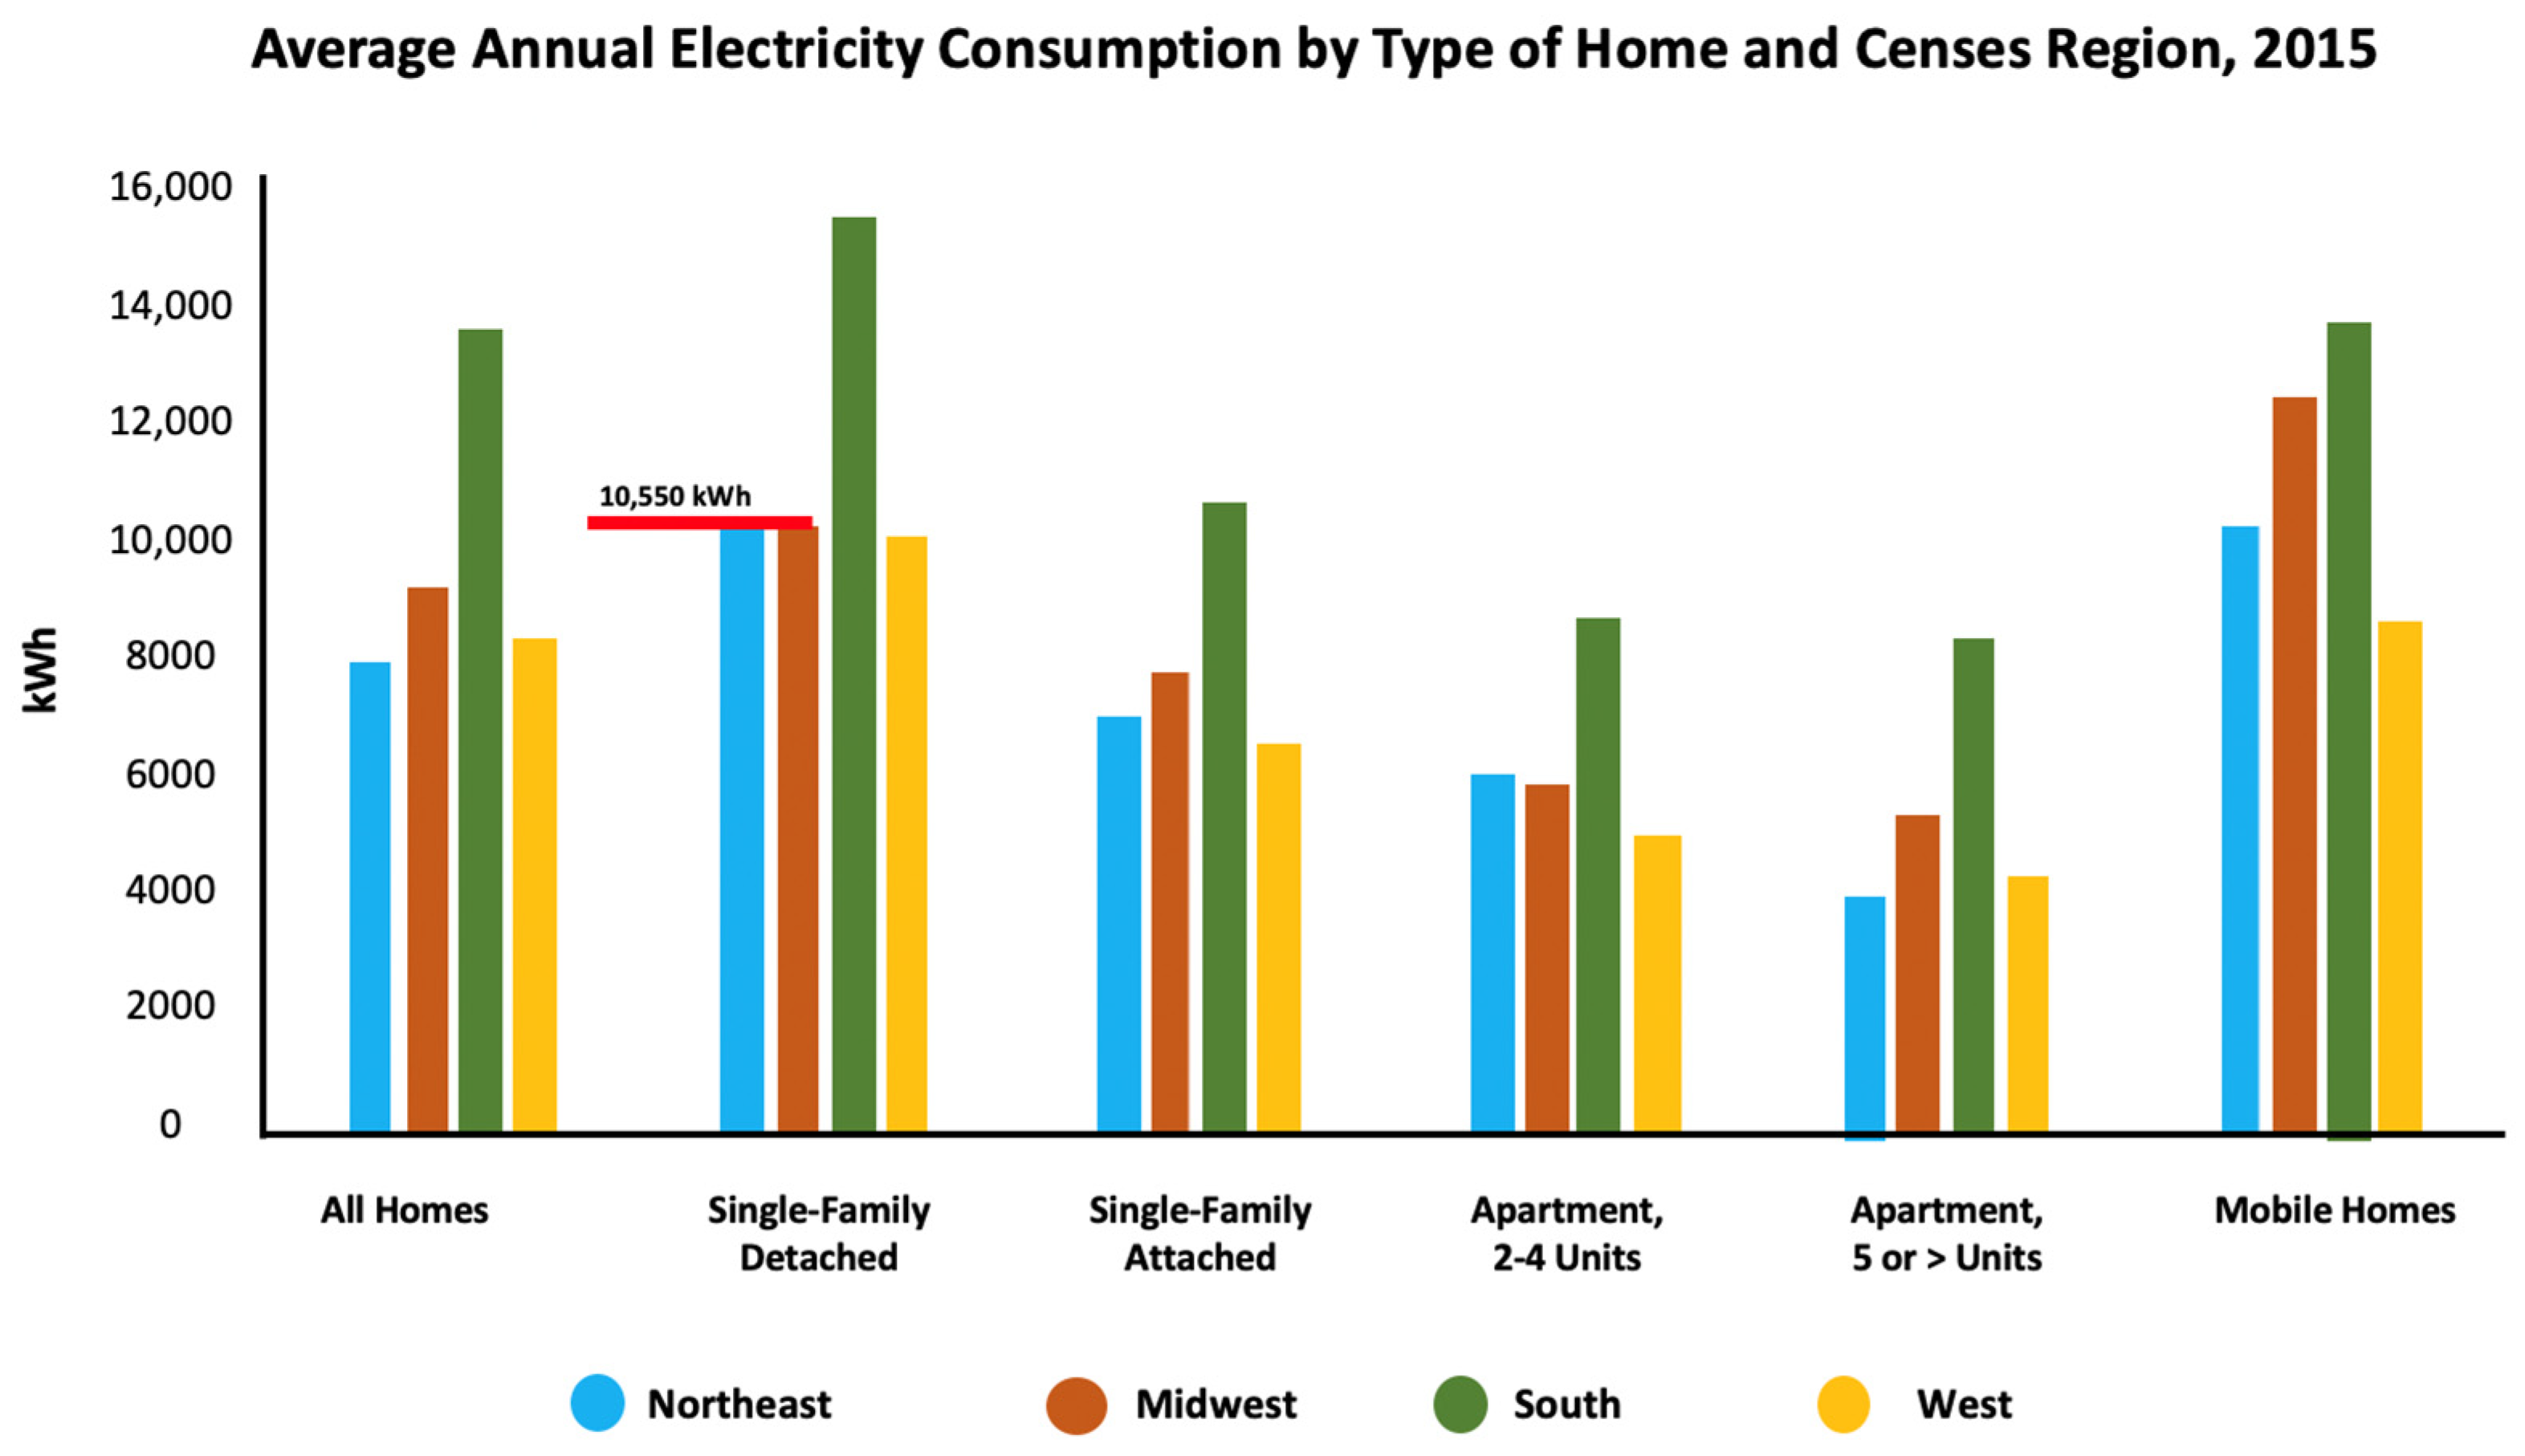
Power demand over 24 h for a single rural region household was obtained from the Rolla public utility service to establish the required power per home. This can be compared to the standard rate available from the Energy Information Agency, as shown in Figure 5. For simplicity, the load was assumed constant during the year for each home in the microgrid. Though the load is known to vary by season, this “simple” approach simplified the microgrid optimization by considering 100 homes with an average load profile for each house of 10,000 kWh/year.

4. Solar PV Energy

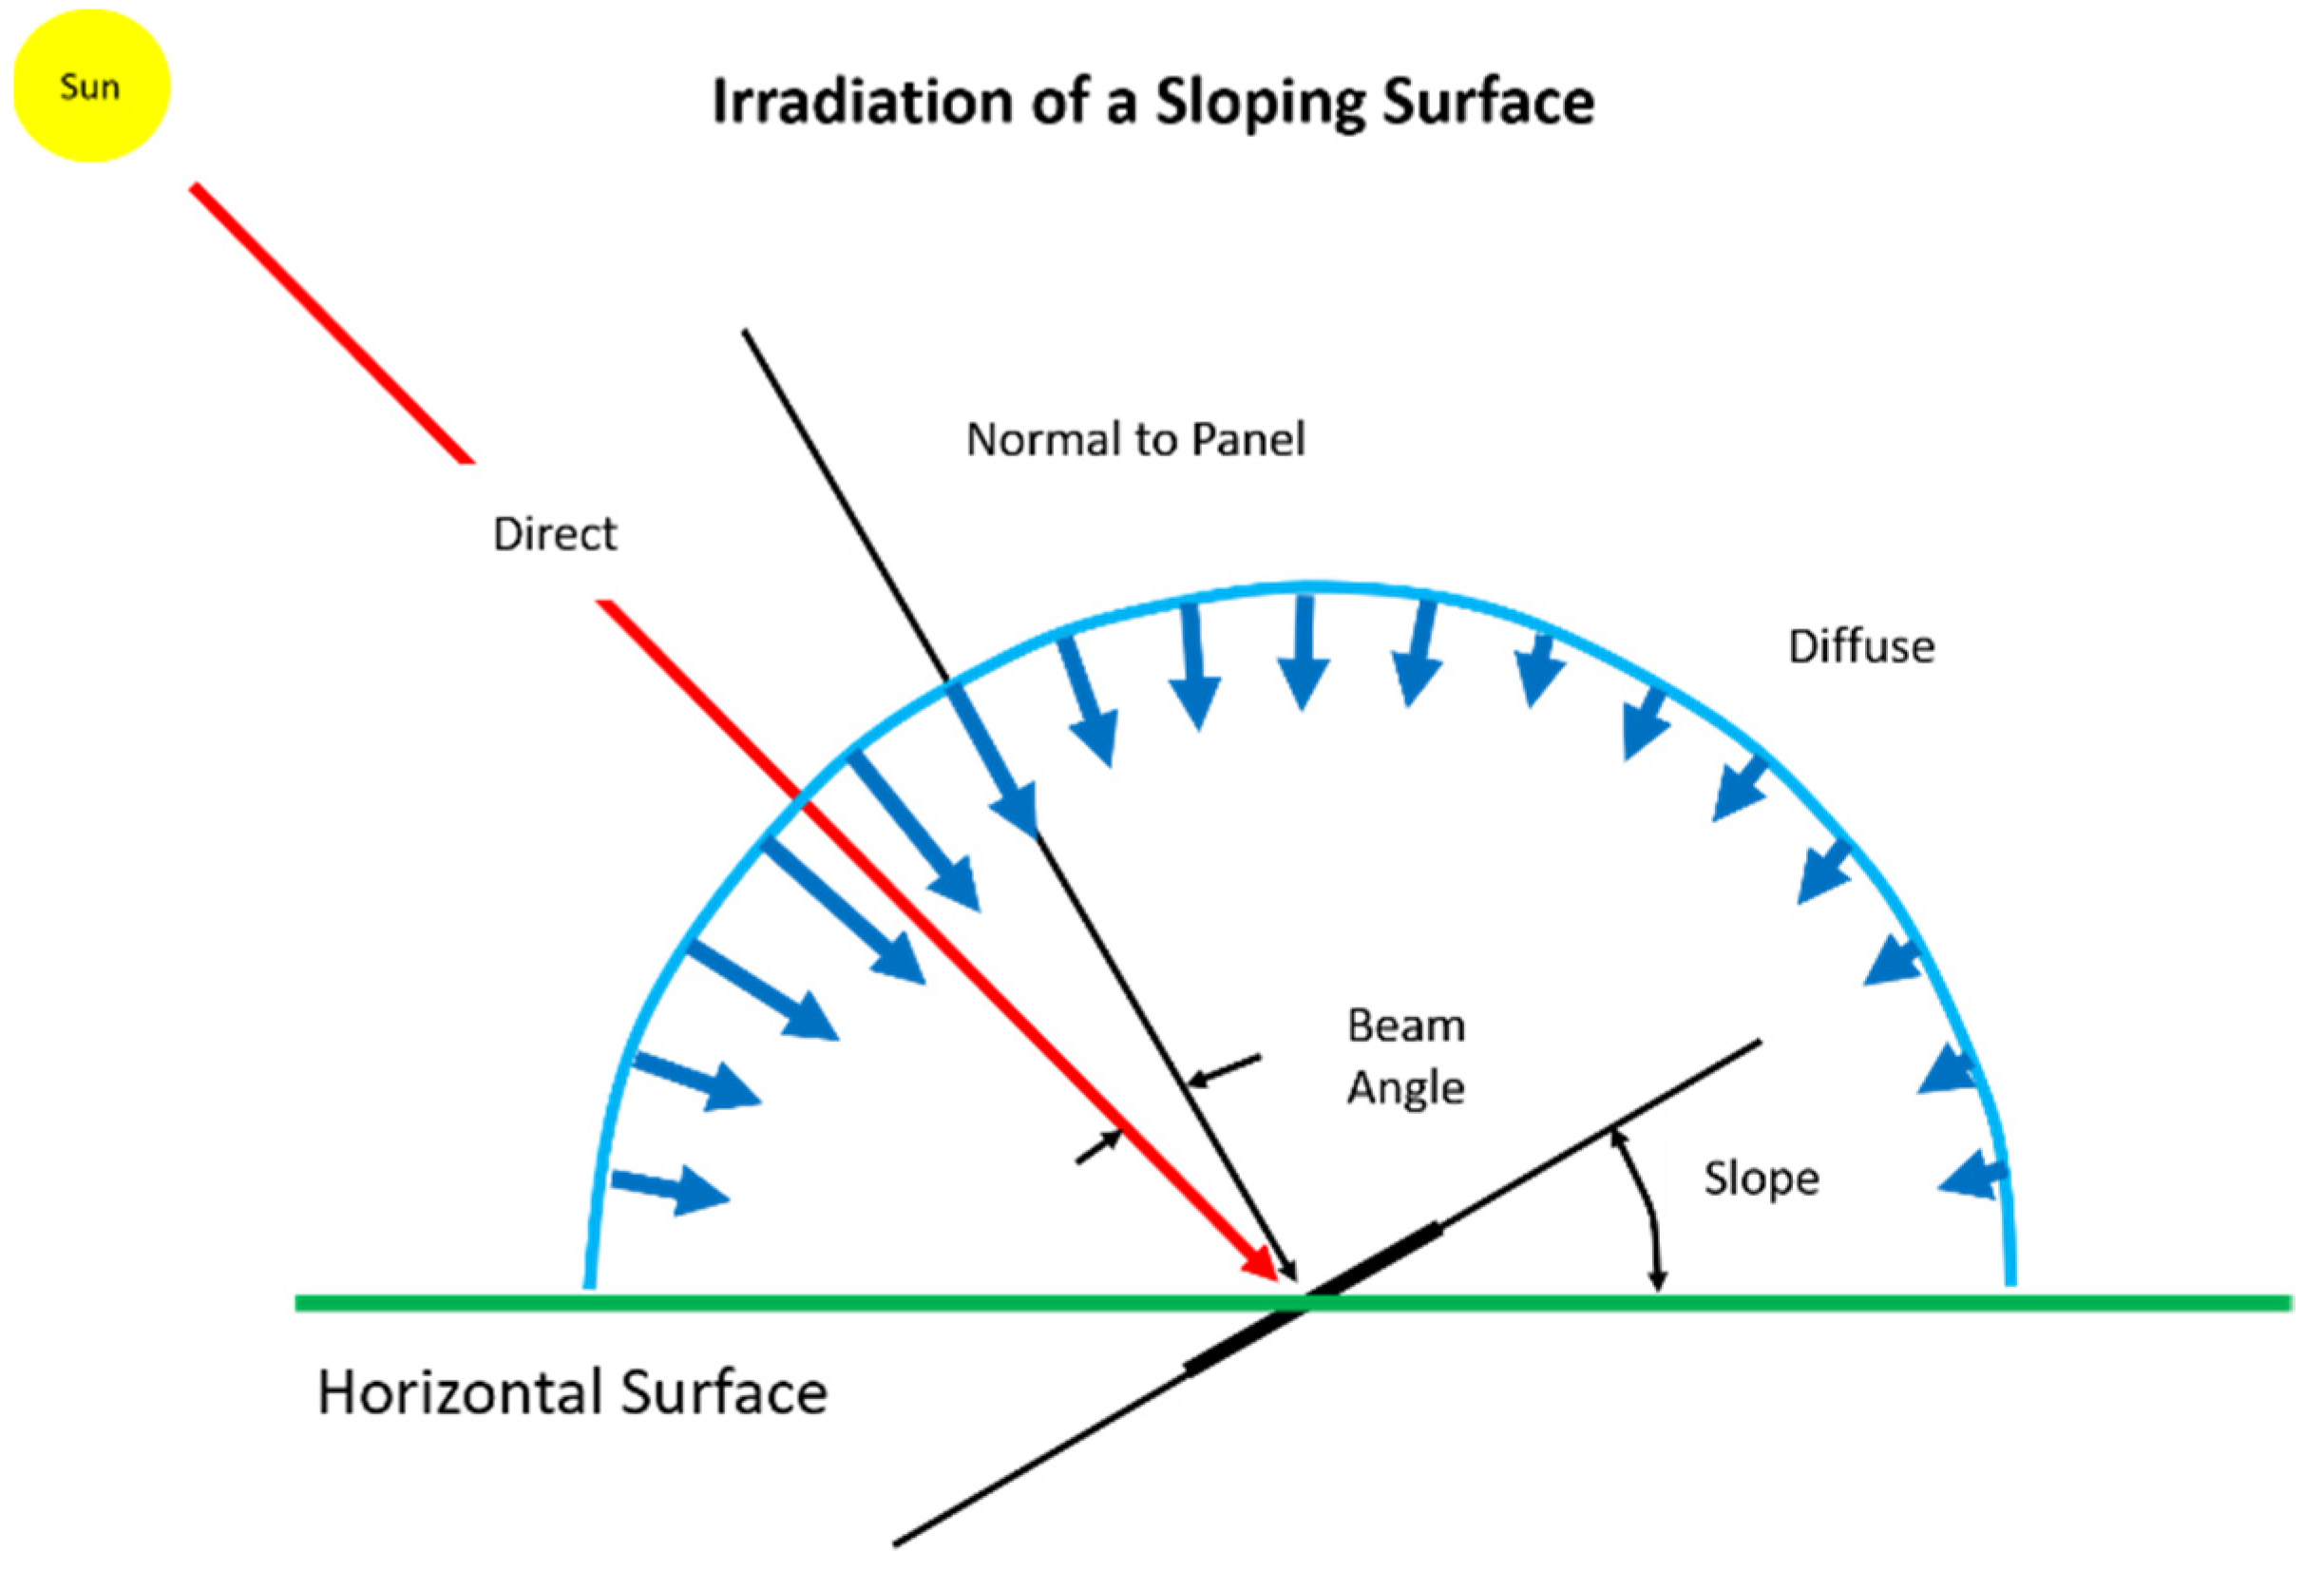
The first factor required in this analysis included the amount of solar energy generated by the solar PV panels in the Missouri S&T microgrid. This analysis considered the number of “sun-days” during the year based on 2010 data for Rolla, Missouri, obtained from the National Renewable Energy Laboratory’s National Solar Radiation database [26]. These data are reported regarding Sun zenith, Sun azimuth, direct radiation, and diffuse radiation. Solar PV generation from diffuse radiation does not depend on the incident angle. In contrast, direct radiation requires components to be fully defined in the angle between the Sun and the panel surface (Figure 6).
The solar energy generated by the PV panels required the incident beam angle as shown above in Figure 6. This was calculated as:
Beam   Angle   =   arc   cos [ sin ϕ s · sin ϕ p · ( cos Θ s · cos Θ p +   sin Θ s · sin Θ p ) + cos ϕ s · cos ϕ p ]
where ϕ is the zenith angle and Θ is the azimuth angle. Subscripts s and p correspond to the Sun and panel. The radiation “incident” on the panel is then found by:
Eff   Rad   =   Diffuse   Radiation   +   Direct   Radiation · cos ( incident   angle )
Today’s efficient solar panels are called “N-type monocrystalline silicon cells”, with efficiencies of 15% to 18%. Many things affect cell efficiency, including dust or dirt on the panel surface, ambient temperature, and shading. As a conservative estimate for the present study, we assumed the PV panels had a conversion factor of 14% [28]. Multiplying the effective radiation calculated in Equation (2) by this efficiency factor provided an estimate of the electrical energy produced by the solar panels in kWh Direct Current (DC) electricity per square meter per hour during the year. The calculated average production of electrical energy per square meter of solar panel per hour was used in the optimization study to size the required solar power generation source.
Electric power generation from PV panels degrades approximately 0.5% per year [29]. Using this assumption, power generation from the PV panels in the Missouri S&T microgrid after ten years will be approximately 90% their initial rated value. As a conservative assumption, the solar PV rate was assumed to be 90% of the total capacity over the entire ten years considered in this analysis. The conversion from DC power to Alternating Current (AC) power in the inverter was assumed to be 84.5%, as suggested in the NREL website PV Watts (see https://pvwatts.nrel.gov/pvwatts.php; accessed on 10 August 2022)—which was applied to the estimated power generation rate from the PV solar panel.

5. Wind Energy

Like the distributed solar systems (i.e., roof-mounted solar PV panels) discussed earlier, distributed wind machines can be used to produce electric power for microgrid use. Unfortunately, intermittent wind speeds are difficult to predict near the ground because wind can be significantly affected by structures and topographical features. Commercial wind machines are typically located approximately 70 m from the ground, as shown in Figure 7.
For the microgrid optimization study, wind energy at this height was selected. Missouri’s daily wind speed data (see Figure 8) are available from the Department of Energy (DOE) at 80 m elevation. These data were used to estimate the available wind energy available for a wind machine at 70 m elevation using the standard “power-law” equation from the literature:
U ( z ) = U ( z r ) · ( z z r ) α
where U ( z ) is the wind energy at height z and the power-law coefficient “ α ” is taken as 0.4 for “small towns and suburbs” [30].
As shown in Figure 8, rural Missouri has low wind energy with typical wind speeds of less than 7 m/s. Given wind energy is equal to the wind kinetic energy ( 1 2 m v 2 ) times the wind momentum ( m v ) , where m is the mass of air and v is the wind velocity, the wind power (kW) (power (kilowatts (kW)) = rate electricity consumed; energy (kilowatt-hours (kWh)) = quantity consumed) is:
W i n d   P o w e r   ( kW ) = C p · ρ A i r · A s w e p t   a r e a · v w i n d 3
where C p is a dimensionless maximum power coefficient ranging from 0.035 to 0.063 (accounts for turbine efficiency of capturing wind), ρ A i r is the air density (kg/m3), and A is the rotor swept area (ft2) with a rotor diameter D in ft ( D I s w e p t   a r e a = π D r o t a r   d i a 2 4 ). The wind velocity v is in m/s. The air density is based on a reference temperature and pressure of 59 °F (15 °C) at sea level. To evaluate the annual performance of a horizontal-axis wind machine, Equation (4) can be transformed to
A E O = 0.01328 · D r o t a r 2 · v ¯ w i n d 3
where A E O is the annual energy output (kWh/year), D r o t a r 2 is the rotar diameter, and v ¯ is the average wind speed. This form of the equation allows us to analyze the economic performance of wind on the same basis as solar PV.

6. Microgrid Design Analysis

Based on the information provided in the previous sections on solar and wind energy, plus the assumptions for microgrid design listed in Table 4, an economic analysis of various microgrid designs was conducted. This analysis included solar panel type, wind machine type, and how many solar panels and wind machines are required to meet microgrid energy demand.
For solar panels, according to the U.S. DOE, the price per watt installed was USD 0.78 in 2012, which was used in this analysis (See https://www.energy.gov/sites/default/files/2014/05/f15/57957_SunShot_Competitive-USFINAL.pdf; accessed on 10 August 2022). Wind costs were estimated using the cost per turbine and the number of turbines required. The estimated energy generation was summed for each wind turbine per year using projected hourly wind speed data [31]. Operation and maintenance costs were estimated as 3% of total CAPEX costs using an estimate of USD 1,000,000/MW generation CAPEX. Energy storage costs for lead-acid batteries were scaled by energy and power needs as
Storage Capital = max[(CP·P), (CE)] + BOSP·P + BOSE·E
where BOS P (USD/kW) is the energy needs. For lead-acid batteries, BOS P = USD   0 / kW and BOS E = USD   50 / kWh . Fixed operating and maintenance costs were found to be USD 1.55/kW-yr, and variable operating and maintenance costs were found to be USD 0.01/kWh [19].
To optimize the microgrid design, the following objective function was developed in terms of cost per kWh for the solar/wind/lead-acid battery storage
Min ( cos t / kWh ) = ( #   Solar   Arrays ) · ( Cos t Solar   Array ) + i = 1 t u r b i n e   d e s i g n [ ( #   W i n d   T u r b i n e s ) i · ( C o s t W i n d   T u r b i n e ) i ] + W i n d   O & M   C o s t + S t o r a g e   C A P E X + S t o r a g e   O & M   C o s t
System constraints included a solar array size < 100,000 ft2 (<9290 m2) and a number of wind turbines < 10. Using Equation (7), the optimal microgrid configuration for rural Missouri in the USA included no wind turbines and 43,500 m2 solar PV panels with 9.45 MW electric energy storage in lead-acid batteries. It is not surprising that no wind turbines were included in the optimal design, given the low wind speeds available in rural Missouri, as shown in Figure 8.

7. Cost Analysis

The non-linear reduced gradient method in Excel was used to perform the optimization. The GREET analysis calculated emissions for a combined solar PV and wind system as 45 g CO2/kWh. Emissions for the lead-acid battery storage system were taken as 3200 g CO2/kg, which was divided by battery energy density (0.04 kWh/kg) and multiplied by total batteries in a microgrid (four), then divided by total kWh over the microgrid lifetime (20 years × consumption/year), which yielded a value of 32.15 g CO2/kWh for energy storage. No wind generation was included in the optimized microgrid design; thus, the total emissions per electricity generation for the microgrid was 77.15 g CO2/kWh. Based on Figure 5, the 100-home microgrid consumes approximately 1,000,500 kWh of electricity per year, equating to about 89 tons of CO2 per year. Assuming emissions are priced at USD 7.6/ton CO2 (price listed by the Regional Greenhouse Gas Initiative (RGGI) on 3 March 2021), the relative cost of the CO2 emissions is less than USD 1000. For comparison, emissions for grid-supplied electricity are 792.61 g CO2/kWh (assumes Ameren Missouri-generated electricity was based on 85.55% coal, 4.22% gas, and 10.23% nuclear power with relative CO2/kWh for each as 1022 g CO2/kWh, 585 g CO2/kWh, and 0 g CO2/kWh (see https://www.eia.gov/state/?sid=MO; accessed on 10 August 2022)), resulting in 10× as much CO2 emissions, but the cost is still less than USD 10,000 per year for emissions. Based on the current carbon credits markets operating in the U.S., a carbon cost of USD 10/ton CO2 was used to estimate electricity costs for the microgrid analysis. Assuming a twenty-year life for the microgrid with a 4.2% annual rate increase for electric power, the estimated cost of electricity, including emissions, is approximately USD 0.52/kWh for microgrid-generated electricity, which is significantly higher than grid-based electricity priced at USD 0.12/kWh for the same cost of emissions. Previous work has shown the LCOE from a microgrid to be significantly higher than non-peak power generated by fossil fuels supplied by an existing conventional grid [13]. They showed when the social cost of greenhouse gas emissions together with a carbon tax greater than USD 50/ton of CO2 emitted were included, the microgrid LCOE was comparable to peak power costs from a fossil-fuel-based LCOE. This comparison illustrates why microgrids are not popular in the rural U.S., given the available grid power.

8. Discussion

Microgrid systems are designed to provide local electric power to a small set of homes. In regions where grid-based electric power is not available, microgrids are one solution to help reduce energy poverty and improve quality of life, especially in developing countries. To increase the resilience of local microgrids, they should be based on hybrid energy systems, considering locally available energy resources such as wind energy, solar energy, biomass, geothermal energy, hydroelectric energy, and others. Furthermore, various options for energy storage, including batteries, pumped hydro, flywheels, and compressed air, should be considered. In the present study, solar PV and wind energy were considered based on an existing solar house design in the Missouri S&T system. Different wind turbine designs were evaluated to find the most optimal option for the existing system configuration. Several battery options and flywheels were considered for energy storage.
This work shares similarities with recently published relevant microgrid studies in the literature. For instance, the work presented here successfully utilized a non-linear reduced gradient method to estimate the cost for a microgrid located in Rolla, Missouri, while in the work by Nagapurkar et al. [13,14], the authors utilized a genetic algorithm as an optimization method to determine the LCOE for a microgrid [14]. A different study by Elsied et al. utilized a multi-objective binary swarm optimization method to estimate the microgrid’s electricity generation cost and emissions [32]. Since the work presented here comprised three microgrid components (solar, wind, and lead-acid battery), a simple Excel-based non-linear gradient was adequate to perform cost optimization analysis as compared with a relatively complex genetic algorithm optimization technique used in the work by Nagapurkar et al., which incorporated seven components in a microgrid, namely solar PV, wind turbine, lead-acid battery, biodiesel generator, fuel cell, electrolyzer, and hydrogen tanks. Similarly, Elsied et al. aVillalso used a complex optimization technique owing to the incorporation of AC/DC power converters and a control scheme design within the three-component microgrid composed of a wind turbine, PV, and fuel cell. The present study did not incorporate a control scheme design, nor mathematically models of AC/DC converters and therefore, adequately employed a simple Excel-based non-linear gradient technique.
The cost of generating and storing electricity estimated through this work, i.e., USD 0.52/kWh, lies between those observed in relevant literary works. For instance, a study performed by the U.S. Energy Information and Administration (EIA) concluded the LCOE for microgrids to be USD 0.03–0.05/kWh, and Lazard specified an LCOE within the range of USD 0.07–0.15/kWh (see https://www.lazard.com/media/451881/lazards-levelized-cost-of-energy-version-150-vf.pdf; accessed on 10 August 2022). Both of these studies have a significantly lower LCOE than the one observed in the current study since the microgrids analyzed in these studies were based on large-scale commercial microgrids that possessed an economies of scale effect. The present work was focused on a smaller-scale community composed of 100 homes in rural Missouri and, therefore, possessed higher costs than commercial and large-scale microgrids.
A different study performed by Nagapurkar et al. found the LCOE to be USD 0.86/kWh and 65% higher than the cost observed in the current study. Both analyses were focused on small-scale microgrids, i.e., serving a small community of 50–100 homes [13]. This is because the microgrid analyzed by Nagapurkar et al. was mostly composed of biodiesel generator units with a relatively high capital cost of USD 1.01/W, while the microgrid presented in the current work was mainly composed of solar panels that possessed a relatively low capital cost of USD 0.78/W. Due to the 22% lower capital cost of the microgrid’s main constituent, the cost of generating and storing electricity estimated in this current study were lower than the LCOE estimated by Nagapurkar et al.
Furthermore, the microgrid located in Rolla, MO, possessed 1/10 the CO2 emissions of that of the conventional fossil-fuel-fired grid, and this conclusion was similar to that in the study performed by Nagapurkar et al. [14]. However, one of the key differences, and a unique aspect, of this work is that the analysis was based on data and insights from an actual microgrid in rural Missouri, while the study by Nagapurkar et al. was based on simulated microgrids located in the U.S. cities of Tucson in Arizona, Lubbock in Texas, and Dickinson in North Dakota.
Careful microgrid design in remote parts of the world can increase system resilience and reduce the LCOE for low-income consumers without access to the main grids and inexpensive energy. We recommend that this type of analysis be carried out to reduce energy poverty and improve the quality of life in rural environments in developing countries worldwide. Microgrid technology can also increase local economic activity in developing countries by providing a reliable electric power source and new investment and jobs made possible with a resilient power supply.

Author Contributions

Conceptualization, J.D.S., M.H.S.Z. and G.G.; methodology, J.D.S. and H.A.-R.; software, J.D.S., P.N. and H.A.-R.; validation, J.D.S., H.A.-R., M.H.S.Z., G.G. and Y.Z.; formal analysis, H.A.-R., J.D.S. and P.N.; investigation, H.A.-R. and J.D.S.; resources, J.D.S., G.G. and Y.Z.; data curation, J.D.S., Y.Z. and P.N.; writing—original draft preparation, J.D.S., H.A.-R., Y.Z. and M.H.S.Z.; writing—review and editing, Y.Z. and J.D.S.; visualization, J.D.S. and H.A.-R.; supervision, J.D.S.; project administration, J.D.S.; funding acquisition, J.D.S. All authors have read and agreed to the published version of the manuscript.

Funding

This research was funded by Wayne and Gayle Laufer Foundation, grant number 001.

Data Availability Statement

Results obtained were based on modeling using publically available data with proper citations to the data sources.

Conflicts of Interest

The authors declare no conflict of interest.

References

  1. Tanaka, N.; Kjorven, O.; Yumkella, K.K. Energy Poverty; How to Make Modern Energy Access Universal? Special Early Excerpt of the World Energy Outlook 2010 for the UN General Assembly on the Millennium Development Goals; International Energy Agency: Paris, France, 2010. [Google Scholar]
  2. Chowdhury, S.; Chowdhury, S.P.; Crossley, P. Microgrids and Active Distribution Networks; Renewable Energy Series 6; The Institution of Engineering and Technology: London, UK, 2009. [Google Scholar]
  3. Del Rio, P.; Burguillo, M. An empirical analysis of the impact of renewable energy deployment on local sustainability. Renew. Sustain. Energy Rev. 2009, 13, 1314–1325. [Google Scholar] [CrossRef]
  4. Mahapatra, S.; Dasappa, S. Rural electrification: Optimising the choice between decentralised renewable energy sources and grid extension. Energy Sustain. Dev. 2012, 16, 146–154. [Google Scholar] [CrossRef]
  5. Chaurey, A.; Kandpal, T.C. Assessment and evaluation of PV based decentralized rural electrification: An overview. Renew. Sustain. Energy Rev. 2010, 14, 2266–2278. [Google Scholar] [CrossRef]
  6. Cook, P. Infrastructure, rural electrification and development. Energy Sustain. Dev. 2011, 15, 304–313. [Google Scholar] [CrossRef]
  7. Lasseter, R.; Akhil, A.; Marnay, C.; Stephens, J.; Dagle, J.; Guttromsom, R.; A Sakis, M.; Robert, Y.; Eto, J. Integration of Distributed Energy Resources. The CERTS Microgrid Concept; (No. LBNL-50829); Lawrence Berkeley National Lab. (LBNL): Berkeley, CA, USA, 2002.
  8. Hatziargyriou, N.; Asano, H.; Iravani, R.; Marnay, C. Microgrids. IEEE Power Energy Mag. 2007, 5, 78–94. [Google Scholar] [CrossRef]
  9. Infield, D.; Li, F. Integrating micro-generation into distribution systems—A review of recent research. In Proceedings of the 2008 IEEE Power and Energy Society General Meeting-Conversion and Delivery of Electrical Energy in the 21st Century, Pittsburgh, PA, USA, 20–24 July 2008; pp. 1–4. [Google Scholar]
  10. Lasseter, R.H.; Paigi, P. Microgrid: A conceptual solution. In Proceedings of the 2004 IEEE 35th Annual Power Electronics Specialists Conference (IEEE Cat. No. 04CH37551), Aachen, Germany, 20–25 June 2004; Volume 6, pp. 4285–4290. [Google Scholar]
  11. IEEE Std 1547.4-2011; IEEE Guide for Design, Operation, and Integration of Distributed Resource Island Systems with Electric Power Systems. IEEE: New York, NY, USA, 2011.
  12. Melton, R.; Jones, E. Pacific Northwest Smart Grid Demonstration Project Technology Performance Report Volume 1: Technology Performance; PNW-SGDP-TPR-Vol. 1-Rev.1.0, PNWD-4438; Pacific Northwest National Lab. (PNNL): Richland, WA, USA, 2015; Volume 1.
  13. Nagapurkar, P.; Smith, J. Techno-economic optimization and social costs assessment of microgrid-conventional grid integration using genetic algorithm and Artificial Neural Networks: A case study for two US cities. J. Clean. Prod. 2019, 229, 552–569. [Google Scholar] [CrossRef]
  14. Nagapurkar, P.; Smith, J. Techno-economic optimization and environmental Life Cycle Assessment (LCA) of microgrids located in the US using genetic algorithm. Energy Convers. Manag. 2019, 181, 272–291. [Google Scholar] [CrossRef]
  15. Lee, U.; Benavides, T.P.; Wang, M. Life Cycle Analysis of Waste-to-Energy Pathways; Figure 8.1, Chapter 8. In Life Cycle Assessment—An Overview; Academic Press: Cambridge, MA, USA, 2020; pp. 213–233. [Google Scholar] [CrossRef]
  16. Wu, M.; Wang, M.; Liu, J.; Huo, H. Assessment of potential life cycle energy and gas emission effects from using corn based butanol as a transportation fuel. Biotechnol. Prog. 2008, 24, 1204–1219. [Google Scholar] [CrossRef]
  17. Wang, M.; Han, J.; Haq, Z.; Tyner, W.E.; Wu, M.; Elgowainy, A. Energy and Greenhouse Gas Emission Effects of Corn and Cellulosic Ethanol with Technology Improvements and Land Use Changes. Biomass Bioenergy 2011, 35, 1885–1896. [Google Scholar] [CrossRef]
  18. Fikru, M.G.; Gelles, G.; Ichim, A.; Kimball, J.; Smith, J.; Zawodniok, M.J. An Economic Model for Residential Energy Consumption, Generation and Reliance on Cleaner Energy in Missouri Energy Consumption, Generation and Reliance on Cleaner Energy in Missouri. Renew. Energy 2018, 119, 429–438. [Google Scholar] [CrossRef]
  19. Mosher, T. Economic Valuation of Energy Storage Coupled with Photovoltaics: Current Technologies and Future Projections. Doctoral Dissertation, Massachusetts Institute of Technology, Cambridge, MA, USA, 2010. [Google Scholar]
  20. Hadjipaschalis, I.; Poullikkas, A.; Efthimiou, V. Overview of current and future energy storage technologies for electric power applications. Renew. Sustain. Energy Rev. 2010, 13, 1513–1522. [Google Scholar] [CrossRef]
  21. Schoenung, S.M. Energy Storage Systems Cost Update: A Study for the DOE Energy Storage Systems Program; No. SAND2011-2730; Sandia National Laboratories (SNL): Albuquerque, NM, USA; Livermore, CA, USA, 2011.
  22. Chatzivasileiadi, A. Electrical energy storage technologies and the Built Environment. In Proceedings of the International Renewable Energy Storage Conference, Berlin, Germany, 12–14 November 2012. [Google Scholar]
  23. Yang, H.; Lu, L.; Zhou, W. A novel optimization sizing model for hybrid solar-wind power generation system. Solar Energy 2007, 81, 76–84. [Google Scholar] [CrossRef]
  24. Bradbury, K. Energy Storage Technology Review; Duke University: Durham, NC, USA, 2010; pp. 1–34. [Google Scholar]
  25. Eyer, J.M. Benefits from Flywheel Energy Storage for Area Regulation in California-Demonstration Results: A Study for the DOE Energy Storage Systems Program; No. SAND2009-6457; Sandia National Laboratories (SNL): Albuquerque, NM, USA; Livermore, CA, USA, 2009.
  26. Wilcox, S.M. National Solar Radiation Database 1991–2010 Update: User’s Manual; No. NREL/TP-5500-54824; National Renewable Energy Lab. (NREL): Golden, CO, USA, 2012.
  27. Yenen, M.; Ercan, F.; Fahrioglu, M. Solar Energy Technology for Northern Cyprus: Assessment, Statistical Analysis, and Feasibility Study. Energies 2020, 13, 940. [Google Scholar] [CrossRef]
  28. Stapleton, G.; Neill, S. Grid-Connected Solar Electric Systems—The Earthscan Expert Handbook for Planning, Design and Installation; Routledge: New York, NY, USA, 2021. [Google Scholar]
  29. Jordan, D.C.; Kurtz, S.R. Photovoltaic degradation rates—An analytical review. Prog. Photovolt. Res. Appl. 2013, 21, 12–29. [Google Scholar] [CrossRef]
  30. Anjum, L. Wind resource estimation techniques-an overview. Int. J. Wind Renew. Energy 2014, 3, 26–38. [Google Scholar]
  31. Dolan, S.L.; Heath, G.A. Life cycle greenhouse gas emissions of utility-scale wind power: Systematic review and harmonization. J. Ind. Ecol. 2012, 16, S136–S154. [Google Scholar] [CrossRef]
  32. Elsied, M.; Oukaour, A.; Gualous, H.; Brutto, O.A.L. Optimal economic and environment operation of micro-grid power systems. Energy Convers. Manag. 2016, 122, 182–194. [Google Scholar] [CrossRef]
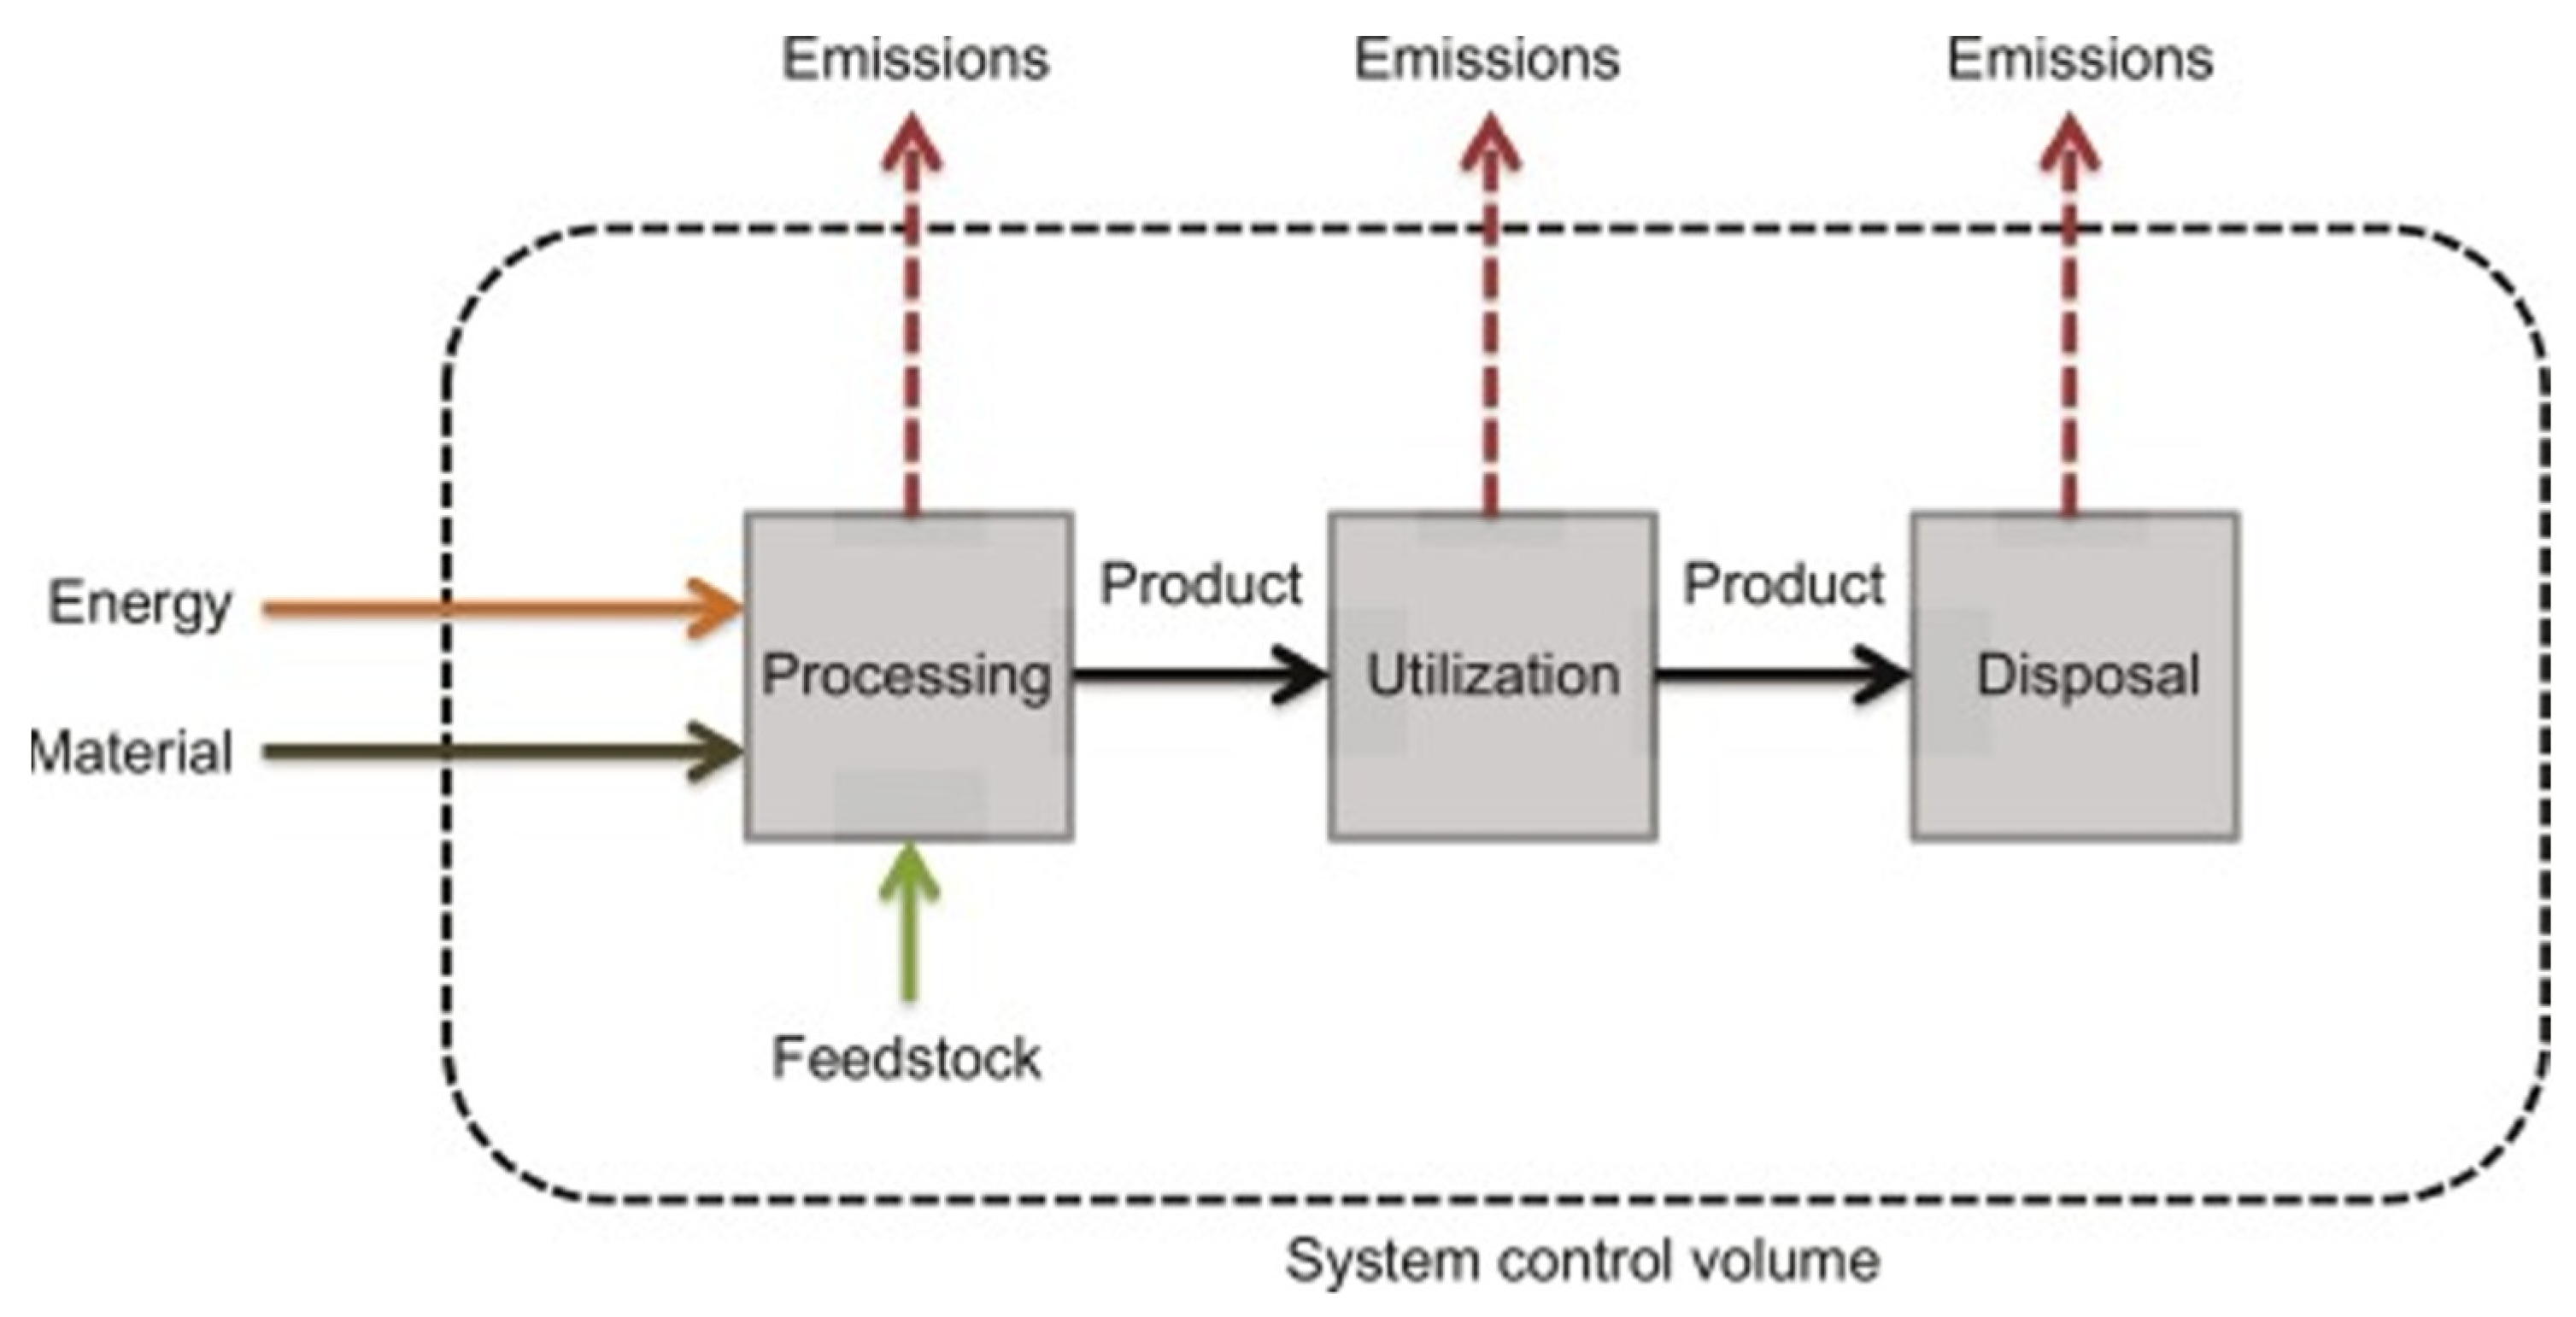
Figure 1. GREET used to conduct LCA (Adapted with permission from [15]. 2022, Elsevier).
Energies 15 05903 g001
Figure 2. Missouri University of Science and Technology Solar Village Microgrid.
Energies 15 05903 g002
Figure 3. Comparison of specific energy vs. specific power for various energy storage technologies (Adapted with permission from [20]. 2022, Elsevier).
Energies 15 05903 g003
Figure 4. Cost comparison (USD/kW) of various battery technologies compared to other energy storage technologies.
Energies 15 05903 g004
Figure 5. Annual average electric consumption by single household home in rural USA.
Energies 15 05903 g005
Figure 6. Geometry for estimating solar irradiance on a PV panel (adapted from Figure 1 [27]).
Energies 15 05903 g006
Figure 7. Various wind machine configurations showing scale and power generation.
Energies 15 05903 g007
Figure 8. DOE wind speed data for Missouri at 80 m elevation (wind resources developed by ASW Truepower, LLC (http://www.awstruepower.com, accessed 12 August 2022) for windNavigator® (http://windnavigator.com, accessed 12 August 2022)).
Energies 15 05903 g008
Table 1. Energy storage performance considering four parameters.
Pb-APb-CLi-IonS-SV-RedoxZn-BrFlywheel
Roundtrip Efficiency (%)80758575657085
Cycle life10003000400040005000200025,000
Calendar Life (yr)66 *914121120
Self-Discharge (%/yr)10852108730010836536,500
* Carbon-enhanced lead-acid battery’s fixed O&M cost assumed to be the same as lead-acid battery.
Table 2. Economic factors for energy storage technology considered in this study.
Pb-APb-CLi-IonS-SV-RedoxZn-BrFlywheel
Energy Cost ($/kWh)330.00330.00600.00350.00600.00400.001600.00
Power Cost ($/kW)400.00400.00400.00350.00400.00400.00600.00
Fixed O&M Cost ($/kW-year) *1.551.550.009.004.000.0011.60
Variable O&M Cost ($/kW)0.010.010.000.000.000.000.00
* Carbon-enhanced lead-acid battery’s fixed O&M cost assumed to be the same as lead-acid battery.
Table 3. Electric power production cost for various energy storage technologies.
Pb-APb-CLi-IonS-SV-RedoxZn-BrFlywheel
Energy Storage Size (kWh)4688.004920.004329.0025,808.005847.006391.009884.00
Average State of Charge (%)97.3297.4197.2082.7697.5197.4572.74
Replacement lifetime (year)4.003.002.002.001.002.001.00
Net Present Value ($1000)1580.001652.002623.009057.003534.002582.0015,859.00
Electricity Cost ($/kW)0.460.480.762.631.030.754.61
Table 4. Assumptions used in microgrid design analysis.
#Assumption
1Hourly data is sufficient to estimate the dynamic behavior of the microgrid performance
2Load profile remains constant throughout system lifetime
3O&M costs for microgrid are negligible
4Sufficient space exists for both wind turbines and solar arrays to effectively operate (do not interfere with each other) and solar arrays receive full sun during day light hours
5Lead acid batteries have 5 year replacement lifetime
6Bad year for solar and wind generation is 90% of 2010 National Renewable Energy Laboratory (NREL) dataset (energy generation multiplied by 0.9 to account for reduced generation in this scenario)
7Demand data excludes natural gas use for environmental heating and hot water
8Transmission and supplemental electrical equipment costs are negligible
9Wind turbines and solar arrays have 20-year replacement lifetime
10Lead acid battery OPEX and O&M costs constant over the entire time considered
11European Union (EU) Emission Trading System price used to estimate cost of carbon credits
Publisher’s Note: MDPI stays neutral with regard to jurisdictional claims in published maps and institutional affiliations.