Abstract
Electricity has a crucial function in contemporary civilization. The power grid must be stable to ensure the efficiency and dependability of electrical equipment. This implies that the high-voltage equipment at the substation must be reliably operated. As a result, the appropriate and dependable use of systems to monitor the operating status of high-voltage electrical equipment has recently gained attention. Partial discharge (PD) analysis is one of the most promising solutions for monitoring and diagnosing potential problems in insulation systems. Noise is a major challenge in diagnosing and detecting defects when using this measurement. This study aims to denoise PD signals using a data decomposition method, improved complete ensemble empirical mode decomposition with adaptive noise algorithm, combined with statistical significance test to increase noise reduction efficiency and to derive and visualize the Hilbert spectrum of the input signal in time-frequency domain after filtering the noise. In the PD signal analysis, both artificial and experimental signals were used as input signals in the decomposition method. For these signals, this study has yielded significant improvement in the denoising and the PD detecting process indicated by statistical measures. Thus, the signal decomposition by using the proposed method is proven to be a useful tool for diagnosing the PD on high voltage equipment.
1. Introduction
The substation is a crucial part of the electrical system. It includes numerous expensive and complex device such as transformers, power cables, circuit breakers, and so on. Faulty primary equipment will result in serious losses, including damages in terms of repair and replacement costs of damaged objects as well as income loss due to power outages. A more critical problem is reduced power supply reliability due to frequent power interruptions [1]. Thus, maintenance and condition evaluation challenges are given much attention. The trend from time-based maintenance to condition-based maintenance is an inevitable trend to reduce unexpected system outages and improve power supply reliability [2].
Under the stress of electrical field strength, effects of environmental conditions such as temperature and humidity, and other problems during operation, the insulation system of primary equipment will degrade over time. Partial discharge (PD) measurement is an efficient and highly sensitive method that demands experienced-operator skill in data collection, processing, and analysis [3,4]. The collected signals in PD measurement are usually in the form of oscillating pulses with a wide frequency range. These signals can be represented as oscillating pulses in the time domain or as the spectrum produced by transient pulses in the frequency domain [5,6]. There are a number of studies and articles on frequency domain [7,8,9]. However, signal analysis in the frequency domain might result in information loss in the time domain [10]. In addition, there are also other problems that cause difficulty and confusion such as selecting the appropriate parameter (midband frequency, bandwidth, PD threshold, trigger, and so on) for the adaptive filter, which may lead to misdiagnosis or unstable patterns if these parameters are set incorrectly [11]. In addition, PD pulses are a transient, nonlinear, and nonstationary signal [12,13] and when comparing the performance of artificial neural networks, fast Fourier transform (FFT), and discrete wavelet transform (DWT), FFT is unsuitable for non-stationary signal processing [14]. Even though there are many noise-filtering tools in frequency domain, such as three center frequencies of relation diagram, multi-channel synchronous of PD measurement [15,16,17], and time resolved partial discharge (TRPD) [18,19], there are many challenging to extract waveform characteristics of PD pulses.
To overcome those difficulties, recently several methods have been studied that can analyze and generate signal on time-frequency domain such as wavelet transformation (WT) [20,21] or other methods [22]. However, only the WT approach is insufficient to denoise a nonstationary and nonlinear PD signal [23]. Although these methods achieve certain results in removing noise from the signal, there are still many problems such that it is difficult and confusing to choose wavelet basis functions, wavelet thresholds, decomposition levels, and so on since it depends largely on human experience [12,24].
After the empirical mode decomposition (EMD) was introduced in 1998, there has been many variations of EMD to improve noise filtering [25]. EMD based on wavelet threshold denoising method may efficiently reduce noise with minimal signal distortion [26]. Wu and Huang proposed Ensemble EMD (EEMD) in 2009 to overcome the frequency aliasing problem [27]. On the other hand, the EEMD method has two drawbacks, which are the decomposition is incomplete and the different realizations of signal mixed with white noise could generate different numbers of intrinsic mode functions (IMFs), especially in the low frequency [28]. The complete EEMD with adaptive noise (CEEMDAN) method was introduced to effectively handle the EMD decomposition scale inconsistency [29]. To solve the two disadvantages of EEMD method, Colominas et al. (2014) further improved the CEEMDAN method and proposed the improved CEEMDAN (ICEEMDAN) method, which uses the original signal as the target of IMF sifting [30]. The advantages of the ICEEMDAN method has been verified for nonlinear and non-stationary signals by numerous publications in the field of fault diagnosis [31,32].
Noise is one of the unavoidable factors of PD measurement for both conventional and non-conventional methods. Because primary equipment is connected to each other in the substations, it is difficult to determine where PD originates. In addition, in substation environments especially with transmission substations, the electrical field surrounding test object also affects data collection and may lead to a large amount of noise mixed with the PD signal. Various forms of noise may present during PD measurement, including white noise, regular impulses, oscillatory. Because of its likeness to PD signal, white noise is the most hardest to eliminate [3].
Therefore, this study aims to denoise PD signals using a data decomposition approach, ICEEMDAN algorithm, and statistical significance test to enhance noise reduction efficiency, and to create the Hilbert spectrum of the input signal in 3D after filtering the noise for visual observation and improving diagnostic skills of operators. The results are also verified by some quantitative evaluation parameters.
2. Partial Discharge (PD) Measurement
PD phenomenon occurs with signals in the form of electrical pulses, electromagnetic wave, acoustic emission, and chemical reactions. As a result, various PD measurement methods have been developed corresponding to the accompanying signal types, including the conventional method (the electrical method) and non-conventional methods (the electromagnetic method, the acoustic method, the optical method, and so on) [33,34,35]. It is necessary to have some information and comprehension of the PD processes while analyzing and implementing measuring circuits, as well as when selecting appropriate sensors. The PD mechanism and its behavioral characteristics are detailed in Appendix A.1 of Appendix A.
2.1. Conventional Method
Conventional PD measurement is the method using electrical signals mentioned in IEC 60270 standard [5], i.e., measuring the apparent charge in the measuring circuit. The apparent charge is the charge if injected a pulse between the test object’s terminals in a specific test circuit within a very short time, would provide the same value on measuring instrument as the PD current pulse itself, the unit of measurement is usually pC. Conventional measurement test circuit includes coupling capacitor connected in series with coupling capacitor or test object, balanced circuit arrangement, polarity discrimination test circuit. The most popular circuit measurement in the field is to connect coupling device to coupling capacitor in series. The conventional method according to IEC 60270 is considered as a proven effective method for performing PD measurements by many professionals, applied engineers and in the field of academic research. This method can be applied on all primary equipment (power transformer, circuit breaker, instrument transformer, power cable and so on). The limitation of this method is that it requires to separate the test subject from the grid and use an external source to generate high voltages to apply in the insulation system of the test subject. Furthermore, this method is affected by high noise levels. However, the outstanding advantage is the ability to quantify the amplitude of the partial discharge quantity, determine the partial discharge inception voltage (PDIV), partial discharge extinction voltage (PDEV) values to quickly distinguish the tested high voltage equipment pass or no pass. Therefore, the conventional method is widely used as an application for testing new electrical equipment after installation, acceptance factory test, or laboratory applications.
2.2. Non-Conventionalconventional Method
The most notable advantage of the non-conventional method is that there is no need to separate the test subject from the grid, and it does not affect the test object as well as the operating system. There are many ways to collect PD signals by non-conventional method such as using high frequency current transformer (HFCT) sensor [6], transient earth voltage (TEV) sensor [36], acoustic emission (AE) sensor [37]. The common way is to use HFCT to measure the PD signal through the grounding or neutral system of high-voltage electrical equipment. When performing partial discharge measurements in the field, there are many factors that affect the measurement and data collection process, thereby indirectly affecting the ability to diagnose and evaluate the insulation system of primary equipment. The disadvantage is that there are no standard evaluation thresholds to confirm whether the test object passes or not.
3. Materials and Methods
3.1. Materials
Typical PD pulse shapes from RLC detector circuit is an oscillating pulse with a damping amplitude [38]. To demonstrate the efficiency to filter noise with a signal shaped like a PD signal, this paper uses a damped oscillator signal generated from the arbitrary function generator (AFG) with eight pulses blended with white noise. In addition, to consider the adaptation of the proposed method to a real signal that have nonlinear and nonstationary properties, a case study was conducted to collect the experimental signal. A defect was created by cutting a 3-mm deep hold on cross linked polyethylene (XLPE) insulation of medium voltage cable (Uo = 12.7 kV), then applying a test voltage of 12.7 kV to cable insulation and acquiring the PD signal with an HFCT sensor. The PD signal was then mixed with white noise to disrupt the signal. The white noise magnitude added to the artificial signal and the experimental signal is 0.5 (normalized) and 0.005 (V), respectively.
3.2. Methods
3.2.1. Empirical Mode Decomposition (EMD)
A decomposition is a separation of a signal into different components, then analyze the newly obtained components to gain new insight into the features inherent in the whole data. There are several methods to perform such a decomposition and the EMD is one of them. The most popular decomposition method is the Fourier transform that is a coordinate transformation projecting a data onto an orthogonal basis system with sines and cosines. It covers all frequencies that could be contained in the data [39]. In a strict sense, the Fourier transform is only valid for linear and stationary data, however, nearly all of the practical data are non-linear and non-stationary [40]. The wavelet transform is an extension of the Fourier transform [41]. In addition to indicating which frequencies are significant, it also displays the time the event happened; nonetheless, its limitations have been evaluated [23].
Huang et al. were the first to propose the EMD approach in 1998 [42]. In contrast to most other decompositions, the EMD is empirical based on a concise mathematical foundation but the data itself dictate the decomposition. However, this method was first proved mathematically [43] and so far there have been many variations of EMD.
The modes produced by the EMD are called intrinsic mode function (IMF). The IMF is described as follows: “An intrinsic mode function is a function that satisfies two conditions: (1) In the whole data set, the number of extrema and the number of zero crossings must either equal or differ at most by one; and (2) at any point, the mean value of the envelope defined by the local maxima and the envelope defined by the local minima is zero.” [43]. After decomposing a signal into a set of IMFs in ascending order, the IMFs will show the corresponding descending frequency and each IMF will display the specific information of the signal in the time domain. Thus, the decomposed signal includes both time and frequency domain information. This method is performed according to the following steps [30,42]:
- Step 1.
- Set k = 0 and find all extrema of ro = x.
- Step 2.
- Interpolate between minima (maxima) of rk to obtain the lower (upper) envelope emin (emax).
- Step 3.
- Compute the mean envelope m = (emin + emax)/2.
- Step 4.
- Compute the IMF candidate dk+1 = rk − m.IMF candidate is the result of the first sifting process
- Step 5.
- Is dk+1 an IMF?An IMF is an IMF candidate that satisfy two conditions of an IMF.Yes. Save dk+1, compute the residue rk+1 = x − , do k = k + 1, and treat rk as input data in step 2.No. Treat dk+1 as input data in step 2.
- Step 6.
- Continue until the final residue rk satisfies the predefined stopping criterion.
The predefined stopping criterion is based on two thresholds and . Stop condition will be implemented as follows: Calculate the mode amplitude a(t) = (emin − emax)/2 and the evaluation function sifting process will be repeated if for some prescribed fraction (1-α) of the total duration, and for the remaining fraction. In this study, set α = 0.05, , and .
Steps 2 to 5 are the steps to find out the IMF modes, this process is called the sifting process.
3.2.2. Improved CEEMDAN (ICEEMDAN)
The ICEEMDAN algorithm is presented as follows [30].
Ek(·) is the EMD operator which create the kth mode. w(i) is the white noise. M(·) is the local mean operator.
- Step 1.
- Determine the local means of I realization using EMD x(i) = x + βoE1(w(i)) to get the first residual r1 = ⟨M1(w(1))⟩, where I is the number of realization in the ensemble and the magnitude of additional noise β > 0.
- Step 2.
- In the first phase (k = 1) compute the first mode: 1 = x − r1.
- Step 3.
- Estimate the second residue as the average of local means of the realizations r1 + β1E2(w(i)) and define the second mode: 2 = r1 − r2 = r1 − ⟨M (r1 + β1E2(w(i)))⟩.
- Step 4.
- For k = 3, …, K calculate the kth residue rk = ⟨M(rk−1 + βk−1 Ek(w(i)))⟩.
- Step 5.
- Compute the kth mode k = rk−1 − rk
- Step 6.
- Go to step 4 for next k.
Constants βk = εkstd(rk) are selected to achieve a desired signal-to-noise ration (SNR) between the additional noise and the residue to which the noise is added. Figure 1 illustrates the ICEEMDAN algorithm flowchart.
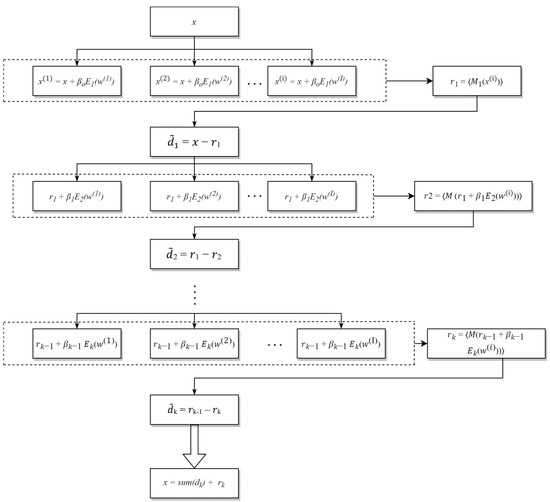
Figure 1.
The flowchart of ICEEMDAN algorithm.
3.2.3. Statistical Significance Test (SST)
After decomposing the original signal into IMFs using ICEEMDAN, these IMFs will contain both significant information and less significant information. IMFs containing less significant information are considered noise and should be removed. To determine which IMFs provides significant information to keep and which IMFs contain less information to remove, statistical significance test was introduced by Wu and Huang (2004). First, decompose the dataset of white noise which targeted into IMFs. Second, choose the confidence level and determine the upper and lower bounds. Finally, compare the IMF’s energy density from the data with the spread functions; the IMFs that have their energy located above the upper bound and below the lower bound should be providing information at that confidence level. After applying the statistical significant test, remove the IMFs which have their energy located inside the spread lines (non-significant IMFs) and reconstruct a signal by combining those significant IMFs only above and below the confidence level [28]. The spread lines may be adjusted based on the properties of the signal and the experience of user; for further information, see Appendix A.2 of Appendix A.
4. Results
4.1. Artificial Signal
To check the advantages of the mentioned method, this study will analyze the artificial signal to simulate a PD phenomenon. This artificial signal is a damped oscillatory pulse which is generated by an arbitrary function generator then it is mixed with white noise as Figure 2a and Figure 2b, respectively. The unit of the artificial signals has been normalized. The sample rate of the artificial signal is 1024 Hz. The intrinsic mode functions of the mixed signal in Figure 2b are presented in Figure 3. As shown in Figure 3, the PD signal fundamentally appears in the IMF4–IMF7 and the white noise signal is primarily localized in the high frequency IMF1–IMF3. The IMF8–IM11 contain the interference signals of different frequencies at low energy.
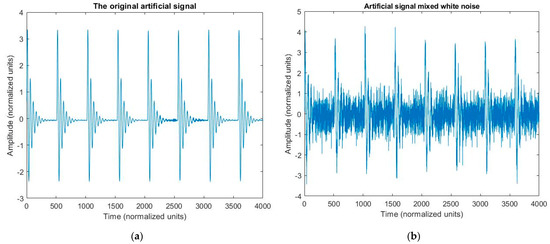
Figure 2.
(a) The original artificial damped oscillation signal from the arbitrary function generator (AFG), and (b) the artificial signal mixed with white noise.
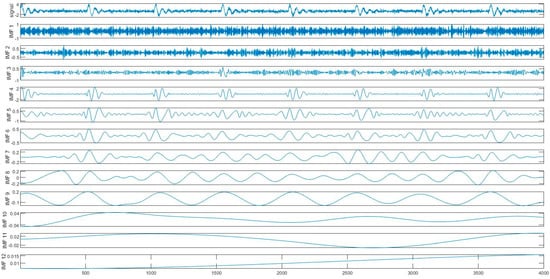
Figure 3.
The artificial signal with white noise and the resulting intrinsic mode functions (IMFs), IMF1-IMF12, obtained after decomposing with ICEEMDAN algorithm.
In the statistical significance test, we choose the confidence limit of 99% and determine the upper and lower bounds. These bounds are the energy-density spread function of the IMF components which are derived from the probability distribution. As shown in Figure 4a, there are some IMFs that have their energy located above the upper bound should be containing information, the others locate between two spread lines or locate very close these bounds may contain noisy information or contain insignificant information and should be removed. To enhance noise filtering capability, these boundaries are extended by 0.5 axial units. Therefore, the IMF1, IMF2, IMF3, IMF10, IMF11 are eliminated as in Figure 4b.
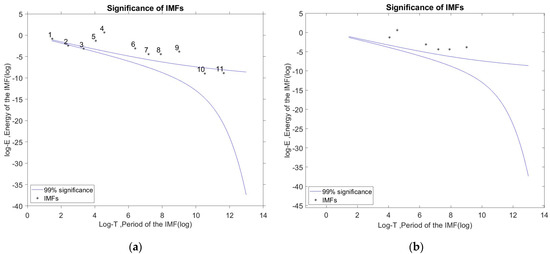
Figure 4.
(a) The statistical significance test (SST) outcomes for the IMFs (IMF1–11 from left to right) of the artificial signal, and (b) the result after removing insignificant IMFs.
As seen in the reconstructed signal after denoising in Figure 5a, the waveform with the proposed method is closer to the original signal. Both noise reduction and preserving the original signal’s properties yield good results. Figure 5b depicts the Hilbert spectrum of the de-noised signal in the time-frequency domain to assist with visualization. The extensive details about the artificial PD signal’s frequency, timing, and pattern, can be notified.
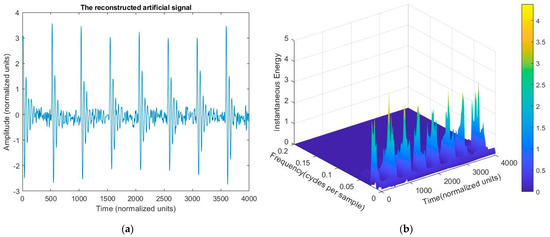
Figure 5.
The results of the reconstructed artificial signal after denoising: (a) in the time domain, and (b) the Hilbert spectrum in the time-frequency domain.
Some common evaluation parameters are used to estimate the effectiveness of the suggested de-noising method [44,45], including:
- The SNR of the input and output were determined using (1) and (2). The difference of SNR values was also computed using (3).
- 2.
- Mean square error (MSE) is applied to compare the consistency between the original signal and the de-noised signal. The lower the MSE, the closer the original and the de-noised signals are;
- 3.
- Normalized correlation coefficient (NCC) is a widely used criteria for determining signal similarity, having a value range of 0 to 1. The higher the NCC number, the more similar the two signals are;
Figure 6 provides a quantitative overview of the input and output SNR with respect to the magnitude of white noise added to the original signal. Figure 6a indicates that the maximum ∆SNR was around 9.6 dB, and the minimum was approximately 4.8 dB, with an average of 8.3 dB. This demonstrates that, even when diverse noise amplitudes are used to disrupt the PD signal, the presented approach still has significant noise filtering capabilities, even when the SNRinput is negative. Figure 6b,c shows how the assessment parameters for the proposed algorithms’ de-noising performance change with SNR. With varying SNR, the NCC results are almost equal to one and the MSE values are low, suggesting that the signal after denoising is nearly similar to the original signal.
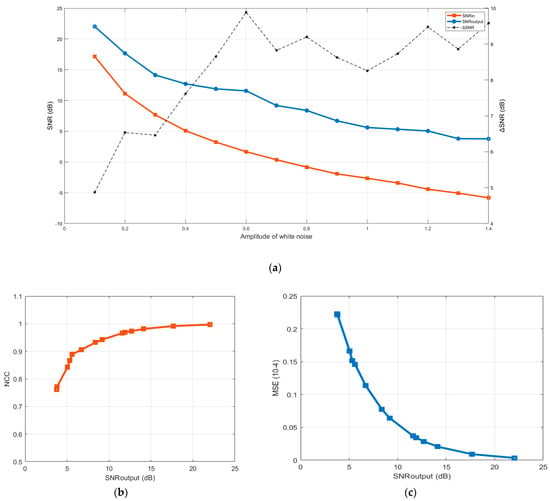
Figure 6.
(a) The difference of input and output SNR, (b) NCC, and (c) MSE with varying SNR, respectively.
4.2. Experimental Signal
The acquisition diagram for the experimental PD signal is described in Appendix A.3 of Appendix A. The sample rate of the simulate signal is Hz. The experimental PD signal demonstrated in Figure 7a is a typical signal when measuring PD on power cables due to the reflective properties of the power cable. If PD activity occurs in a power cable, two current pulses are generated. One signal travels to the beginning of the cable, while the other travels to the end and is reflected backward with diminished amplitude [46]. Due to the low level of noise interference in the laboratory condition and to keep the test results as close as possible to the PD in the field, the PD signal acquired by the experimental test is processed by adding the white noise as indicated in Figure 7b. Figure 8 displays the IMFs, where the noise signal is substantially concentrated in the IMF1–IMF2 and the PD signal is mostly present in the IMF4–IMF6. IMF3 obtains the original pulse’s properties but not the reflected pulse’s characteristic, and it also includes a considerable quantity of noise. The remaining IMFs with higher frequencies have low energies and unclear signal properties. The statistical significance test result in Figure 9a depicts the energy density of 12 IMFs, except the residual (IMF13). Consequently, the denoise technique eliminates the IMF1–IMF3, IMF9, and IMF 12 as shown in Figure 9b.
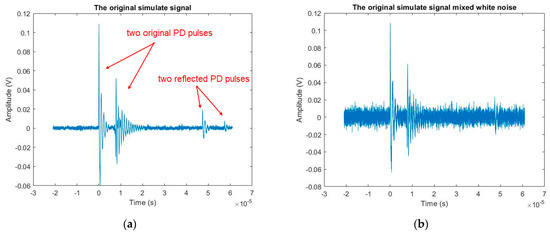
Figure 7.
(a) The original experimental signal, and (b) the experimental signal mixed with white noise.
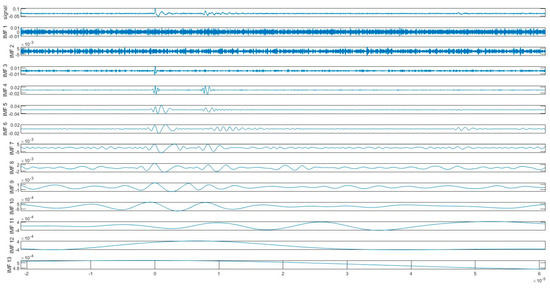
Figure 8.
The experimental signal with white noise and the resulting IMFs from ICEEMDAN.
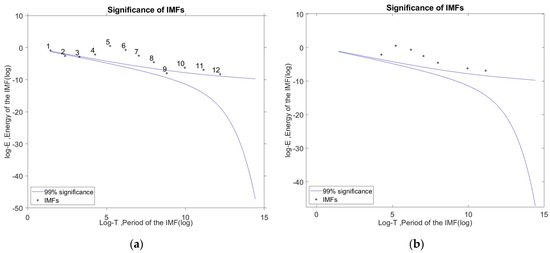
Figure 9.
(a) The statistical significance test results for the IMFs (IMF1–12 from left to right) of the experimental signal, and (b) the result after removing insignificant IMFs.
Figure 10 illustrates the outcome of reconstructing the signal from the significant IMFs containing the PD information. The white noise is effectively suppressed. In addition, the signal after denoising still has the PD pulse properties, especially the low amplitude reflected pulses at the end of signal. The PD pattern is clearly visible on the Hilbert spectrum.
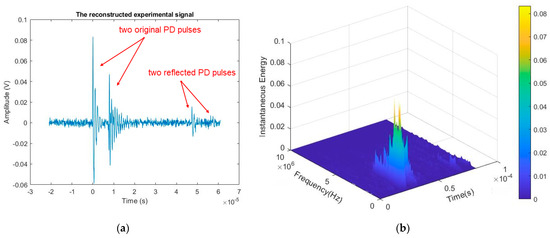
Figure 10.
The results of the reconstructed experimental signal after denoising: (a) in the time domain, and (b) the Hilbert spectrum in the time-frequency domain.
As may be observed, the signal in the time domain after denoising with the suggested approach is almost identical to the waveform of the original signal. Furthermore, the Hilbert spectrum provides us with comprehensive information on the PD phenomena in both the time-frequency domain. These results demonstrate that the proposed method is highly efficient in terms of detecting and extracting PD signals. Figure 11 displays the quantitative results of the described technique for the experimental signal in the laboratory. The quantitative computation results further indicate that the high efficacy of the applied method with the average of ∆SNR is 5.8 dB. Other evaluation indices, as shown in Figure 11, also provide good results.
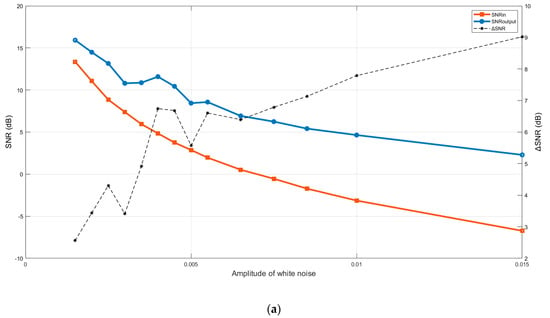
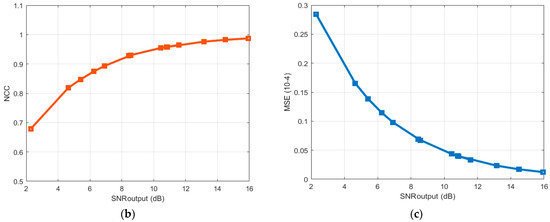
Figure 11.
(a) The difference of input and output SNR, (b) NCC and (c) MSE with varying SNR, respectively, for the experimental signal.
5. Conclusions
Many studies have applied decomposition algorithms for investigating nonlinear and non-stationary signals, and it can be stated that the ICEEMDAN algorithm has a clear advantage [28,30,44,47]. This study combines the ICEEMDAN algorithm with the statistical significance test to depict their efficacy in denoising for PD measurements. It can be inferred that the mentioned method successfully filters the white noise from the PD signal and provides the following substantial benefits.
- The proposed method effectively removes white noise while keeping and isolating the characteristics of the PD signal.
- The ICEEMDAN algorithm, in conjunction with the statistically significant test approach, reduces the difficulty of picking significant IMFs and discarding insignificant IMFs.
- The high SNR, delta SNR, and NCC parameters show that this method is very effective even when the signal amplitude is very low and the SNRinput is negative.
The Hilbert spectrum in time-frequency domain of denoised signal is very useful for quick fault categorization.
To accurately diagnose PD phenomenon in high voltage devices, it is necessary to collect signals of such defect types which will be addressed in future work. The findings described in this research are meant to lay the framework for future experimental studies. In future works, typical types of PD in the laboratory such as corona discharge, void discharge, internal discharge, and so on will be conducted and PD signals will be collected using conventional methods based on IEC 60270 standard to form a database for PD pattern analysis using machine learning algorithm.
Author Contributions
Conceptualization, software, formal analysis, investigation, resources, data curation, visualization, project administration, funding acquisition, H.S.L. and V.C.T.; methodology, H.S.L.; validation, H.S.L.; writing—original draft preparation, V.C.T.; writing—review and editing, H.S.L.; supervision, H.S.L. All authors have read and agreed to the published version of the manuscript.
Funding
V.C.T. received a support from Japanese Grant-Aid Program for Human Resource Development Scholarship (JDS).
Informed Consent Statement
Not applicable.
Data Availability Statement
Data used in this study is available from authors upon requests.
Acknowledgments
The first author thanks Hiroshima University colleagues, particularly Chisale Sylvester William, for helpful discussion and comments. The first author also thanks his Vietnamese colleagues, Dang Tran Chuyen and Le Viet Cuong, for providing input data and useful discussions.
Conflicts of Interest
The authors declare no conflict of interest.
Appendix A
Appendix A.1. Partial Discharge Mechanism
PD is the breakdown of a small part of the insulation of an insulating system under high voltage stress, which over time gradually evolves into a fault. Definition from IEC 60270 standard, PD is “localized electrical discharge that only partially bridges the insulation between conductors, and which can or cannot occur adjacent to a conductor” [5]. Partial discharge is a complex and unpredictable phenomenon because the primary equipment can be badly affected by thermal, mechanical, electrical, and environmental stresses due to overload, moisture, heat, and other critical operational conditions [48]. To simplify the operation of PDs, Figure A1 shows the dielectric of a capacitor includes a gas void and illustrates the sequence of breakdown under sinusoidal alternating voltage [49]. If the electric field strength in the insulation becomes higher than the dielectric strength of the gas inside the void, the total breakdown will appear inside the void. In this moment, the voltage of Cc drops to zero, current pulse appears, then the discharge is extinguished. The process is repeated when the electric field strength in the insulation becomes again higher than the dielectric strength of the gas inside the void. This process appears at the zero crosses of Va and depends on the voltage gradient (around the peaks the voltage gradient tends to zero). The equations and formulas for calculating the apparent charge value and how to choose the capacitance of the coupling capacitor are detailed in [49,50].
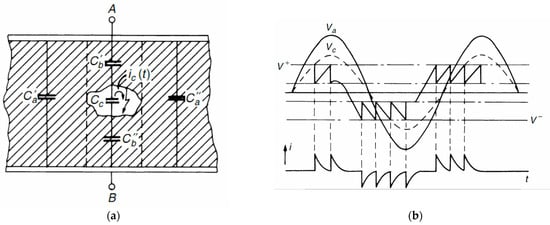
Figure A1.
Partial discharge mechanism: (a) Scheme of an insulation system comprising a cavity; (b) sequence of cavity breakdown under alternating voltages [49,51].
Appendix A.2. Spread of Energy
Figure A2 plots the spread lines for the first and 99th of white noise samples. The groups of the dots from upper left to the lower right are the energy density as a function of the averaged period for IMFs 1–9 for all 1000 samples with an identical length of 1000 data points. The superimposed black dots are the energy density as a function of the averaged period for IMFs 2–9 for a single sample with 106 data points. The bold blue dashed lines and the thin black dashed lines are the first and 99th percentiles calculated from Equations (3.6) and (3.7), respectively in [52].
As shown in Figure A2, there are still certain cases when the energy density of some IMFs is very near to its spread function. For example, a short distance below or beyond the bounds, as seen by the red circle. These spread lines can be adjusted by changing the confidence level, which is decided by signal characteristics and operator experience. During denoising for artificial signals, to enhance noise filtering capability, these boundaries are extended by 0.5 axial units.
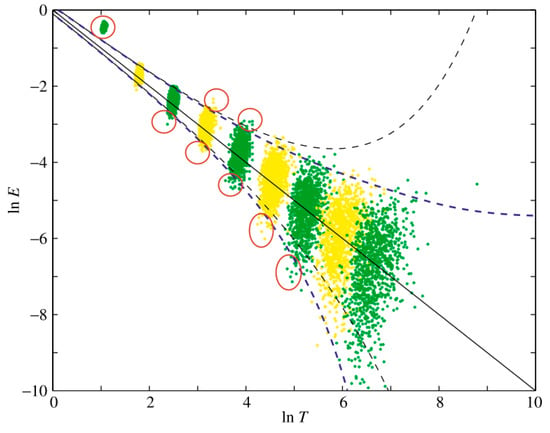
Figure A2.
The spread functions and the energy density of white noise used to determine the statistical significance of IMFs.
Appendix A.3. Experimental PD Signal Diagram;
In the laboratory, a real power cable PD signal is used to demonstrate the ability to filter noise and get the Hilbert spectrum. PD measurement diagram is shown in Figure A3. The PD test circuit at the HV laboratory is comprised of the following components: a high voltage source, a PD signal acquisition device using HFCT sensor, and a defected power cable. The defect is generated by cutting the XLPE insulation of the cable to a depth of 3 mm. The voltage from the high voltage source would be increased until PD occurred, and PD signals appear on PD signal acquisition device. In this test, it cannot be ruled out that the PD source may originate from the power supply. However, the signal’s properties indicate that it is propagated in the cable insulation environment.
Test object is a medium voltage cable with cable type 12.7/22(24) kV—single core, nominal area is 1 × 70 mm2, and dimension conductor is 9.7 mm.
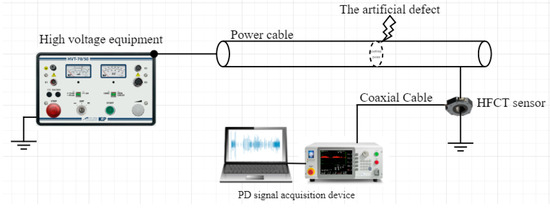
Figure A3.
Wiring diagram of the PD measurement on power cable used in this study.
References
- Singh, J.; Singh, S. Transformer Failure Analysis: Reasons and Methods. Int. J. Eng. Res. Technol. 2016, 4, 1–5. [Google Scholar]
- Cigre 761. Condition Assessment of Power Transformer, WG A2.49, no. March. 2019.
- Chan, J.C.; Ma, H.; Saha, T.K.; Ekanayake, C. Stochastic noise removal on partial discharge measurement for transformer insulation diagnosis. In Proceedings of the 2014 IEEE PES General Meeting| Conference & Exposition, National Harbor, MD, USA, 27–31 July 2014; pp. 1–5. [Google Scholar] [CrossRef]
- Gulski, E. Digital analysis of partial discharges. IEEE Trans. Dielectr. Electr. Insul. 1995, 2, 822–837. [Google Scholar] [CrossRef]
- IEC 60270. High-Voltage Test Techniques—Partial Discharge Measurement, 3rd ed.; IEC: Geneva, Switzerland, 2015. [Google Scholar]
- IEC TS 62478. High Voltage Test Techniques—Measurement of Partial Discharges by Electromagnetic and Acoustic Methods, 1st ed.; IEC: Geneva, Switzerland, 2016. [Google Scholar]
- Kopf, U.; Feser, K. Rejection of narrow-band noise and repetitive pulses in on-site PD measurements [corrected version]. IEEE Trans. Dielectr. Electr. Insul. 1995, 2, 1180–1191. [Google Scholar] [CrossRef]
- Khan, S.Z.; Deheng, Z.; Xianhe, J.; Kexiong, T. A new adaptive technique for on-line partial discharge monitoring. IEEE Trans. Dielectr. Electr. Insul. 1995, 2, 700–707. [Google Scholar] [CrossRef]
- Fruth, B.; Florkowski, M.; Gross, D. Partial discharge signal generation, transmission and acquisition. In Proceedings of the 1993 International Conference on Partial Discharge, Canterbury, UK, 28–30 September 1993; pp. 27–28. [Google Scholar]
- Sumarwoto, T.; Basuki, A.; Khayam, U.; Hozumi, N. Partial Discharge Signal Denoising by Discrete Wavelet Transformation. EPI Int. J. Eng. 2018, 1, 76–82. [Google Scholar] [CrossRef][Green Version]
- Zhao, L.; He, J.; Sun, Y. Research on Noise Recognition and Suppression of Partial Discharge On-line Monitoring in Transformer. IEEJ Trans. Fundam. Mater. 2007, 127, 729–733. [Google Scholar] [CrossRef]
- Jin, T.; Li, Q.; Mohamed, M.A. A Novel Adaptive EEMD Method for Switchgear Partial Discharge Signal Denoising. IEEE Access 2019, 7, 58139–58147. [Google Scholar] [CrossRef]
- Zhou, X.; Zhou, C.; Kemp, I. An improved methodology for application of wavelet transform to partial discharge measurement denoising. IEEE Trans. Dielectr. Electr. Insul. 2005, 12, 586–594. [Google Scholar] [CrossRef]
- Yusoff, N.A.; Isa, M.; Hamid, H.A.; Adzman, M.R. Denoising technique for partial discharge signal: AAA comparison performance between artificial neural network, fast fourier transform and discrete wavelet transform. In Proceedings of the PECON 2016—2016 IEEE 6th International Conference on Power and Energy, Melaka, Malaysia, 28–29 November 2017; pp. 311–316. [Google Scholar] [CrossRef]
- Strachan, S.M.; Rudd, S.; McArthur, S.D.; Judd, M.D.; Meijer, S.; Gulski, E. Knowledge-based diagnosis of partial discharges in power transformers. IEEE Trans. Dielectr. Electr. Insul. 2008, 15, 259–268. [Google Scholar] [CrossRef]
- Kraetge, A.; Rethmeier, K.; Kruger, M.; Winter, P. Synchronous multi-channel PD measurements and the benefits for PD analyses. In Proceedings of the IEEE PES Transmission and Distribution Conference and Exposition, New Orleans, LA, USA, 19–22 April 2010; pp. 1–6. [Google Scholar] [CrossRef]
- Krüger, M.; Kraetge, A.; Koch, M.; Rethmeier, K.; Pütter, M.; Hulka, L.; Summereder, C. New Diagnostic Tools for High Voltage Bushings; ISH: South Africa, 2009; p. 45. [Google Scholar]
- Mazroua, A.A.; Bartnikas, R.; Salama, M.M.A. Discrimination between PD pulse shapes using different neural network paradigms. IEEE Trans. Dielectr. Electr. Insul. 1994, 1, 1119–1131. [Google Scholar] [CrossRef]
- Zhong, Z.; Kexiong, T. Partial discharge recognition based on pulse waveform using time domain data compression method. In Proceedings of the 6th International Conference on Properties and Applications of Dielectric Materials, Xi′an, China, 21–26 June 2000; Volume 1, pp. 483–486. [Google Scholar] [CrossRef]
- Satish, L.; Nazneen, B. Buried in Excessive Noise and Interference. IEEE Trans. Dielectr. Electr. Insul. 2003, 10, 354–367. [Google Scholar] [CrossRef]
- Tang, J.; Zhou, S.; Pan, C. A Denoising Algorithm for Partial Discharge Measurement Based on the Combination of Wavelet Threshold and Total Variation Theory. IEEE Trans. Instrum. Meas. 2019, 69, 3428–3441. [Google Scholar] [CrossRef]
- Kunicki, M.; Wotzka, D. A Classification Method for Select Defects in Power Transformers Based on the Acoustic Signals. Sensors 2019, 19, 5212. [Google Scholar] [CrossRef] [PubMed]
- Lin, M.-Y.; Tai, C.-C.; Tang, Y.-W.; Su, C.-C. Partial discharge signal extracting using the empirical mode decomposition with wavelet transform. In Proceedings of the 2011 7th Asia-Pacific International Conference on Lightning, Chengdu, China, 1–4 November 2011; pp. 420–424. [Google Scholar] [CrossRef]
- Zhong, J.; Bi, X.; Shu, Q.; Chen, M.; Zhou, D.; Zhang, D. Partial Discharge Signal Denoising Based on Singular Value Decomposition and Empirical Wavelet Transform. IEEE Trans. Instrum. Meas. 2020, 69, 8866–8873. [Google Scholar] [CrossRef]
- Zhang, J.; Guo, Y.; Shen, Y.; Zhao, D.; Li, M. Improved CEEMDAN–wavelet transform de-noising method and its application in well logging noise reduction. J. Geophys. Eng. 2017, 15, 775–787. [Google Scholar] [CrossRef]
- Pei, Y.; Wu, Y.; Jia, D. Research on PD signals denoising based on EMD method. Prz. Elektrotechniczny 2012, 88, 137–140. [Google Scholar]
- Wu, Z.; Huang, N.E. Ensemble empirical mode decomposition: A noise-assisted data analysis method. Adv. Adapt. Data Anal. 2009, 1, 1–41. [Google Scholar] [CrossRef]
- Lee, H.S. Improvement of Decomposing Results of Empirical Mode Decomposition and its Variations for Sea-level Records Analysis. J. Coast. Res. 2018, 85, 526–530. [Google Scholar] [CrossRef]
- Flandrin, P.; Torres, E.; Colominas, M.A. A Complete Ensemble Empirical Mode Decomposition; Laboratorio de Senales y Dinamicas no Lineales, Universidad Nacional de Entre R; Laboratoire de Physique (UMR CNRS 5672), Ecole Normale Superieure de Lyon: Entre Ríos, Argentina; Lyon, France,, 2011; pp. 4144–4147. [Google Scholar]
- Colominas, M.A.; Schlotthauer, G.; Torres, M.E. Improved complete ensemble EMD: A suitable tool for biomedical signal processing. Biomed. Signal Process. Control 2014, 14, 19–29. [Google Scholar] [CrossRef]
- Han, H.; Cho, S.; Kwon, S.; Cho, S.-B. Fault Diagnosis Using Improved Complete Ensemble Empirical Mode Decomposition with Adaptive Noise and Power-Based Intrinsic Mode Function Selection Algorithm. Electronics 2018, 7, 16. [Google Scholar] [CrossRef]
- Kou, Z.; Yang, F.; Wu, J.; Li, T. Application of ICEEMDAN Energy Entropy and AFSA-SVM for Fault Diagnosis of Hoist Sheave Bearing. Entropy 2020, 22, 1347. [Google Scholar] [CrossRef]
- Búa-Núñez, I.; Roman, J.E.P.; Rubio-Serrano, J.; Garcia, J.A. Instrumentation System for Location of Partial Discharges Using Acoustic Detection with Piezoelectric Transducers and Optical Fiber Sensors. IEEE Trans. Instrum. Meas. 2013, 63, 1002–1013. [Google Scholar] [CrossRef]
- Antony, D.; Punekar, G.S. Noniterative Method for Combined Acoustic-Electrical Partial Discharge Source Localization. IEEE Trans. Power Deliv. 2017, 33, 1679–1688. [Google Scholar] [CrossRef]
- Wang, Y.-B.; Chang, D.-G.; Fan, Y.-H.; Zhang, G.-J.; Zhan, J.-Y.; Shao, X.-J.; He, W.-L. Acoustic localization of partial discharge sources in power transformers using a particle-swarm-optimization-route-searching algorithm. IEEE Trans. Dielectr. Electr. Insul. 2017, 24, 3647–3656. [Google Scholar] [CrossRef]
- Luo, G. Transient Earth Voltage (TEV) Based Partial Discharge Detection and Analysis. Ph.D. Thesis, Nanyang Technological University, Singapore, 2019. [Google Scholar] [CrossRef]
- Wang, L.; Wang, H.; Wang, L.; Lu, H.; Ning, W.; Jia, S.; Wu, J. Experimental investigation of transient earth voltage and acoustic emission measurements of partial discharge signals in medium-voltage switchgears. In Proceedings of the 2013 2nd International Conference on Electric Power Equipment-Switching Technology (ICEPE-ST), Matsue, Japan, 20–23 October 2013; pp. 1–4. [Google Scholar] [CrossRef]
- Ma, X.; Zhou, C.; Kemp, I. Automated wavelet selection and thresholding for PD detection. IEEE Electr. Insul. Mag. 2002, 18, 37–45. [Google Scholar] [CrossRef]
- Roepstorff, G. Fourier Decomposition. In Path Integral Approach to Quantum Physics; Springer: Berlin/Heilderberg, Germany, 1994; pp. 150–169. [Google Scholar] [CrossRef]
- Shrivastava, Y.; Singh, B. A comparative study of EMD and EEMD approaches for identifying chatter frequency in CNC turning. Eur. J. Mech. 2019, 73, 381–393. [Google Scholar] [CrossRef]
- Thomas, M.W. Noise Reduction for LSTM using Wavelet Transform and Singular Spectrum Analysis; Leland Stanford Junior University: Stanford, CA, USA, 2021. [Google Scholar]
- Huang, N.E.; Shen, Z.; Long, S.R.; Wu, M.C.; Shih, H.H.; Zheng, Q.; Yen, N.-C.; Tung, C.C.; Liu, H.H. The empirical mode decomposition and the Hilbert spectrum for nonlinear and non-stationary time series analysis. Proc. R. Soc. Lond. Ser. A Math. Phys. Eng. Sci. 1998, 454, 903–995. [Google Scholar] [CrossRef]
- Ge, H.; Chen, G.; Yu, H.; Chen, H.; An, F. Theoretical Analysis of Empirical Mode Decomposition. Symmetry 2018, 10, 623. [Google Scholar] [CrossRef]
- Shang, H.; Li, Y.; Xu, J.; Qi, B.; Yin, J. A Novel Hybrid Approach for Partial Discharge Signal Detection Based on Complete Ensemble Empirical Mode Decomposition with Adaptive Noise and Approximate Entropy. Entropy 2020, 22, 1039. [Google Scholar] [CrossRef]
- Shams, M.A.; Anis, H.I.; El-Shahat, M. Denoising of Heavily Contaminated Partial Discharge Signals in High-Voltage Cables Using Maximal Overlap Discrete Wavelet Transform. Energies 2021, 14, 6540. [Google Scholar] [CrossRef]
- Robles, G.; Shafiq, M.; Martinez-Tarifa, J.M. Multiple Partial Discharge Source Localization in Power Cables Through Power Spectral Separation and Time-Domain Reflectometry. IEEE Trans. Instrum. Meas. 2019, 68, 4703–4711. [Google Scholar] [CrossRef]
- Fang, K.; Zhang, H.; Qi, H.; Dai, Y. Comparison of EMD and EEMD in rolling bearing fault signal analysis. In Proceedings of the 2018 IEEE International Instrumentation and Measurement Technology Conference (I2MTC), Houston, TX, USA, 14–17 May 2018; pp. 1–5. [Google Scholar] [CrossRef]
- de Castro, B.A.; dos Santos, V.V.; Lucas, G.B.; Ardila-Rey, J.A.; Riehl, R.R.; Andreoli, A.L. A Comparative Analysis Applied to the Partial Discharges Identification in Dry-Type Transformers by Hall and Acoustic Emission Sensors. Sensors 2022, 22, 1716. [Google Scholar] [CrossRef] [PubMed]
- Inestigation of long term Ageing in Solid Insulatingmaterial by Studying the Effect of Variation of Parameters and Wavelettransform Analsis on Real Timed Data on Partial Discharge. Available online: http://hdl.handle.net/10603/34689 (accessed on 30 July 2022).
- Morshuis, P.; Smit, J. Partial discharges at dc voltage: Their mechanism, detection and analysis. IEEE Trans. Dielectr. Electr. Insul. 2005, 12, 328–340. [Google Scholar] [CrossRef]
- Gockenbach, E. High Voltage Engineering; Springer Handbooks: Cham, Switzerland, 2021; pp. 131–182. [Google Scholar]
- Landon, V.D. A Study of the Characteristics of Noise. Proc. IRE 1936, 24, 1514–1521. [Google Scholar] [CrossRef]
Publisher’s Note: MDPI stays neutral with regard to jurisdictional claims in published maps and institutional affiliations. |
© 2022 by the authors. Licensee MDPI, Basel, Switzerland. This article is an open access article distributed under the terms and conditions of the Creative Commons Attribution (CC BY) license (https://creativecommons.org/licenses/by/4.0/).