1. Introduction
A broad and profound digital revolution is coming in this era. Digital transformation is playing an increasingly prominent role in various application areas, such as service providers [
1], smart cities [
2], public sector services [
3], healthcare and infectious diseases [
4,
5], and marketing [
6], among others. At the national level in China, digitization is receiving increasing attention. The development of digitalization will be the future direction of the country for some time. During China’s 13th Five-Year Plan, companies have made significant progress in information technology development. The 19th Party Congress proposed to build a strong network, a digital China and a smart society, and to promote the deep integration of the Internet, big data, artificial intelligence, and the real economy. China’s 14th Five-Year Plan proposes to “accelerate digital development and build a digital China”. Digital transformation has gradually become an inevitable choice for enterprises to survive, create core competitiveness, and achieve sustainable development. Power grid enterprises follow the social development trend and implement big data strategy. However, compared with digital native enterprises, the digital transformation of traditional enterprises is difficult [
7]. The choice of digital project solution issues a challenge to traditional enterprises, such as grid enterprises. If the wrong choice is made, it will slow down the digital transformation of the enterprise and make the enterprise suffer from the digital wave. Therefore, in order to reduce the negative impact of program decision errors and avoid irreparable damage, grid enterprises need to establish a comprehensive and appropriate digital project program selection evaluation index system. Based on the experience of implemented digitalization projects, a sensitivity analysis of the index weights has been conducted to determine reasonable evaluation index weights, and, finally, according to the results, to determine a robust long-term quality digitalization project.
The power grid system is an important aspect of infrastructure for national development. Its construction scale and quality will be directly related to people’s livelihood and economic development [
8]. Along with the continuous development of digital technology in China, the connection between digitalization and the electric power network is gradually deepening, and the importance of digitalization projects in power grid enterprises is becoming increasingly apparent. At present, in the face of the complex application of multiple scenarios of digital construction, multi-dimensional comprehensive evaluation, intelligent identification of target characteristics, quantitative control of dynamic evaluation, and other technical and economic evaluation needs, the traditional post-evaluation methods carried out manually cannot realize the requirements of online automated intelligent evaluation and cannot adapt to the new situation of digital construction evaluation needs. There is an urgent need to carry out research for the evaluation of grid digitalization construction project programs. Considering various factors, such as digital system and cross-domain data reuse, an index system for evaluating the economic benefits of enterprise digitization is established. An index screening and weight sensitivity analysis model is constructed to solve the practical problems of quantitative evaluation faced in the process of digital transformation and construction of enterprises. Therefore, this paper aims to establish a cloud-model-based evaluation and selection decision method for the digitalization project scheme of power grid enterprises. First, this paper uses CiteSpace software to visualize and analyze the literature on enterprise digitization published in the CNKI platform and draw a knowledge map. We explore the research hotspots and research trends of enterprise digitization and explore the development of digitization project evaluation indexes and evaluation methods, as well as cloud models. Secondly, based on the existing focus and research results, a comprehensive evaluation index system for digitalization projects is established from five aspects: economic efficiency, interconnection, intelligent management, value release, and development innovation. In addition, for the digitalization project program, the coefficient of variation method is first used to filter on the basis of the established index system. Then, the LSOM (linear stochastic optimized model) is used to generate evaluation index weights in the range. Then, a sensitivity analysis is performed on the evaluation index weights based on the cloud model to discern the most universal evaluation index weights. The obtained weights are used to decide the robust and long-term quality digitalization projects to promote the digital transformation of grid enterprises. Finally, the calculation example shows that the method is feasible and has some practical significance for the comprehensive evaluation of digitalization projects.
3. Comprehensive Evaluation Index System of Digital Projects
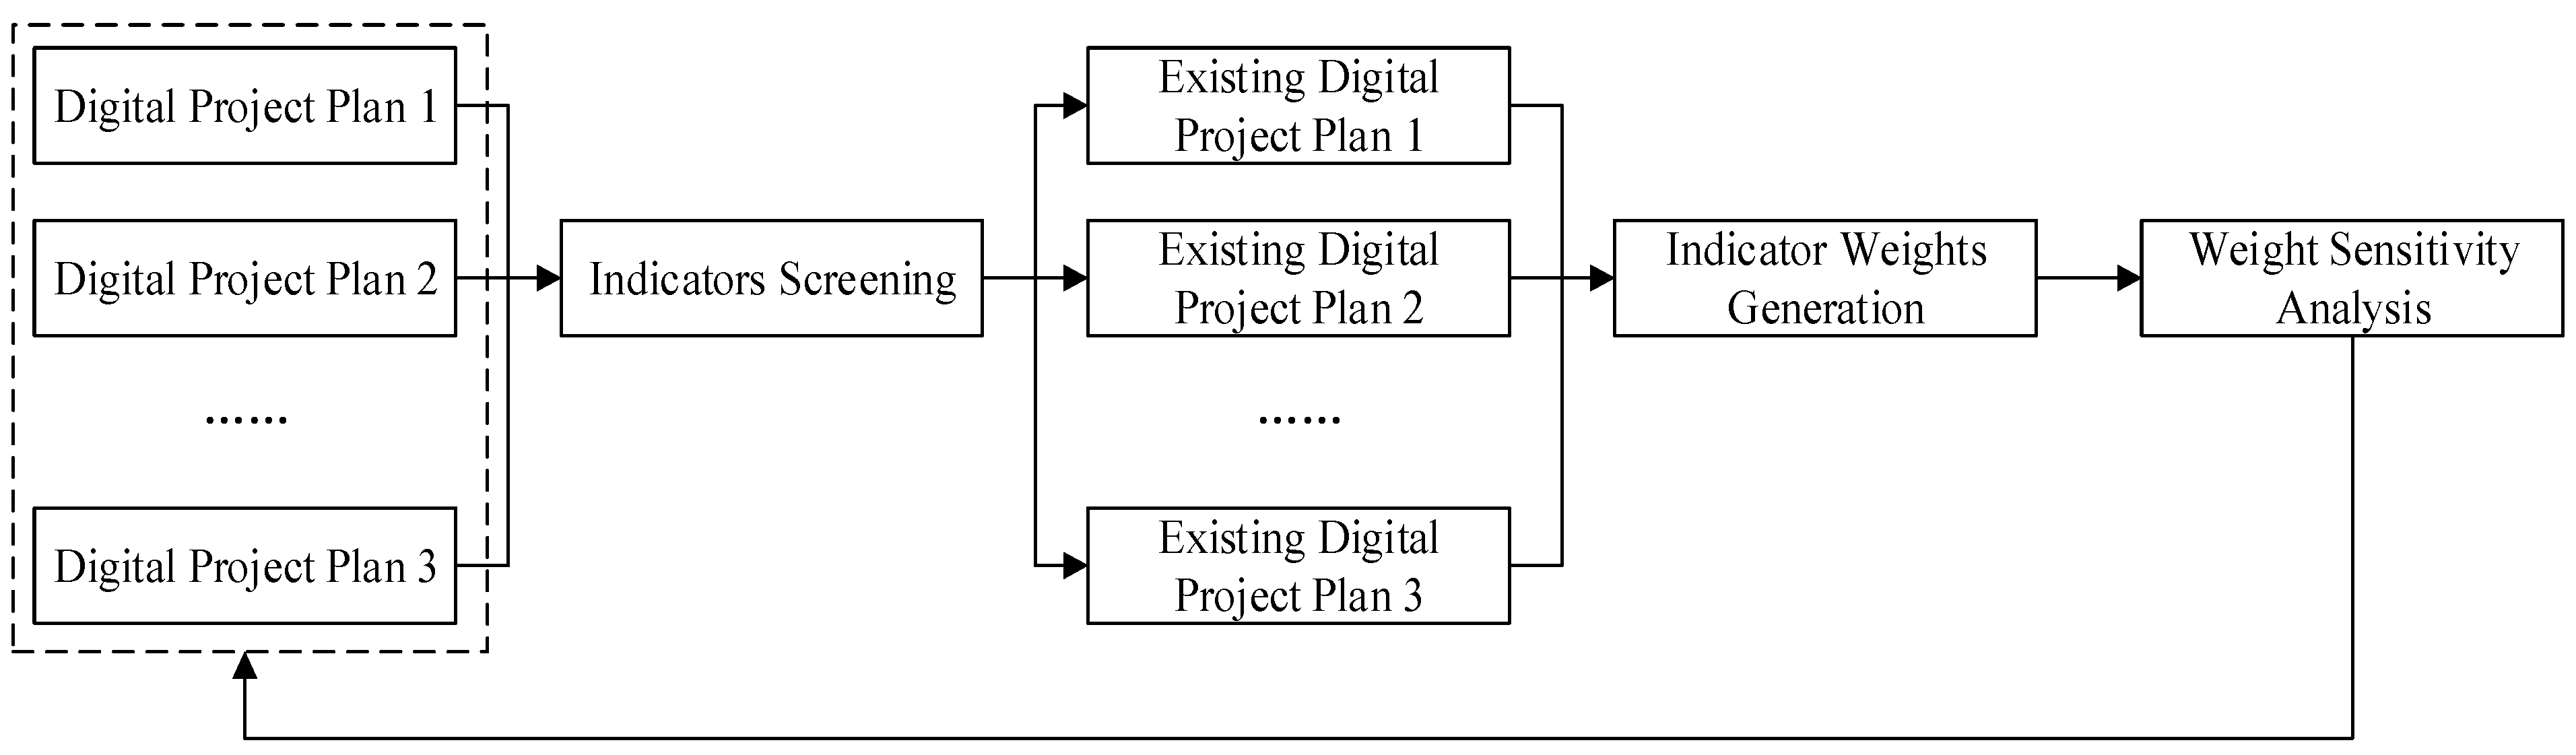
The current evaluation index system in enterprise digitalization is generally the evaluation index system of enterprise digital transformation or the evaluation index system of enterprise digital-level assessment. The research on the comprehensive evaluation of the digitalization project program is still in the initial stage, and a unified evaluation index system has not been formed yet. This paper establishes an evaluation index system based on existing literature studies and the STATE GRID Corporation of China’s understanding of digital transformation. The idea is shown in
Figure 4.
The digital transformation of the STATE GRID Corporation of China is based on the following three points: (1) digitalization is an inevitable choice to adapt to the trend of the energy revolution and the digital revolution; (2) digitalization is an inherent requirement to enhance management and improve services; (3) digitalization is a powerful engine to cultivate new opportunities and new growth points. Based on this, the STATE GRID Corporation of China for digitalization project program focus on the evaluation direction can be from these three aspects. The first point lies in the interconnection, that digitalization is based on accurate data collection, efficient transmission, and safe and reliable utilization, which cannot be separated from the support of network, platform, and other software and hardware infrastructure, as well as that the data can be reused in the field, which is also the embodiment of its connectivity. The second point lies in the intelligent management, digital project operation, and enhancing the effect to a large extent, which affects whether it can achieve a more excellent use of value, and data system security is also an important guarantee for management. The third point is the value release; big data is a “rich mine” and there is a huge value mining potential based on the digital project national grid that can actively develop platform business, data products business, and efforts to provide customers with multiple services.
Besides, it was found in the process of literature review that economy, efficiency, and prospect are usually considered in the construction of an evaluation index system. Economy and efficiency are in conflict with each other, so the evaluation of the digitalization project should not focus on economic efficiency or efficiency improvement, but economic efficiency is the best goal. In the digital project prospect, the degree of fit with the STATE GRID Corporation of China development direction and innovation ability is the key assessment direction of whether the digital project can be developed for a long time. Therefore, the development of innovation should also be included in the evaluation scope of the digital project program.
In summary, this paper takes the objectives reached by the digitalization project of power grid enterprises as the basis and follows the principles of comprehensiveness, scientificity, purposefulness, independence, and combination of quantitative and qualitative. The comprehensive evaluation index system is divided into five primary evaluation indexes of economic efficiency, interconnection, intelligent management, value release, and development innovation and has corresponding secondary evaluation indexes, totaling 22 secondary indexes. Regarding the setting of the second-level indicators and the calculation methods shown, they are improved on the basis of the research on enterprise digitization literature, fitting the nature of digitization project programs, and not exactly the same as the results of existing studies. Among them, , , , , , , , , , , , , , , are qualitative indicators, which cannot be calculated to obtain the evaluation value, and experts in the relevant fields need to be invited to score this evaluation value under the program. The scoring criteria are: the scoring criteria range from 1–10 points, the neutral value is 5 points, the higher the score, the better the effect, and the lower the score, the worse the effect.
3.1. Economic Efficiency
- (1)
Income Growth Index
Reflect the performance of digital projects. The income growth index is a comprehensive assessment index, which examines the growth rate of the project’s own income, the growth rate of the project’s own profit, the average income growth rate of the same type of projects, the average profit growth rate of the same type of projects, and the relationship between them.
Income Growth Index = 25% × the growth rate of the project’s own income + 25% × the growth rate of the project’s own profit + 25% × the average income growth rate of the same type of projects + 25% × the average profit growth rate of the same type of projects
- (2)
Degree of Cost Savings
Reflect the benefit status after the implementation of the digital project.
Degree of Cost Savings = (costs before the implementation of digital projects − costs after the implementation of digital projects)/costs before the implementation of digital projects × 100%.
- (3)
Business Process Improvement
Reflect the performance of digital projects. This indicator mainly reflects the improvement of business processes and business functions after the application of the information system, including the deletion and streamlining of redundant processes. The evaluation value is obtained by scoring.
- (4)
Data Multiplexing Effect
Reflect the efficiency of digital projects. This indicator mainly reflects the effect of digital projects on the use of existing data.
Data Multiplexing Effect = (number of fields using existing data in digitization project/total number of fields requiring data for digitization project) × 100%
- (5)
System Efficient Construction Level
Reflect the efficiency of digital projects. This indicator mainly reflects the construction level of the digital system of the digital project, including the simplification of business processing procedures and the degree of functional perfection. The evaluation value is obtained by scoring.
3.2. Interconnection
- (1)
Office Automation Operating System Application Degree
Reflect the status of office automation based on network applications in digital projects.
Office Automation Operating System Application Degree = (the number of functions realized by the office automation system of the digital project/the total number of office automation system functions) × 100%
- (2)
Coverage of Digital Means of Information Collection
Reflect the ability of a digital project to effectively acquire external information.
Coverage of Digital Means of Information Collection = (number of fields in which digital means have been applied to information collection in digital projects/number of fields where digital means can be applied) × 100%
- (3)
Data Multiplexing Field
Reflect the areas in which the data collected by the digitization project are utilized. This indicator mainly reflects the ability of digital projects to reduce the cost and expense of repeated development of digital technology.
Data Multiplexing Field = (number of fields that can be used for data collected by digital projects/total number of fields) × 100%
3.3. Intelligent Management
- (1)
User-friendly Interface
Reflect how the digital project operating system operates. Friendly interface usually means that the software has a beautiful opening interface, easy to learn, easy to use, strong operability, promotes human-computer interaction, and gives people a beautiful, comfortable, and generous feeling. The evaluation value is obtained through the satisfaction survey of digital project operators.
- (2)
Business Function Achievement
Reflect how the digital project operating system operates. This indicator mainly reflects the ability of the digital project to complete the business.
Business Function Achievement = (digital project actual business function/digital project expected business function) × 100%
- (3)
Digitization Level of Core Business Processes
Reflect the nature of the digital project operating system itself. This indicator mainly reflects the depth and breadth of digitization of core business processes of digital projects. This indicator is examined through the scope of business processes covered by digital technology and whether the business process achieves optimal control.
- (4)
System Reliability
Reflect the nature of the digital project operating system itself. This indicator mainly reflects the reliability of the digital project operation system. Check the fault tolerance of key functions, whether they can be recovered, and the mean time between failures.
Reflect the nature of the digital project operating system itself. This indicator mainly reflects the ability of digital projects to protect data. Check the auditability of access, controllability of access, data confidentiality, and data security.
3.4. Value Release
- (1)
Customer Service Improvement
Reflects the contribution of digital projects to the enterprise. This indicator mainly reflects the contribution of digital projects to serving customers and improving customer satisfaction. The evaluation value is obtained by conducting a satisfaction survey on the customer base targeted by the digitalization project.
- (2)
Model Promotion Value
Reflects the contribution of digital projects to the industry. This indicator mainly reflects the contribution value of the digital project model to promoting the digital construction of the industry. The evaluation value is obtained by scoring.
- (3)
Data Management Visualization
Reflects the degree to which data are utilized by the digitization project. This indicator mainly reflects the effect of digital projects in data management visualization. The evaluation value is obtained by scoring.
- (4)
Information Mining Value
Reflects the degree to which data are utilized by the digitization project. This indicator mainly reflects the value of digital projects in exploring potential customers, discovering new business opportunities, and providing information services. The evaluation value is obtained by scoring.
3.5. Development and Innovation
- (1)
Optimize the Power Supply Level
Reflect the development capabilities of digital projects. This indicator mainly reflects the contribution of digital projects to power supply optimization and reflects the ability of sustainable development. The evaluation value is obtained by scoring.
- (2)
System Iteration Timeliness
Reflect the development capabilities of digital projects. This indicator mainly reflects the timeliness of system iteration during the implementation of digital projects. The interval period and the number of iterations of the system iteration during the inspection period are inspected.
- (3)
Carbon Emissions Reduction
Reflects the development capabilities of digital projects. This indicator mainly reflects the functions of digital projects in terms of energy conservation and emission reduction. The evaluation value is obtained by scoring.
- (4)
System Expansion Capability
Reflect the innovative ability of digital projects. This indicator mainly reflects the innovation vitality of the digital project in the system and reflects the development prospects of the project. The evaluation value is obtained by scoring.
- (5)
Business Innovation Capability
Reflect the innovative ability of digital projects. Test the innovative vitality of the digital project in business, and reflect the development prospects of the project. The evaluation value is obtained by scoring.
4. Sensitivity Analysis of Weights of Comprehensive Evaluation Indicators for Digital Projects
The comprehensive evaluation of digital projects is inseparable from the determination of the weights of evaluation indicators. The weight distribution reflects the importance or contribution of various indicators. Determining the weight is the basis of comprehensive evaluation. Based on the experience of existing projects, the sensitivity analysis of the evaluation indicators is carried out, and the most universal evaluation indicator weights are obtained, which is conducive to the scientific and comprehensive comparison and selection of digital projects.
4.1. Variation Coefficient Screening Method Based on Index Discrimination
The coefficient of variation method was used to examine the degree of data difference between different programs under the same index. The greater the coefficient of variation, the greater the difference, and the greater the impact on the evaluation results [
45]. Directly use the information of each index to reflect the gap between the evaluation indicators.
The formula for the coefficient of variation of each indicator is as follows:
is the coefficient of variation of the -th indicator, is the standard deviation of the -th indicator, and is the average of the -th indicator. Criteria for screening indicators by the coefficient of variation method: delete the indicator with the smallest coefficient of variation under the first-level indicators.
4.2. Indicator Weight Generation Based on LSOM
The research on determining the weight has always been an important research topic in the social work profession. At present, there are many methods for determining the weight of attributes, which can be roughly divided into three categories: subjective weighting, objective weighting method, and subjective and objective weighting method. The subjective and objective weighting method is usually the derivation of the subjective weighting method and objective weighting method, so this paper only considers the subjective weighting method and the objective weighting method.
The weight of each evaluation index was obtained by using two subjective weighting methods, Delphi method and AHP, and two objective weighting methods, entropy method and mean square error method. According to the weights obtained by the weighting method, the maximum and minimum ranges of weight values are determined for the multiple groups of weights generated later. The maximum value of the obtained weight under each method is taken as the upper bound of the weight, and the minimum value is taken as the lower bound of the weight. The weight values are generated using the LSOM (linear stochastic optimized model). The model can be briefly described as follows:
is the penalty function, is the number of evaluation indicators, is the upper bound of the evaluation index weight, is the lower bound of the evaluation index weight, is the weight value, and is a real number between 0 and 1.
Through this model, the expected weight of the evaluation index of the array can be obtained, which is convenient for the subsequent analysis of the weight sensitivity.
4.3. Weight Sensitivity Analysis Based on Cloud Model Theory
Cloud model theory is a theory for dealing with uncertain problems that completes the conversion between qualitative and quantitative concepts, and organically associates ambiguity and randomness. On the basis of the normal distribution function and the normal membership function, the cloud model reflects the integrity of the cloud concept and mainly uses the three digital features of expectation
, entropy
, and hyperentropy
to represent the cloud concept as a whole. Expectation
represents the central value in the universe of discourse; entropy
represents a measure of the randomness of qualitative concepts and the degree of dispersion of cloud droplets; hyperentropy
represents the cohesion of the uncertainty of all points of the language value in the universe of discourse and the association of ambiguity and randomness, which indirectly reflects the thickness of the cloud. The normal cloud model is a commonly used cloud model, which is based on the general applicability of normal distribution and normal membership functions, and is realized by a normal cloud generator [
46]. This paper will use the normal cloud model for the analysis.
Only the change of one index value is considered at a time, and the other index values remain unchanged. The ranking changes of each scheme are counted, and the value range that keeps the optimal scheme unchanged is determined. Introduce cloud model theory for index sensitivity analysis: use the closeness obtained by each historical digital project under the change of index value as the digital feature of the cloud model, first use the reverse cloud generator to generate the respective cloud model, and then use the forward cloud generator to generate cloud map. Finally, the weight sensitivity of the evaluation index can be analyzed by comparing the size of , , , and the number of overlapping parts of the cloud image. Specific steps are as follows:
- (1)
Find the possible value range of the indicator as ;
- (2)
Assign an initial value of to , and set the step size to until it reaches ;
- (3)
The values of other indicators remain unchanged, the closeness of each scheme to the optimal scheme is calculated, and the ranking of each scheme is counted;
- (4)
Let ; repeat step (3) until ;
- (5)
The above steps are repeated, and the degree of closeness of each alternative to the ideal point in the entire value interval of the change in other index values is counted in turn;
- (6)
Calculate the sample mean , the first-order sample absolute center distance , and the sample variance from the data ;
- (7)
Find the mean as the expectation ;
- (8)
Calculate the entropy according to the first-order absolute center distance of the sample ;
- (9)
According to the sample variance and the calculated entropy, the hyperentropy is calculated, and the cloud model of the scheme can be obtained;
- (10)
With as the expected value and as the standard deviation, a normal random number is generated;
- (11)
With as the expected value and as the standard deviation, a normal random number is generated;
- (12)
Calculate ; let be the cloud drop;
- (13)
Repeat steps (9)–(12) until cloud droplets are generated to form a cloud image.
After the above steps, the degree of overlap among the schemes can be judged from the cloud diagram with the same scheme ranking for each group of weights. The greater the degree of overlap, the more unstable the program ranking of the group of weights is in conducting program evaluation, and the less obvious the distinction of the obtained evaluation results.
In summary, the operation flow of the weight sensitivity analysis method of the comprehensive evaluation index of digital project proposed in this section is shown in
Figure 5.
5. Problem Description and Example
Taking the selection of digital projects of a power grid enterprise in a certain place as an example, it is now necessary to make decisions on digital project plans , , , , and , and there are historical decision-making plans , , , and for digital projects that have been carried out.
The formulation of the calculation example in this paper and the measurement and recording of the verification data were completed with the support of the staff of State Grid Jilin Electric Power Company (Jilin, China) and State Grid Electric Power Academy Co., Ltd (Beijing, China). Besides, this article takes , , , , , , , , and as the analysis object, and hires 20 industry experts to statistically score the 15 qualitative indicators.
5.1. Indicator Screening
Based on the 22 indicators constructed in the third section, data statistics and standardization are carried out on the digital project plan
,
,
,
, and
and the coefficient of variation of each indicator is calculated and then screened. Coefficient of variation method screening index criteria: remove the index with the smallest coefficient of variation under the primary index. The indicators and screening results are shown in
Table 1.
Under the coefficient of variation method, the smaller the coefficient of variation, the smaller the difference between the indicators, and screening out the indicators with relatively small differences is beneficial to increase the difference between the evaluation results. After the index screening under the coefficient of variation method, the digital project’s “Degree of Cost Savings ”, “Coverage of Digital Means of Information Collection ”, “User-friendly Interface ”, “Model Promotion Value ”, and “Business Innovation Capability ” were deleted.
5.2. Weight Processing and Generation
According to the selected indicators, the Delphi method, the AHP method, the entropy method, and the mean square error method are used to obtain the weights of the evaluation indicators in the historical decision-making schemes
,
,
, and
, and the upper and lower bounds of the weights of each indicator are formed. The obtained results are shown in
Table 2.
According to the obtained upper and lower bounds of the weight of the evaluation index, the maximum and minimum range of the weight of the index is formed, and five groups of weights are generated based on the LSOM model. The reason for using these five groups of weights as an example is that the differences that exist in the weight of each indicator in these five groups of weights are relatively obvious and facilitate the analysis in different situations. The details of the weights are shown in
Table 3.
5.3. Cloud Model Generation and Analysis
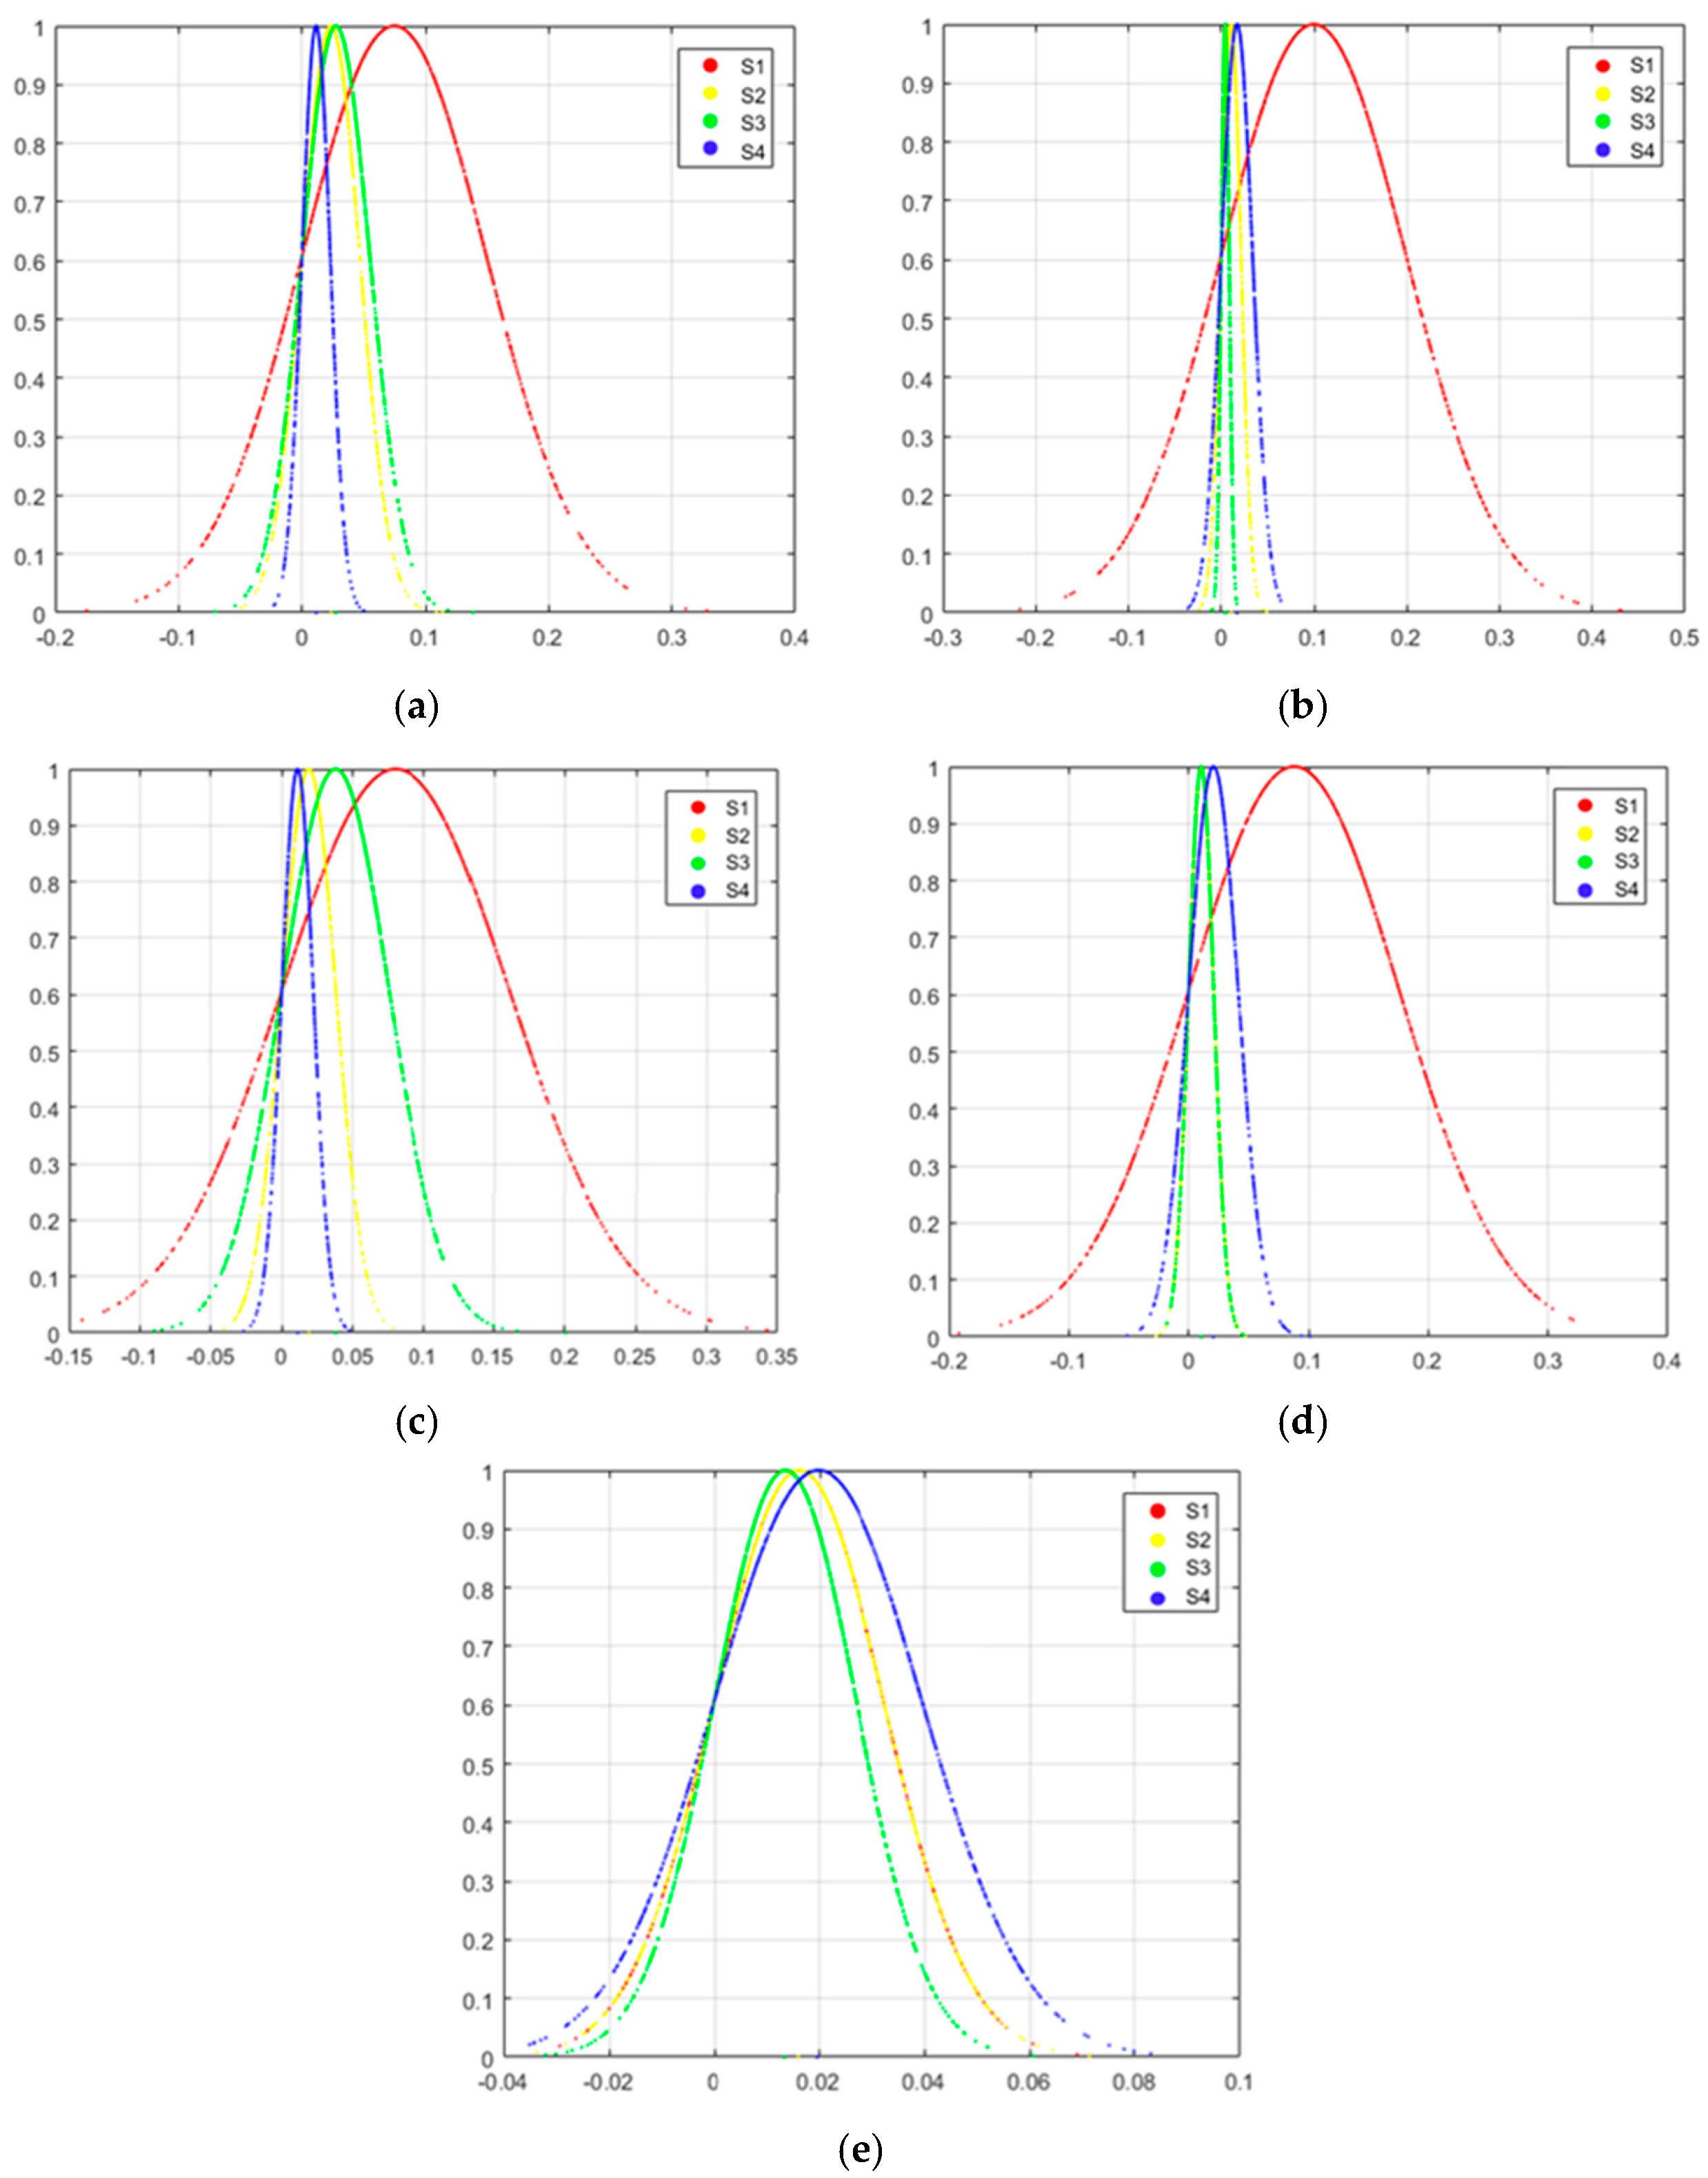
Keeping the order of the digital project schemes unchanged, the evaluation value under each evaluation index of each scheme increases sequentially within a reasonable range by a step size of 0.01 and calculates the closeness of the index value to the optimal scheme after the change. Taking the closeness of each index as the sample data, through the cloud model of each program of reverse cloud and forward cloud computing, the results that are shown in (a)–(e) of
Figure 6. a–e represents the sequential numbering of the cloud maps under the first to the fifth set of weights.
The cloud model consists of a number of cloud drops, each of which is a definite point that constitutes a cloud responsible for uncertainty. The concrete representation of the cloud model can be shown by a cloud map. From the distribution and shape of the cloud map, we can see the degree of difference between the four programs
,
,
, and
under each group of weights. In
Figure 6e, it is obvious that the four programs have a large degree of overlap, and the amplitudes are similar, indicating that, under the fifth set of weights, the values of expectation, entropy, and hyperentropy of the four programs are close. The use of this group of weights does not reflect the differences between programs well but will lead to unstable comprehensive evaluation values between programs, so this group of weights is excluded first. The remaining four groups of weights, that is,
Figure 6a–d, are relatively similar in shape and have roughly the same distribution. Among them, under the second set of weights (
Figure 6b), the distributions of
,
, and
are more concentrated, the expectations of the three are relatively close, and the difference between entropy and hyperentropy is not obvious. Under the first group of weights (
Figure 6a) and under the fourth group of weights (
Figure 6d),
and
almost overlap, and the comprehensive evaluation results are prone to change. Relatively speaking, the cloud map under the third set of weights (
Figure 6c) is clearer and has clear boundaries.
In summary, the third set of weights keeps the order of the four historical programs unchanged, and the evaluation results are the most stable when the index evaluation value changes, and it has better robustness when evaluating new projects. The results obtained by the other four sets of weights are less stable. Therefore, the third set of weights can be applied to the decision-making of new power grid enterprise digitization projects, and the most robust digitization projects can be decided based on historical experience.
After substituting the third group of weights into the specific index values of digital project plans
,
,
,
, and
(their normalized processed data in
Table 1), the obtained evaluation values of each plan are 0.309, 0.559, 0.514, 0.496, and 0.520, respectively. Therefore, based on this weight, the digital project
with the highest score is finally selected as the decision result.
6. Discussion
Due to the real problems, such as the lack of experience in digitization projects and the complexity of evaluation perspectives of digitization project solutions in the STATE GRID Corporation of China, the comparison decision of current digitization project solutions is difficult. Therefore, this study develops a cloud model evaluation method for digitalization projects considering weight sensitivity to help the STATE GRID Corporation of China make decisions on digitalization project solutions. Based on this, we conducted an empirical analysis based on a real case study and came up with the following important conclusions.
Firstly, there are many aspects to be considered in the evaluation of digital project solutions. In the process of digital project program evaluation, the selection of indicators will largely affect the evaluation results and then the accuracy of the evaluation results. In order to avoid decision-making errors brought about by indicators, this study constructs a comprehensive evaluation index system for digital projects. The results of this study show that the index system meets the development requirements of the STATE GRID Corporation of China and covers the awareness level of the STATE GRID Corporation of China for digital transformation. In addition, it accurately measures the performance capability of digitalization projects in terms of economy, efficiency, development direction, and innovation. In fact, these factors are the key to achieving better value for the project. Through this indicator system, the STATE GRID Corporation of China can effectively assess the potential of digital project solutions and come up with an optimal selection strategy.
Secondly, there is variability in different digitization project programs under different evaluation indicators. After the comprehensive evaluation index system is established, not all groups of digitization project programs can have large differences under each index. Based on this, the coefficient of variation method is used to delete the smallest indicator with the smallest coefficient of variation under each group of first-level indicators. On the one hand, it widens the gap between the evaluation programs and avoids the situation of similar evaluation values. On the other hand, it ensures the completeness of the evaluation perspectives covered and the same number of indicator reductions under each first-level indicator. In the calculation example, after using the coefficient of variation method for indicator selection, the evaluation indicators are not only streamlined but the evaluation effect also becomes better.
Finally, an algorithmic framework is constructed to compare and select digitalization project solutions in grid enterprises. The results of the algorithm show that the evaluation results can fully absorb the experience of historical digitization projects and then compare and select new digitization project solutions. Moreover, the cloud model can clearly observe the overlap of program evaluation under each group of index weights and transform the quantitative evaluation values and weights into a qualitative presentation. At the same time, the cloud model can also better show the uncertainty of evaluation values in the actual evaluation process and comprehensively reflect the evaluation result situation under the change in evaluation values. Of course, there are still shortcomings in the study, such as not exploring whether the cloud model will have an impact on the results under a higher number of simulations, which will be the next research direction.


