Abstract
Measurement while drilling (MWD) technology is important for obtaining downhole parameters. As an essential parameter in drilling engineering, lateral force provides a powerful reference basis for judging the downhole drilling direction. Although stress measurement technology has matured, research on downhole lateral forces, especially near-bit lateral forces during the drilling process in petroleum exploration, is lacking. Based on the force analysis of a short measurement circuit, the lateral force measurement value of a drill bit and centralizer was converted to a drill string’s radial-bending-force measurement. Two perpendicular lateral force components were measured using strain gauge technology, a lateral force measurement theory model was established, and a set of MWD systems was designed according to the model. The systems’ function was verified through laboratory and field tests, and the field-test data were successfully obtained in the field application. The test results showed that the tested MWD system had acceptable accuracy, stability, and reliability and had the application potential to measure lateral force in the drilling industry. This article provides a new idea to study lateral force while drilling, which is of great significance to oil-drilling exploration and development.
1. Introduction
Petroleum has important strategic significance as a nonrenewable resource and has become the national lifeblood of energy security and economic development. Many new requirements about borehole trajectory in the process of oil and gas exploration and production have been put forward. Rotary-steering drilling emerged after the appearance of horizontal wells, extended-reach drilling, horizontal drilling wells in thin-oil reservoirs, horizontal multilateral wells, etc. [1,2]. High-angle wells and horizontal wells are becoming universal today. The prediction, prevention, and process of casing wear have become urgent problems in rotary-steering drilling. Accurate lateral force can solve these problems [3,4,5].
Scholars from many countries have carried out research on downhole lateral force. Irawan and Shanmugam studied the lateral vibration of a mass-unbalanced drill string under the finite element method [6]. Kyratsis, Markopoulos, Efkolidis, Maliagkas, and Kakoulis proposed the use of a response surface method for mathematical modeling to measure and study lateral force by studying the influence of machining parameters on thrust and torque [7]. Polycrystalline diamond (PDC) bit inserts or sinters (small, thin, round-shaped polycrystalline diamond cutting blocks) on the drill-head body are used, and their cost is much lower than that of a natural diamond bit, so they have been widely used. A study of lateral force showed the optimization of the lateral force with a PDC bit using particle swarm optimization (PSO) [8]. Li Yafeng et al. used vibration measurement equipment equipped with an orthogonal triaxial accelerometer to measure and collect drill-string-vibration signals through the relationship between the measured acceleration value of the sensor and the central acceleration value of the drill string [9]. There has been a little research on a downhole lateral force measurement system, in which Liu Yong installed a Wheatstone bridge composed of a single strain gauge on a drill string to measure the lateral force [10], and Jiang Hong designed a downhole dynamic measurement system to measure the downhole lateral force through a bridge composed of multiple strain gauges [11]. These two kinds of measurement systems were used to measure a variety of parameters, which had a great demand on power and communication resources. Lu Chengda proposed a method to control the triggering of events, selectively upload the measured data, and save power and communication resources [12]. Wu Chun proposed a method of generating power through lateral force to provide energy for a sensor detection system [13].
The research aiming at downhole lateral force has mainly focused on PSO [14], hydraulic control [15], balancing lateral force with heritage algorithms, mechanical modeling, etc. [16]. However, the research on downhole lateral force has remained in theory and cannot be realized or applied due to the limitation in applications. The rotary steerable system based on lateral force has problems such as smooth boreholes in drilling, excessive work of gamma while drilling, and a lack of stability of the rotary steerable facilities. In recent years, the exploration and production of petroleum has become more high-level and advanced, and the difficulty is increasing. Studies on MWD, however, are almost devoid. Lateral force is gaining more attention as an important parameter to evaluate drilling pillar wear and bending, as well as working conditions of drilling bits [17,18]. This article focuses on the forces of the downhole drilling pillar and separates the model of lateral force. An elastomer is installed near the bit of a drill string as a short measuring joint, and the lateral forces of the bit and the centralizer are converted into the radial-bending force of the drill string. Based on the theory, the lateral force is decomposed into two vertical component forces, and then the component forces are calculated. The measurement system of the lateral force designed using gauge strain technology, which overcomes the difficulties of complex downhole lateral force components that are difficult to measure directly, solves problems of low measurement accuracy of other technologies and reduces the demands for power and communication resources. This paper provides a reliable theoretical basis for drilling and accident prevention in the direction of drilling. It has an important significance and effect on effective and economic exploration and production.
2. Lateral Force Measurement Model
2.1. The Measuring Principle of the Lateral Force in the Drilling Process
Serving the change regulation of bit lateral force as a target, some experts have conducted much theoretical research and have obtained many valuable research results that provide theoretical support for effective control and for adjusting well trajectory in the field [18,19,20,21,22]. This article focused on the way lateral force changed along with variations in drilling pressure and torque while drilling. It could provide a guide for predicting and controlling the drilling trajectory.
Experts and scholars have set up theoretical models of drilling trajectory control and have studied the dynamic basic equations of bottom-hole assembly (BHA) [23,24,25]. However, petroleum companies still lack advanced surface and downhole dynamic MWD systems. In this research, a measuring section with a bridge of strain gauge was added to a drill string elastomer. The lateral force was related to the drilling pressure, and torque, as well as these two parameters, are very important in the drilling process.
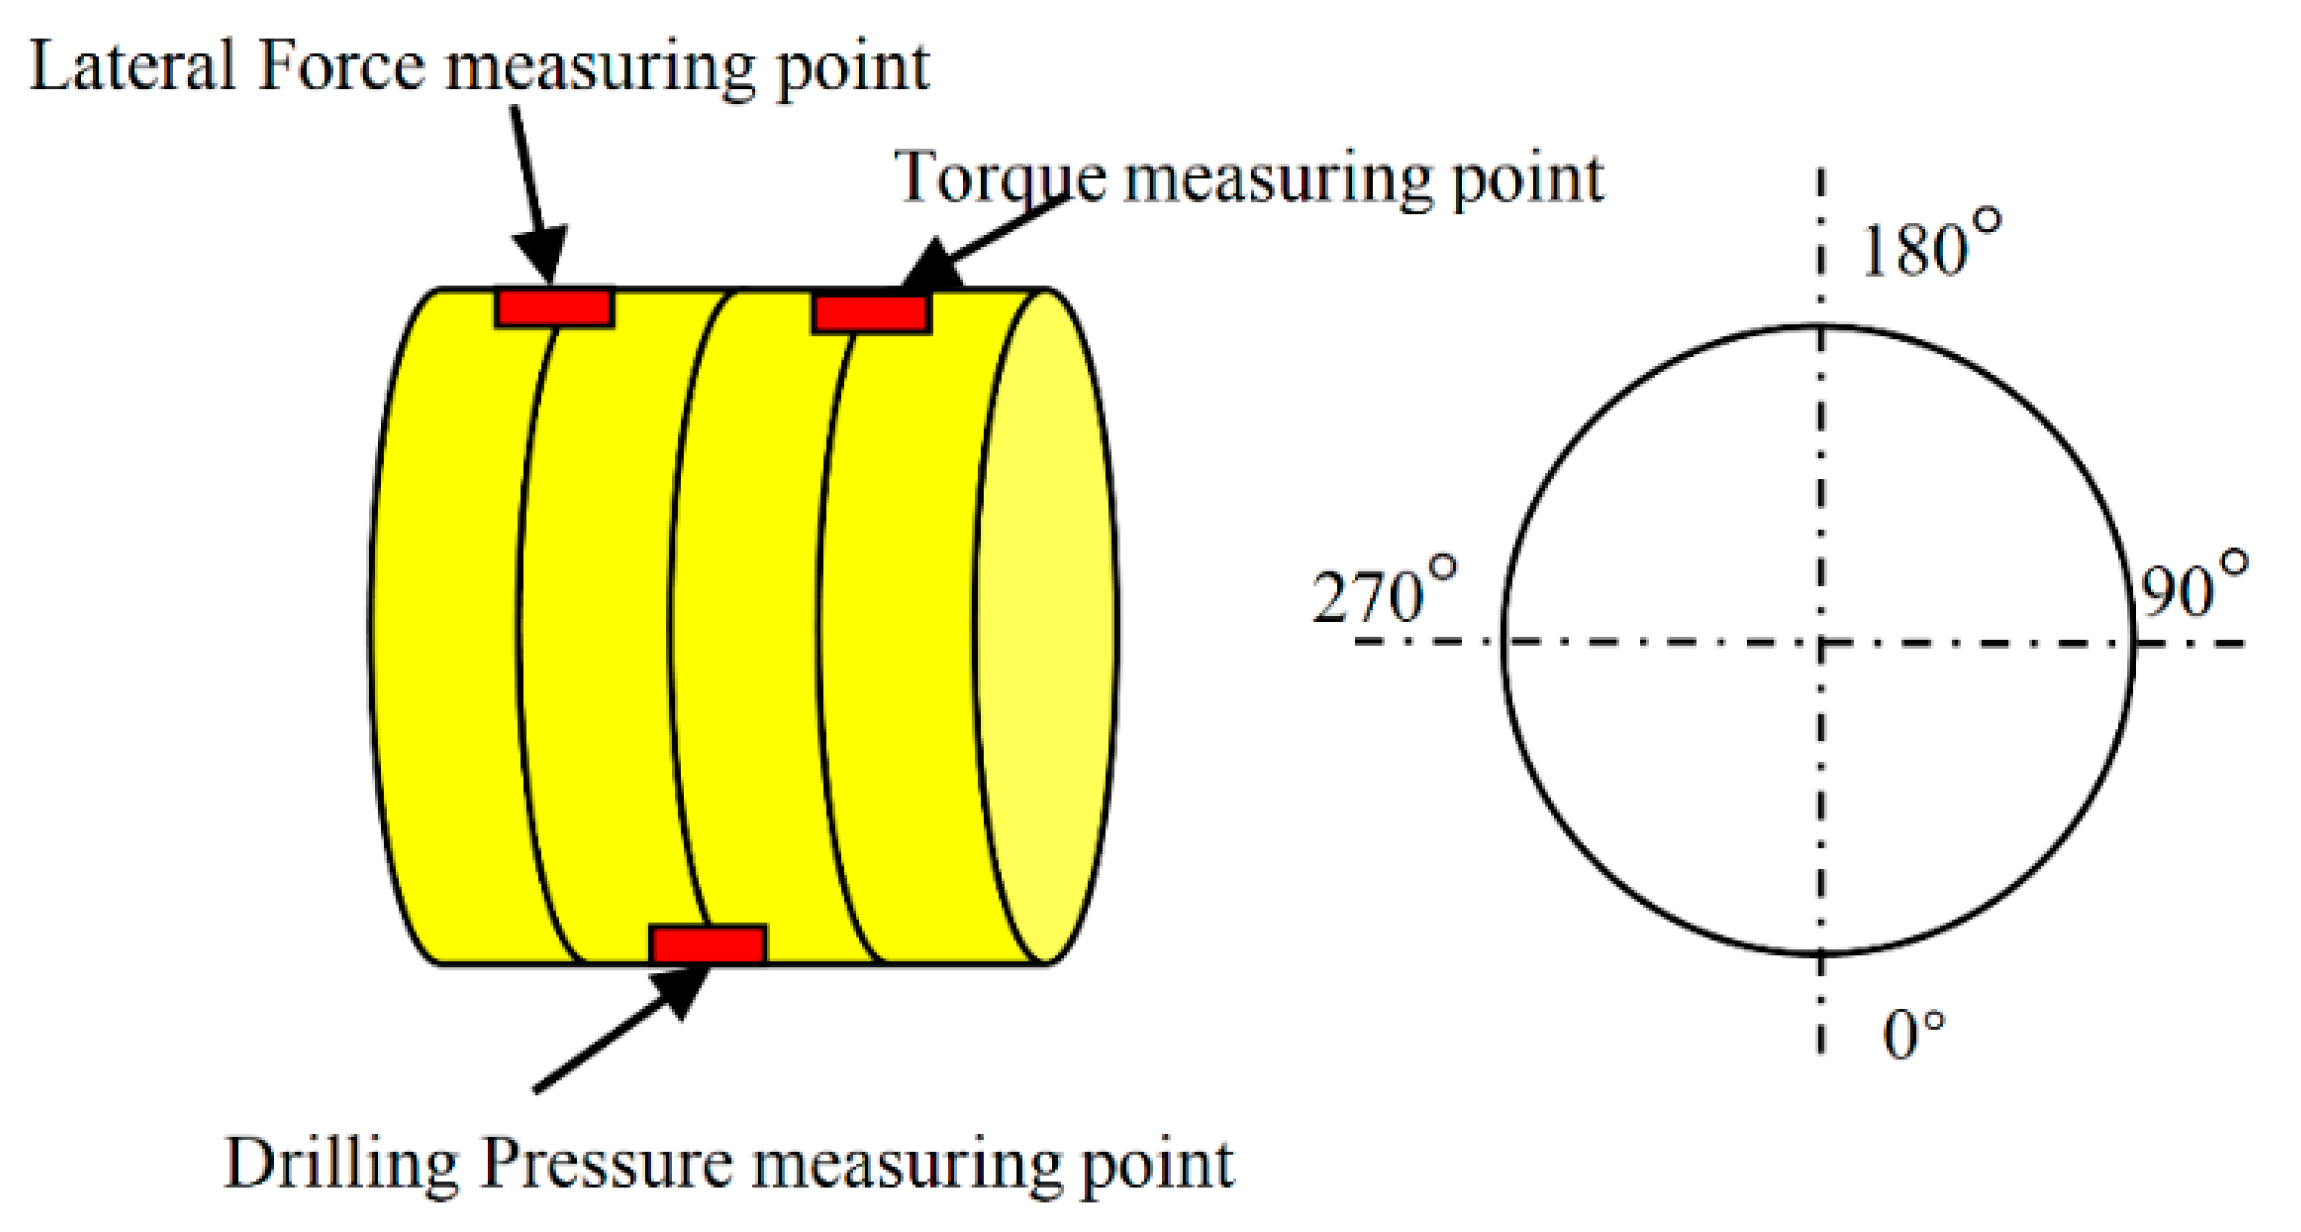
Shown in Figure 1 is the strain gauge distribution of lateral force, torque, and drilling pressure in the measurement. The four groups of strain gauges were distributed on different levels; on the circumference of the same plane, the gauges were distributed differently according to the stress. Accurate and three-dimensional measurements could be obtained in this way.
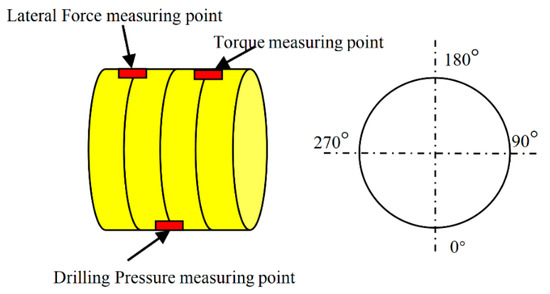
Figure 1.
Distribution of measuring points on the elastomer.
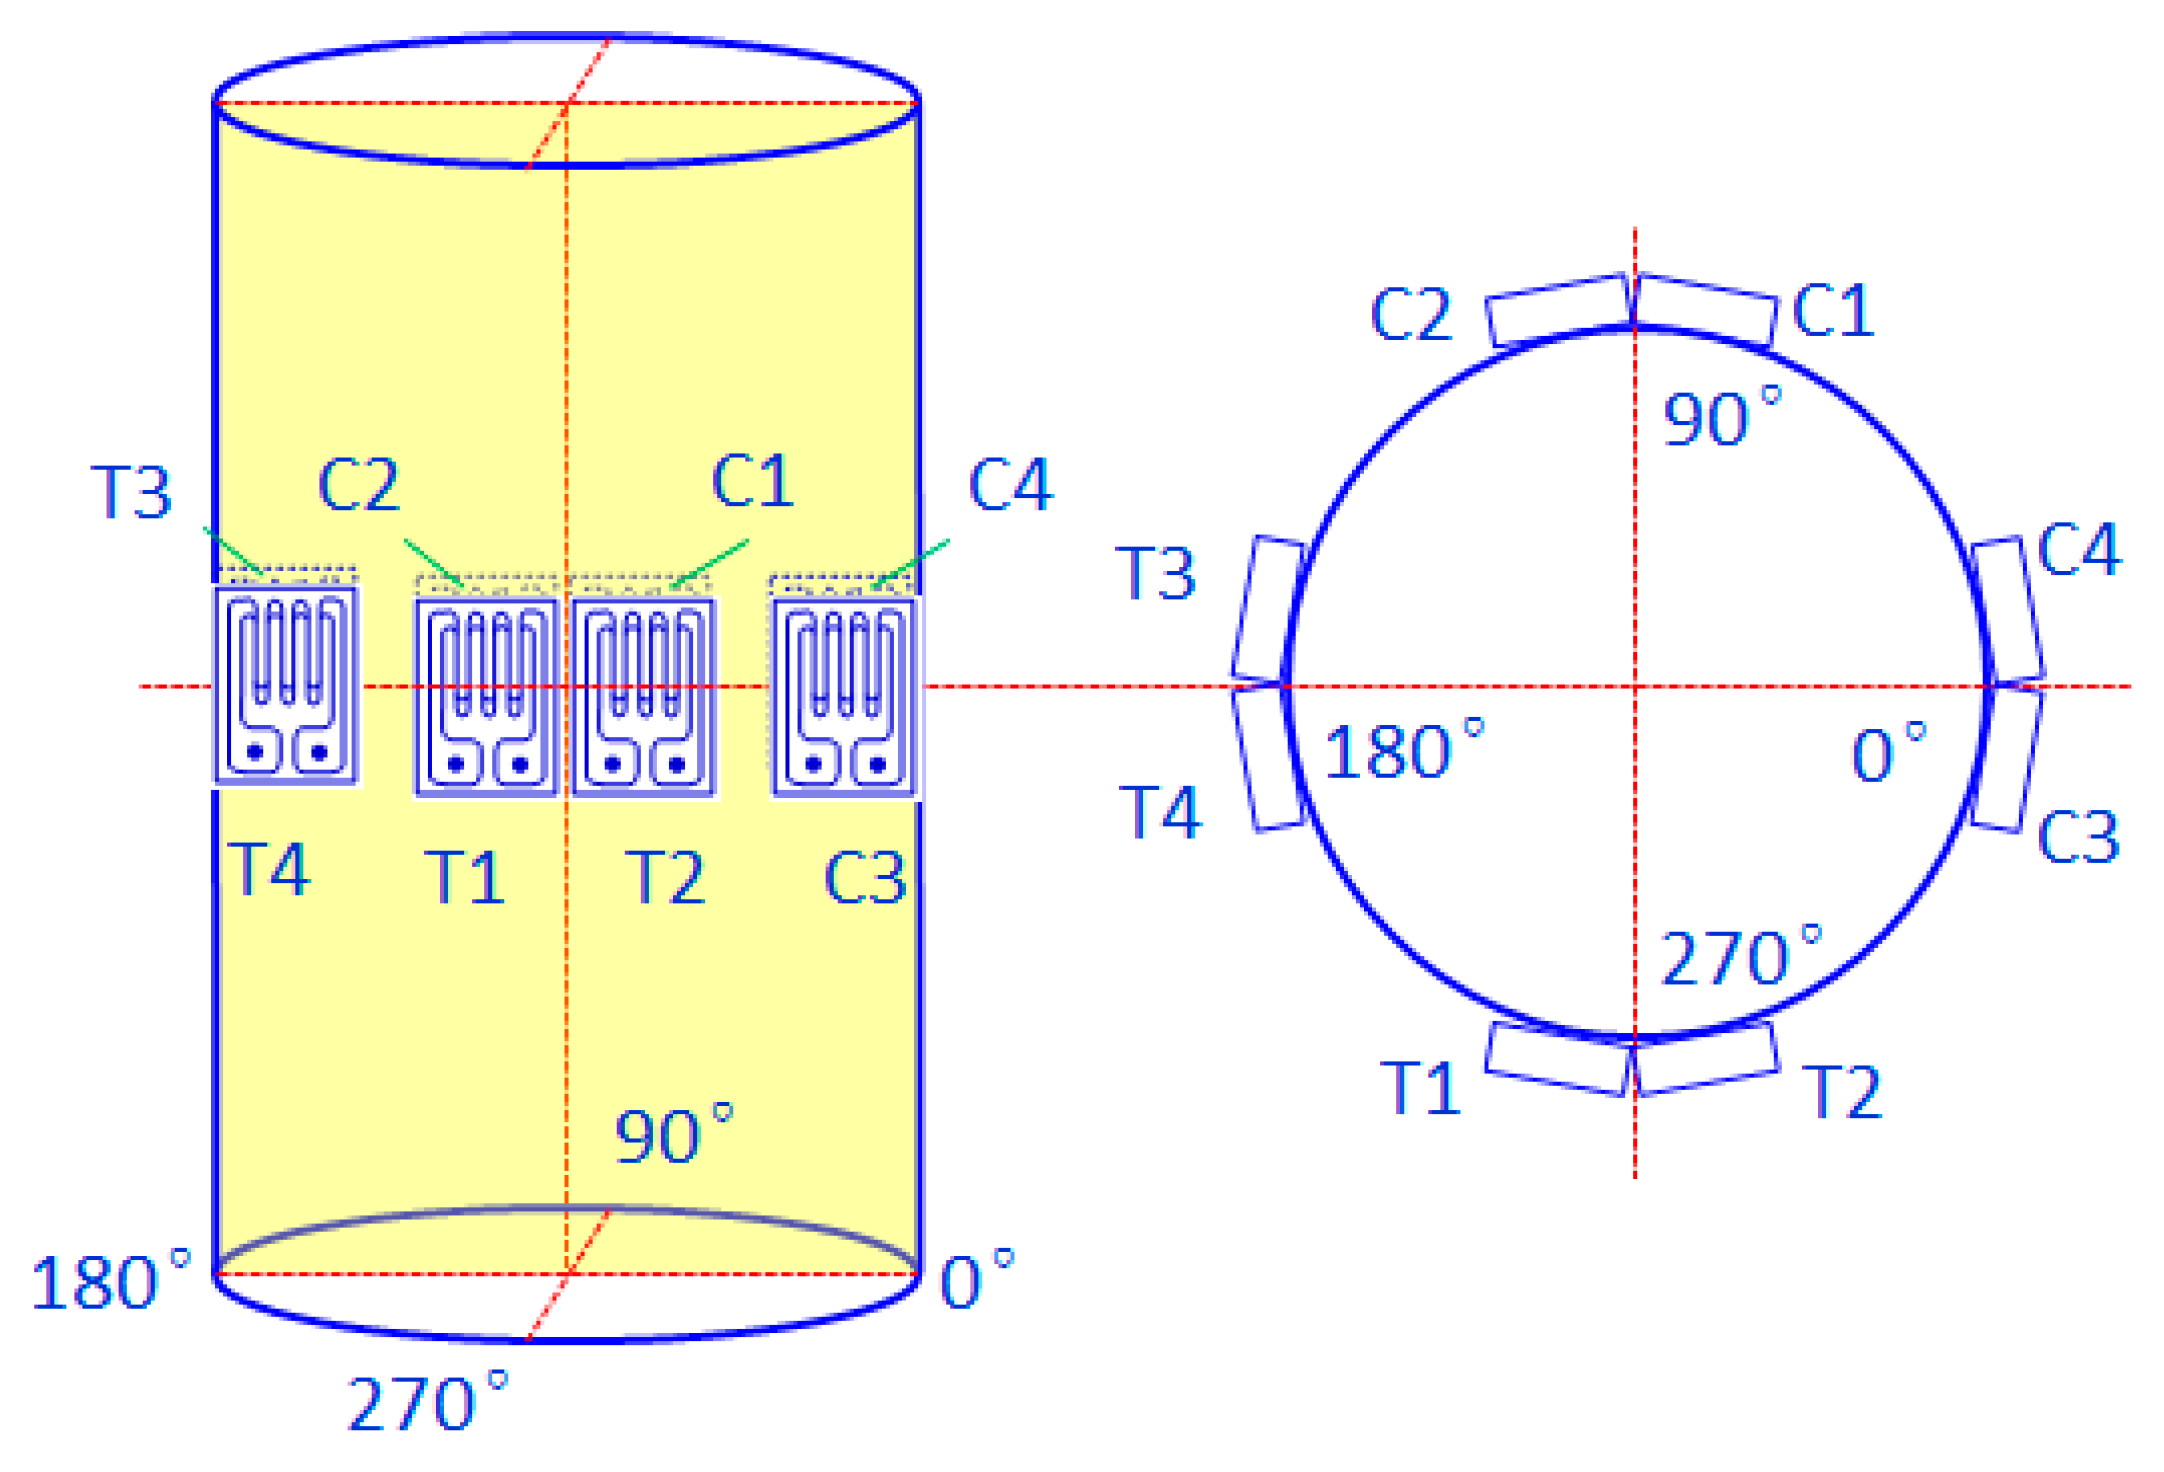
The full-bridge four-strain gauge method was used to measure the lateral force, which could effectively eliminate the influence of temperature and composite load. In this paper, the structural form, size, resistance value, and service temperature of the strain gauge were considered. For the elastomer of the cylinder, the uniaxial strain gauge was used. In the actual measurement, a smaller, sensitive grid size of the strain gauge is better, and the measurement accuracy of a strain gauge with a large resistance value is higher. Medium-temperature strain gauges are generally made of Kama alloy [26,27,28]. We chose a BA series medium-temperature strain gauge from AVIC electric measuring instrument Co., Ltd, which located in shaanxi, china, with a strain range of and a resistance value of . The sensitive grid material of the strain gauge was Kama alloy, and the base material was polyimide, which can self-compensate for temperature, has high elongation, good moisture and heat resistance, good electrical insulation performance, a wide temperature range, and can conduct a precise stress analysis within . The installation diagram of the strain gauge is shown in Figure 2, where strain gauges T and C measured tension and compression, respectively. The strain gauges were longitudinally mounted in four directions with uniform spacing in the same cross-section of the hollow shaft, and two strain gauges were installed along the axial direction in each direction. Under the action of lateral force, the strain gauge deformed with the measuring elastomer and caused the resistance to change, making the output signal of the bridge change.

Figure 2.
Strain gauge distribution of lateral force.
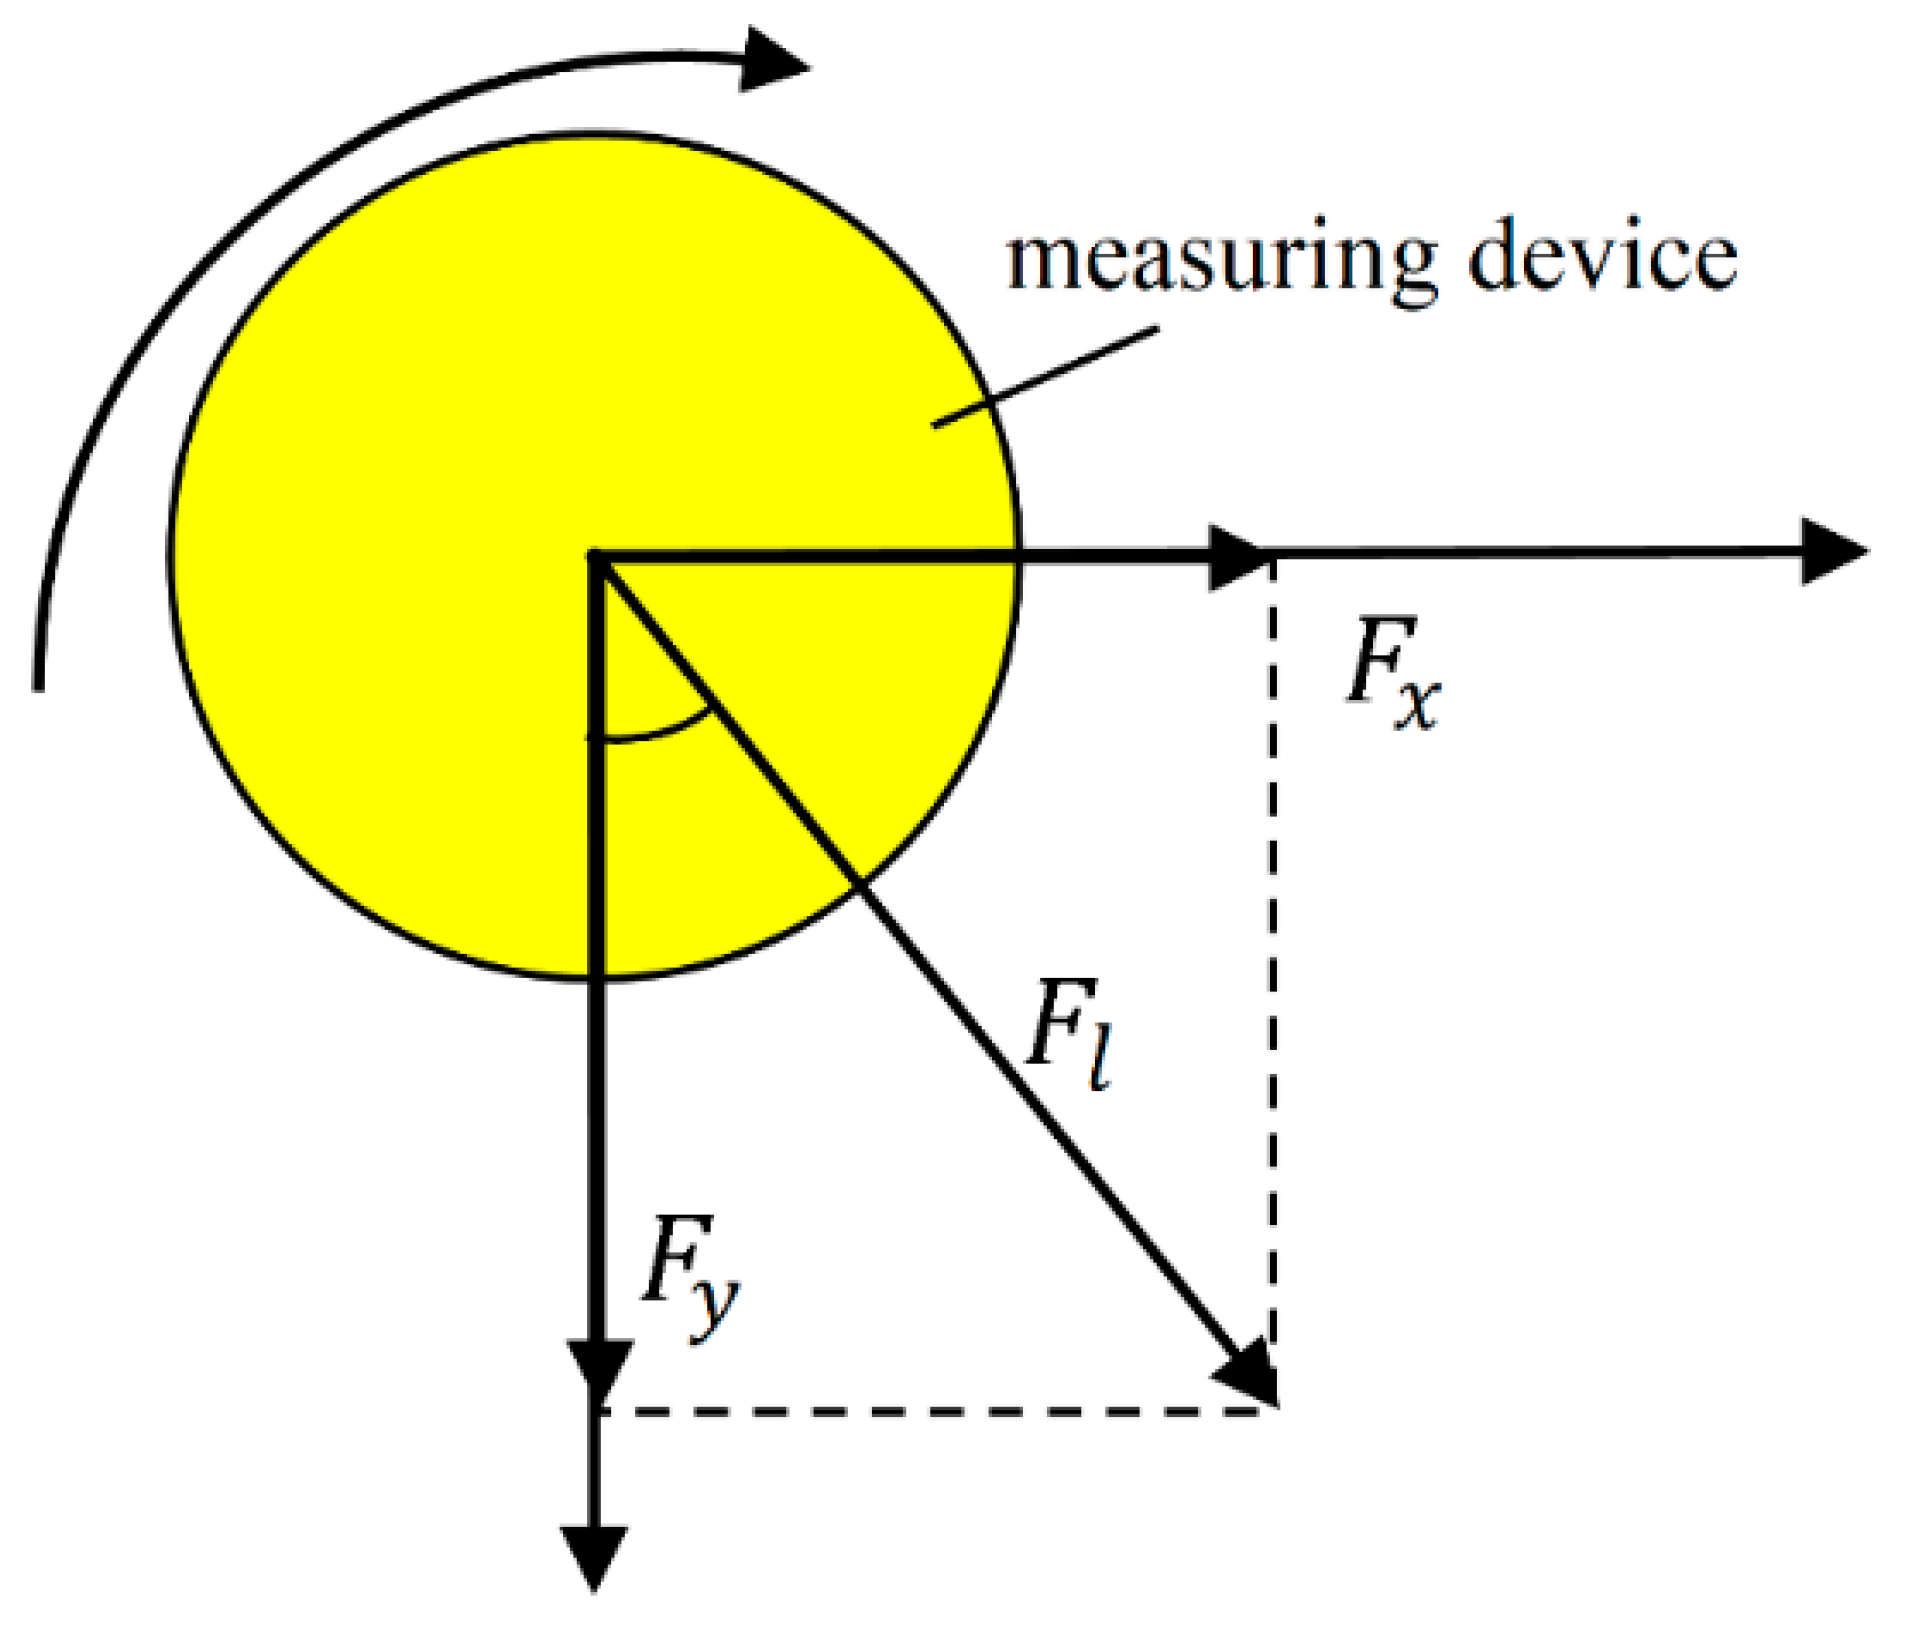
Obviously, it is difficult to measure lateral force directly because the underground stress of a measuring section is very complex. As for the lateral force measurement of a hollow, circular shaft, the lateral forces of two mutually vertical directions (x, y) were measured to synthesize the true size and direction of the lateral force of a hollow, circular shaft. As shown in Figure 3, the two components resulted from the different directions of forces of the elastomer.

Figure 3.
Synthesis of lateral force.
Obviously, the lateral force was:
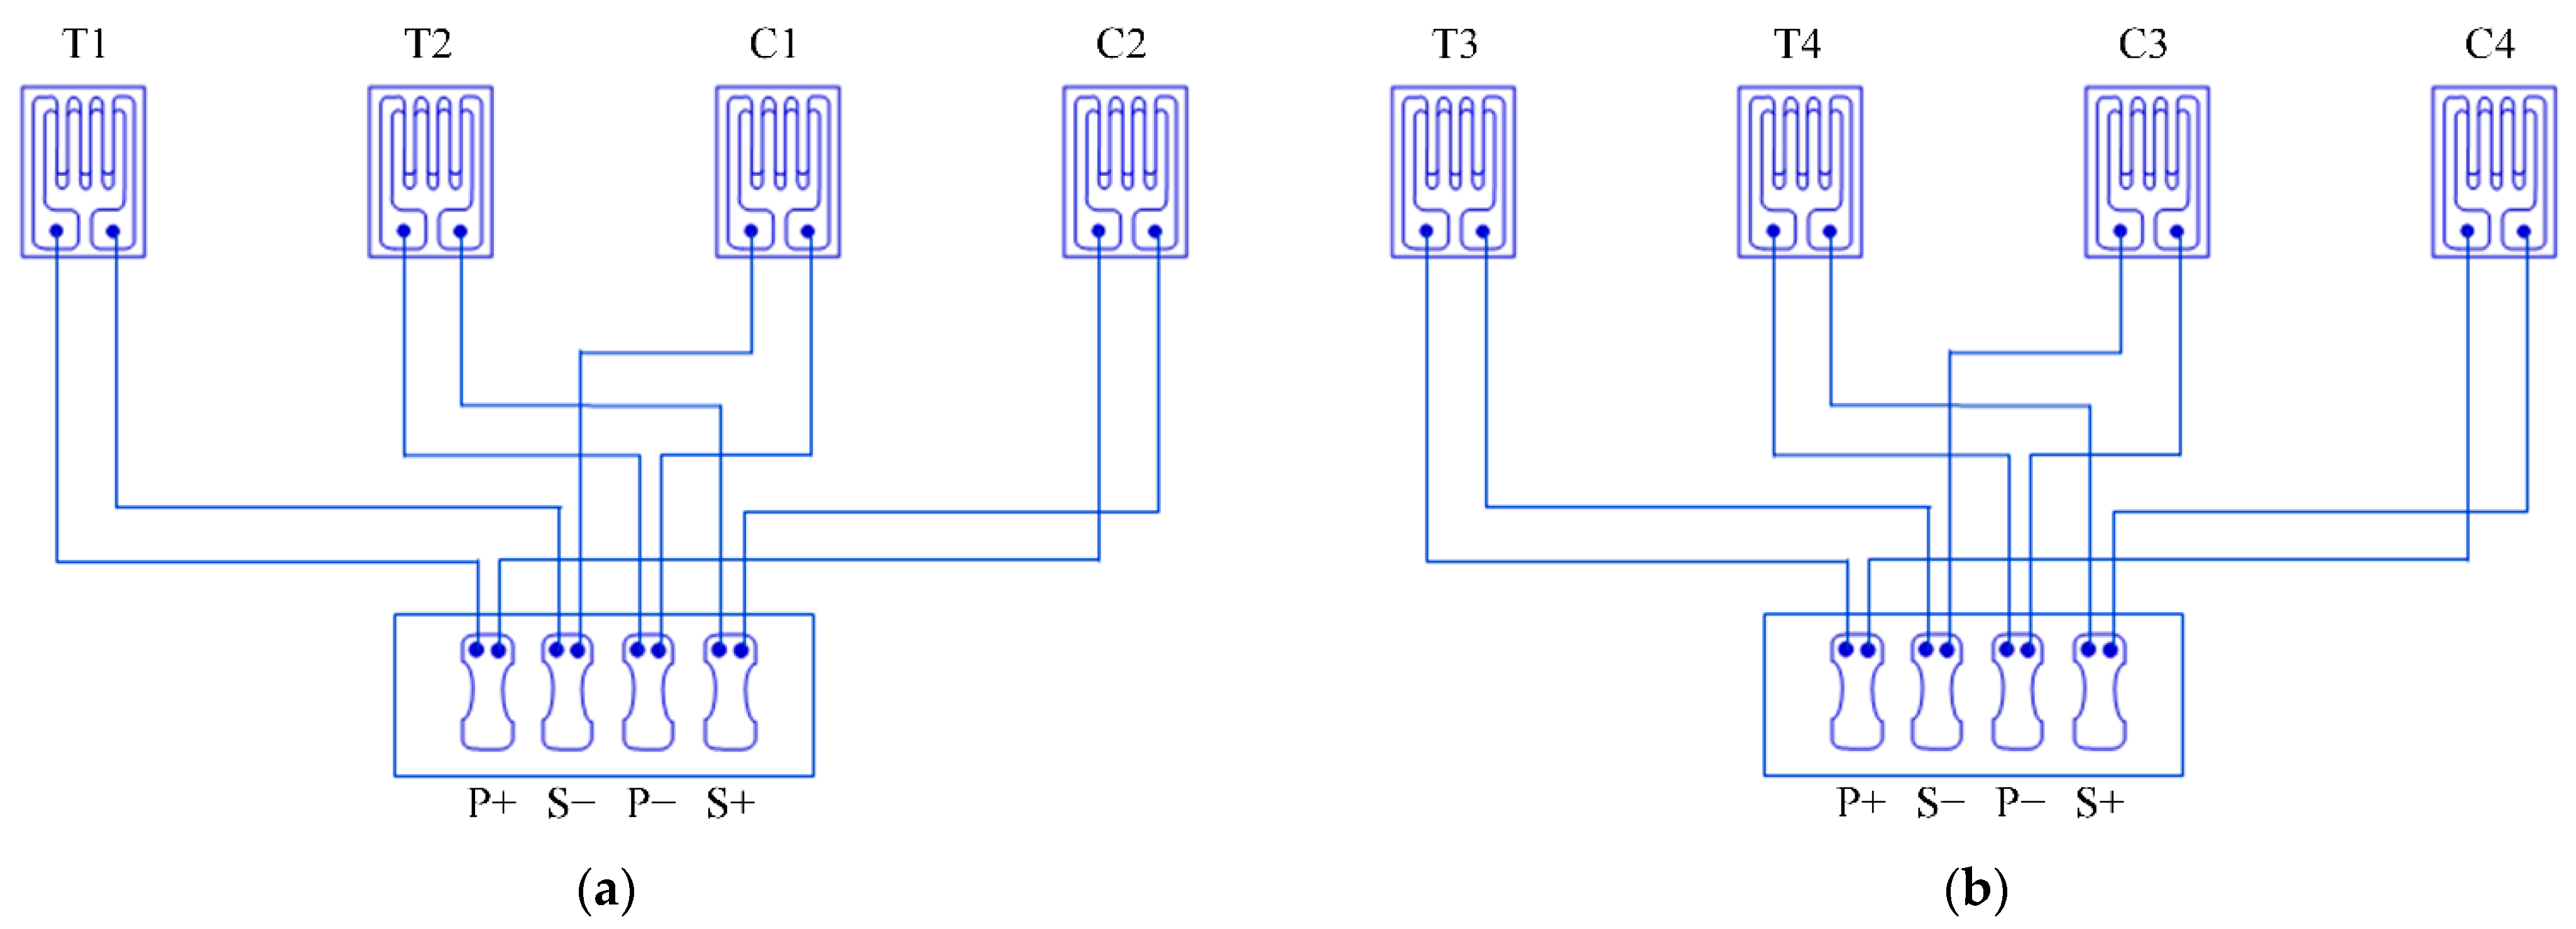
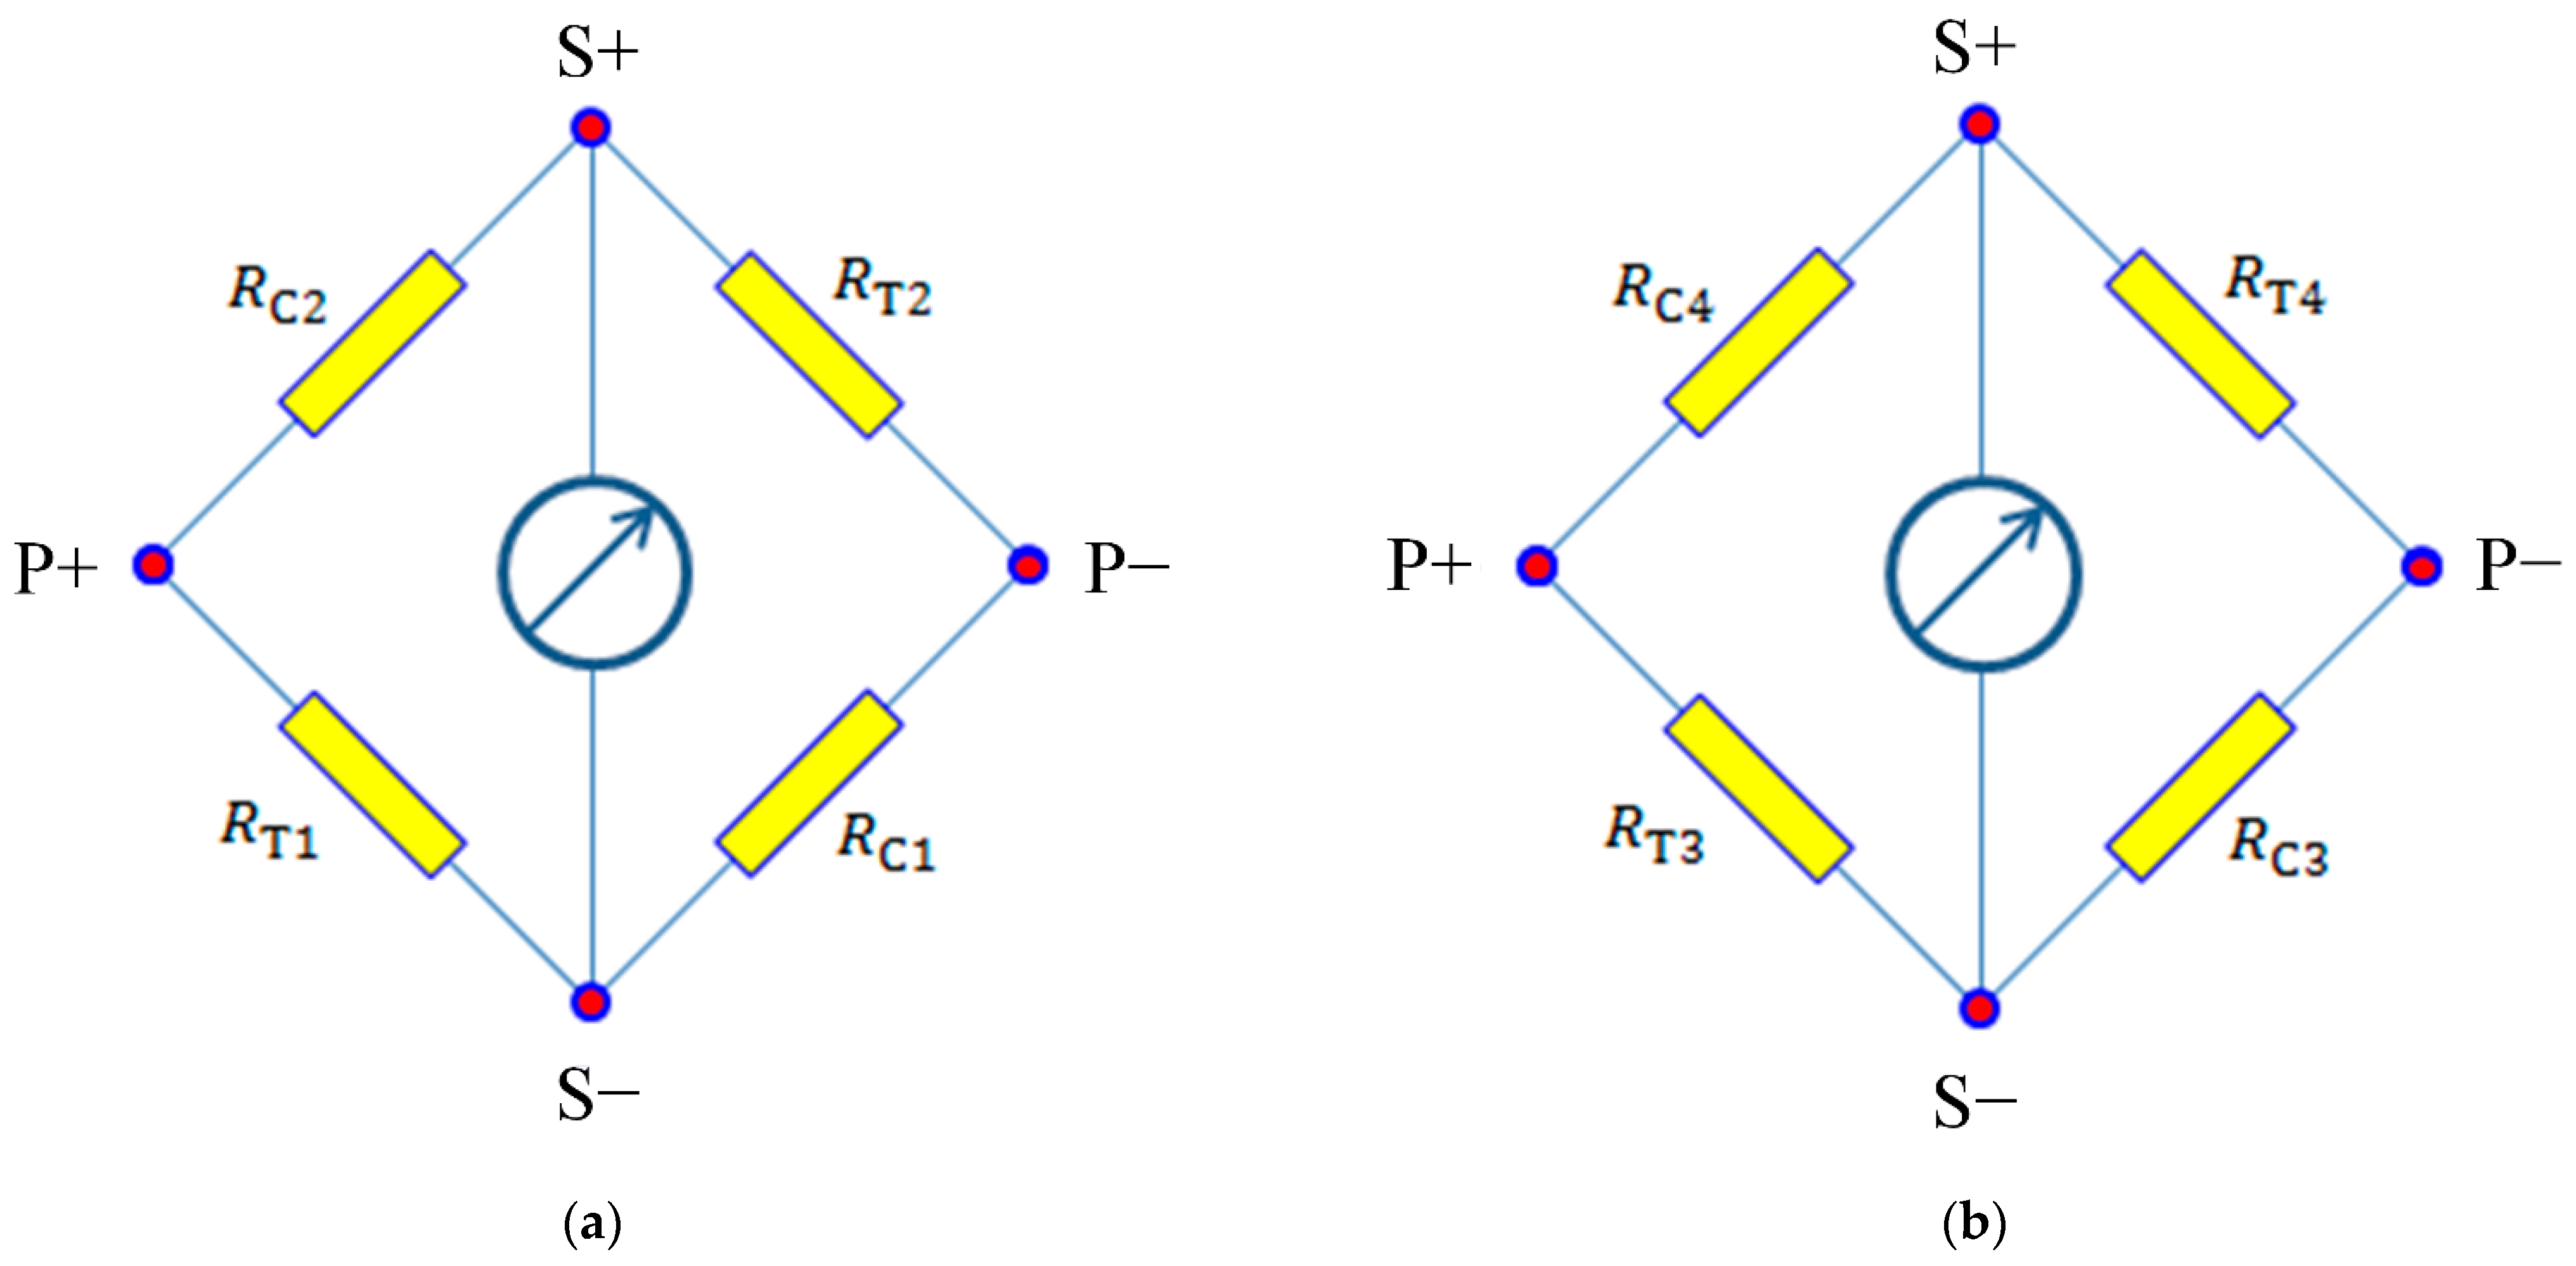
As Figure 4 shows, the constitution of the two groups of strain gauges shown in Figure 2 into two measuring bridges. We used the four strain gauges of two opposite bridge arms to constitute the fixed position of the lateral force component measuring bridge in the x direction, and another group of two bridge arms was used to constitute the fixed position of the lateral force component measuring bridge in the y direction. The polarities of the two strain gauges on the opposite bridge arms were the same, and the polarities of the two strain gauges on the adjacent bridge arms of the same branch were opposite. Figure 5 is the equivalent circuit schematic diagram of the measuring bridge of the bending moment in two directions, where , and are relative bridge arms.
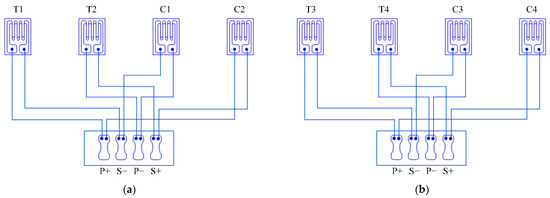
Figure 4.
Schematic diagram of measuring bridge: (a) In X direction; (b) In Y direction.
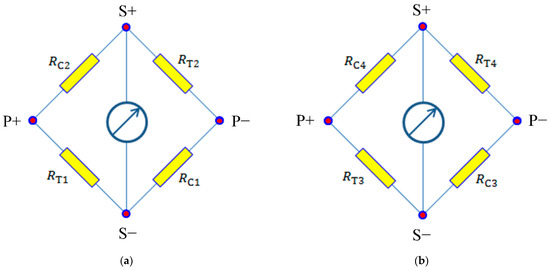
Figure 5.
Equivalent circuit diagram of measuring bridge: (a) In X direction; (b) In Y direction.
A set of torque measuring the bridge in the x direction was used to perform an analysis for measuring the principle of drill-string lateral force. Under the action of torque, the strains of the four strained bridge arms were:
where is the strain caused by the drilling pressure, and is the torque in the x direction.
The relationship between each bridge arm’s resistance relative to the variation and strain was:
When we connected the four resistance strain gauges into the bridge shown in Figure 5, the output signal of the bridge was:
Therefore, the indicated strain , and the bridge arm coefficient was 4. In this way, the influence of temperature on the output of the bridge could be eliminated, and the bridge achieved temperature self-compensation. According to the output characteristics of the bridge, the relationship between the measured indicated strain and the real strain of the strain gauges, which remained on the measuring section, was:
2.2. Calculation Model of Lateral Force
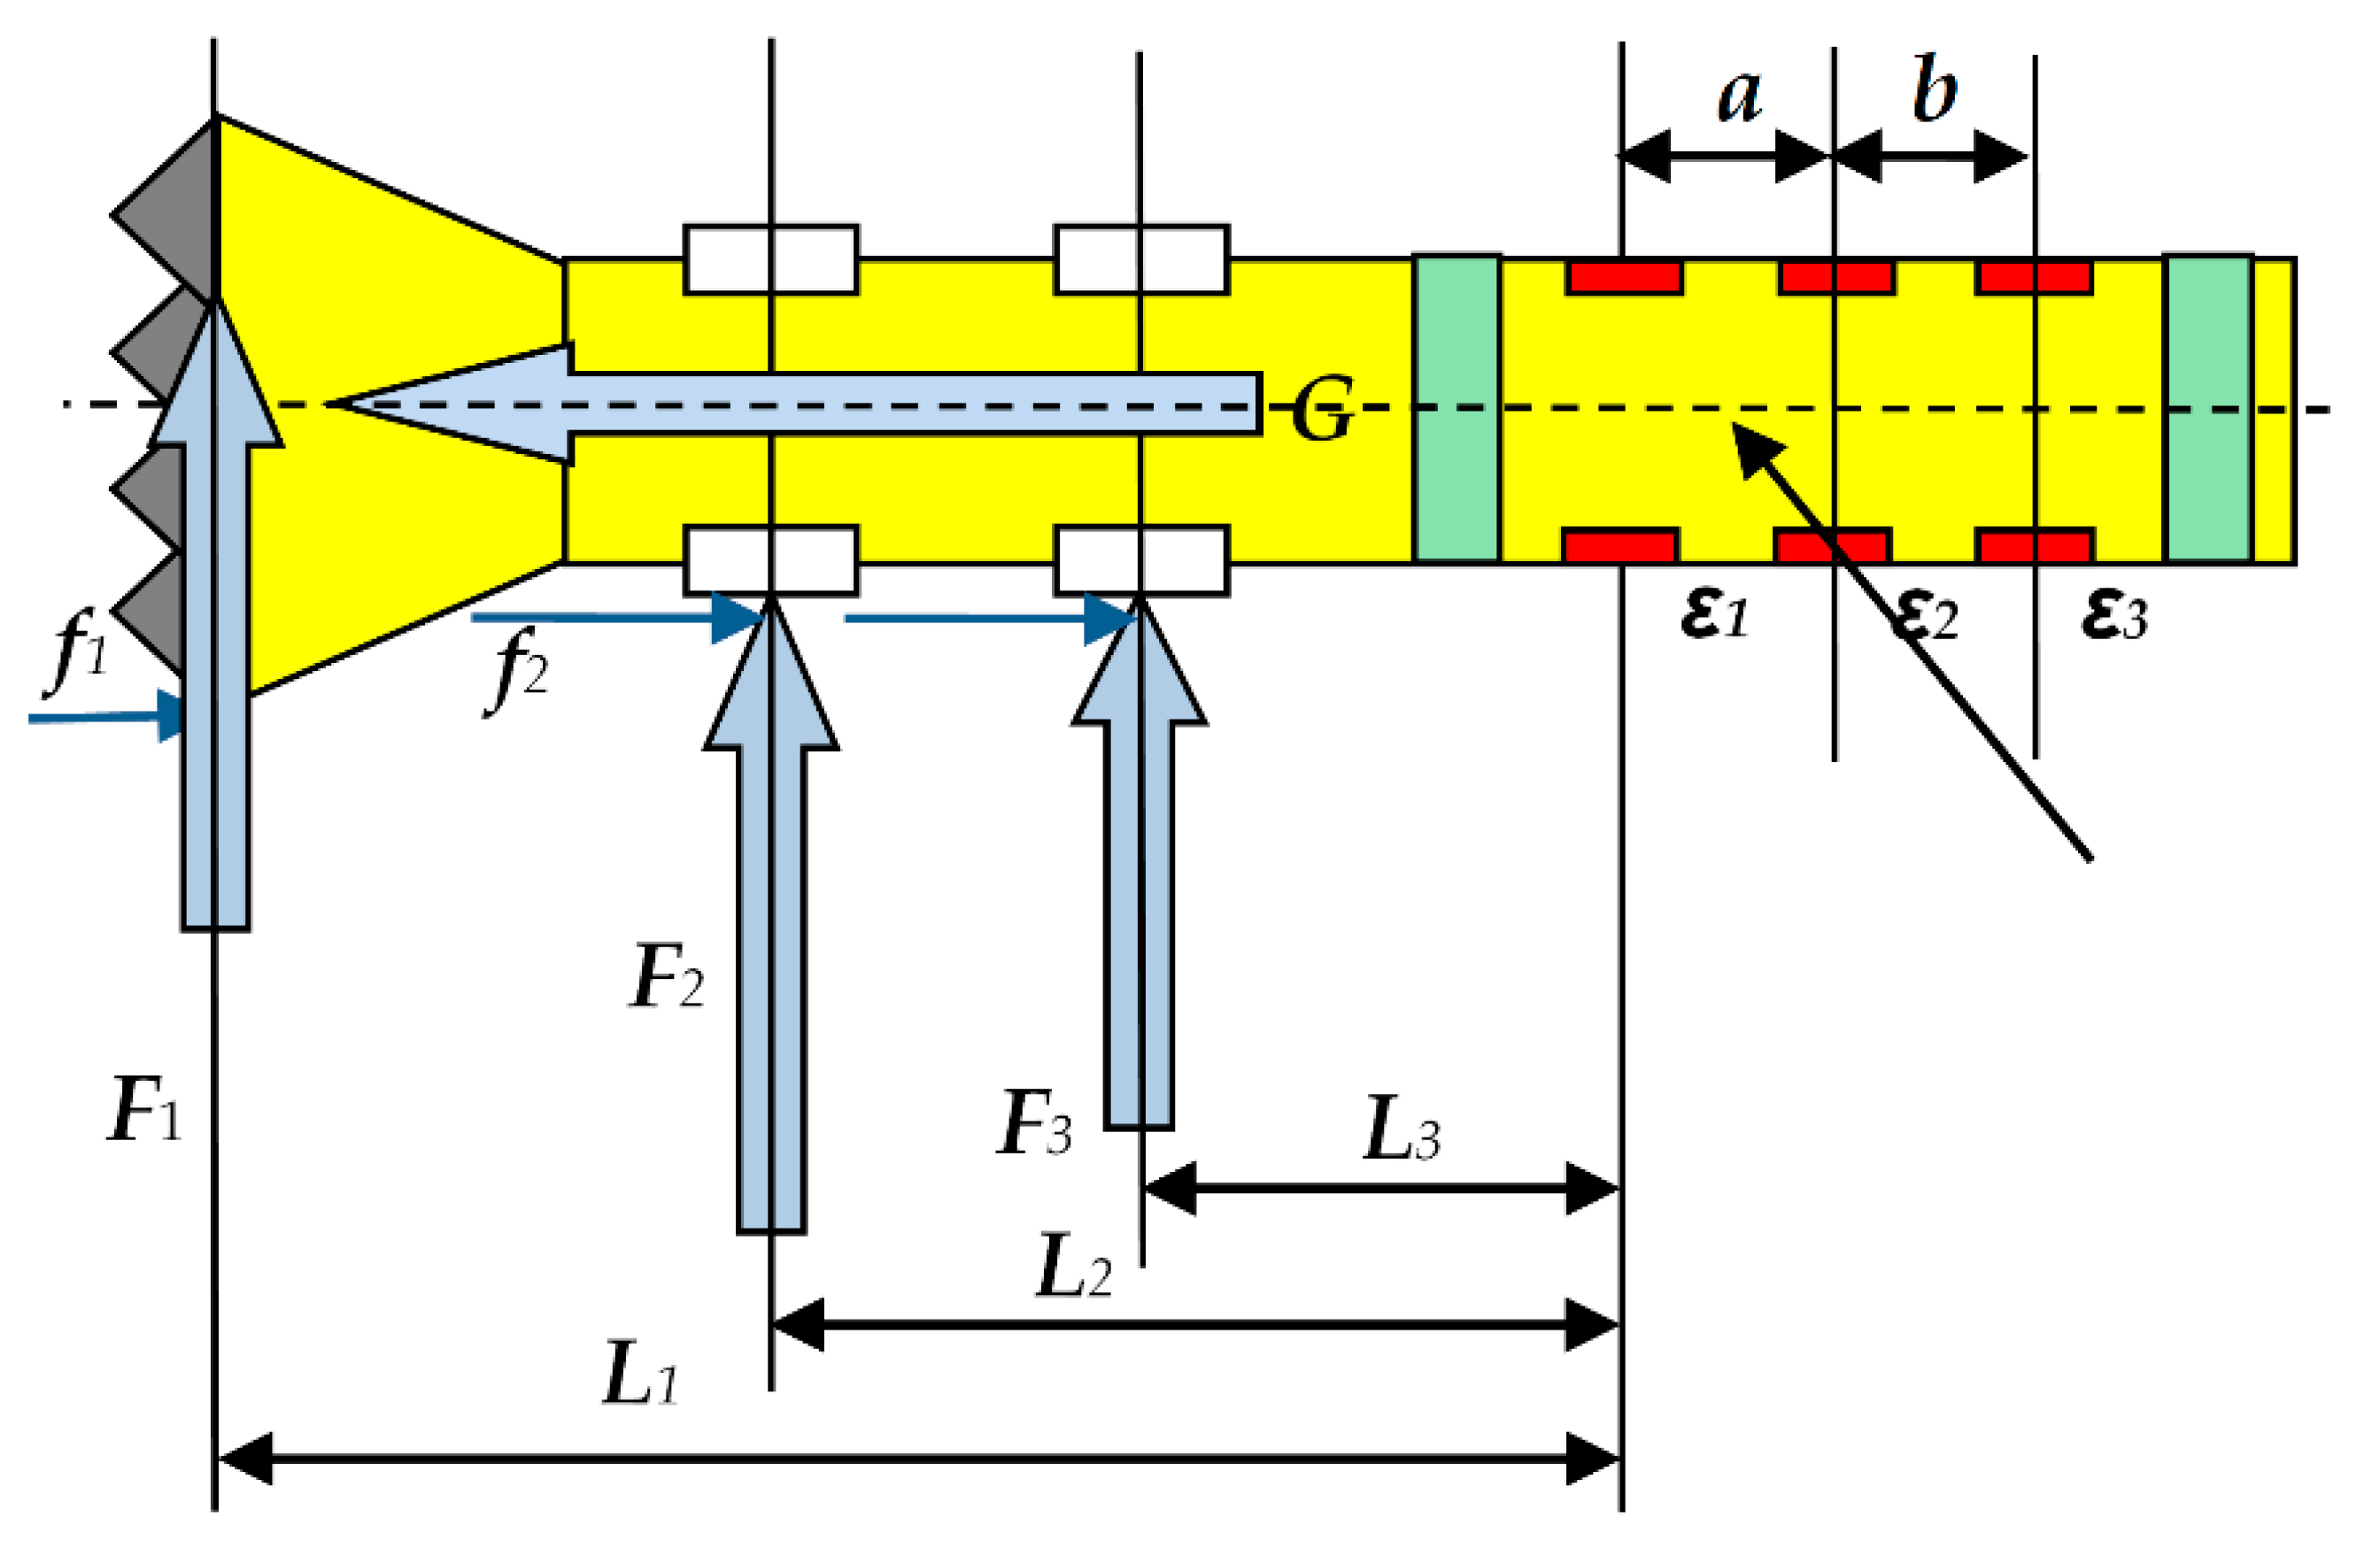
For the drill string, the lateral force of the drill bit and centralizer was the radial-bending force. The size and orientation of the lateral force of the drill bit and centralizer could be solved by attaching strain gauges directly around the drill string. Because the size and direction due to the lateral force of the drill bit and centralizer were unknown, the strain gauges needed to be attached around the elastic element; thus, the component forces in two mutually perpendicular directions could be solved through the composition of forces, and the lateral force of the drill bit and centralizer could be solved. The relationship between the distribution of the strain gauge and the plane relationship of stress is shown in Figure 6.

Figure 6.
Measuring principle of lateral force.
As shown in the figure, , , and represented the lateral forces of the drill bit and the two centralizers, respectively; , , and were axial friction forces; and the distances from the action points to the first group of strain gauges on the elastic element were , , and , respectively. The spacings of the strain gauge groups were a and b, respectively. , , and represented the bending strains at the location of the strain gauge, and there were many factors affecting them, the most important of which were shear force and friction. Lateral forces , , and were shear forces perpendicular to the axis of the elastic element, and the bending moment was generated at the position of the corresponding deformation plate. , , and were the axial friction forces along the surface of the elastic element, which also generated the bending moment corresponding to the position of the deformation plate. The bending strains of three sections were measured in two mutually perpendicular directions, and the component forces , , and , as well as , , and , in two mutually perpendicular directions were solved simultaneously by calculating their strain differences. In one patch orientation, strains , , and were generated by bending moments (or and ), and friction forces , , and , respectively:
Therefore, the following equations could be solved:
where EW is the elastic modulus of and , and EA is the elastic modulus of friction. The transverse effects of the strain gauge and correction coefficient of each measurement point were ignored in the above calculation process. In this way, components , , and in the x direction were solved, and the components , , and in the y direction also could be solved. After synthesis, the size and position of forces , , and could be solved. When there was only one force or only two forces, which was special for the three forces, after simplifying the model, it worked.
3. Design of Downhole Lateral Force Measurement System
3.1. Design of System Mechanical Structure
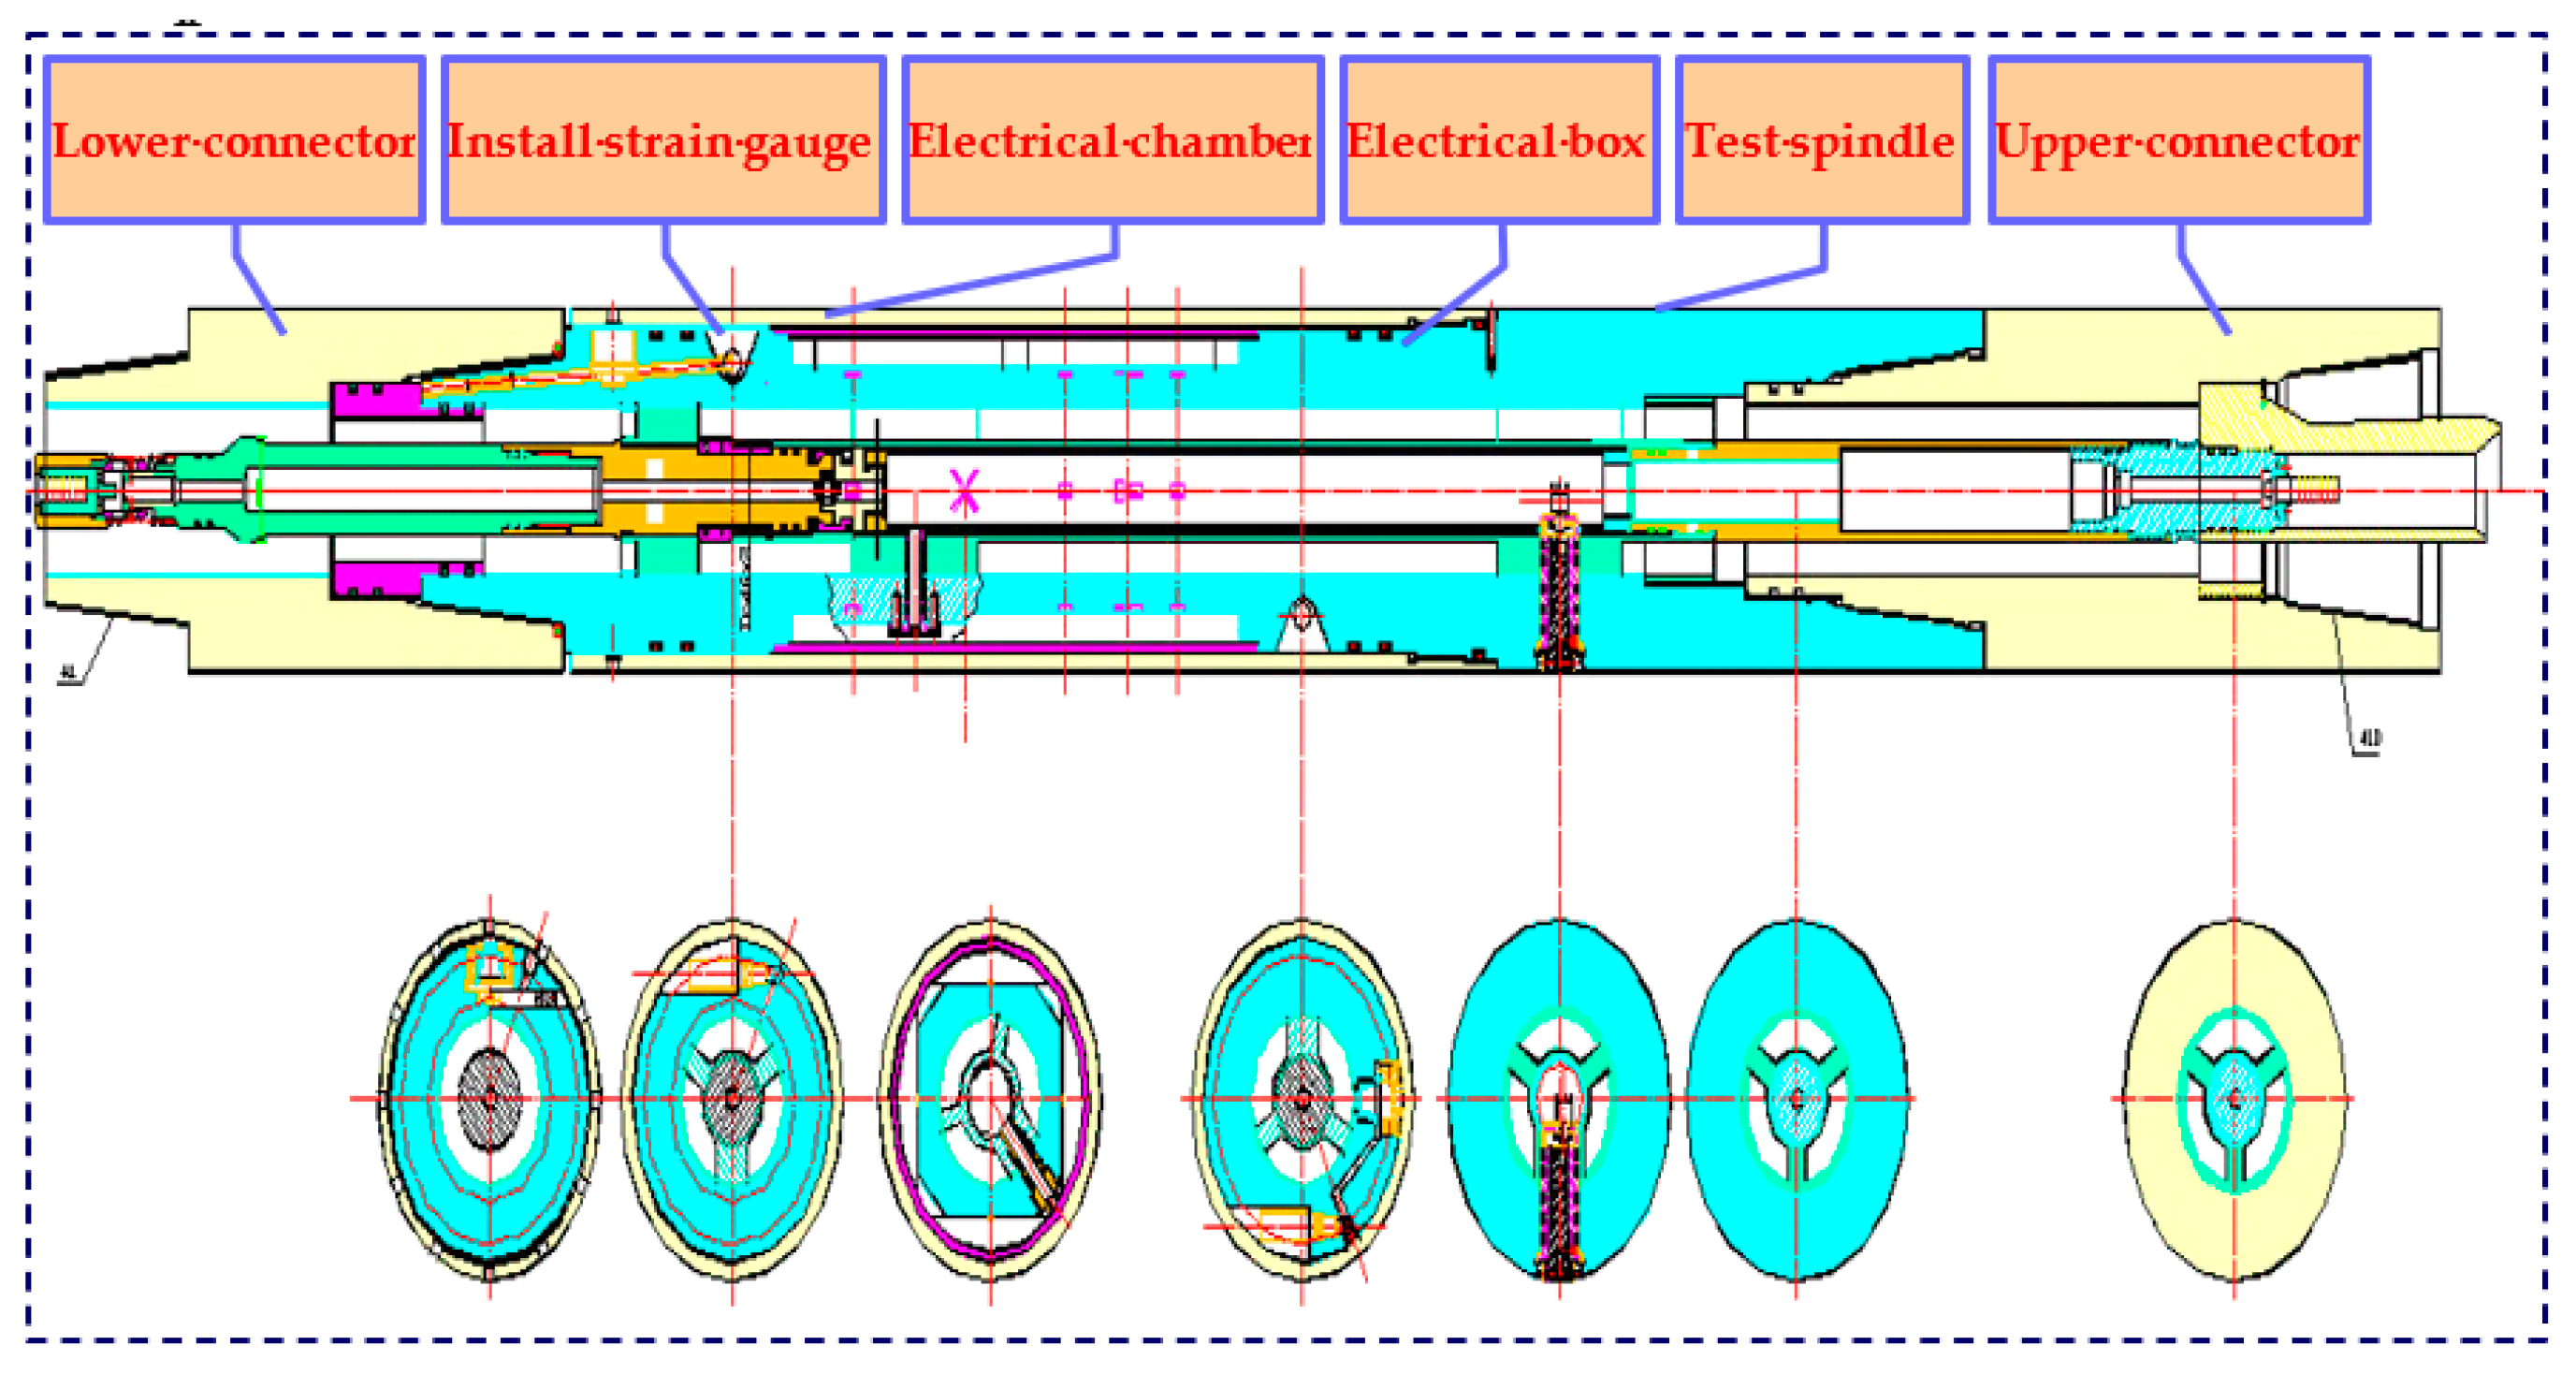
The strain gauge was installed on the testing shaft, on which the testing record circuit board is also installed for recording, storing, and sending signals to the MWD uploading device. The shaft was the main part of the elastic element of the lateral force measurement and, therefore, needed to be designed closely. The design of the testing spindle structure is shown in Figure 7, where the upper and lower ends of the spindle were connected with an NC50 screw. On the testing spindle, there were the positions of oil storage, a mounting chamber for the strain gauge sensor and circuit board, a hole for communication lines and a power line, a hole for the external power switch mounting, and so on. We considered multiple required rock formations to meet the testing needs in the design. The system was suitable for a homogeneous formation, brittle medium hardness, or appropriate abrasive formations, and the formation temperature could not be too high.
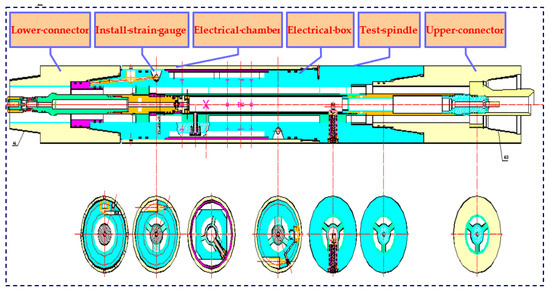
Figure 7.
System mechanical structure.
3.2. Design of System Frame
In the design of a downhole measurement system, the reliability improvement of the system must be considered because downhole situations are very harsh and complex [29,30,31]. In addition, the power consumption of the system, the signal processing and transmission, and the PC display should also be considered comprehensively.
The overall design scheme of the lateral-force-drilling measurement system is shown in Figure 8. The lateral force near the drill bit could be measured simultaneously while drilling with this system. Its structure was mainly composed of a lower machine circuit and a PC part. The lower machine circuit contained a lateral-force-signal-sensing circuit, a signal-conditioning circuit, and data acquisition. The PC part had the functions of data analysis and processing. In addition, the coordination of the two parts could complete the function of the lateral-force-drilling measurement system.
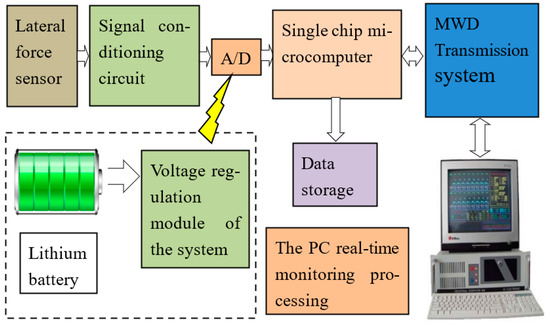
Figure 8.
Total block diagram of measurement system.
3.3. Selection and Installation of Lateral Force Sensor
A Wheatstone full-bridge voltage circuit was used for measurement, and each bridge arm contained two strain gauges. Compared to the four strain gauges—two bridges and eight strain gauges—the bridge increased the sensitivity and improved the output voltage greatly, which was conducive to improving the performance of the sensor. Using the characteristics of adjacent bridges, the deformation was summed, and the opposite bridge deformation was subtracted from the full bridge. The strain caused by nonmeasured parameters and the coupling between the different measuring parameters could be eliminated [32,33].
3.4. Design of Signal-Conditioning Circuit
The signal measured by the Wheatstone bridge was weak, and the output signal was only 0–0.3 mV. In order to meet the needs for the full-scale conversion of the analog-to-digital converter, 10,000 times the amplification circuit was required. The instrumentation amplifier, which had a unique structure of integrating key components, had properties such as high common mode rejection ratio (CMRR), high input impedance, low noise, low linearity error, low offset drift gain, flexible settings, and easy use. In this system, the instrumentation amplifier was used for signal processing.
3.5. Design of Data Acquisition Circuit
In order to be identified by a single-chip microcomputer, analog signal obtained from the sensors must be converted to a digital signal through an A/D converter. In this design, a high-precision 16-bit A/D converter (ADS8320) was used to accurately detect the signal parameters, and a single-chip microcomputer (MSP430F149IPM) was used for the converted data acquisition and processing. The ADS8320 was a successive, approximation-type, serial micropower, CMOS high-speed A/D converter packaged in an 8-pin MSOP, which is produced by TI Burr-Brown. It had properties such as high speed and precision, small volume, high acquisition precision, low power consumption, and good linearity.
4. Experimental and Analysis
After the laboratory test, the system was used for field drilling. The hardware and software must be tested and debugged in the process of hardware making and software development after finishing the system design to ensure the normal work of the system. System testing is needed after finishing system debugging. The testing was realized through a laboratorial test, a high-temperature test, and a vibration test, as well as a field test. The system was used in the present drilling after the completion of the lab test. The measurement was tested downhole at the Wenxing sixth well in China in June 2014. The testing field is shown in Figure 9.
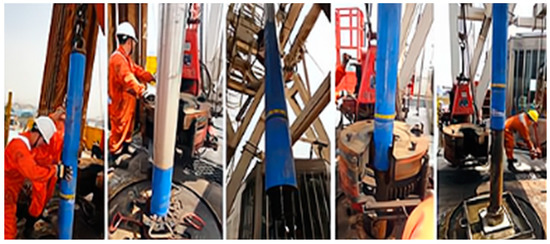
Figure 9.
The field of the downhole test.
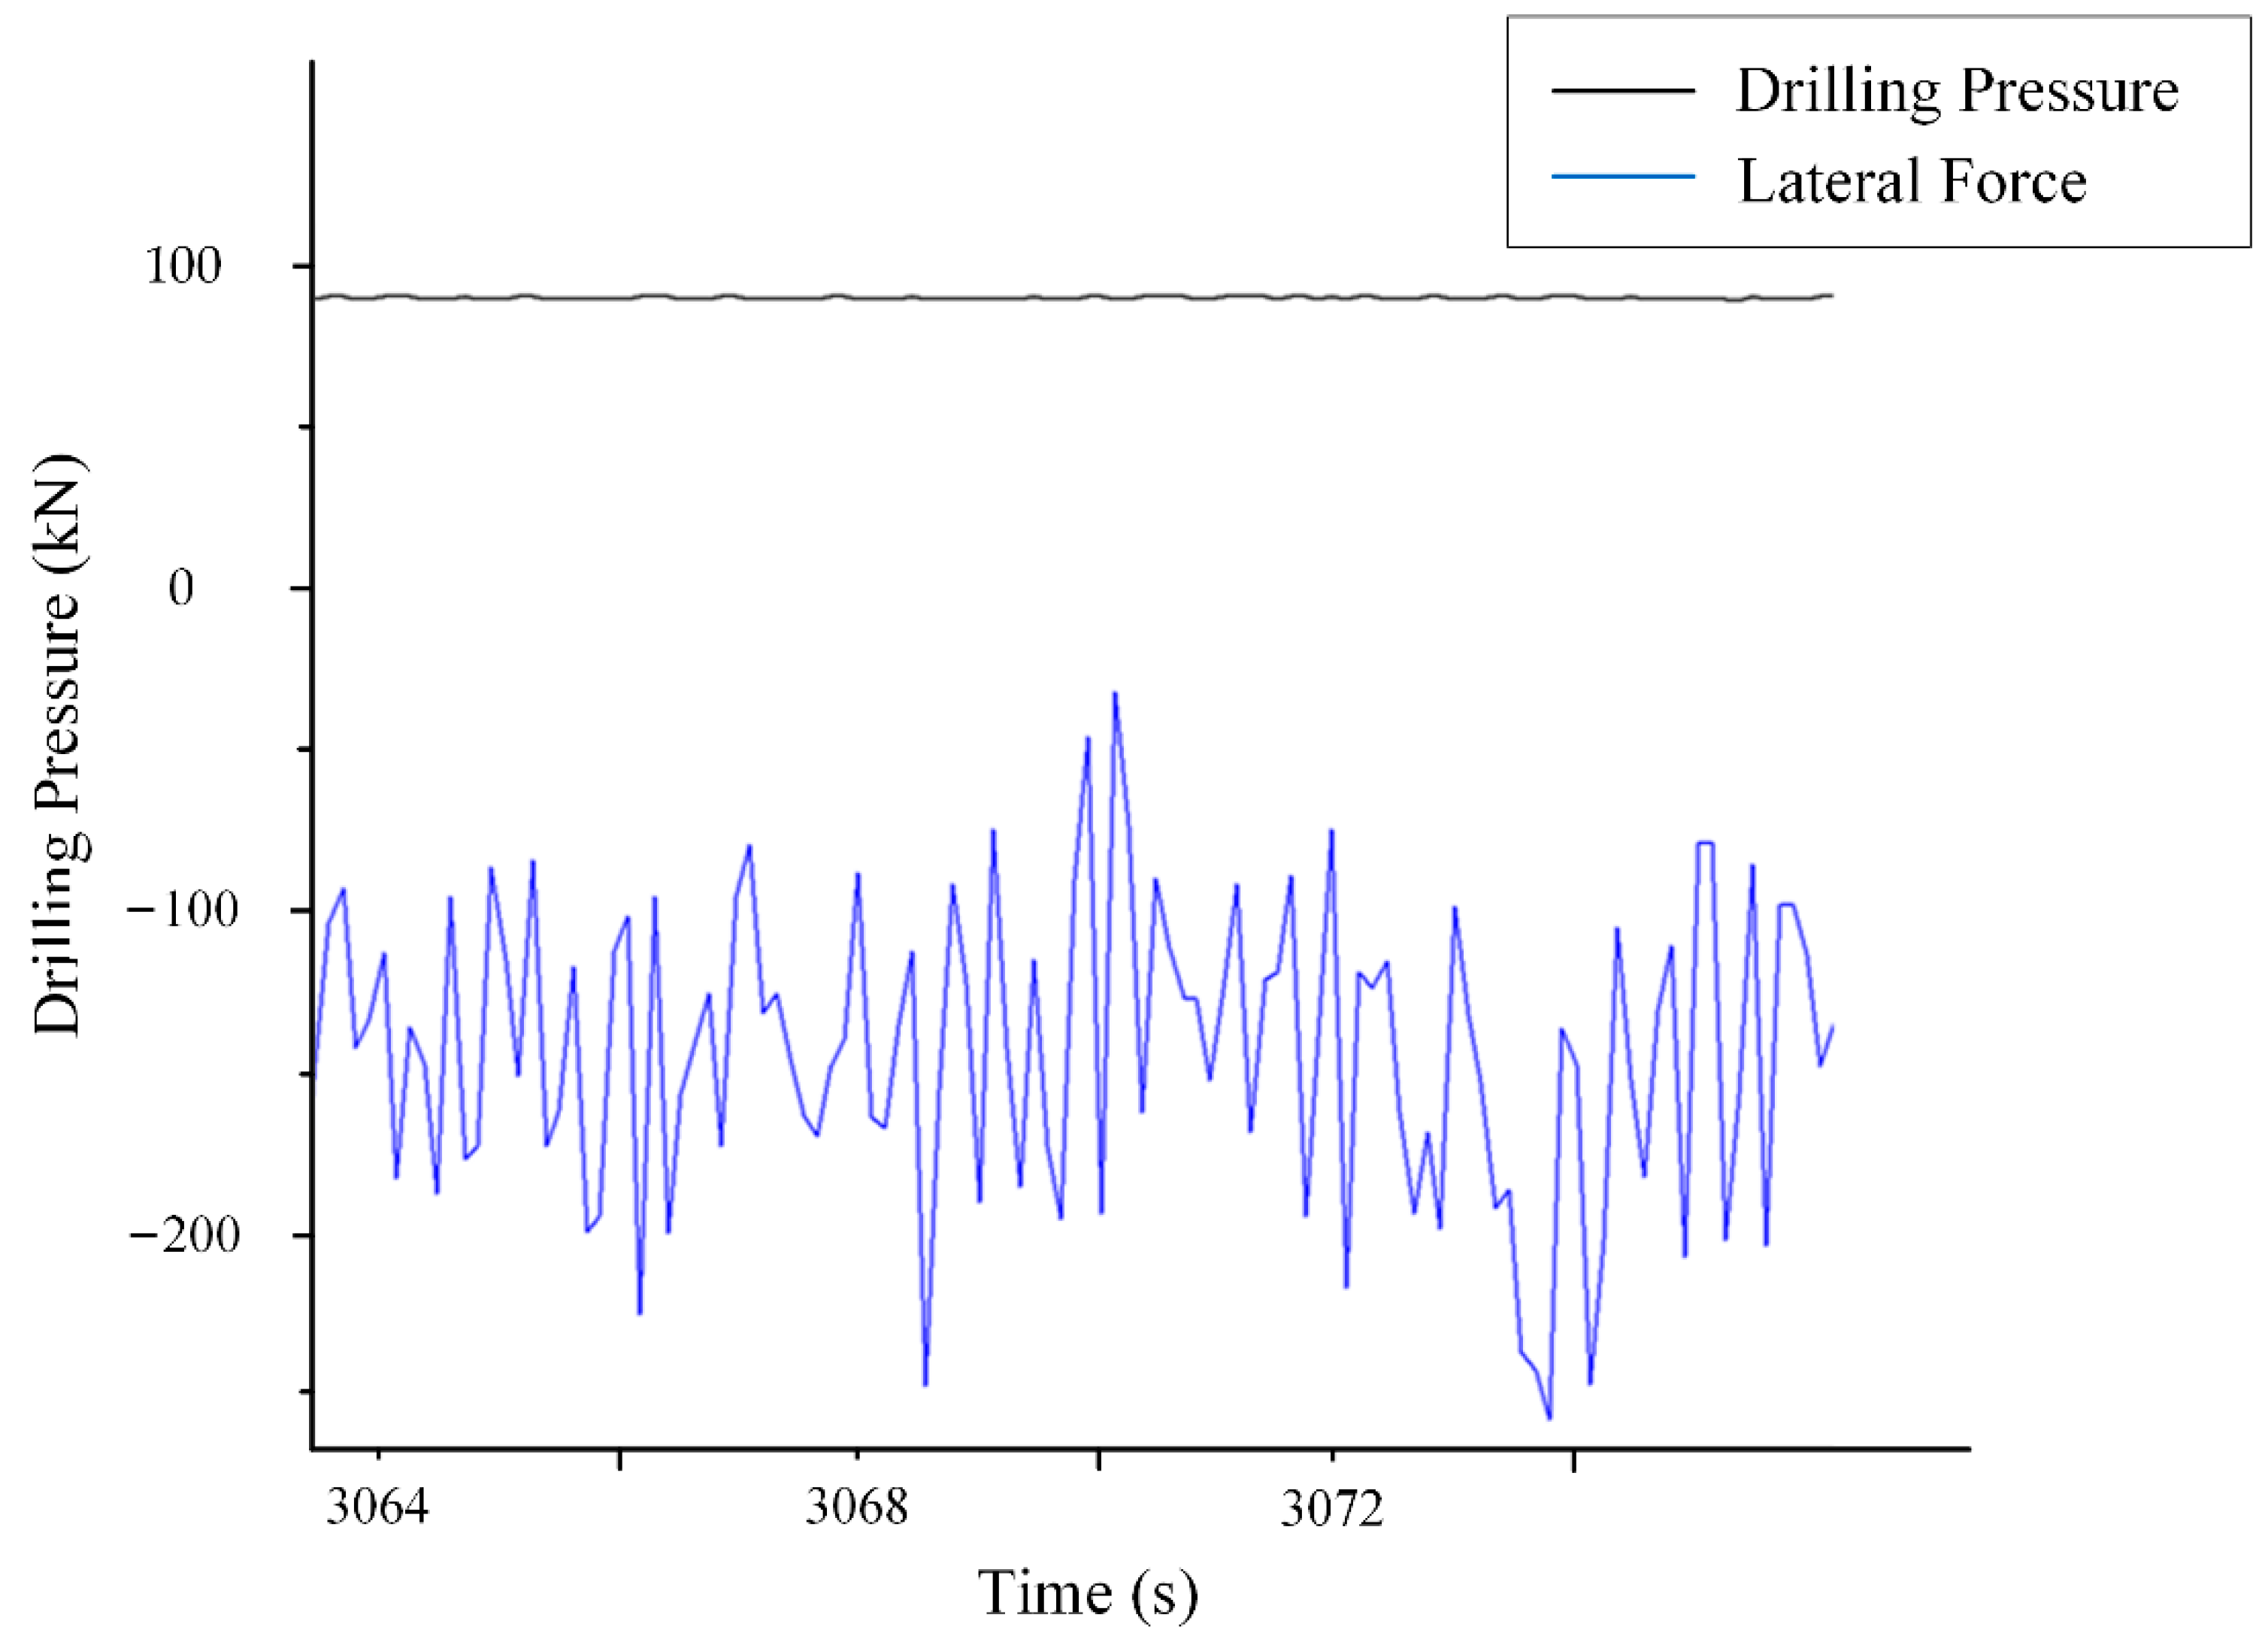
After completing the laboratory test, the system was applied to a drilling operation. Figure 10 shows the curve between the downhole measured lateral force and the drilling pressure recorded on the ground during normal drilling: black curve in the figure represents the drilling pressure, and the blue curve represents the lateral force. It can be seen from the curve in the figure that, by adjusting the drilling pressure on the ground, the drilling pressure was maintained around 90 kN during the drilling process. In the middle, the drilling pressure was suddenly reduced due to the process of changing a single pipe. Finally, the drilling pressure was restored through the ground adjustment. The change process of the drilling pressure was , and the change in the median value of the lateral force recorded underground was . Comparing the two curves, it can be clearly seen that the changes in the downhole measured data were in good agreement with the changes in the surface pressure regulation data, but the drilling pressure recorded on the ground was relatively stable, while the lateral force curve recorded underground fluctuated greatly. It can be seen that, with the increase in drilling depth, the lateral force changed, and vibration caused by the drill pipe length drilling also appeared. Figure 11 is a partial enlarged view of the curve in Figure 10. It can be seen that the direction of the lateral force also changed from time to time during the drilling process. The measured curve was distributed around −100 kN, and the fluctuation amplitude reached about 100 kN. Therefore, the lateral force measurement system designed in this paper could accurately measure and record the changes in the actual lateral force on the downhole drill string and could meet the needs of the drilling site.
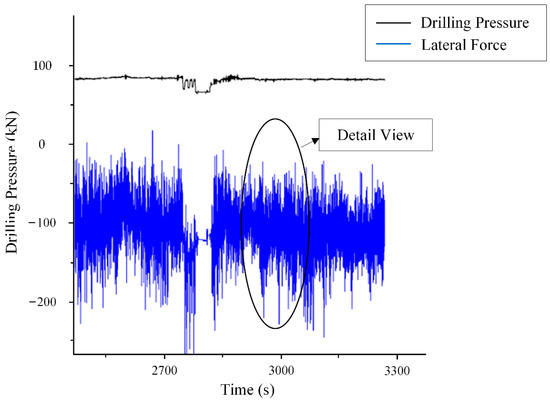
Figure 10.
Relationship between the lateral force and drilling pressure.
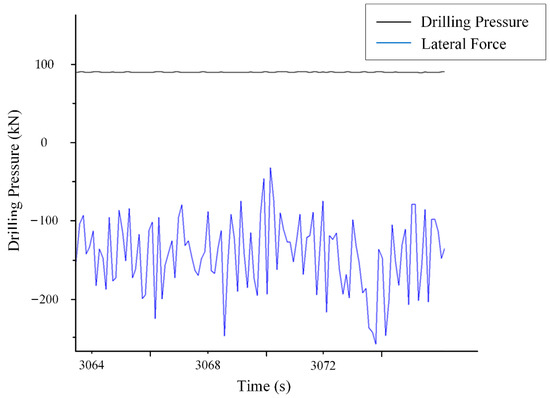
Figure 11.
Partial enlargement of relationship between the lateral force and drilling pressure.
In order to study the characteristics of lateral force, the relationship with the torque also needed to be studied. Figure 12 shows the relationship between lateral force and torque in the actual drilling process. In Figure 13, the red curve shows the torque, and Figure 13 is a partial enlargement of the drilling process.
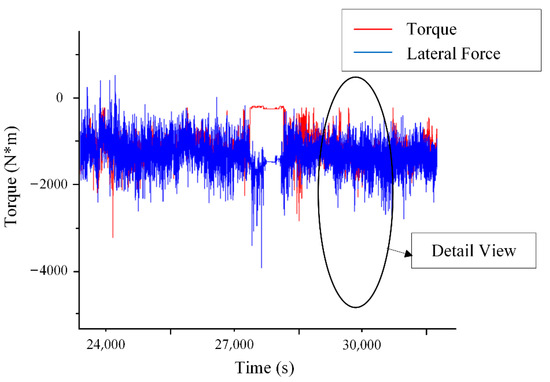
Figure 12.
Relationship between the lateral force and the torque.
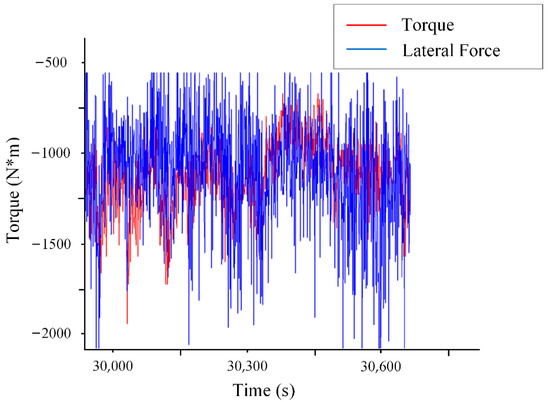
Figure 13.
Partial enlargement of relationship between the lateral force and the torque.
The working condition of the drill pipe during drilling could also be seen in the relationship diagram of lateral force and torque. The coincidence degree of the lateral force curve and the torque curve in Figure 12 was very high, and the two trends were very similar. In partially enlarged Figure 13, it can be seen more clearly that the lateral force curve and torque curve were at their minimum values near 29,950 s, 30,070 s, 30,150 s, 30,225 s, 30,350 s, and other times, while they were at their maximums near 30,000 s, 30,130 s, 30,300 s, 30,400 s, and other times. The overall trend of the two was the same, that is, the lateral force was basically proportional to the torque. It can be seen that torque was an important factor affecting the lateral force. In this measurement, the change in the torque was very regular, so the distribution of the lateral force was also very regular, and it could be concluded that the measurement effect was good.
In summary, the lateral force distribution in the process of drilling was complex and affected by factors such as drilling pressure and torque. While the drilling pressure and the torque increased within a certain range, the lateral force also had an overall increase. Through the analysis, the lateral force could be closely related with the deviation angle, drilling speed, distance from the drill bit, and formation characteristics. This is a next step for the research needs to be considered.
5. Conclusions
This article mainly studied the lateral force distribution of the near-bit side while drilling and designed a lateral force measurement system based on the measuring principle of strain gauges. It could be used to measure downhole lateral force parameters and evaluate drilling risk. The following results were obtained:
- A comprehensive and effective lateral model was established according to the distribution of the lateral force;
- Based on the comprehensive model, a design scheme for a high-accuracy underground lateral force parameter measuring system was proposed, and the system’s development process was described from software design to hardware design in detail;
- Through a field test, downhole data were obtained successfully, which could meet the demands of a drilling field test. In addition, the drilling trajectory and the casing wear were predicted accurately according to the distribution of the lateral force.
Author Contributions
Conceptualization, K.D.; methodology, K.D., W.H. and L.G.; software, L.G., X.X. and Q.Y.; validation, Z.H. and W.H.; formal analysis, W.H. and L.G.; data curation, X.X.; writing—original draft preparation, K.D. and Z.H.; writing—review and editing, W.H., L.G. and X.X. All authors have read and agreed to the published version of the manuscript.
Funding
This work was supported by the National Natural Science Foundation (51974273), the International Science and Technology Cooperation Project of Chengdu (2020-GH02-00016-HZ), and the Special Project of Science and Technology Strategic Cooperation between Nanchong City and Southwest Petroleum University (SXHZ026/SXHZ038/SXHZ024).
Institutional Review Board Statement
Not applicable.
Informed Consent Statement
Not applicable.
Data Availability Statement
Not applicable.
Conflicts of Interest
The authors declare no conflict of interest.
References
- Chen, Q.; Yu, D.; Fei, W.; Chao, Y.; Zan, W. Optimization of horizontal well development technology in the sulige gas field. Nat. Gas Ind. 2012, 32, 39–43. [Google Scholar]
- Xu, K.; Xiong, J.; Chen, J.; Qin, D. The evaluation and analysis of hydraulic extensions ability of horizontal section in deep horizontal wells. J. Southwest Pet. Univ. 2012, 34, 101–106. [Google Scholar]
- Ge, L.; Li, D.; Huang, Q.; Tian, G.; Wei, G.; Ahmed, J. Electrodes Optimization of an Annular Flow Electromagnetic Measurement System for Drilling Engineering. IEEE Access 2020, 8, 138481–138492. [Google Scholar] [CrossRef]
- Bhalla, K.; Gong, L.; Mckown, G.K. Implementation of a bottom-hole assembly program. J. Energ. Resour. Technol. 2007, 130, 130–134. [Google Scholar]
- Samuel, R.; Yao, D. Drillstring vibration with hole-enlarging tools: Analysis and avoidance. J. Energ. Resour. Technol. 2013, 135, 1–13. [Google Scholar] [CrossRef]
- Irawan, S.; Shanmugam, A.K.; Hidayat, M.I.P.; Biyanto, T.R. Study of Lateral Vibration of Drilling String with Mass Imbalance Using Finite Element. Int. J. Adv. Sci. Eng. Inf. Technol. 2019, 9, 816–821. [Google Scholar] [CrossRef]
- Kyratsis, P.; Markopoulos, A.; Efkolidis, N.; Maliagkas, V.; Kakoulis, K. Prediction of thrust force and cutting torque in drilling based on the response surface methodology. Machines 2018, 6, 24. [Google Scholar] [CrossRef] [Green Version]
- Ma, Y.C.; Huang, Z.; Li, Q.; Zhou, Y.; Peng, S. Cutter layout optimization for reduction of lateral force on PDC bit using kriging and particle swarm optimization methods. J. Pet. Sci. Eng. 2018, 163, 359–370. [Google Scholar] [CrossRef]
- Li, Y.; Wang, J.; Shan, Y.; Wang, C.; Hu, Y. Measurement and Analysis of Downhole Drill String Vibration Signal. Appl. Sci. 2021, 11, 11484. [Google Scholar] [CrossRef]
- Liu, Y.; Ma, T.; Chen, P.; Yang, C. Method and apparatus for monitoring of downhole dynamic drag and torque of drill-string in horizontal wells. J. Pet. Sci. Eng. 2018, 164, 320–332. [Google Scholar] [CrossRef]
- Jiang, H.L.; Liu, G.H.; Li, J.; Zhang, T. Development of Downhole Dynamic Measuring System and Field Trial. J. Comput. 2018, 29, 205–212. [Google Scholar]
- Lu, C.D.; Wu, M.; Chen, L.; Cao, W. An event-triggered approach to torsional vibration control of drill-string system using measurement-while-drilling data. Control Eng. Prac. 2021, 106, 104668. [Google Scholar] [CrossRef]
- Wu, C.; Huang, H.; Yang, S.; Wen, G. Pagoda-shaped triboelectric nanogenerator with high reliability for harvesting vibration energy and measuring vibration frequency in downhole. IEEE Sens. J. 2020, 20, 13999–14006. [Google Scholar] [CrossRef]
- Cao, T.; Yu, K.; Chen, X.; Zhu, H.; Zhang, R. Full-phase optimization of PDC bit cutter layout to reduce lateral force based on zoning method. J. Mech. Sci. Technol. 2021, 35, 1199–1207. [Google Scholar] [CrossRef]
- Tang, L.; Yao, H.; Wang, C. Development of remotely operated adjustable stabilizer to improve drilling efficiency. J. Nat. Gas Sci. Eng. 2021, 95, 104174. [Google Scholar] [CrossRef]
- Tian, D.; Song, X. Control of a downhole drilling system using an integral Barrier Lyapunov Function based method. Int. J. Control. 2021, 94, 1–14. [Google Scholar] [CrossRef]
- Rafezi, H.; Hassani, F. Drilling signals analysis for tricone bit condition monitoring. Int. J. Min. Sci. Technol. 2021, 31, 187–195. [Google Scholar] [CrossRef]
- Tian, J.; Xiong, C.; Fan, C.; Guo, L.; Liu, C. Analysis of Whirl Characteristics of Drill String Under Multidirectional Coupling Conditions. SPE Drill. Complet. 2022, 37, 1–14. [Google Scholar] [CrossRef]
- Bakhty, N.S.; Bembel, G.S. Well Index Calculation for Arbitrary Trajectory, Perforation, Hydraulic Fracturing and Geological Properties. In Proceedings of the 2017 Society of Petroleum Engineers Russian Petroleum Technology Conference, Moscow, Russia, 12–15 September 2017; pp. 115–143. [Google Scholar]
- Ge, L.; Chen, J.X.; Tian, G.Y.; Ahmed, J.; Huang, Q.; Hu, Z. Study on a new electromagnetic flowmeter based on three-value trapezoidal wave excitation. Flow Meas. Instrum. 2021, 78, 101882. [Google Scholar] [CrossRef]
- Bailey, J.R.; Biediger, E.A.O.; Gupta, V.; Ertas, D.; Elks, W.C.; Dupriest, F.E. Drilling vibrations modeling and field validation. In Proceedings of the 2008 Society of Petroleum Engineers Drilling Conference, Orlando, FL, USA, 2–4 September 2008; pp. 825–839. [Google Scholar]
- Hettler, J.; Tabatabaeipour, M.; Delrue, S.; Abeele, K.V.D. Detection and characterization of local defect resonances arising from delaminations and flat bottom holes. J. Nondestruct. Eval. 2017, 36, 1–10. [Google Scholar] [CrossRef]
- Spesivtsev, P.; Sinkov, K.; Sofronov, I.; Zimina, A.; Umnov, A.; Yarullin, R. Predictive model for bottomhole pressure based on machine learning. J. Pet. Sci. Eng. 2018, 166, 825–841. [Google Scholar] [CrossRef]
- Zhang, G.Y.; Tu, B.; Zhan, T.X. Research on mud pulse signal starting time extracting algorithm in mwd. Appl. Mech. Mater. 2014, 525, 685–690. [Google Scholar] [CrossRef]
- Ge, L.; Wei, G.H.; Wang, Q.; Hu, Z.; Li, J.L. Novel Annular Flow Electromagnetic Measurement System for Drilling Engineering. IEEE Sens. J. 2017, 17, 5831–5839. [Google Scholar] [CrossRef]
- Tamura, R.; Sakaino, S.; Tsuji, T. High dynamic range uniaxial force/torque sensor using metal foil and semiconductor strain gauge. IEEJ J. Ind. Appl. 2021, 10, 506–511. [Google Scholar] [CrossRef]
- Ge, L.; He, Y.; Wang, Q.; Hu, Z.; Gan, F.; Wei, G. Research on oil-well tubing damage monitoring of intelligent well based on FSM technology. Insight-Non-Destructive Test. Cond. Monit. 2019, 61, 458–464. [Google Scholar] [CrossRef]
- Ge, L.; Deng, H.; Wang, Q.; Hu, Z.; Li, J. Study of the influence of temperature on the measurement accuracy of transit-time ultrasonic flowmeters. Sens. Rev. 2018, 39, 269–276. [Google Scholar] [CrossRef]
- Cenk, ü.; Tatara, E.; Nar, A. Real-time batch process supervision by integrated knowledge-based systems and multivariate statistical methods. Eng. Appl. Artif. Intell. 2003, 16, 555–566. [Google Scholar]
- Ge, L.; Li, H.L.; Wang, Q.; Wei, G.H.; Hu, Z.; Liao, J.B.; Li, J.L. Design and Optimization of Annular Flow electromagnetic Measurement System for Drilling Engineering. J. Sens. 2018, 2018, 1–12. [Google Scholar] [CrossRef] [Green Version]
- Collett, T.S.; Lee, M.W.; Zyrianova, M.V.; Mrozewski, S.A.; Guerin, G.; Cook, A.E.; Goldberg, D.S. Gulf of mexico gas hydrate joint industry project leg ii logging-while-drilling data acquisition and analysis. Mar. Pet. Geol. 2012, 34, 41–61. [Google Scholar] [CrossRef]
- Davis, W.B.; Ratner, M.A.; Wasielewski, M.R. Dependence of electron transfer dynamics in wire-like bridge molecules on donor–bridge energetics and electronic interactions. Chem. Phys. 2002, 281, 333–346. [Google Scholar] [CrossRef]
- Park, J.; You, I.; Shin, S.; Jeong, U. Material approaches to stretchable strain sensors. ChemPhysChem 2015, 16, 1155–1163. [Google Scholar] [CrossRef] [PubMed]


Publisher’s Note: MDPI stays neutral with regard to jurisdictional claims in published maps and institutional affiliations. |
© 2022 by the authors. Licensee MDPI, Basel, Switzerland. This article is an open access article distributed under the terms and conditions of the Creative Commons Attribution (CC BY) license (https://creativecommons.org/licenses/by/4.0/).