Article

Low-Carbon Supply Chain Decisions Considering Carbon Emissions Right Pledge Financing in Different Power Structures

School of Economics and Management, Shanxi University, Taiyuan 030006, China
*
Author to whom correspondence should be addressed.
Energies 2022, 15(15), 5721; https://doi.org/10.3390/en15155721
Submission received: 5 June 2022 / Revised: 22 July 2022 / Accepted: 4 August 2022 / Published: 6 August 2022
(This article belongs to the Section B3: Carbon Emission and Utilization)

Abstract

:
While carbon emissions reduction brings about environmental benefits, it can also create financial pressure on many manufacturing enterprises. Many manufacturing enterprises have begun to pledge their own carbon emissions right quotas for financing and the funds from this financing are being used to implement energy savings and emissions reduction strategies. To investigate the impact of carbon emissions right pledge financing on supply chains, this study constructed a two-echelon low-carbon supply chain, which consisted of a capital-constrained manufacturer and a retailer. The manufacturer invested in carbon reduction technologies using carbon emissions right pledge financing. On this basis, we analyzed the carbon emissions reduction levels and profits of the supply chain in three different power structures. The results showed that the manufacturer pledged the most carbon emissions rights to finance emissions reduction in the Nash model and, in this case, the carbon emissions reduction levels and profits of the supply chain were always the highest. In the manufacturer-led Stackelberg model, the overall economic and environmental benefits of the supply chain were the lowest. In addition, we analyzed the sensitivity of the important parameters of the model and revealed some management implications.

1. Introduction

With the development of the economy and society, carbon emissions from energy consumption are considered to be one of the important causes of climate change and environmental deterioration [1]. It is clear that carbon emissions are causing irreversible damage to the climate. In supply chains, the production processes of upstream enterprises inevitably produce carbon emissions. In addition, logistics and other parts of supply chains also produce some carbon emissions that cause environmental pollution [2,3]. Methods for reducing the carbon emissions that are produced in supply chains and ensuring the sustainability of society have attracted the attention of the world. In fact, to decrease carbon emissions, countries have formulated many policies that are related to carbon emissions reduction. The cap-and-trade system is considered to be one of the most effective market mechanisms for reducing carbon emissions [4]. The cap-and-trade system first appeared in the Kyoto Protocol, which came into effect in 2005. The Kyoto Protocol stipulated that each party’s carbon emissions should not exceed the allocated carbon quota but also allowed those carbon quotas to be traded among the parties (http://baike.baidu.com/view/41423.htm, accessed on 4 June 2022). The cap-and-trade system generally operates within carbon trading systems. There are currently 24 carbon trading systems in place around the world, with 22 countries and regions considering or actively developing carbon trading systems (http://www.tanpaifang.com/tanjiaoyi/2021/0428/77660_3.html, accessed on 4 June 2022).
It is known that the traceability of products within supply chains is becoming an increasingly urgent requirement that makes it easier for consumers to see the carbon emission levels of products [5,6]. With the increase in the consumer awareness of environmental sustainability, low-carbon products have become more popular [7]. Therefore, manufacturers and retailers are willing to participate in low-carbon supply chains. More than 300 enterprises have joined The Climate Pledge, which was co-founded by Amazon and Global Optimism, to actively implement carbon reduction actions (http://www.cb.com.cn/index/show/gd/cv/cv1361573801490, accessed on 4 June 2022). Theoretical studies have shown that investments in carbon emissions reduction technologies can help enterprises to better accomplish the task of carbon emissions reduction [8]. For example, the application of mixed ammonia combustion technology in coal-fired boilers can greatly reduce the carbon emissions from coal-fired units (http://gs.people.com.cn/n2/2022/0124/c183342-35109146.html, accessed on 4 June 2022). However, the application of new technologies often faces unforeseen challenges, so it is also important to investigate whether carbon emissions reduction technologies can be well translated into practice [9].
However, due to the lack of funds that are being invested in carbon reduction technologies, some enterprises have difficulty in reducing their carbon emissions. To solve this problem, commercial banks have begun to provide loans for enterprises that are specifically for reducing carbon emissions. Financing for carbon emissions reduction can effectively restrain the carbon emissions from supply chains [10]. However, in traditional financing modes, carbon emissions constraints are usually treated as negative factors for enterprise operation [11]. To enhance the enthusiasm of enterprises and supply chains for carbon emissions reduction, enterprises can pledge their carbon emissions right to borrow from the bank [12]. For example, in 2014, the Hubei Yihua Group borrowed CNY 40 million in loans from the Industrial Bank by pledging its carbon emissions rights to implement energy savings and emissions reduction strategies (http://www.tanpaifang.com/tanguwen/2020/0704/72142.html, accessed on 4 June 2022). In 2021, a state-owned enterprise used its surplus carbon emissions rights as a pledge and obtained a loan of CNY 36.52 million, according to the market value of carbon quotas (https://www.zj.gov.cn/art/2021/10/31/art_1554467_59131862.html, accessed on 4 June 2022). Theoretical studies have also shown that when carbon emissions permits become a factor in financial and operational decisions, supply chain performance and sustainability can be significantly improved [11]. However, it is still unclear how the financing mechanisms in carbon pledge financing affect the different parts of supply chains and how many carbon permits manufacturers are willing to pledge for financing.
Moreover, the existing practices and literature have shown that power structures have a great influence on the operation and carbon emissions reduction decisions of supply chains [13]. In general, upstream companies are more likely to be Stackelberg leaders in supply chains. The large automobile manufacturing company BYD announced that it would stop the production of fuel vehicles from March 2022 and start to focus on the production of new energy vehicles (http://www.tanpaifang.com/tanguwen/2022/0405/84462.html, accessed on 4 June 2022). This decision is bound to have certain impacts on the strategies and interests of the other supply chain members. In addition, some large retailers may also become supply chain leaders, such as Wal-Mart and Amazon. Most of Wal-Mart’s carbon emissions are produced by its supply chain. To reduce the impact of its business on the environment, Wal-Mart has urged suppliers to seek ways to reduce their carbon emissions from energy and product design (http://www.tanpaifang.com/tanguwen/2020/0907/73747.html, accessed on 4 June 2022). A large number of researchers have studied the influence of power structures on supply chain pricing and performance and have found that the pricing decisions and profits of supply chain members are different in different power structures [14]. With the development of more sustainable practices, scholars have begun to study the influence of different power structures on carbon emissions reduction in supply chains [15]. However, when the carbon emissions reduction levels of manufacturers are constrained by capital, it is unknown whether the power structures of supply chains affect manufacturer decisions on financing and carbon emissions reduction. Therefore, based on the above analysis, this paper mainly discusses the following issues:
  • What are the impacts of different power structures on the carbon emissions and profits of supply chains?
  • How does the conversion coefficient of investments in carbon emissions reduction technologies affect the carbon emissions and equilibrium results of supply chains?
  • When carbon trading prices fluctuate, how should supply chains adjust their decisions to adapt to these changes?
In order to study these issues, this study considered a two-echelon low-carbon supply chain, which consisted of a retailer and a manufacturer. The manufacturer had capital constraints and needed to reduce its carbon emissions. To invest in carbon emissions reduction technology, this manufacturer obtained financing by pledging its carbon emissions quota to the bank. The consumers in this scenario had low-carbon preference behaviors. On this basis, this study also investigated supply chain pricing and carbon emissions reduction decisions in three different power structures: a manufacturer-led Stackelberg (M) power structure, a retailer-led Stackelberg (R) power structure and a vertical Nash power structure.
Our paper makes the following contributions to the field of low-carbon supply chains. Firstly, we took a capital-constrained low-carbon supply chain as the research object and performed a comparative analysis of the supply chain decisions and profits in three power structures. We found that the supply chain members obtained higher economic benefits when they became a supply chain leader. However, the supply chain system in the M power structure had the lowest profits and carbon emissions reduction levels. Secondly, we took carbon quota pledge financing into account and considered funds from financing that invested in carbon emissions reduction technologies. On this basis, we analyzed the influences of the conversion coefficient of the investments in carbon emissions reduction technologies, the carbon trading prices and the financing interest rates on supply chain decisions. Research has shown that increases in the conversion coefficients of investments in carbon emissions reduction technologies and carbon trading prices can produce higher economic and environmental benefits for supply chains, although increases in carbon trading prices are unfavorable to retailers. Moreover, rising bank interest rates can also hurt supply chain interests.
The remaining sections of this paper are arranged as follows. Section 2 reviews the literature that is relevant to our study. Section 3 introduces the model assumptions and symbolic representations that are used in this paper. Section 4 describes the construction of our model and the solution to this paper. In Section 5, some theoretical results from numerical experiments are presented. The sensitivity analysis of some important parameters is discussed in Section 6. Section 7 summarizes the conclusions and management implications of this paper and explains the limitations of this paper and possible future research directions.

2. Literature Review

In this section, we review the literature from three areas that are closely related to our research: supply chain carbon emissions reduction, supply chain financing and supply chain power structures.

2.1. Supply Chain Carbon Emissions Reduction

With the development of low-carbon economies, the carbon emissions reduction levels of enterprises are no longer only related to the enterprises themselves but also affect the development and interests of whole supply chains. Low-carbon supply chains pay more attention to their sustainability and strive to balance economic, social and environmental issues from a microeconomic perspective [16]. In low-carbon supply chains, consumers are often considered to have low-carbon preferences. Du et al. [7] studied the influence of the low-carbon preferences of consumers on low-carbon supply chains and found that emissions reduction not only incurred higher production costs but also stimulated the reverse demand function. Xia et al. [17] took into account the behavioral factors of supply chain members and studied the influences of reciprocity preferences and the low-carbon consciousness of consumers on supply chain pricing and carbon emissions reduction decisions. Wang et al. [1] found that a green reputation is closely related to emissions reduction. As a result, supply chain members can enhance their reputation by undertaking emissions reduction activities, which in turn increase the demand for low-carbon products. Since investing in carbon emissions reduction technologies can improve the emissions reduction efficiency of supply chains, Ma et al. [18] studied sustainable supply chain management under the influence of investments in green technology and government interventions. Their results showed that higher emissions reduction subsidies encouraged more investments in green emissions reduction technologies. Based on the above research, this paper considered the low-carbon preferences of consumers and investments in carbon emissions reduction technologies. In addition, many other factors in supply chains can also affect their carbon emissions reduction levels. Yang et al. [19] considered two competitive supply chains and studied the vertical cooperation for emissions reduction within a single supply chain and the horizontal cooperation between two manufacturers in two supply chains. Their results showed that vertical cooperation could improve carbon emissions reduction rates while horizontal cooperation between manufacturers could harm retailer profits and consumer welfare. Xu et al. [20] studied energy conservation and emissions reduction in closed-loop supply chains by considering the factors of uncertain demand and carbon prices. Yu et al. [21] studied the impact of information sharing on carbon emissions reduction in supply chains. Their study found that information sharing was beneficial to suppliers but unfavorable to retailers and that sharing information on demand significantly reduced emissions from producing unwanted products. Bai et al. [22] and Daryanto et al. [23] studied the influence of carbon emissions reduction on supply chains with vendor-managed inventories for dealing with deteriorated goods. Zhang et al. [24] studied the influence of different carbon quota allocation rules on product prices, carbon emissions reduction and profit distribution within supply chains.
The above literature on carbon emissions reduction in supply chains has not considered the problem of the financial constraints of supply chain members. In fact, enterprises in supply chains often face situations involving difficult turnovers or a lack of capital. Moreover, supply chains also need a large amount of funds to achieve reductions in their carbon emissions, which also increases financial pressure on supply chain members. Therefore, it is of great significance to analyze the carbon emissions reduction levels of supply chains that are under capital constraints. In addition, the above literature has only analyzed low-carbon supply chains from the perspective of investments in carbon emissions reduction technologies. In this paper, the effects of technology development after investments in carbon emissions reduction are taken into account, which could better explore the whole process of investing in carbon emissions reduction technologies and technology development.

2.2. Supply Chain Financing

2.2.1. Traditional Financing Model

Within the research field that is related to supply chain financing, most of the previous literature has found that supply chain members increase their outputs using financing and thus, increase their own profits and those of the whole supply chain. For example, Chen et al. [25] studied the impacts of buyback guarantee financing and fairness concerns on the performance of supply chains. Due to the diverse range of financing methods, comparative research on financing methods has also been favored by scholars. Ding et al. [26] studied advance payment financing and bank loan financing under capital constraints for supply chains with uncertain outputs and proposed a loan repayment contract that could coordinate supply chains. In addition to single financing strategies, mixed financing models and cooperation between supply chain members have also been gradually taken into consideration by scholars. Jin et al. [27] compared the advantages and disadvantages of cooperative and non-cooperative financing strategies when both suppliers and retailers had financial problems. Their study showed that cooperative financing strategies were more desirable for suppliers and supply chains but retailers preferred non-cooperative strategies. Fang et al. [28] compared the optimal decisions of green supply chains for green credit financing and mixed financing and presented the best applicable scenarios for the different financing methods.

2.2.2. Financing for Carbon Emissions Reduction

In order to ensure the sustainable development of supply chains, the members of low-carbon supply chains also use financing funds to invest in carbon emissions reduction technologies. An et al. [10] developed a supply chain model that used financing funds to invest in production and green improvements. They found that both green credit financing and trade credit financing could effectively curb the carbon emissions of enterprises. Lu et al. [29] considered two financing strategies for manufacturers that invested in carbon emissions reduction using external financing. Their study showed that manufacturers were more willing to invest in carbon emissions reduction technologies than purchase carbon quotas. Cong et al. [30] analyzed the impacts of green finance mechanisms, cap-and-trade mechanisms and output uncertainty on the carbon emissions reduction decisions of manufacturers that had limited capital. Qin et al. [31] studied the influence of advance payment financing on carbon emissions reduction and supply chain production. Their results showed that mixed financing could encourage manufacturers to increase their carbon emissions reduction levels even more. Cao and Yu [32] studied trade credit financing in emissions-dependent supply chains and found that caps on carbon emissions only had an impact on the optimal order quantities in decentralized supply chains. Subsequently, Cao et al. [33] discussed supply chain financing modes following investments in carbon emissions reduction and found that manufacturer profits decreased when they invested in carbon emissions reduction while the profits of suppliers and supply chains increased. Therefore, investments in carbon emissions reduction strategies are necessary for emissions-dependent supply chains that have limited capital.

2.2.3. Supply Chain Carbon Financing

Although supply chain financing can solve the problem of insufficient funds for carbon emissions reduction strategies, it cannot effectively revitalize the carbon assets of enterprises. To help enterprises to revitalize their carbon assets, scholars have found that supply chain members use carbon assets for financing. For example, Wang et al. [34] considered the financing methods of manufacturers using the Carbon Emissions Permits Repurchase Strategy (CEPRS) and studied the production decisions of manufacturers for normal products and remanufactured products on this basis. Wang et al. [35] found that under carbon emissions trading mechanisms, carbon credit repurchase policies could help manufacturers to obtain more loans for production activities, thus improving their production quantity and total profit. Cao et al. [11] found that when carbon emissions permits were allowed to be part of financial and operational decisions, the performance and sustainability of supply chains could be significantly improved. Moreover, it has been found that manufacturers that have limited capital can obtain financing by pledging carbon emissions permits to reduce their carbon emissions. Yang et al. [36] combined carbon financing and supply chain financing to analyze the impact of supply chain carbon financing (SCCF) on supply chain cooperation and carbon emissions reduction. The SCCF model pledged the overall carbon quotas of supply chains to banks for financing and the results showed that the carbon emissions reduction levels that were produced by SCCF were significantly higher than those of traditional carbon financing models. Chen et al. [37] also showed that loans that were based on emissions rights produced significant social and environmental benefits.
Although there have been some studies on the use of carbon assets for supply chain financing, there have been few studies on carbon emissions right pledge financing. Moreover, the previous research models have not highlighted the inherent logic of carbon emissions pledge financing. Therefore, this study investigated carbon emissions pledge financing in low-carbon supply chains. We analyzed the impact of carbon emissions pledge financing on the operation and decision-making of low-carbon supply chains, thus enriching the literature within the field of supply chain financing.

2.3. Supply Chain Power Structures

When the power structures of supply chains begin to change, it usually leads to changes in optimal decisions and profits. The studies of Wang et al. [38] and Li et al. [39] showed that dominant supply chain members always benefited and that whole supply chains gained the most profits in the Nash model. By studying the influence of power structures on the CSR of supply chains, Liu et al. [40] found that CSR efforts were the highest in the Nash model. In addition, the influence of power structures on sustainable development and carbon emissions reduction has also been considered by scholars. Chen et al. [41] found that the power structures of supply chains could affect the design of optimal carbon emissions taxes and that appropriate channel leadership was necessary to achieve sustainable development goals. Chen et al. [42] studied the pricing and carbon emissions reduction decisions of two-echelon supply chains in different power structures. Their study showed that carbon emissions were the lowest in the Nash power structure and the highest in manufacturer-led power structures. Zhang et al. [8] studied the low-carbon strategies that were chosen by manufacturers in different power structures and found that imbalanced power structures were conducive to reducing carbon emissions. They concluded that governments should advocate for manufacturers to adopt green technologies to reduce emissions in imbalanced power structures. Ji et al. [15] constructed single emissions reduction models and cooperative emissions reduction models in different power structures and found that supply chain profits were higher under manufacturer leadership but when unit carbon prices increased, retailer leadership had better effects on improving the profits and low carbon levels of supply chains than manufacturer leadership. However, Jiang et al. [43] explored prefabricated building supply chain models in different power structures and carbon cap-and-trade systems and found that supply chain pricing was different in different power structures but it had no influence on carbon emissions reduction decisions. Compared to supply chain pricing and carbon emissions reduction strategies, there has been little research on the influence of power structures on supply chain financing. Tang et al. [44] studied the optimal emissions reduction and pricing decisions of supply chains in two power structures and under the capital constraints of manufacturers and analyzed financing mechanisms in the different power structures. They found that the power structure had no influence on the choice of financing mechanism among retailers.
However, few of the previous studies have combined power structures with supply chain capital constraints. In fact, the members of supply chains often face financial problems. Therefore, this study considered a manufacturer that was constrained by a lack of funds for carbon emissions reduction. On this basis, we investigated the influence of different power structures on the optimal decisions of supply chains. Table 1 shows the differences between our model and previous studies.
In conclusion, it can be seen from the above literature review that there has been some progress made within the fields of supply chain carbon emissions reduction, supply chain financing and supply chain power structures. However, there have been few studies on carbon emissions reduction in supply chains that are under the influence of capital constraints and power structures. Moreover, there has been especially little literature on the financing methods of carbon emissions right pledge financing. Therefore, this study constructed a two-echelon low-carbon supply chain, which was composed of a manufacturer and a retailer. We developed a model for carbon emissions pledge financing in low-carbon supply chains that have capital constraints and considered three different supply chain power structures. On this basis, we analyzed the optimal pricing, profitability and carbon emissions reduction decisions of low-carbon supply chains.

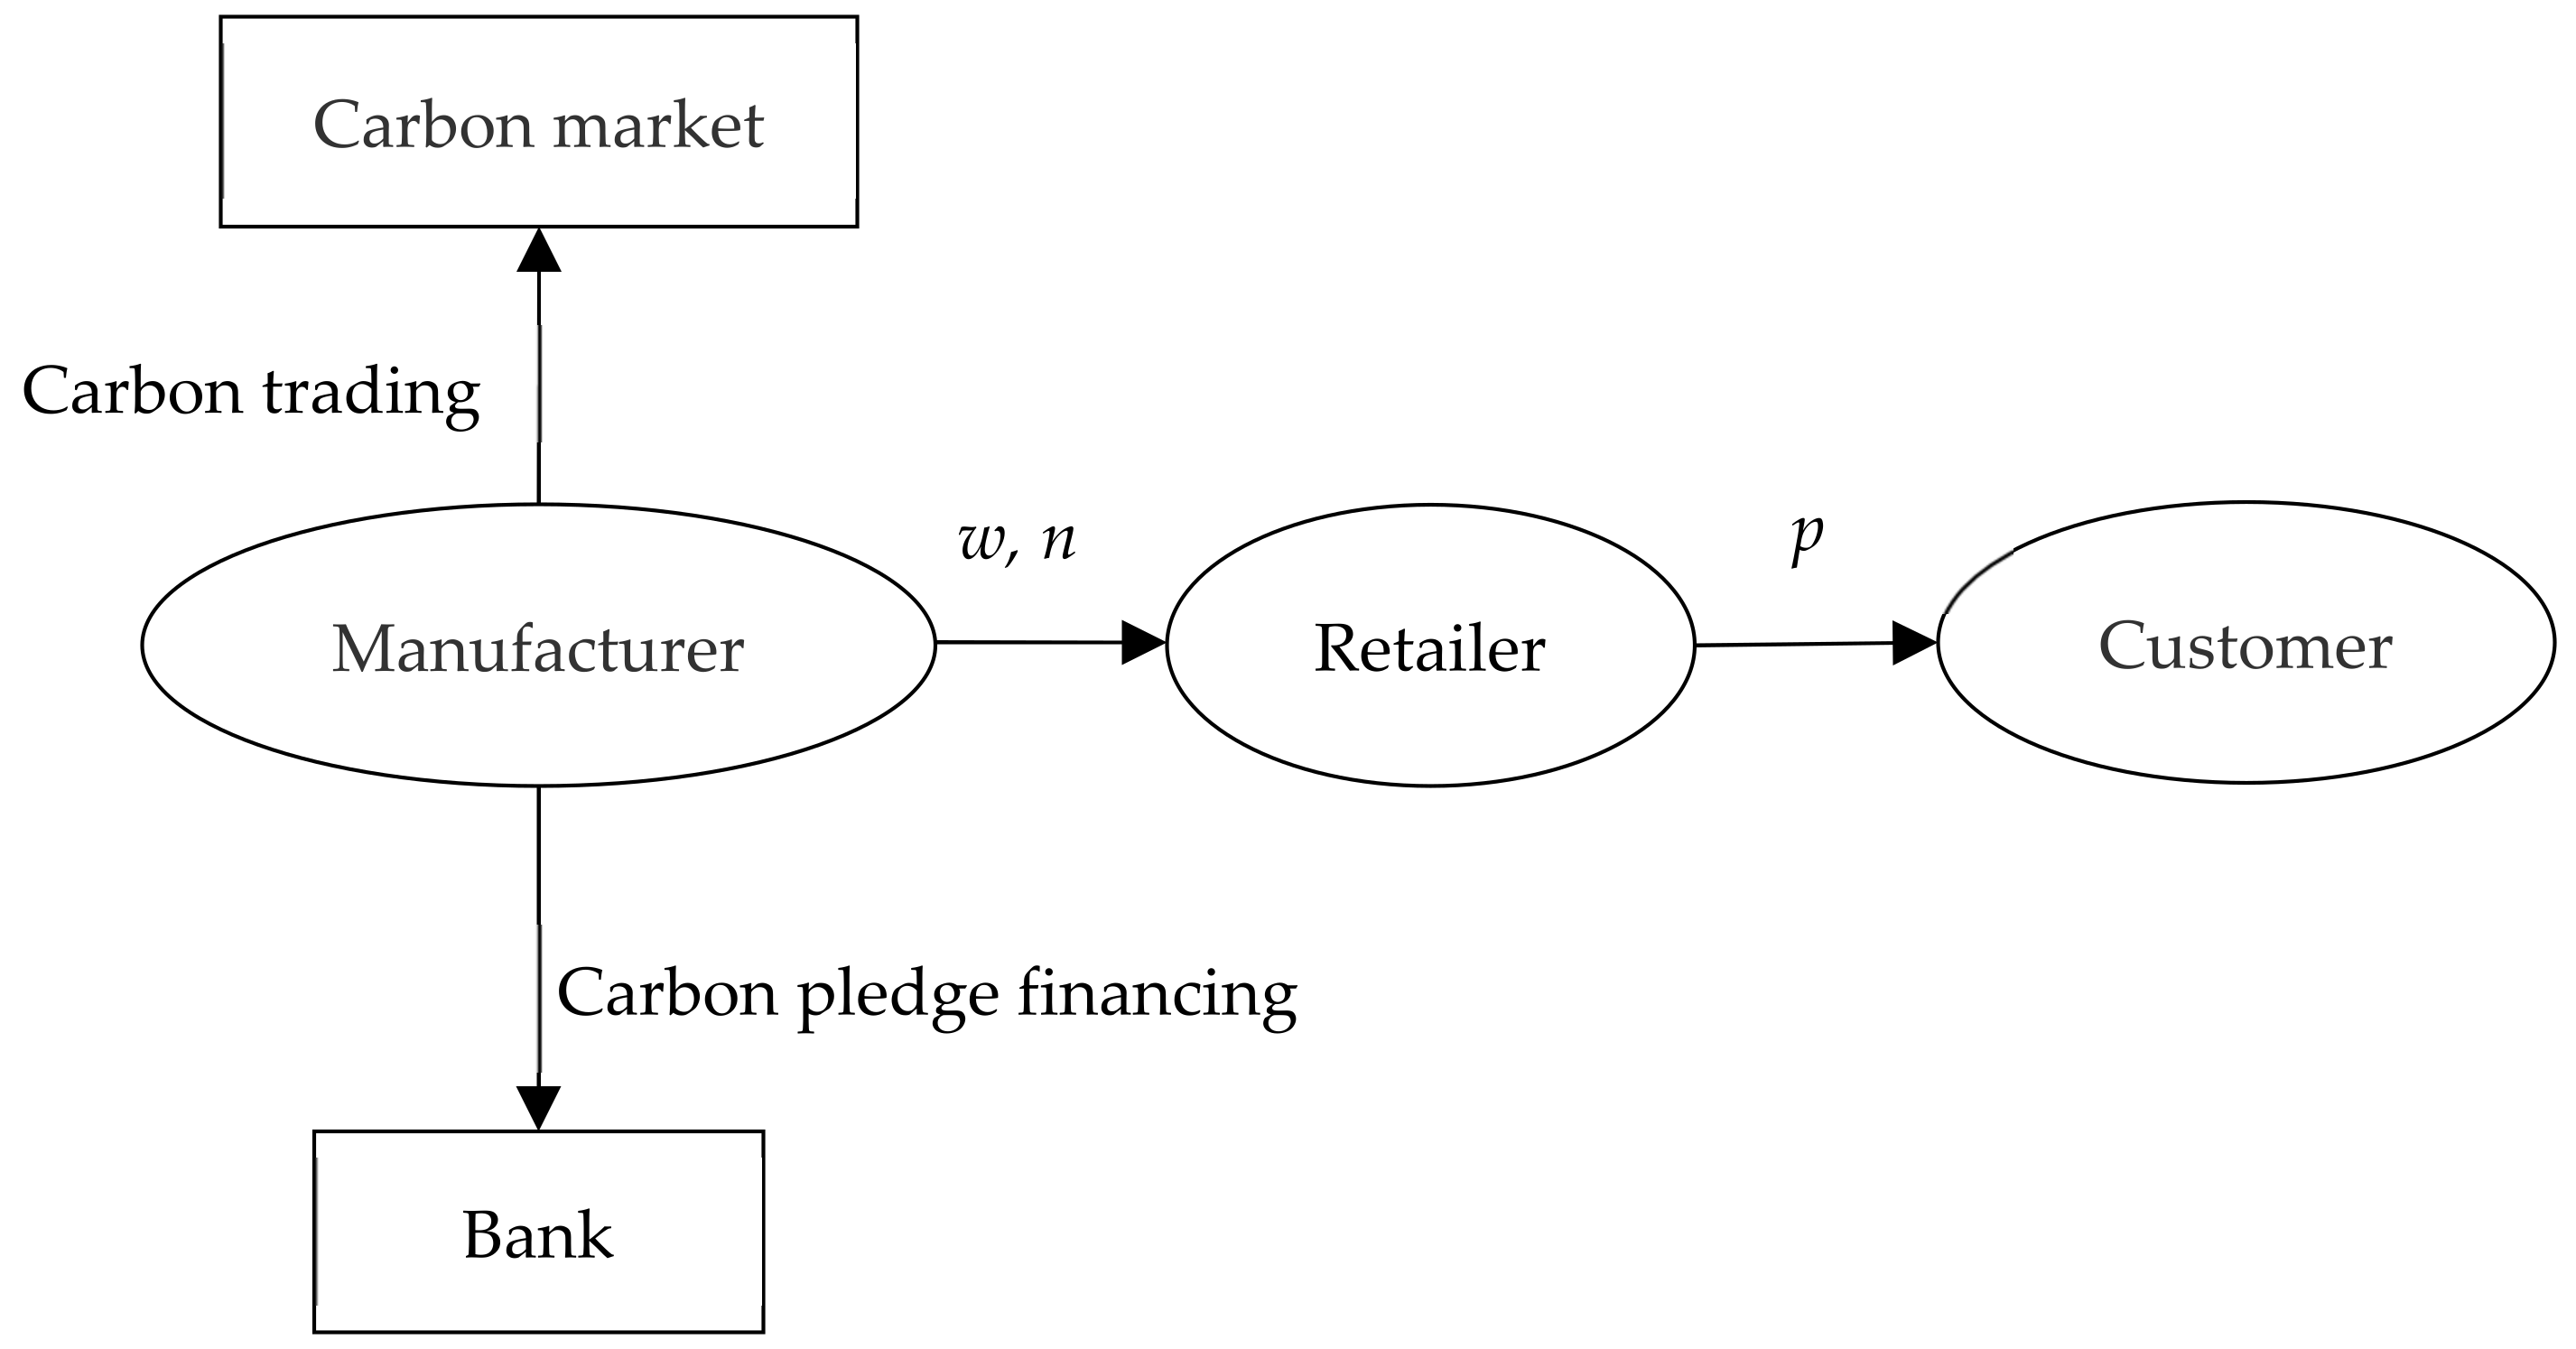
3. Model Mechanisms and Assumptions

This section introduces the notations that are used in this paper and the basic assumptions of the model.

3.1. Notations

The notations that were involved in this model and their definitions are shown in Table 2. The subscripts M and R denote the manufacturer and retailer, respectively. The superscript N represents the Nash model, the superscript M represents the manufacturer-led Stackelberg model and the superscript R represents the retailer-led Stackelberg model.

3.2. Model Assumptions

To make the model more feasible and realistic, we made the following assumptions.
A1. There was information sharing about demand among the supply chain members and all members were risk neutral (see Ding and Wan [26]).
A2. The manufacturer was constrained by capital and needed to conduct carbon emissions reduction. In order to accomplish the carbon emissions reduction task, the manufacturer obtained capital by pledging a carbon emissions quota ratio of n and the bank pledge rate was β and the loan amount was F = β n E p e (http://www.tanjiaoyi.com/article-35698-4.html, accessed on 4 June 2022). All of the obtained loans were invested in carbon emissions reduction technologies ( F = I ). We did not consider the manufacturer defaulting on their repayments.
A3. With the increase in investments in carbon emissions reduction technologies, the funds that were needed to reduce the same amount of carbon emissions also increased, so the carbon emissions reduction level could be described as e = α I 1 2 (similar to Wang et al. [45]).
A4. The consumers had low carbon preferences and market demand was influenced by retail prices and carbon emissions reduction levels [17]. Therefore, the market demand function that was faced by the supply chain was Q = a b p + η e , where a is the potential market demand, b is the sensitivity of the consumers to product prices and η is the sensitivity of the consumers to carbon emissions reduction levels. We made b < a + α η β n E p e p to guarantee a market demand of Q > 0 .
A5. Under the cap-and-trade system, the manufacturer could choose to buy carbon quotas within the carbon market or sell excess carbon quotas to complete the task of carbon emissions reduction. The amount of carbon quotas they traded was e 0 Q α I 1 2 E , where e 0 Q represents the original total carbon emissions of the manufacturer, α I 1 2 represents the carbon emissions reduction that was caused by the investment in carbon emissions reduction technologies and E represents the total carbon quota of the manufacturer. When e 0 Q α I 1 2 E > 0 (i.e., the actual carbon emissions of the manufacturer exceeded their carbon quota), the manufacturer needed to purchase additional carbon quotas; otherwise, it could sell the excess carbon quotas [46].
A6. For the convenience of our calculations and without a loss of generality, the initial cost to the manufacturer was assumed to be 0 and the production costs of the manufacturer were not included.

4. Model Formulation and Analysis

Based on the above assumptions, we considered a two-echelon low-carbon supply chain, which consisted of a capital-constrained manufacturer and a retailer. In order to reduce the carbon emissions, the manufacturer needed to obtain carbon quota pledge financing. The manufacturer pledged part of its carbon quota to banks for financing and all of the financing funds were invested in carbon emissions reduction technologies. The manufacturer could trade carbon within the carbon market. The manufacturer then sold the product for w per unit to the retailer, who in turn sold the product to the consumer for p per unit. Finally, the manufacturer paid back the bank loans at the end of the sale period. Figure 1 depicts this model. Since the default situation and production costs of the manufacturer were not considered, the manufacturer profits were given by:
M = w Q ( e 0 Q α β n E p e E ) p e ( 1 + r ) β n E p e
where the first term indicates the product wholesale income of the manufacturer, the second term denotes the benefits/costs of carbon trading and the third term can be broken down into the amount of investment from the manufacturer in carbon emissions reduction technologies and the interest of the carbon quota pledge financing.
The profit function for the retailer was given by:
R = ( p w ) Q
We considered three supply chain models in different power structures: a balanced power structure model, namely the Nash equilibrium, and imbalanced power structures, namely the retailer-led and manufacturer-led Stackelberg models. In the balanced power structure, the manufacturer and retailer made decisions simultaneously. In the imbalanced power structures, we used a backward induction method to solve the problem. Within the supply chain, the follower reacted according to the decisions of the leader and the leader made decisions according to the reaction functions of the follower.

4.1. The Nash (N) Model

Under the Nash equilibrium power structure, the manufacturer and the retailer simultaneously determined their wholesale price w , carbon emissions ratio n and profit margin δ , where δ = p w .
Proposition 1.
When 2 b ( p e + η w e 0 η p e ) α η 2 β n E p e > 0 , in the Nash power structure, the optimal decision of the manufacturer is given by:
w N = p e α 2 η ( 1 e o η ) + 2 ( a + 2 b e 0 p e ) ( 1 + r ) α 2 η 2 + 6 b ( 1 + r )
n N = α 2 ( a η + 3 b p e b η e 0 p e ) 2 β E p e ( α 2 η 2 + 6 b ( 1 + r ) ) 2
As p = w + δ , the optimal decision of the retailer is given by:
p N = p e α 2 η ( 2 e o η ) + 2 ( 2 a + b e 0 p e ) ( 1 + r ) α 2 η 2 + 6 b ( 1 + r )
When e = α β n E p e , the optimal carbon emissions reduction level for the equilibrium state is given by:
e N = α 2 a η + 3 b p e b e 0 η p e 2 α 2 η 2 + 6 b + 6 b r 2
The proofs of Proposition 1 and the subsequent propositions are given in “Appendix A”.
Theorem 1.
In the Nash (N) model, the equilibrium profits of the supply chain members are given by:
Π M N = p e E e 0 Ψ 3 + α 2 Ψ 2 Ψ 1 + Ψ 3 Ψ 4 Ψ 1 α 2 r + 1 Ψ 2 2 Ψ 1 2
Π R N = Ψ 3 η p e α 2 + 2 a + 2 a r 2 b e 0 p e 2 b e 0 p e r Ψ 1
where:
Ψ 1 = α 2 η 2 + 6 b + 6 b r Ψ 2 = a η + 3 b p e b e 0 η p e Ψ 3 = a + α 2 η Ψ 2 Ψ 1 b p e α 2 η 2 e 0 η + 2 1 + r 2 a + b e 0 p e Ψ 1 Ψ 4 = p e α 2 η 1 e 0 η + 2 1 + r a + 2 b e 0 p e

4.2. The Retailer-Led Stackelberg (R) Model

In the retailer-led supply chain, the retailer adopted the profit margin pricing method [47]. The retail price was determined by the profit margin of the retailer δ and the wholesale price that was set by the manufacturer w , i.e., p = w + δ [48]. In the Stackelberg model, we used backward induction to solve the problem. The retailer first determined its profit margin δ according to the response function of the manufacturer and then the manufacturer determined its wholesale price w and the carbon emissions quota ratio n that was to be pledged.
Proposition 2.
When 2 b ( p e + η w e 0 η p e ) α η 2 β n E p e > 0 and as p = w + δ , in the retailer-led Stackelberg model, the optimal decision of the retailer is given by:
p R = p e α 4 η 3 + 2 1 + r 3 p e α 2 b η e 0 p e α 2 b η 2 a α 2 η 2 + 4 1 + r 2 e 0 p e b 2 + 3 a b 4 b r + 1 α 2 η 2 + 4 b + 4 b r
The optimal decision of the manufacturer is given by:
w R = 2 e 0 p e α 2 η 2 + p e α 2 η + 2 a + 2 a r + 6 b e 0 p e + 6 b e 0 p e r 2 α 2 η 2 + 8 b + 8 b r
n R = α 2 2 a η + 8 b p e α 2 η 2 p e + 2 a η r + 8 b p e r 2 b e 0 η p e 2 b e 0 η p e r 2 16 E β p e r + 1 2 α 2 η 2 + 4 b + 4 b r 2
Using e = α β n E p e , the optimal carbon emissions reduction level for the equilibrium state is given by:
e R = α 2 2 a η + 8 b p e α 2 η 2 p e + 2 a η r + 8 b p e r 2 b e 0 η p e 2 b e 0 η p e r 2 4 r + 1 α 2 η 2 + 4 b + 4 b r 2
Theorem 2.
In the retailer-led Stackelberg (R) model, the equilibrium profits of the supply chain members are given by:
Π R R = Ψ 5 η p e α 2 + 2 a + 2 a r 2 b e 0 p e 2 b e 0 p e r 16 b r + 1
Π M R = 4 4 E p e + α p e Ψ 6 e 0 p e Ψ 5 Ψ 8 + 2 Ψ 5 p e α 2 η 1 2 e 0 η + 2 1 + r a + 3 b e 0 p e Ψ 6 2 Ψ 8 r + 1 16 Ψ 8
where:
Ψ 5 = p e α 4 η 3 + Ψ 8 r + 1 4 a α η Ψ 6 2 1 + r 3 p e α 2 b η e 0 p e α 2 b η 2 a α 2 η 2 4 1 + r 2 e 0 p e b 2 + 3 a b Ψ 8 r + 1 Ψ 6 = Ψ 7 Ψ 8 2 r + 1 2 Ψ 7 = α 2 2 1 + r a η + 4 b p e b e 0 η p e α 2 η 2 p e 2 Ψ 8 = α 2 η 2 + 4 b + 4 b r

4.3. The Manufacturer-Led Stackelberg (M) Model

In the manufacturer-led supply chain, the manufacturer first decided its wholesale price and the carbon emissions quota ratio that was to be pledged according to the optimal response function and then the retailer decided its retail price according to the decision of the manufacturer. The backward induction method was also used to solve this problem.
Proposition 3.
When 8 b β n E p e ( 2 p e + η w e 0 η p e ) α 2 η 2 > 0 , in the manufacturer-led Stackelberg model, the optimal decision of the manufacturer is given by:
w M = p e α 2 η ( 2 e o η ) + 4 ( a + b e 0 p e ) ( 1 + r ) α 2 η 2 + 8 b ( 1 + r )
n M = α 2 ( a η + 4 b p e b η e 0 p e ) 2 β E p e ( α 2 η 2 + 8 b ( 1 + r ) ) 2
The optimal decision of the retailer is given by:
p M = p e α 2 η ( 3 e o η ) + 2 ( 3 a + b e 0 p e ) ( 1 + r ) α 2 η 2 + 8 b ( 1 + r )
Using e = α β n E p e , the optimal carbon emissions reduction level for the equilibrium state is given by:
e M = α 2 a η + 4 b p e b e 0 η p e 2 α 2 η 2 + 8 b + 8 b r 2
Theorem 3.
In the manufacturer-led Stackelberg (M) model, the equilibrium profits of the supply chain members are given by:
Π M M = p e E e 0 Ψ 11 + α Ψ 10 + Ψ 11 Ψ 9 α 2 η 2 + 8 b + 8 b r α 2 r + 1 a η + 4 b p e b e 0 η p e 2 α 2 η 2 + 8 b + 8 b r 2
Π R M = a + α η Ψ 10 α 2 η 2 + 8 b + 8 b r b Ψ 9 2 4 b α 2 η 2 + 8 b + 8 b r 2
where:
Ψ 9 = p e α 2 η 2 e 0 η + 4 1 + r a + b e 0 p e Ψ 10 = α 2 a η + 4 b p e b e 0 η p e 2 α 2 η 2 + 8 b + 8 b r 2 Ψ 11 = a + α η Ψ 12 α 2 η 2 + 8 b + 8 b r b Ψ 11 2 α 2 η 2 + 8 b + 8 b r

5. Numerical Analysis

In this section, we present the results from our numerical analysis on the above models, which explored how different power structures affected carbon emissions reduction levels, pricing, the pledge rates of carbon emissions rights and the profits of supply chain members. Since it was difficult to collect various production and operation data from the correct company, we used the following simulation datasets to further analyze the above models:
S e t 1 :   a = 500 ; b = 1 ; E = 400 ; e 0 = 2 ; β = 0.8 ; r = 0.04 ; η = 0.5 ; p e = 40 ; α = 1.2 . S e t 2 :   a = 500 ; b = 1 ; E = 400 ; e 0 = 2 ; β = 0.8 ; r = 0.04 ; η = 0.5 ; p e = 40 ; α = 1.5 . S e t 3 :   a = 500 ; b = 1 ; E = 400 ; e 0 = 2 ; β = 0.8 ; r = 0.04 ; η = 0.5 ; p e = 40 ; α = 1.8 . S e t 4 :   a = 500 ; b = 1 ; E = 400 ; e 0 = 2 ; β = 0.8 ; r = 0.04 ; η = 0.5 ; p e = 50 ; α = 1.8 . S e t 5 :   a = 500 ; b = 1 ; E = 400 ; e 0 = 2 ; β = 0.8 ; r = 0.04 ; η = 0.5 ; p e = 60 ; α = 1.8 .
In the above datasets, Set 3 was used as the baseline. Sets 1–3 represented the situation in which the conversion coefficient of the investment in carbon emissions reduction technologies was α = 1.2 , α = 1.5 , α = 1.8 . According to the Report on China’s Carbon Price in 2021, the carbon price fluctuated between 40–60 from the opening of China’s national carbon market on July 16 2021 to the end of the first implementation cycle on 31 December 2021 (http://www.tanpaifang.com/tanguwen/2022/0312/83391.html, accessed on 4 June 2022). Therefore, Sets 3–5 represented the influence of carbon price fluctuation on the optimal solution and the carbon price was 40, 50 and 60, respectively. We used MATLAB to obtain the optimal solutions to Sets 1–5, as shown in Table 3.
It can be seen from Table 3 that the total profits of the supply chain in the N power structure were always greater than those in the M and R power structures, i.e., when a power imbalance occurred in the supply chain, the economic benefits for the supply chain declined. This result occurred because the supply chain members only pursued the maximization of their interests in the Nash model. The retailer lowered retail prices to make more profits. Moreover, the manufacturer hoped to improve its carbon emissions reduction level in order to meet the low-carbon preferences of the consumers [17]. Therefore, the manufacturer chose to pledge more carbon emissions rights to obtain the funds that were needed for its investments in carbon emissions reduction technologies, thus increasing their carbon emissions reduction and ultimately increasing the profits of the whole supply chain.
In the manufacturer-led supply chain, the manufacturer set the largest wholesale price so the profits were greater than those in the other two power structures. This was because in the M power structure, the manufacturer could make decisions based on the response of the retailer. To increase its profits and reduce its financing costs, the manufacturer raised the wholesale prices and reduced the pledge rates of its carbon emissions rights. Therefore, the carbon emissions reduction level of the whole supply chain also decreased. In addition, the high wholesale prices led to the retailer raising its retail prices, which in turn led to a sharp drop in market demand. Therefore, the profit margins of the retailer and market demand for the products declined and the profits of the retailer in the M power structure were lower than those in the other two power structures.
In the retailer-led supply chain, due to the imbalanced power structure, the retailer forced the manufacturer to lower the wholesale price, thus increasing the profit margin of the retailer. As the wholesale price was too low, the manufacturer lost the motivation to reduce its carbon emissions. Thus, the manufacturer pledged fewer carbon emissions rights for financing and the level of carbon emissions reduction within the supply chain decreased. Therefore, in the R power structure, the profits of the retailer increased but the profits of the manufacturer decreased. Compared to the M power structure, in the R power structure, the retailer did not excessively raise retail prices, which caused the market demand to plummet. As the manufacturer had no competitive advantage in terms of pricing, it pledged more carbon emissions rights to improve the efficiency of the supply chain. Therefore, the total benefit of the supply chain in the R power structure was higher than that in the M power structure.
From Table 3 and the above analysis, we concluded the following regarding carbon emissions reduction, pricing, the pledge rates of carbon emissions rights and the profits of supply chain: (1) although the total profits of the supply chain reached the highest levels in the Nash model, the profits of the manufacturer and retailer only reached the maximum values in the respective supply chain in which they were leaders; (2) the supply chain member that was the leader set prices in their own favor, i.e., the wholesale price that was set by the manufacturer was the largest in the manufacturer-led supply chain but the profit margin of the retailer was the largest in the retailer-led supply chain; (3) the pledge rate of the manufacturer for the carbon emissions rights was the highest in the N power structure and the lowest in the M power structure, which meant that the carbon emissions reduction level of the supply chain in the N power structure was always the highest while it was always low in the M power structure.

6. Sensitivity Analysis

In this section, we discuss the sensitivity of some key parameters in the investigated models in order to study the influence of these key parameters on the optimal supply chain decisions, supply chain profits and supply chain carbon emissions reduction levels in different power structure models. To facilitate the study of the sensitivity of specific parameters, we only changed the values of the parameters that were under consideration and the values of the other parameters remained unchanged.
We used Set 3 as a benchmark:
S e t 3 :   a = 500 ; b = 1 ; E = 400 ; e 0 = 2 ; β = 0.8 ; r = 0.04 ; η = 0.5 ; p e = 40 ; α = 1.8 .

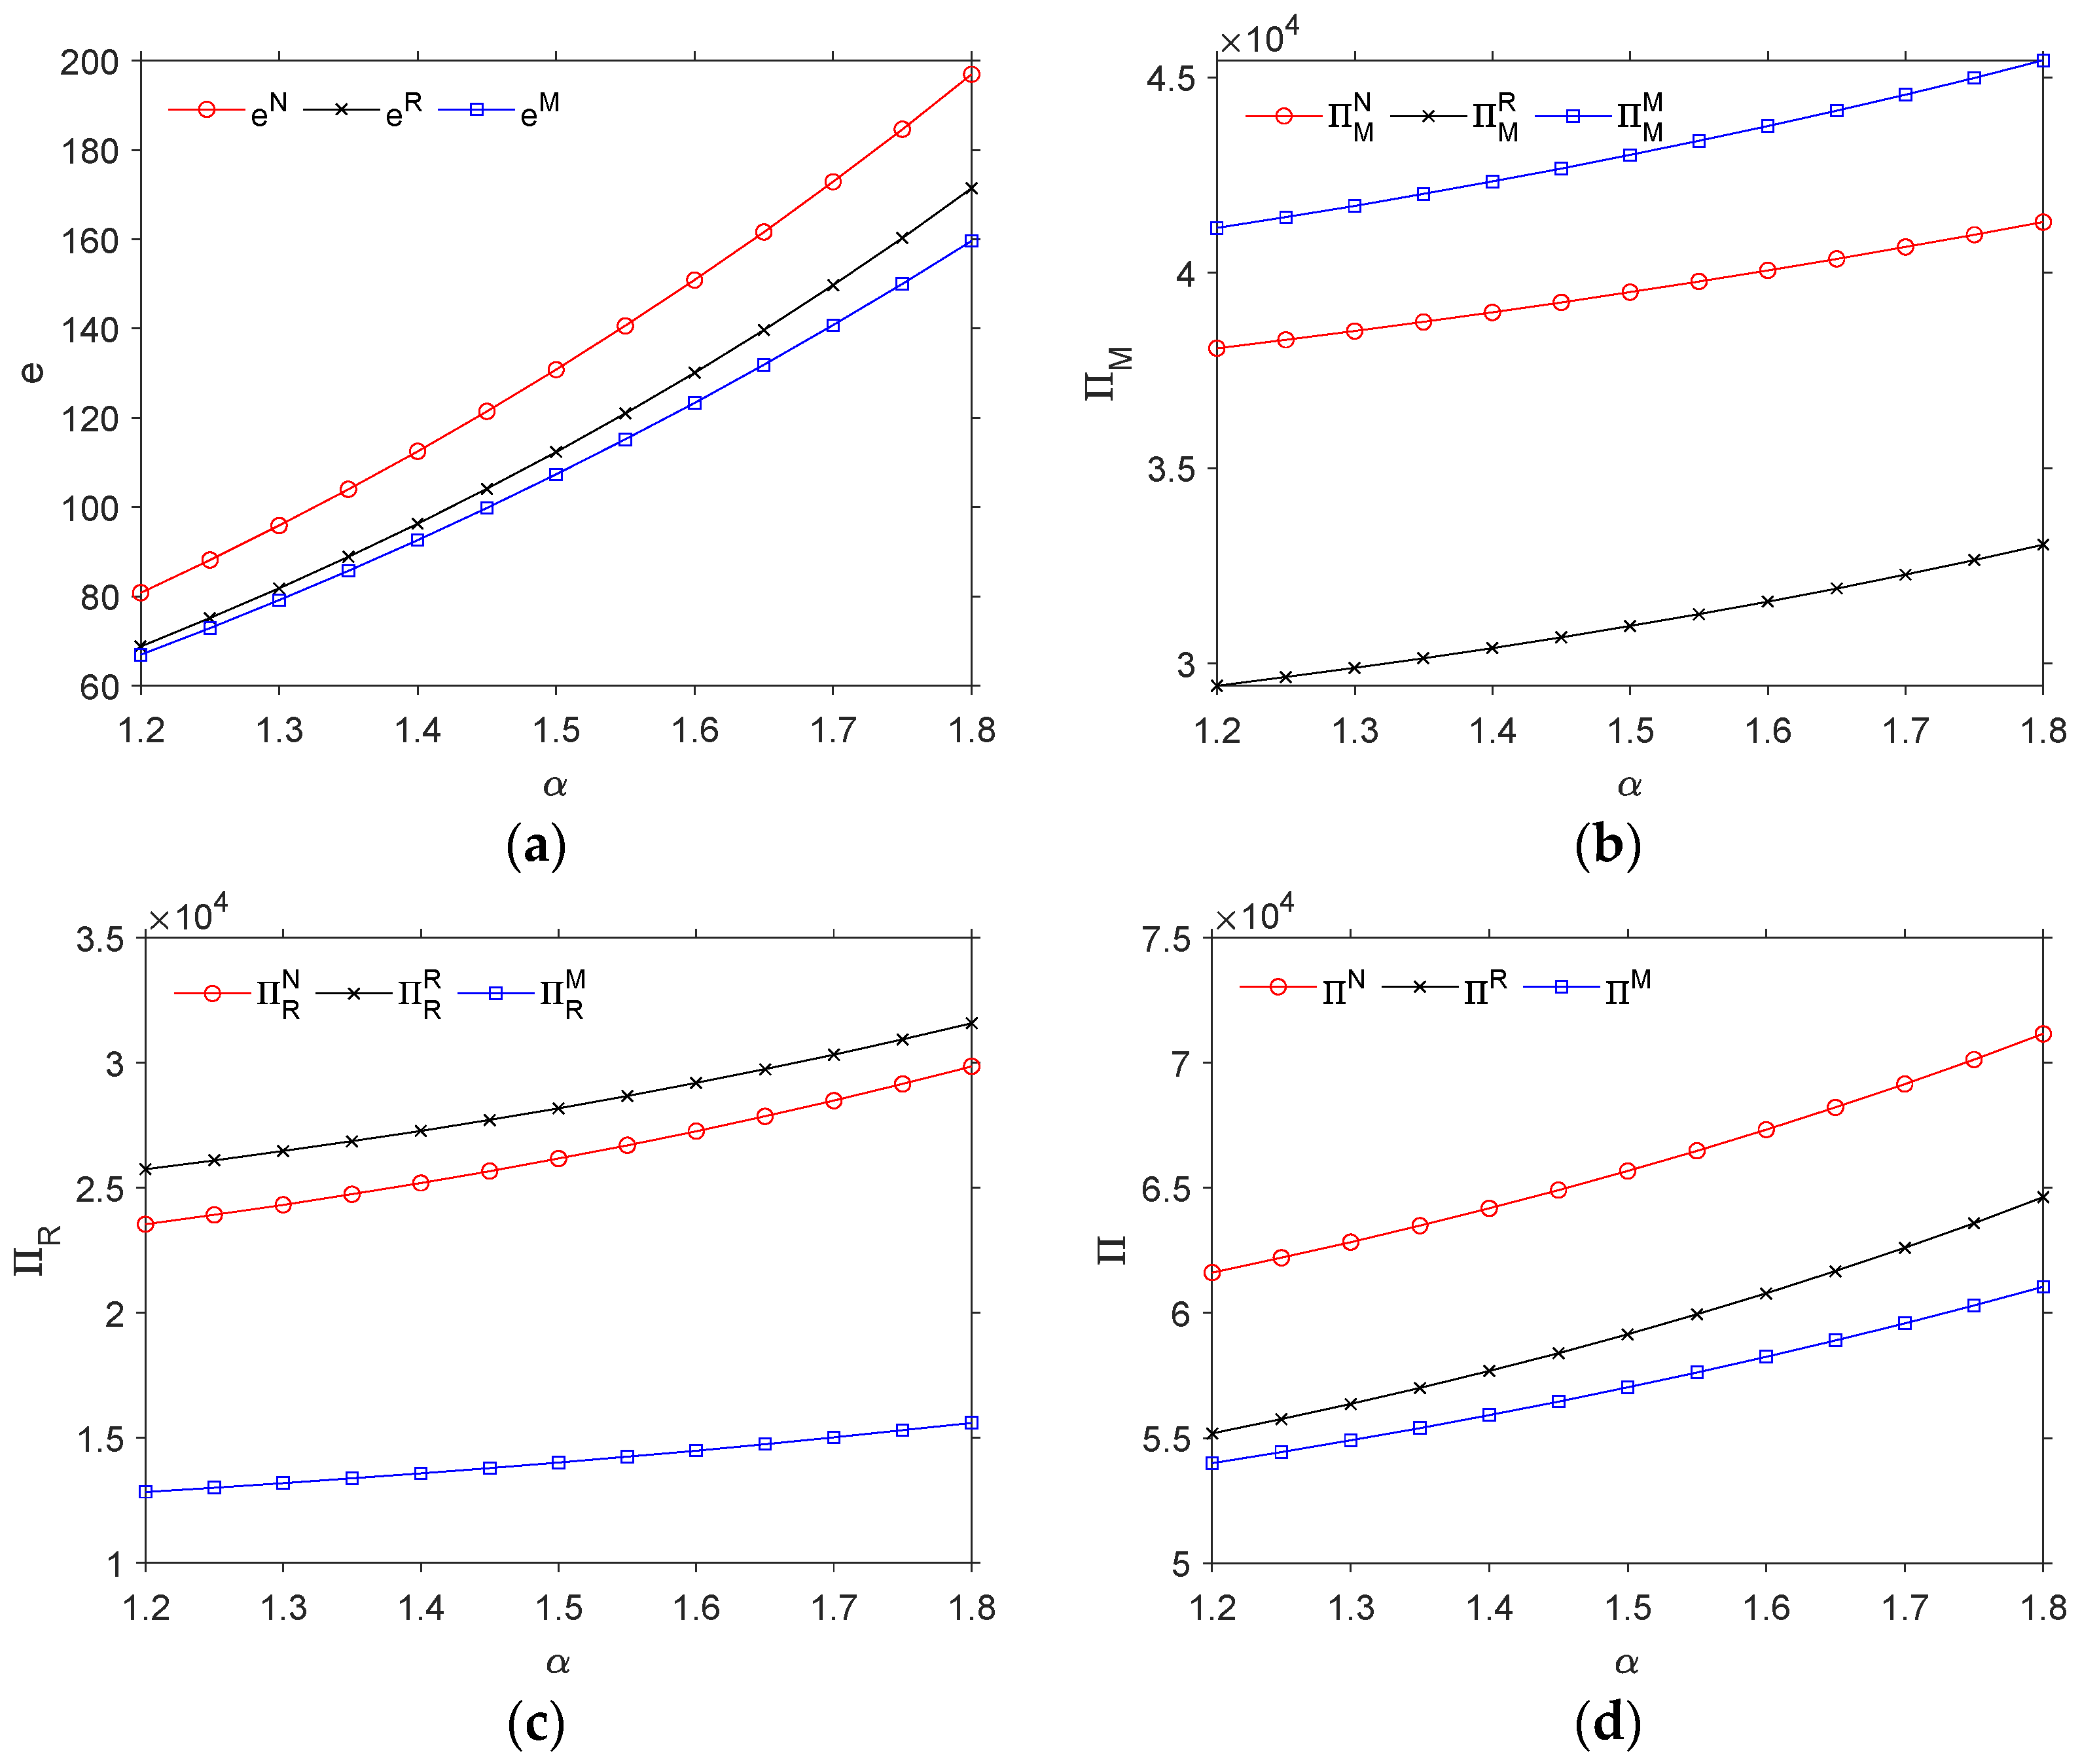
6.1. Impact of the Conversion Coefficient of Investment in Carbon Emissions Reduction Technologies

Figure 2 shows the influence of the conversion coefficient of the investment in carbon emissions reduction technologies on the carbon emissions reduction levels and profits of the supply chain.
In Figure 2, it can be seen that the carbon emissions reduction levels in all of the power structures increased significantly with the increase in the conversion coefficient of the investment in carbon emissions reduction technologies and that the profits of all members of the supply chain also increased. This was because the increase in the conversion coefficient of the investment in carbon emissions reduction technologies represented the increase in carbon emissions reduction levels that was produced by that investment [45]. Combined with the results in Table 3, it is easy to see that an increase in the conversion coefficient of the investment in carbon emissions reduction technologies made the manufacturer pledge more carbon emissions rights for financing. Meanwhile, due to the increase in technology investments and the greenness of products, the prices of products that were set by the supply chain members also increased. In addition, the market demand increased due to the rapid growth of the carbon emissions reduction level and that sudden increase in market demand exceeded the decrease in market demand that was caused by the increase in retail price. Therefore, the profits of the supply chain members increased.

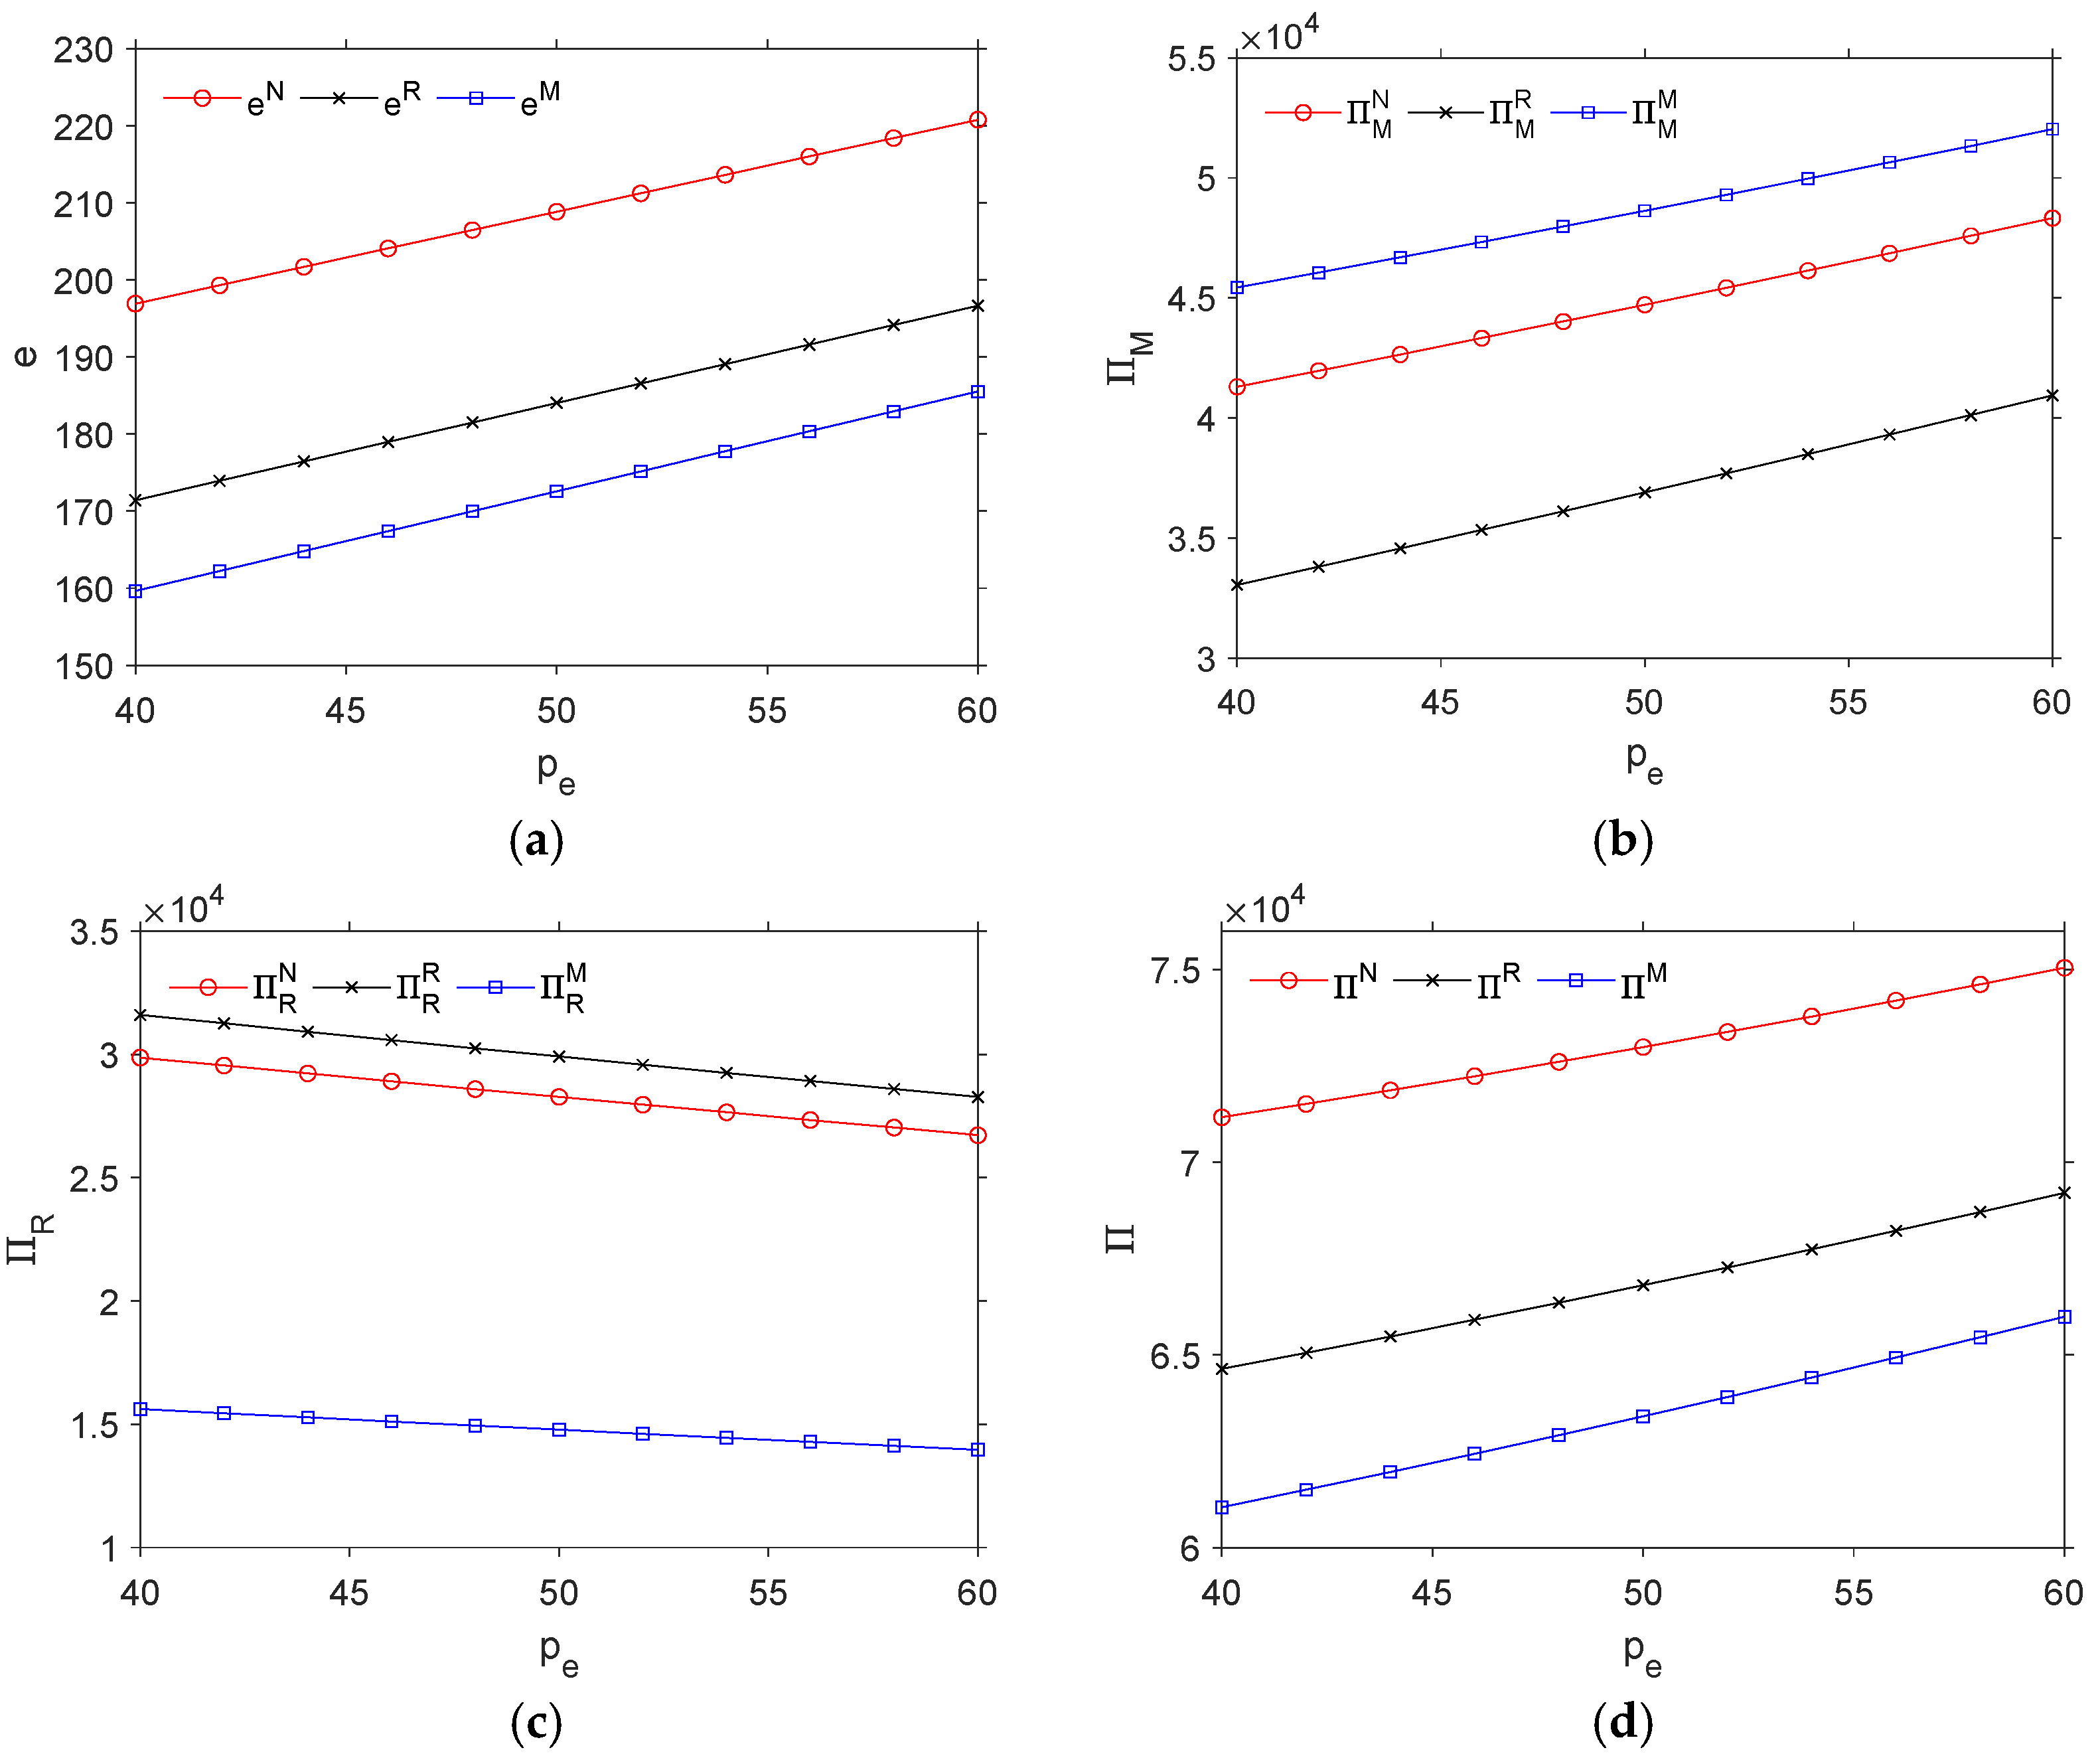
6.2. Impact of Carbon Trading Prices

Figure 3 shows the influence of carbon trading prices on the carbon emissions reduction levels and profits of the supply chain.
When considering the fluctuations in carbon trading prices, we found that an increase in carbon trading price in the different power structures was beneficial for both the manufacturer and the supply chain as a whole but was disadvantageous for the retailer. The reason behind this result was that when the carbon trading price increased, the manufacturer could obtain the same funds as before by pledging fewer carbon quotas, thus increasing its level of carbon emissions reduction while reducing its financing costs. In addition, although the pricing by both the manufacturer and the retailer increased with the increase in carbon trading price, the retail price could not be significantly increased due to the constraints of the market demand, which led to a decline in the profit margins and profits of the retailer.

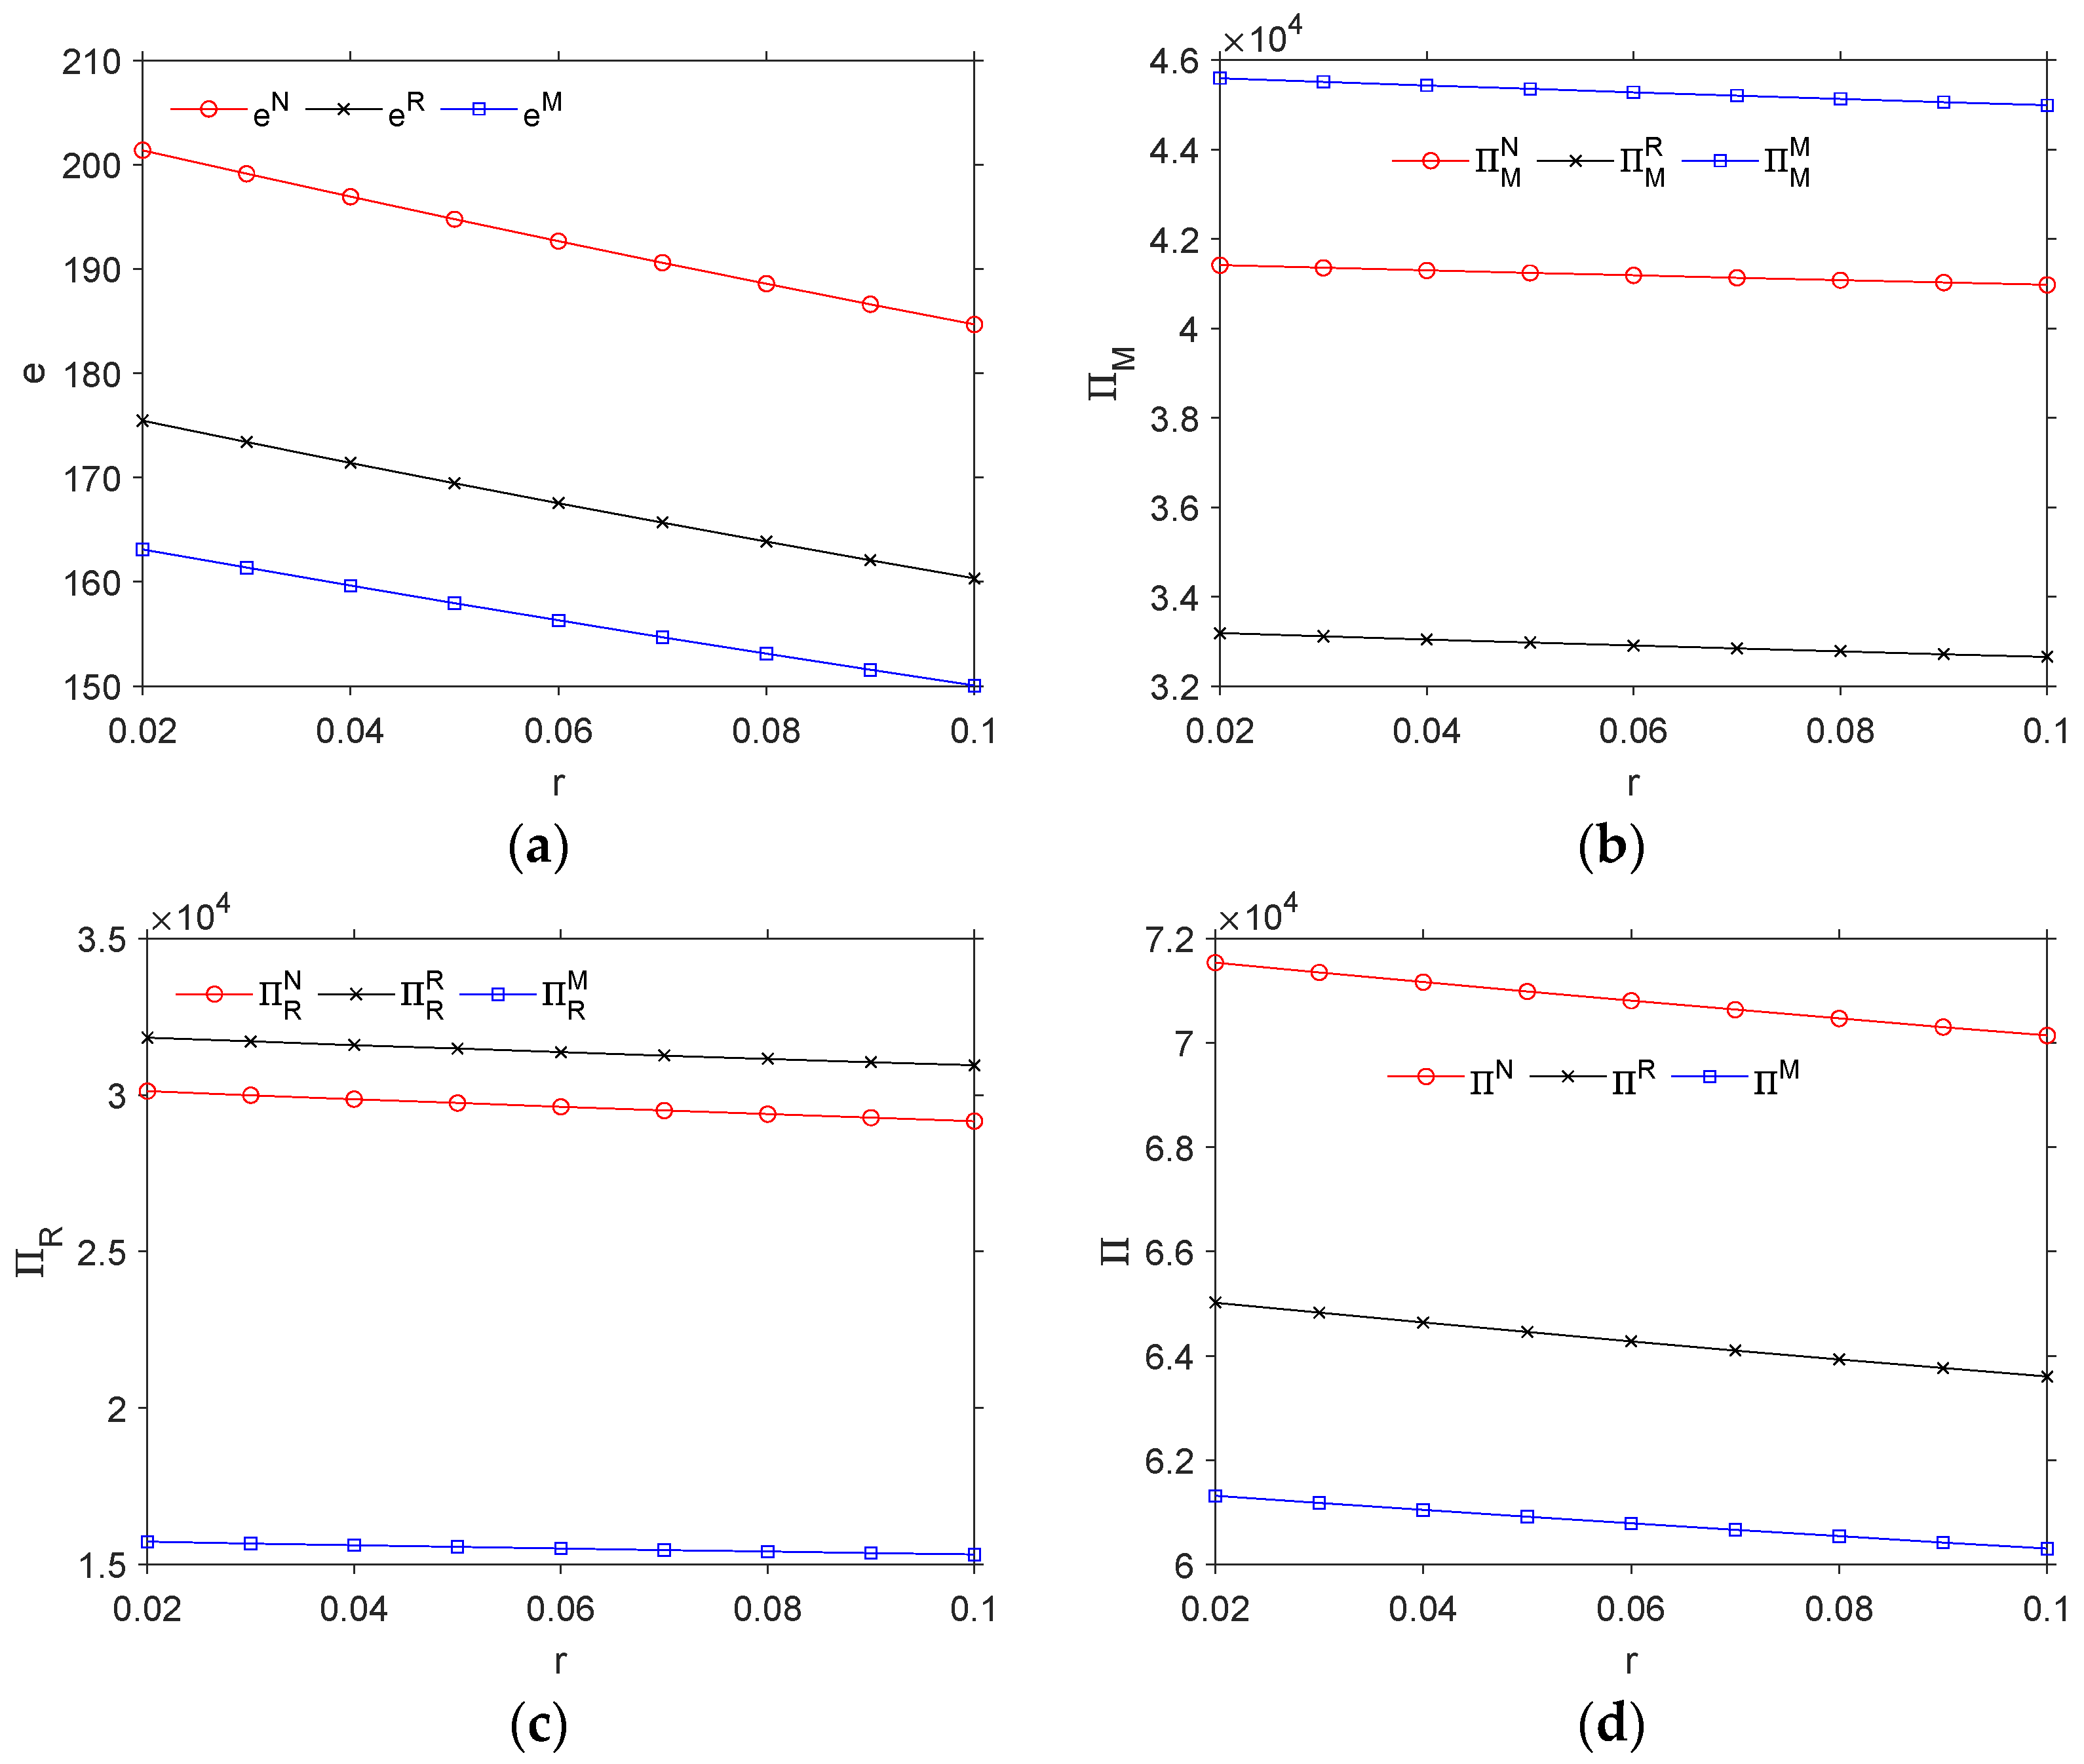
6.3. Impact of Bank Interest Rates

Table 4 shows the sensitivity of the optimal decisions of the supply chain with respect to the bank interest rates.
Figure 4 shows the influence of bank interest rates on the carbon emissions reduction levels and profits of the supply chain.
As an important factor that influenced the financing costs of the manufacturer, the bank interest rates for carbon pledge financing also affected the decision-making and profits of the supply chain. As can be seen from Table 4 and Figure 4, in all supply chain power structures, the manufacturer pledged fewer carbon emissions rights for financing with the increase in bank interest rates, thus causing the carbon emissions reduction level of the supply chain to drop significantly. This was because the increase in bank interest rates increased the financing costs for the manufacturer, thus reducing the willingness of the manufacturer to reduce its carbon emissions via financing. In addition, consumers with low-carbon preferences were less willing to buy products from the supply chain, which in turn forced the manufacturer and retailer to lower their prices. As a result, the profits of the supply chain decreased with the increase in bank interest rates.

7. Conclusions

Due to the irreversible harm that is caused to the environment by carbon emissions, the carbon emissions reduction behavior of supply chains has become a serious concern for society. The emergence of consumer preferences for low-carbon products has also made enterprises pay more attention to their carbon emissions reduction levels. However, the capital constraints of manufacturers and the power structures of supply chain members also restrict the carbon emissions reduction behavior. Therefore, we considered a two-echelon low-carbon supply chain, which consisted of a capital-constrained manufacturer and a retailer. The manufacturer invested in carbon emissions reduction technologies using carbon quota pledge financing. We developed three different supply chain power structures to explore the effects of carbon pledge financing mechanisms and supply chain power structures on supply chain decisions and profits: the Nash model and retailer-led and manufacturer-led Stackelberg models. Using numerical and sensitivity analyses, the following insights were obtained. (1) The power structure of the supply chain affected the decision-making and profits of the supply chain. In the N power structure, the manufacturer pledged the most carbon rights to finance its emissions reduction and, in this case, the supply chain carbon emissions reduction levels and profits were always the highest. (2) The profits of the manufacturer and retailer reached the maximum values in the M and R power structures, respectively. The M power structure had a negative impact on the profits and carbon emissions reduction levels of the supply chain. (3) The carbon emissions reduction levels and profits of the manufacturer and the retailer all increased with the increase in the conversion coefficient of the investment in carbon emissions reduction technologies. (4) Higher carbon trading prices not only increased the economic benefits for the supply chain but also decreased the carbon emissions reduction levels of the supply chain. However, higher carbon trading prices harmed the interests of the retailer. (5) As the interest rates for carbon emissions right pledge financing increased, the costs of financing for the manufacturer also increased. As a result, the profits and carbon emissions reduction levels of the supply chain were reduced.
In addition, our research yielded some management implications. First, when possible, governments should introduce regulations to ensure the balance of power within supply chains as supply chains could obtain higher economic and environmental benefits in the N power structure. Second, in imbalanced power structures of supply chains, retailers should become the leaders in low-carbon supply chains to obtain higher profits and carbon emissions reduction levels. Third, in order to ensure the smooth implementation of carbon emissions reduction strategies and maintain environmental benefits, banks should provide more favorable interest rates for carbon quota pledge financing. Fourth, because higher conversion coefficients of investments in carbon emissions reduction technologies could produce higher carbon emissions reduction rates, manufacturers should conduct research in advance when investing in carbon emissions reduction technologies to enhance the effectiveness of their investments. Finally, although increases carbon trading prices harm the interests of retailers, carbon trading prices still need to be steadily increased in the long run to increase the sustainability of supply chains.
Although this study integrated power structures and carbon pledge financing for low-carbon supply chains, it still had some limitations. First, we only considered the carbon emissions reduction behavior of the manufacturer in our models, but with the development of supply chain sustainability, many retailers could also participate in the carbon emissions reduction strategies. Future studies should take into account the efforts of retailers to reduce their carbon emissions. In this direction, manufacturers should invest in carbon emissions reduction technologies and retailers should invest in the promotion of low-carbon products within supply chains. Second, we did not consider solutions for the loss of one party’s interests that was caused by the power imbalance. Future research should be extended on this basis to design supply chain contracts that can coordinate the interests of all parties, such as cost sharing or revenue sharing. Finally, our study only considered external financing modes, i.e., carbon emissions right pledge financing, and did not compare external modes to internal financing modes for supply chains. Therefore, based on this study, we could only compare advance payment financing to carbon emissions right pledge financing to explore the advantages, disadvantages and application scopes of the different financing modes, thus providing more targeted financing strategies for low-carbon supply chains.

Author Contributions

Conceptualization, J.G. (Jiani Gao); Data curation, J.G. (Jiani Gao); Formal analysis, J.G. (Jiani Gao); Methodology, J.G. (Jiani Gao); Software, J.G. (Jiani Gao) and J.W.; Supervision, C.L.; Writing—original draft, J.G. (Jiani Gao); Writing—review & editing, J.G. (Jiaqi Guo). All authors have read and agreed to the published version of the manuscript.

Funding

This research received no external funding.

Institutional Review Board Statement

Not applicable.

Informed Consent Statement

Not applicable.

Data Availability Statement

Not applicable.

Conflicts of Interest

The authors declare no conflict of interest.

Appendix A

Proof of Proposition 1.
The profit function of the manufacturer is given by:
M = w Q ( e 0 Q α β n E p e E ) p e ( 1 + r ) β n E p e
The profit function of the retailer is given by:
R = δ Q
Using 2 R δ 2 = 2 b < 0 , it can be seen that the profits of the retailer are represented by the concave function of the profit margin of the retailer.
The corresponding Hessian matrix of the profit function of the manufacturer is given by:
H = 2 M w 2 2 M w n 2 M n w 2 M n 2 = 2 b Ψ 1 Ψ 1 E 2 α β 2 p e 2 ( p e + η w e 0 η p e ) Ψ 2
where Ψ 1 = α β η E p e 2 β n E p e , Ψ 2 = 4 ( β n E p e ) 3 / 2 .
Now, the leading principal minors are M 1 = 2 b < 0 and H = α β 2 n E 2 p e 2 ( 2 b ( p e + η w e 0 η p e ) α η 2 β n E p e ) n Ψ 2 > 0 when 2 b ( p e + η w e 0 η p e ) α η 2 β n E p e > 0 . Thus, the Hesse matrix is a negative definite when 2 b ( p e + η w e 0 η p e ) α η 2 β n E p e > 0 .
Then, the optimal solution for the decision variables can be obtained using the first-order conditions for optimality, i.e.:
R δ = 0 , M w = 0 , M n = 0 w N = p e α 2 η ( 1 e o η ) + 2 ( a + 2 b e 0 p e ) ( 1 + r ) α 2 η 2 + 6 b ( 1 + r ) n N = α 2 ( a η + 3 b p e b η e 0 p e ) 2 β E p e ( α 2 η 2 + 6 b ( 1 + r ) ) 2 δ N = p e α 2 η + 2 ( a b e 0 p e ) ( 1 + r ) α 2 η 2 + 6 b ( 1 + r )
As p = w + δ , the optimal decision of the retailer is given by:
p N = p e α 2 η ( 2 e o η ) + 2 ( 2 a + b e 0 p e ) ( 1 + r ) α 2 η 2 + 6 b ( 1 + r )
Proof of Proposition 2.
In the retailer-led supply chain, we used backward induction to solve the problem and the retailer used profit margin pricing.
First, the Hessian matrix of the profit function of the manufacturer is given by:
H = 2 M w 2 2 M w n 2 M n w 2 M n 2 = 2 b Ψ 1 Ψ 1 E 2 α β 2 p e 2 ( p e + η w e 0 η p e ) Ψ 2
As with the proof of Proposition 1, the Hessian matrix is a negative definite when 2 b ( p e + η w e 0 η p e ) α η 2 β n E p e > 0 .
By letting M w = 0 , M n = 0 , the optimal response function of the manufacturer is given by:
w ( δ ) = p e α 2 η ( 1 e o η ) + 2 ( a + b e 0 p e b δ ) ( 1 + r ) α 2 η 2 + 4 b ( 1 + r ) n ( δ ) = ( a α η + 2 α b p e α b δ η α b η e 0 p e ) 2 β E p e ( α 2 η 2 + 4 b ( 1 + r ) ) 2
By substituting the above value of w ( δ ) ,   n ( δ ) into the profits of the retailer and letting R δ = 0 , the following can be obtained:
δ R * = σ 2 2 α 2 η 2 + 4 b + 4 b r σ 2 4 b r + 1 σ 1 4 b α 2 η 2 + b + b r σ 1 2 b α 2 η 2 + 2 b + 2 b r
Since there are four stagnation points, we obtain δ R , which maximizes the profits of the retailer by comparing the profits of the retailer at the four stagnation points. Therefore, δ R is the optimal profit margin of the retailer in the R power structure:
δ R = p e α 2 η + 2 ( a b e 0 p e ) ( 1 + r ) 4 b ( 1 + r )
By substituting the above value of δ R into w ( δ ) ,   n ( δ ) , the optimal decision of the manufacturer is given by:
w R = 2 e 0 p e α 2 η 2 + p e α 2 η + 2 a + 2 a r + 6 b e 0 p e + 6 b e 0 p e r 2 α 2 η 2 + 8 b + 8 b r n R = α 2 2 a η + 8 b p e α 2 η 2 p e + 2 a η r + 8 b p e r 2 b e 0 η p e 2 b e 0 η p e r 2 16 E β p e r + 1 2 α 2 η 2 + 4 b + 4 b r 2
As p = w + δ , the optimal decision of the retailer is given by:
p R = p e α 4 η 3 + 2 1 + r 3 p e α 2 b η e 0 p e α 2 b η 2 a α 2 η 2 + 4 1 + r 2 e 0 p e b 2 + 3 a b 4 b r + 1 α 2 η 2 + 4 b + 4 b r
Proof of Proposition 3.
In the manufacturer-led supply chain, we again adopted backward induction to solve the model.
Using r p = 0 , the optimal response function of the retailer is as follows:
p ( w , n ) = a + b w + α η β n E p e 2 b
By substituting the above value of p ( w , n ) into the profits of the manufacturer, the Hessian matrix of the profit function of the manufacturer is given by:
H = 2 M w 2 2 M w n 2 M n w 2 M n 2 = b Ψ 1 2 Ψ 1 2 E 2 α β 2 p e 2 ( 2 p e + η w e 0 η p e ) 2 Ψ 2
Now, the leading principal minors are M 1 = b < 0 and H = α β E p e ( 8 b β n E p e ( 2 p e + η w e 0 η p e ) α 2 η 2 β n E p e ) 16 n Ψ 2 > 0 when 8 b β n E p e ( 2 p e + η w e 0 η p e ) α 2 η 2 > 0 . Thus, the Hessian matrix is a negative definite when 8 b β n E p e ( 2 p e + η w e 0 η p e ) α 2 η 2 > 0 .
Then, the optimal solution for the manufacturer can be obtained using the first-order conditions for optimality, i.e.: M w = 0 ,   M n = 0 .The optimal decision of the manufacturer is given by:
w M = p e α 2 η ( 2 e o η ) + 4 ( a + b e 0 p e ) ( 1 + r ) α 2 η 2 + 8 b ( 1 + r ) n M = α 2 ( a η + 4 b p e b η e 0 p e ) 2 β E p e ( α 2 η 2 + 8 b ( 1 + r ) ) 2
By substituting the above value of w M ,   n M into p ( w , n ) , the optimal decision of the retailer is given by:
p M = p e α 2 η ( 3 e o η ) + 2 ( 3 a + b e 0 p e ) ( 1 + r ) α 2 η 2 + 8 b ( 1 + r )

References

  1. Wang, J.; Zhang, Q.; Lu, X.; Ma, R.; Yu, B.; Gao, H. Emission Reduction and Coordination of a Dynamic Supply Chain with Green Reputation. Oper. Res. 2021, 1–44. [Google Scholar] [CrossRef]
  2. Konstantakopoulos, G.D.; Gayialis, S.P.; Kechagias, E.P. Vehicle Routing Problem and Related Algorithms for Logistics Distribution: A Literature Review and Classification. Oper. Res. 2022, 22, 2033–2062. [Google Scholar] [CrossRef]
  3. Gayialis, S.P.; Kechagias, E.P.; Konstantakopoulos, G.D. A City Logistics System for Freight Transportation: Integrating Information Technology and Operational Research. Oper. Res. 2022, 1–30. [Google Scholar] [CrossRef]
  4. Xu, X.; He, P.; Xu, H.; Zhang, Q. Supply Chain Coordination with Green Technology under Cap-and-Trade Regulation. Int. J. Prod. Econ. 2017, 183, 433–442. [Google Scholar] [CrossRef]
  5. Saberi, S.; Kouhizadeh, M.; Sarkis, J.; Shen, L. Blockchain Technology and Its Relationships to Sustainable Supply Chain Management. Int. J. Prod. Res. 2019, 57, 2117–2135. [Google Scholar] [CrossRef] [Green Version]
  6. Gayialis, S.P.; Kechagias, E.P.; Papadopoulos, G.A.; Masouras, D. A Review and Classification Framework of Traceability Approaches for Identifying Product Supply Chain Counterfeiting. Sustainability 2022, 14, 6666. [Google Scholar] [CrossRef]
  7. Du, S.; Zhu, J.; Jiao, H.; Ye, W. Game-Theoretical Analysis for Supply Chain with Consumer Preference to Low Carbon. Int. J. Prod. Res. 2014, 53, 3753–3768. [Google Scholar] [CrossRef]
  8. Zhang, S.; Wang, C.; Yu, C.; Ren, Y. Governmental Cap Regulation and Manufacturer’s Low Carbon Strategy in a Supply Chain with Different Power Structures. Comput. Ind. Eng. 2019, 134, 27–36. [Google Scholar] [CrossRef]
  9. Almutairi, K.; Hosseini Dehshiri, S.J.; Hosseini Dehshiri, S.S.; Hoa, A.X.; Arockia Dhanraj, J.; Mostafaeipour, A.; Issakhov, A.; Techato, K. Blockchain Technology Application Challenges in Renewable Energy Supply Chain Management. Environ. Sci. Pollut. Res. 2022, 1–18. [Google Scholar] [CrossRef]
  10. An, S.; Li, B.; Song, D.; Chen, X. Green Credit Financing versus Trade Credit Financing in a Supply Chain with Carbon Emission Limits. Eur. J. Oper. Res. 2021, 292, 125–142. [Google Scholar] [CrossRef]
  11. Cao, E.; Yu, M. The Bright Side of Carbon Emission Permits on Supply Chain Financing and Performance. Omega 2019, 88, 24–39. [Google Scholar] [CrossRef]
  12. Qin, J.; Zhao, Y.; Xia, L. Carbon Emission Reduction with Capital Constraint under Greening Financing and Cost Sharing Contract. Int. J. Environ. Res. Public Health 2018, 15, 750. [Google Scholar] [CrossRef] [Green Version]
  13. Edirisinghe, N.C.P.; Bichescu, B.; Shi, X. Equilibrium Analysis of Supply Chain Structures under Power Imbalance. Eur. J. Oper. Res. 2011, 214, 568–578. [Google Scholar] [CrossRef]
  14. Chen, H.; Dong, Z.; Li, G.; He, K. Remanufacturing Process Innovation in Closed-Loop Supply Chain under Cost-Sharing Mechanism and Different Power Structures. Comput. Ind. Eng. 2021, 162, 107743. [Google Scholar] [CrossRef]
  15. Ji, J.; Huang, J. Research on Single/Cooperative Emission Reduction Strategy under Different Power Structures. Environ. Sci. Pollut. Res. 2022, 1–22. [Google Scholar] [CrossRef]
  16. Saavedra, M.R.; Cristiano, C.H.; Francisco, F.G. Sustainable and Renewable Energy Supply Chain: A System Dynamics Overview. Renew. Sustain. Energy Rev. 2018, 82, 247–259. [Google Scholar] [CrossRef]
  17. Xia, L.; Guo, T.; Qin, J.; Yue, X.; Zhu, N. Carbon Emission Reduction and Pricing Policies of a Supply Chain Considering Reciprocal Preferences in Cap-and-Trade System. Ann. Oper. Res. 2018, 268, 149–175. [Google Scholar] [CrossRef]
  18. Ma, S.; He, Y.; Gu, R.; Li, S. Sustainable Supply Chain Management Considering Technology Investments and Government Intervention. Transp. Res. Part E Logist. Transp. Rev. 2021, 149, 102290. [Google Scholar] [CrossRef]
  19. Yang, L.; Zhang, Q.; Ji, J. Pricing and Carbon Emission Reduction Decisions in Supply Chains with Vertical and Horizontal Cooperation. Int. J. Prod. Econ. 2017, 191, 286–297. [Google Scholar] [CrossRef]
  20. Xu, Z.; Pokharel, S.; Elomri, A. An Eco-Friendly Closed-Loop Supply Chain Facing Demand and Carbon Price Uncertainty. Ann. Oper. Res. 2022, 1–27. [Google Scholar] [CrossRef]
  21. Yu, Y.; Zhou, S.; Shi, Y. Information Sharing or Not across the Supply Chain: The Role of Carbon Emission Reduction. Transp. Res. Part E Logist. Transp. Rev. 2020, 137, 101915. [Google Scholar] [CrossRef]
  22. Bai, Q.; Gong, Y.; Jin, M.; Xu, X. Effects of Carbon Emission Reduction on Supply Chain Coordination with Vendor-Managed Deteriorating Product Inventory. Int. J. Prod. Econ. 2019, 208, 83–99. [Google Scholar] [CrossRef]
  23. Daryanto, Y.; Wee, H.M.; Astanti, R.D. Three-Echelon Supply Chain Model Considering Carbon Emission and Item Deterioration. Transp. Res. Part E Logist. Transp. Rev. 2019, 122, 368–383. [Google Scholar] [CrossRef]
  24. Zhang, Y.-J.; Sun, Y.-F.; Huo, B.-F. The Optimal Product Pricing and Carbon Emissions Reduction Profit Allocation of CET-Covered Enterprises in the Cooperative Supply Chain. Ann. Oper. Res. 2021. [Google Scholar] [CrossRef]
  25. Chen, J.; Zhou, Y.W.; Zhong, Y. A Pricing/Ordering Model for a Dyadic Supply Chain with Buyback Guarantee Financing and Fairness Concerns. Int. J. Prod. Res. 2017, 55, 5287–5304. [Google Scholar] [CrossRef]
  26. Ding, W.; Wan, G. Financing and Coordinating the Supply Chain with a Capital-Constrained Supplier under Yield Uncertainty. Int. J. Prod. Econ. 2020, 230, 107813. [Google Scholar] [CrossRef]
  27. Jin, W.; Zhang, Q.; Luo, J. Non-Collaborative and Collaborative Financing in a Bilateral Supply Chain with Capital Constraints. Omega 2019, 88, 210–222. [Google Scholar] [CrossRef]
  28. Fang, L.; Xu, S. Financing Equilibrium in a Green Supply Chain with Capital Constraint. Comput. Ind. Eng. 2020, 143, 106390. [Google Scholar] [CrossRef]
  29. Lu, C.; Zhao, M.; Khan, I.; Uthansakul, P. Financing Strategy of Low-Carbon Supply Chain with Capital Constraint under Cap-and-Trade Regulation. Comput. Mater. Contin. 2021, 66, 437–455. [Google Scholar] [CrossRef]
  30. Cong, J.; Pang, T.; Peng, H. Optimal Strategies for Capital Constrained Low-Carbon Supply Chains under Yield Uncertainty. J. Clean. Prod. 2020, 256, 120339. [Google Scholar] [CrossRef]
  31. Qin, J.; Han, Y.; Wei, G.; Xia, L. The Value of Advance Payment Financing to Carbon Emission Reduction and Production in a Supply Chain with Game Theory Analysis. Int. J. Prod. Res. 2020, 58, 200–219. [Google Scholar] [CrossRef]
  32. Cao, E.; Yu, M. Trade Credit Financing and Coordination for an Emission-Dependent Supply Chain. Comput. Ind. Eng. 2018, 119, 50–62. [Google Scholar] [CrossRef]
  33. Cao, E.; Du, L.; Ruan, J. Financing Preferences and Performance for an Emission-Dependent Supply Chain: Supplier vs. Bank. Int. J. Prod. Econ. 2019, 208, 383–399. [Google Scholar] [CrossRef]
  34. Wang, Y.; Lv, L.; Shen, L.; Tang, R. Manufacturer’s Decision-Making Model under Carbon Emission Permits Repurchase Strategy and Capital Constraints. Int. J. Prod. Res. 2021, 1–19. [Google Scholar] [CrossRef]
  35. Wang, Y.; Wang, F. Effects of the Carbon Credits Buy-Back Policy on Manufacturing/Remanufacturing Decisions of the Capital-Constrained Manufacturer. J. Ind. Manag. Optim. 2021. [Google Scholar] [CrossRef]
  36. Yang, L.; Chen, Y.; Ji, J. Cooperation Modes of Operations and Financing in a Low-Carbon Supply Chain. Sustainability 2018, 10, 821. [Google Scholar] [CrossRef] [Green Version]
  37. Chen, Y.; Chen, Z.; Peng, J. How Does Emission Right-Based Lending Contribute to Sustainable Production and Green Financing? A Modelling Study. Environ. Dev. Sustain. 2021, 23, 13945–13972. [Google Scholar] [CrossRef]
  38. Wang, J.C.; Wang, Y.Y.; Lai, F. Impact of Power Structure on Supply Chain Performance and Consumer Surplus. Int. Trans. Oper. Res. 2019, 26, 1752–1785. [Google Scholar] [CrossRef]
  39. Li, Z.; Xu, Y.; Deng, F.; Liang, X. Impacts of Power Structure on Sustainable Supply Chain Management. Sustainability 2017, 10, 55. [Google Scholar] [CrossRef] [Green Version]
  40. Liu, Y.; Ren, W.; Xu, Q.; Liu, Z.-Y. Decision Analysis of Supply Chains Considering Corporate Social Responsibility and Government Subsidy under Different Channel Power Structures. Ann. Oper. Res. 2021. [Google Scholar] [CrossRef]
  41. Chen, X.; Yang, H.; Wang, X.; Choi, T.M. Optimal Carbon Tax Design for Achieving Low Carbon Supply Chains. Ann. Oper. Res. 2020, 1–28. [Google Scholar] [CrossRef]
  42. Chen, X.; Wang, X.; Chan, H.K. Manufacturer and Retailer Coordination for Environmental and Economic Competitiveness: A Power Perspective. Transp. Res. Part E Logist. Transp. Rev. 2017, 97, 268–281. [Google Scholar] [CrossRef] [Green Version]
  43. Jiang, W.; Liu, M.; Gan, L.; Wang, C. Optimal Pricing, Ordering, and Coordination for Prefabricated Building Supply Chain with Power Structure and Flexible Cap-and-Trade. Mathematics 2021, 9, 2426. [Google Scholar] [CrossRef]
  44. Tang, R.; Yang, L. Impacts of Financing Mechanism and Power Structure on Supply Chains under Cap-and-Trade Regulation. Transp. Res. Part E Logist. Transp. Rev. 2020, 139, 101957. [Google Scholar] [CrossRef]
  45. Wang, M.; Wang, M.; Wang, S. Optimal Investment and Uncertainty on China’s Carbon Emission Abatement. Energy Policy 2012, 41, 871–877. [Google Scholar] [CrossRef]
  46. Mondal, C.; Giri, B.C. Retailers’ Competition and Cooperation in a Closed-Loop Green Supply Chain under Governmental Intervention and Cap-and-Trade Policy. Oper. Res. 2020, 22, 859–894. [Google Scholar] [CrossRef]
  47. Wang, J.C.; Lau, A.H.L.; Lau, H.S. Dollar vs. Percentage Markup Pricing Schemes under a Dominant Retailer. Eur. J. Oper. Res. 2013, 227, 471–482. [Google Scholar] [CrossRef]
  48. Ghosh, D.; Shah, J. A Comparative Analysis of Greening Policies across Supply Chain Structures. Int. J. Prod. Econ. 2012, 135, 568–583. [Google Scholar] [CrossRef]
Figure 1. A graphical representation of the model.
Energies 15 05721 g001
Figure 2. The changes in the supply chain profits (bd) and carbon emissions reduction levels (a) that were caused by α .
Energies 15 05721 g002
Figure 3. The changes in the supply chain profits (bd) and carbon emissions reduction levels (a) that were caused by p e .
Energies 15 05721 g003
Figure 4. The changes in the supply chain profits (bd) and carbon emissions reduction levels (a) that were caused by r .
Energies 15 05721 g004
Table 1. The differences between our model and those from previous studies.
Author(s)Carbon Emissions ReductionPower StructuresCapital ConstraintsFinancing Mode
Carbon Pledge FinancingOther
Du et al. (2015) [7]PP
Ma et al. (2021) [18]P
Fang et al. (2020) [28] P P
Cong et al. (2020) [30]P P P
Cao and Yu (2019) [11]P PP
Chen et al. (2021) [37]P PP
Yang et al. (2018) [36]P PPP
Liu et al. (2021) [40] P
Ji et al. (2022) [15]PP
Tang et al. (2020) [44]PPP P
Our modelPPPP
Table 2. Notations.
Table 2. Notations.
Decision Variables
wProduct wholesale price for the manufacturer, w > 0
pRetail price of the product, p > w
nCarbon quota pledge rate of the manufacturer
Model Parameters
δThe profit margin of the retailer, δ = pw, δ > 0
ηThe sensitivity of consumers to the levels of carbon reduction, η > 0
QMarket demand function of the supply chain
aPotential market demand
bThe sensitivity of consumers to the retail price of products
peUnit carbon trading price, pe > 0
ECarbon cap issued by the government for the manufacturer, E > 0
e0Initial carbon emissions per product, e0 > 0
FLoans obtained by the manufacturer using pledges of carbon quotas
IAmount of investment from the manufacturer in carbon emissions reduction technologies
αConversion coefficient of investment in carbon emissions reduction technologies
eThe carbon emissions reduction level of the manufacturer, e = αI1/2
rBank interest rates
βBank pledge rates
ΠThe total profit function of the supply chain
ΠMThe profit function of the manufacturer
ΠRThe profit function of the retailer
Table 3. The optimal solution in the different power structures.
Power StructureSetwnpeΠMΠRΠ
Nash ModelSet 1233.4690.354386.93980.81638,06823,55361,621
Set 2241.7970.594403.593130.77939,50426,17865,682
Set 3252.8180.935425.635196.90641,29729,86671,163
Set 4268.140.841436.28208.8444,71328,27172,984
Set 5283.4620.784446.925220.77448,32126,72075,041
Retailer-Led Stackelberg ModelSet 1198.7370.257415.6668.79429,43225,75755,189
Set 2207.6720.438428.489112.32330,96128,19259,153
Set 3220.060.708445.637171.39333,04331,59464,637
Set 4236.2690.653455.74184.01736,90129,90766,808
Set 5252.4780.622465.843196.64140,93728,26669,203
Manufacturer-Led Stackelberg ModelSet 1306.7340.243420.10166.93541,14612,85253,998
Set 2316.8290.4435.243107.31643,01314,02257,035
Set 3329.9070.614454.86159.62745,43315,61361,046
Set 4343.1430.575464.714172.5748,62814,78063,408
Set 5356.3780.553474.567185.51352,02113,96965,990
Table 4. The sensitivity of the optimal decisions of the supply chain with respect to r .
Power Structurerwnp
Nash Model0.02253.5590.978427.119
0.04252.8180.935425.635
0.06252.1080.895424.216
0.08251.4290.857422.857
0.1250.7770.822421.554
Retailer-Led Stackelberg Model0.02220.9170.742446.8
0.04220.060.708445.637
0.06219.2420.677444.525
0.08218.4620.647443.461
0.1217.7160.62442.443
Manufacturer-Led Stackelberg Model0.02330.7760.642456.163
0.04329.9070.614454.86
0.06329.0740.589453.612
0.08328.2760.565452.414
0.1327.5090.543451.264
Publisher’s Note: MDPI stays neutral with regard to jurisdictional claims in published maps and institutional affiliations.

