Article

Artificial Neural Network Controller in Two-Area and Five-Area System with Security Attack and Game-Theory Based Defender Action

1
Electrical and Electronics Engineering Department, Jawaharlal Nehru Technological University Anantapur, Ananthapuramu, Anantapur 515002, Andhra Pradesh, India
2
Electrical and Electronics Engineering Department, Vallurupalli Nageswara Rao Vignana Jyothi Institute of Engineering and Technology, Hyderabad 500090, Telangana, India
*
Author to whom correspondence should be addressed.
Energies 2022, 15(15), 5715; https://doi.org/10.3390/en15155715
Submission received: 15 June 2022 / Revised: 18 July 2022 / Accepted: 1 August 2022 / Published: 5 August 2022
(This article belongs to the Special Issue Control, Optimization, and Cybersecurity of Electric Power Systems)

Abstract

:
Smart grids are the latest technology to generate and dispatch an optimal amount of power. Thus, there is a need for stability analysis in smart grid systems. If the smart grid is incorporated into the power system, then the phasor measurement unit (PMU) is used to measure the voltage, current, and frequency. Additionally, the central control unit monitors and controls the power. However, there is a possibility of inserting wrong data into the smart grid as the PMUs are transmitting the data through the Internet and other wireless protocols. There is a need to find solutions to this threat to make the power flow safe and secure in the future. In this paper, two-area load frequency control (LFC) is used for testing the game-theory based security treatment and improving the system’s stability by using an artificial neural network. The two-area system and five-area system are used to test the stability of the power system.

1. Introduction

Load frequency control is much needed in recent smart grid applications. It provides better control over a two-area system. Regular load frequency control was presented by P. Kundur [1] in 1994 with calculations and equations. An LFC is used to identify the system stability when two power systems are connected together. If there is a sudden disturbance, such as a load shift or generator shift, the frequency and power may change. After the disturbances have cleared, the system should come back to normal operation. However, sometimes it will not come to its normal operation. That means it varies the frequency or real power in the system. To synchronize two systems, there is a need for the frequency error to be zero. To make this happen, integral controllers, proportional integral controllers, and fuzzy logic controls are also used. These controllers should ensure fast settling time after the disturbances. Additionally, as recent technology improvements make the grid smart, the data communication is performed wirelessly. As there is a risk to data transmitted wirelessly. To protect that, many algorithms and techniques are used. In that, game theory plays an important role.
A literature survey was conducted in search of better control centers. Those articles are discussed as follows:
For studies on control centers in power systems in 2005, they are discussed in [2]. In 2008, the SCADA control and monitoring system was at its peak for controlling the power system. The cyber security attached to the system was presented by [3]. In 2009, the book Robust Control of Power Systems came out, along with new control strategies for power systems [4].
In the year 2009, the game theory algorithm for multiagent systems was introduced [5]. To secure the power system, the defense graph method was presented [6]. An LFC with a new robust controller for testing the effect of cyber-attack was proposed [7]. The impact of cyber-attach in LFC was identified in [8]. Since the LFC is a dynamic system, there are new dynamic control and mitigation strategies for these cyber security risks [9]. Uncertainty in the electricity market due to deregulation is analyzed in [10]. Reference [11] presents attack and defense modelling for cyber-attacks. A security assessment was performed in [12] based on the attack graph method.
Game theory-based security analysis for network security was presented in [13]. A data injection attack on the power system is presented in [14]. The probability of a cyber-attack on the smart grid was analyzed in [15]. The data integrity issue is presented in [16]. The load-altering attack type is described in [17]. Dynamic games with learning in security risk management are presented in [18,19]. A wise grid attack called a “smart attack” is described in [20]. For the smart grid, the security games and voltage control are also presented in [21,22]. The coordinated cyber-attacks and denial of service attacks on smart grids are described in [23,24]. Reference [25] describes the security measures for minimizing risk in the LFC. The Ant Lion optimization is introduced in [26]. Using the FPA algorithm as a solution technique in different game theories was performed in [27]. Differential game theory is solved using the ALO algorithm in [28,29]. Then, in [30], a two-area system with security attack and game theory based de-fender action using an ALO-tuned integral controller was presented and compared with the conventional method.
There are not many articles available on when the system is under attack, or how the settling of the frequency works faster, which ensures the fastest smart grid security. We replace the traditional integral controller in the two areas, LFC with ANN, which was trained with the data achieved from the Antlion optimization (ALO)-tuned PI controller (ALO-PI). This input data and output data were taken from the ALO PI controller. Then the ANN was trained with a backpropagation algorithm to get better control. A comparison with the conventional controller was also performed to prove that the proposed converter operates better.

2. Materials and Methods

The two-area system is used as a test case in many studies, and that is a standard power system LFC test bench. A recent study [25] has used this test bench. Based on Bevrani’s [25], Figure 2.10 and Table 2.2, this article presents the Simulink representation and simulation parameters for a two-area automatic gain control (AGC) system model. The top section is denoted by the designation “area 1.” The Australian Energy Market Operator has released the demand time series demand1 and demand2, which are the demand profiles of Victoria from 4–5 June 2012 and of South Australia from 7–8 June 2012, respectively. Both demand profiles were obtained from the state of Victoria. Nominal frequency = 60 Hz.
The game-theory-based defender action [25] uses the quantitative risk management to protect the smart grid from threat. The attack and defender actions were used as in [25].
This paper deals with the stability of a power system as the single most significant characteristic, and one of the most crucial characteristics to maintain is the frequency.
This is because the frequency of a power system will either increase or decrease depending on the amount of load that is being applied to it. In the event that frequency is not stabilized, there is a risk of damage to equipment (both that of utilities and end users), a risk to human safety, and a reduction in or stoppage of the supply of energy. One of the primary factors contributing to many power outages [25] is the violation of frequency stability standards. Loss of data or knowledge and damage to one’s reputation are examples of less tangible secondary repercussions that are just as unwanted. There are three modes of operation for the frequency control system. Primary frequency control takes the form of a turbine governor’s speed regulator, also known as a proportional controller of gain, where the droop characteristic is a factor, which is the decrease in speed or frequency that occurs when combining machines in an area transition from having no load to having full load.
Secondary frequency control is used to correct the steady-state error residue left by the proportional controller, and it may take the form of an integral controller. In this case, primary and secondary frequency control form a parallel proportional-integral controller, which is capable of driving frequency deviations to zero whenever a step-load perturbation is applied to the system. Tertiary frequency control is a supervisory control that is based on offline optimizations. Its purpose is to ensure that primary frequency control has an appropriate spinning reserve, and that secondary frequency control has the optimal dispatch of units participating in that control. Tertiary control is typically enabled manually many minutes after secondary control has been engaged, in contrast to primary and secondary controls, which respond in a matter of seconds and tens of seconds, respectively. Our research focuses solely on the dynamics of frequency control, and as a result, does not take tertiary control into consideration. As shown in the Figure 1, the defender, attacker, and UFLS relays are the MATLAB code which is used inside the function block of MATLAB [25].
The LFC control has two frequency loops using a PI (or integral controller [25]) controller to yield proportional an area control error (ACE) value for governor as in [25]. ACE is the required area control error value which is always required to be zero for stable operation [1]. The C A C E is the controlled signal using integral controller. The measured frequency ( F M ) and tie-line frequency ( F t i e ) are summed to get the C A C E .
C A C E = F M + F t i e
After giving to the controller transfer function as per [25]:
S p e e d = C A C E × m i n m a x K i
The proposed equation using PI controller is given in (3):
S p e e d = { k p × C A C E } + { C A C E × m i n m a x k i }
The random changes in the k p and k i values show the difference in the output response. The objective function is defined with the settling time. The discrete values of the setting time are taken as the objective. The limits of the k p and k i are chosen, in which range the settling time sensitivity is more.
Thus, the objective function is given as in Equation (4) by minimizing this the settling time reduces, and the response time increases.
F = min T s
      T s s p e e d   s e t t l i n g   t i m e   i n   s
Constraints
  k p , m i n   < k p < k p , m a x
k i , m i n   < k i < k i , m a x
For solving this, we use the new metaheuristic algorithm called the ALO algorithm.
The steps of the ALO are shown below (Algorithm 1), which follows the hunting character of the antlion.
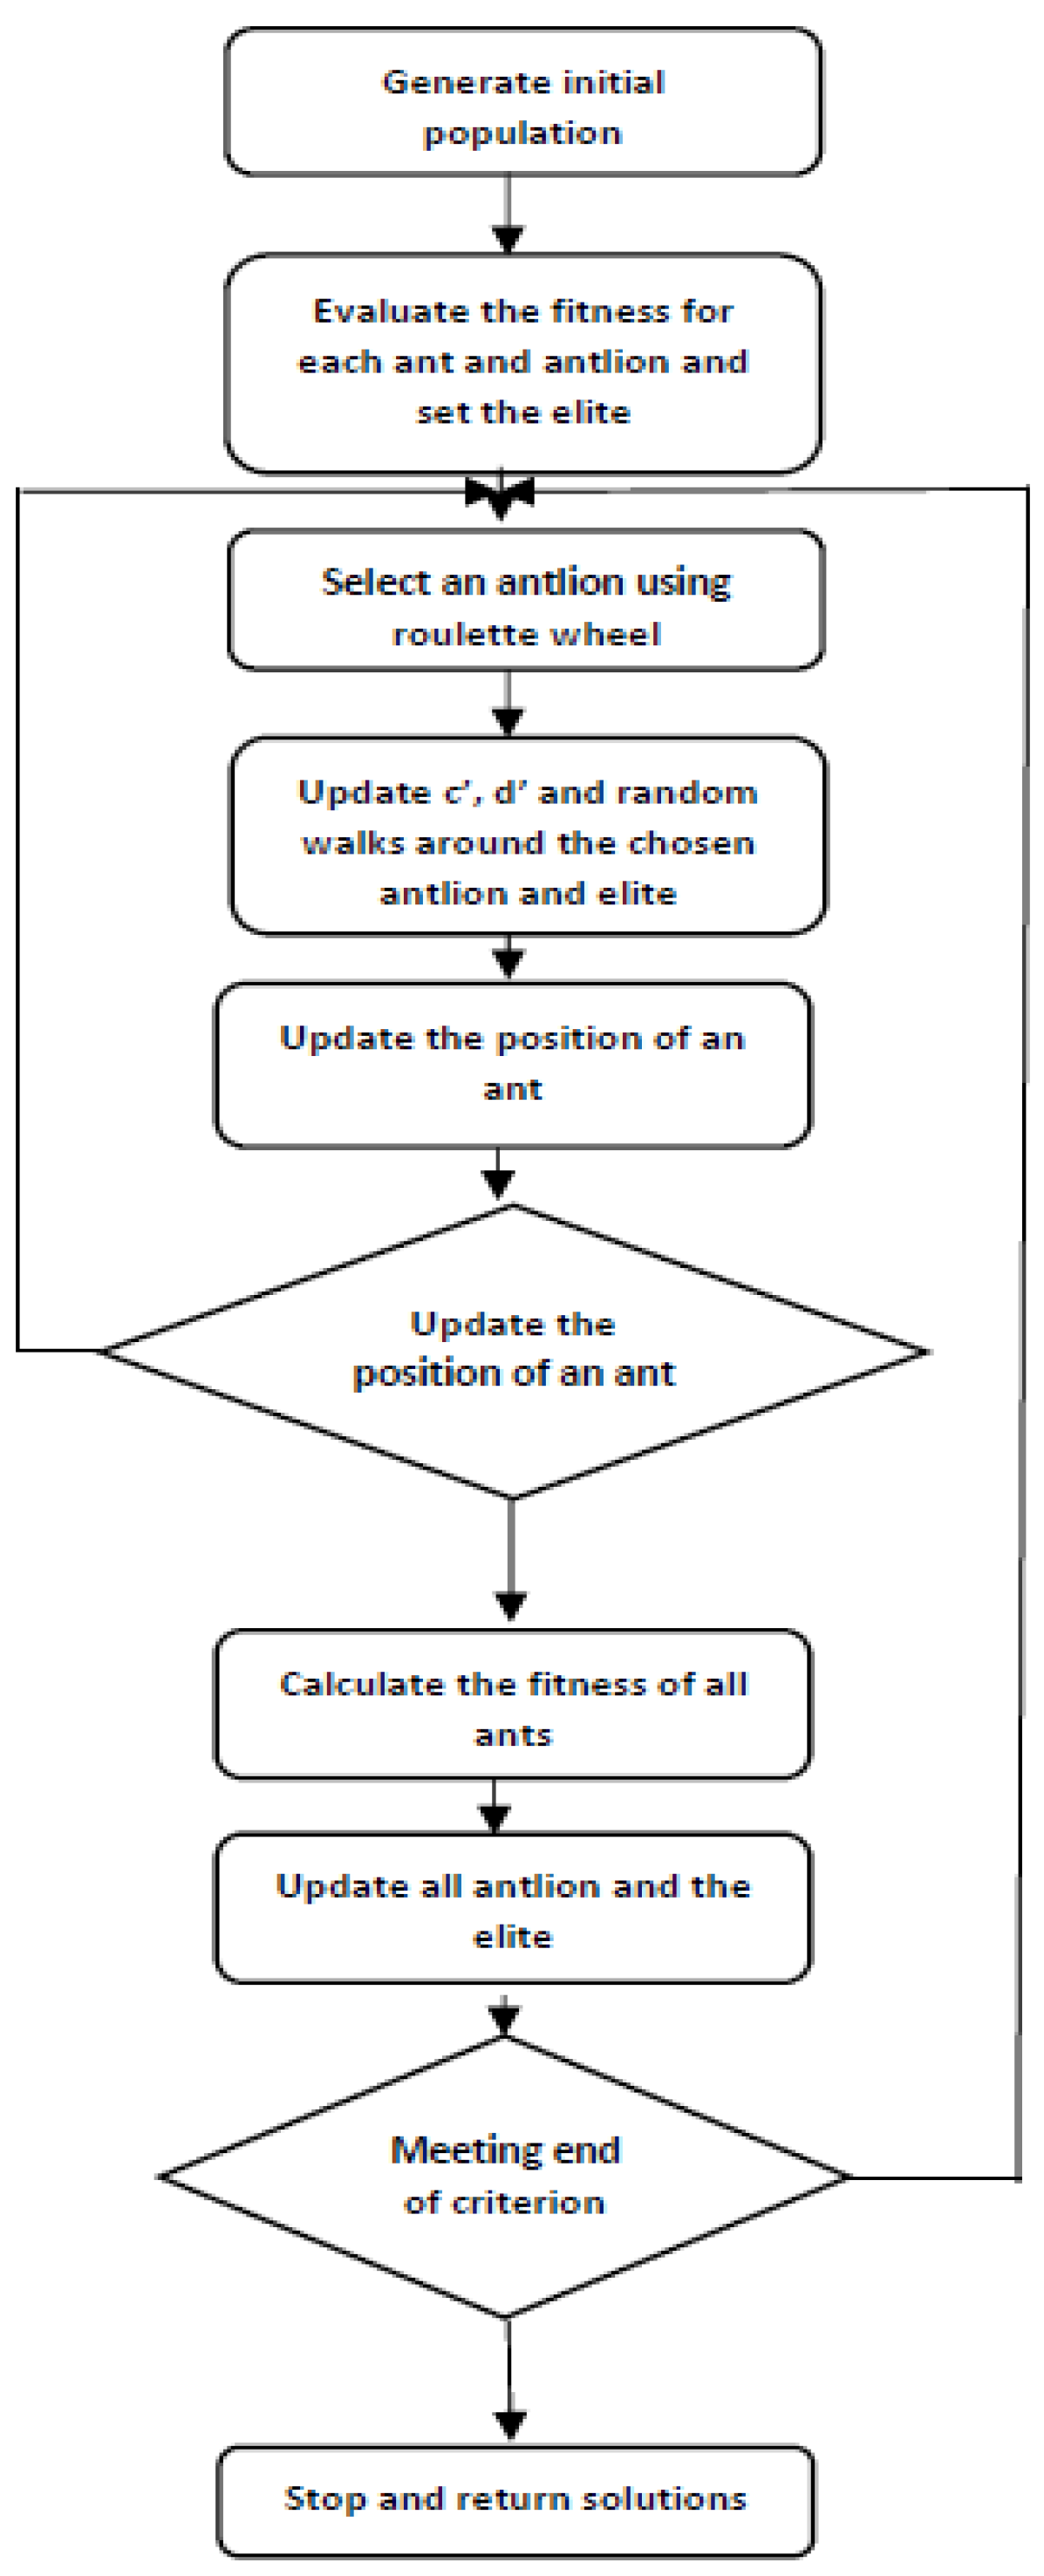
Algorithm 1. ALO algorithm
1:  Random initialization of ant(X(t)) is performed ( k p and k i values are the vectors of X(t)).
2:Calculate the fitness (after running the LFC the setting time is taken) of ants and antlions.
3:The elite identification is performed from the best antlion (determined optimum Kp and Ki).
4:Check for the satisfaction of termination criteria
for ants of each type.
Choice of an antlion using a Roulette wheel.
c and d are updated using
c t = c t I
d t = d t I
where ct is the minimum of all variables at t-th iteration; dt indicates the vector, including the maximum of all variables at t-th iteration. Here I is a ratio.
  The randomized walk and normalization are performed using the equation below.
X t : = 0 , c u m s u m 2 r t 1 1 , c u m s u m 2 r t 2 1 , , c u m s u m 2 r t n 1
X i t = X i a i X d i c i d i t a i + c i
  Stack the updated position of the ant using the equation below.
A n t i = ( R A t + R E t ) 2
where a i is the minimum of the random (r) walk of the i-th variable, b i is the maximum of the random
walk of the i-th variable, c i is the minimum of the i-th variable at the t-th iteration, and d i indicates
the maximum of the i-th variable at t-th iteration.
  Additionally, R A t is the random walk around the antlion selected by the roulette wheel at t-th iteration, R E t is the random walk around the elite at t-th iteration, and A n t i indicates the position of i-th ant at t-th iteration
  End for loop.
  For all the ants, calculate the fitness.
  If the ant is fitter than other ants, stack that ant as the elite one.
A n t l i o n j t = A n t i t   i f   f A n t i t > f ( A n t l i o n j t )
where t shows the current iteration, A n t l i o n j t shows the position of selected j-th antlion at the t-th iteration, and A n t i t indicates the position of i-th ant at t-th iteration. Additionally, f is the function of Equation (4).
  End while.
5:Return elite

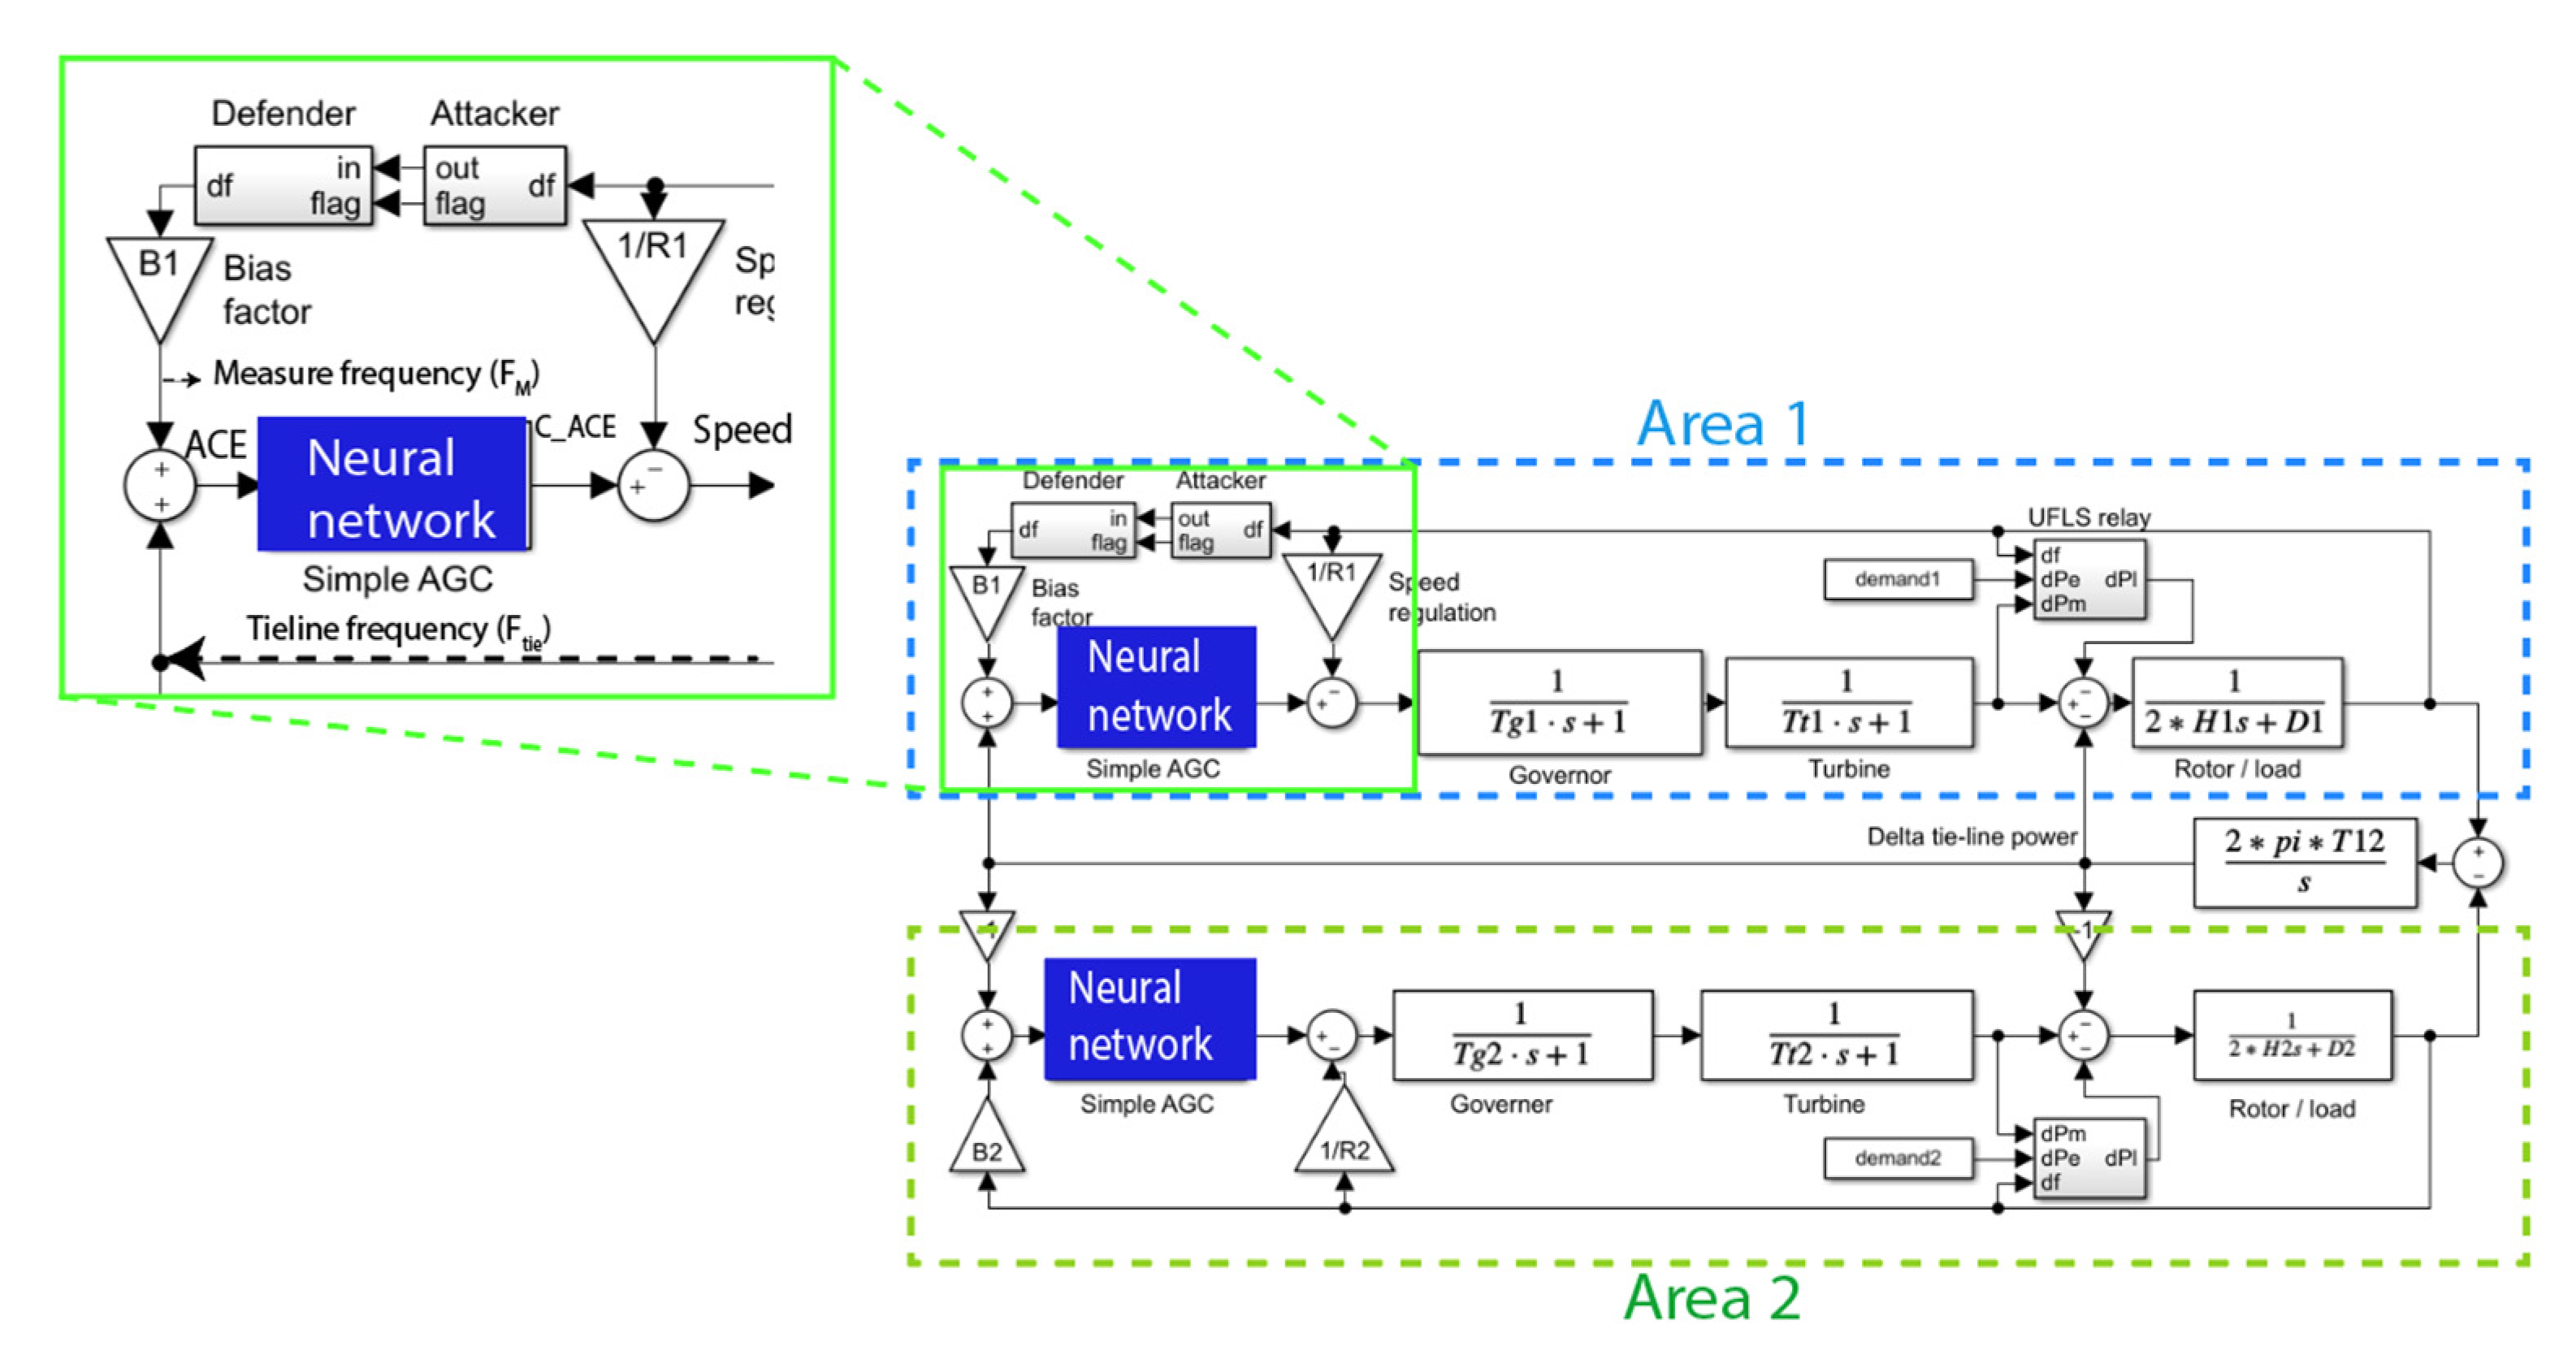
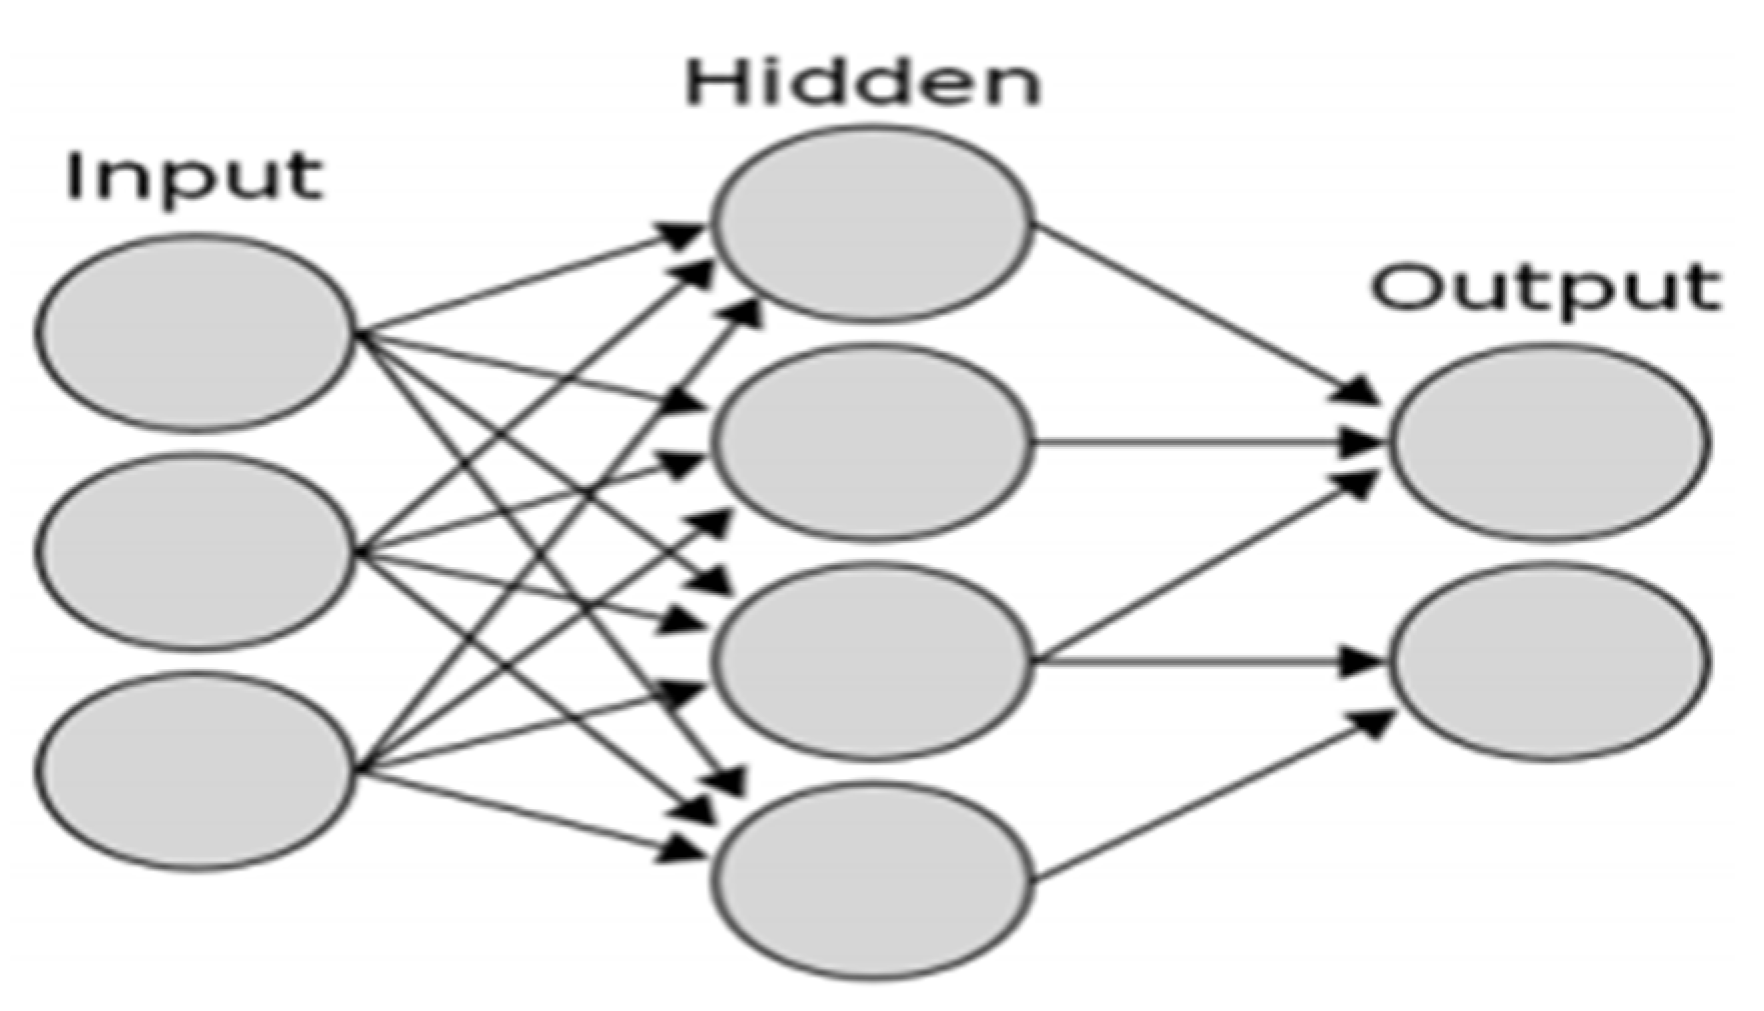
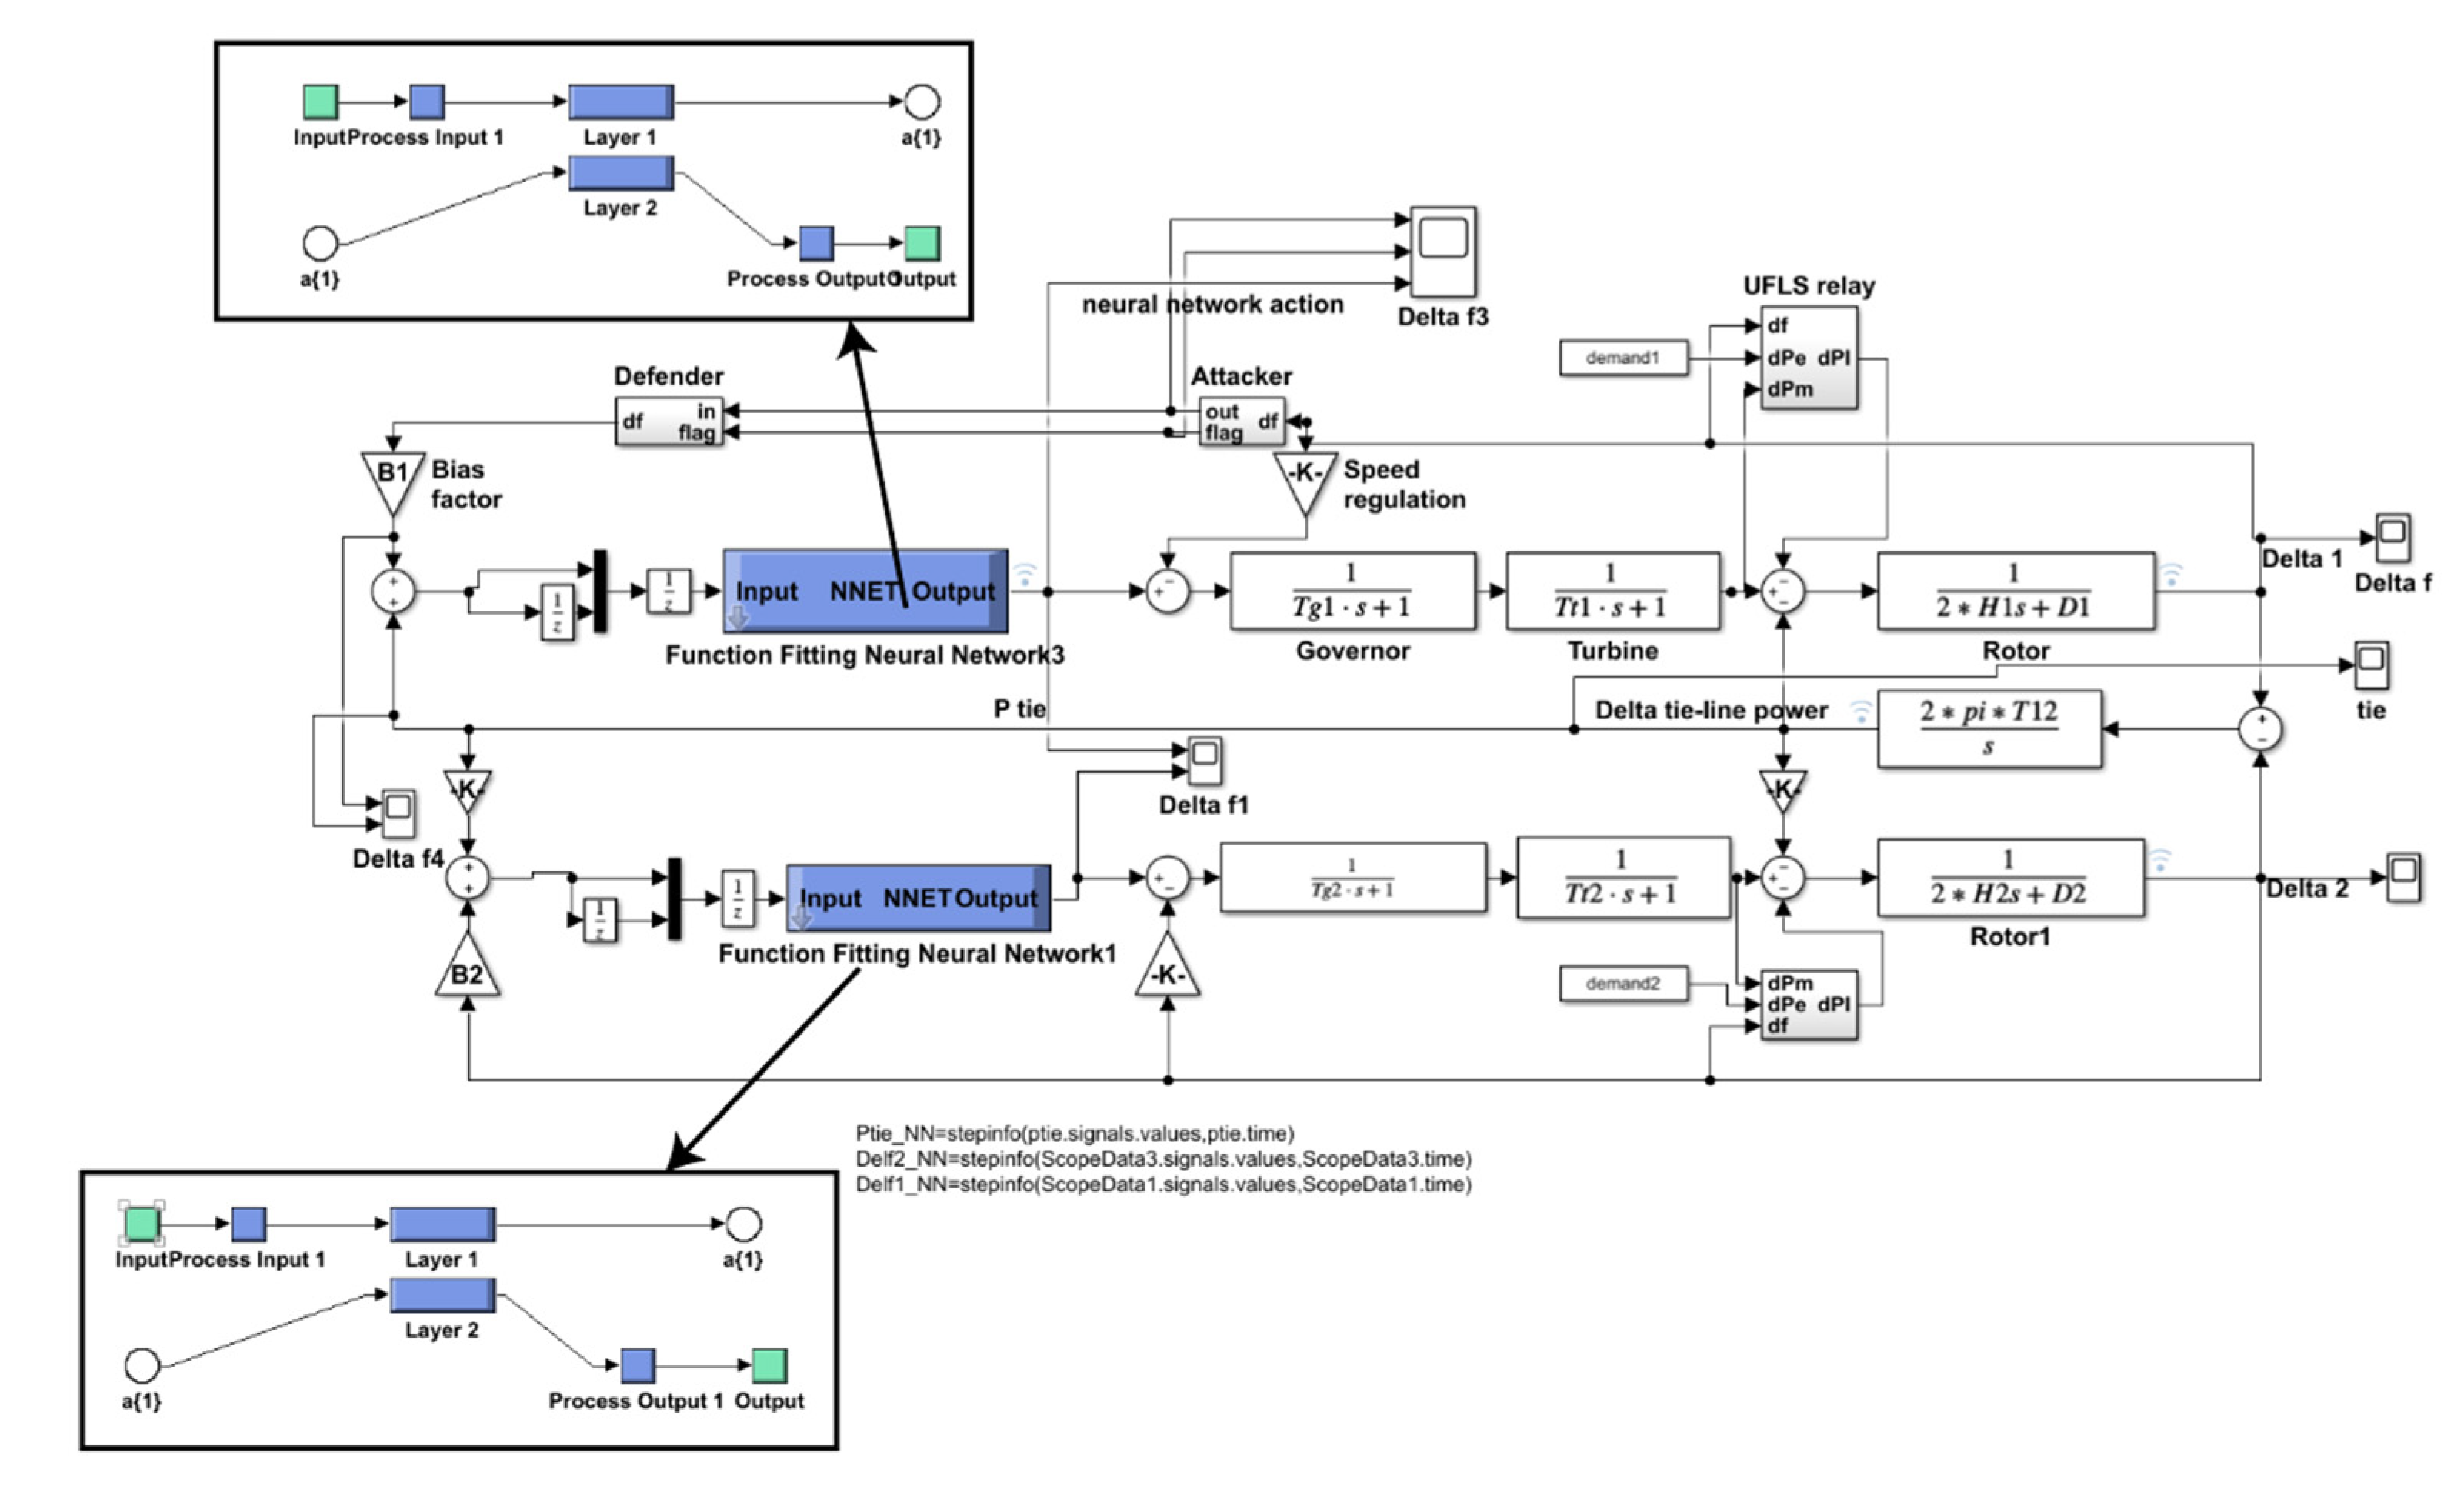
2.1. Applying an Artificial Neural Network (ANN) Controller in the Place of an ALO-PI Controller

The integral control of the automatic gain control in load frequency control is replaced by an artificial neural network. The ANN is the network-linked trainable model which is helpful in all the places wherever data are available. The Table 1 shows the blocks available in the ANN model.
Figure 2 depicts the ANN controller with a plant model. The NN controller was trained, and then the output was given to the LFC, which is shown as a plant here. The NN mode also produces the error value of frequency. The NN controller works such that whenever the changes are happening, the trained network produces the proper output. Then this will be applied to the plant or LFC model.
f x = 1 1 + e a x
Figure 3 shows the structure of a layer for a feed forward neural network. Equation (12) shows the sigmoidal function used in the feed forward neural network. The feed forward neural network shown in the figures and used in the controller can make decisions for the controller output. This output is a practically trained value. Thus, it has to give better results compared to conversional mathematical integral controllers. The Figure 4 shows the network connection of feed forward neural network.

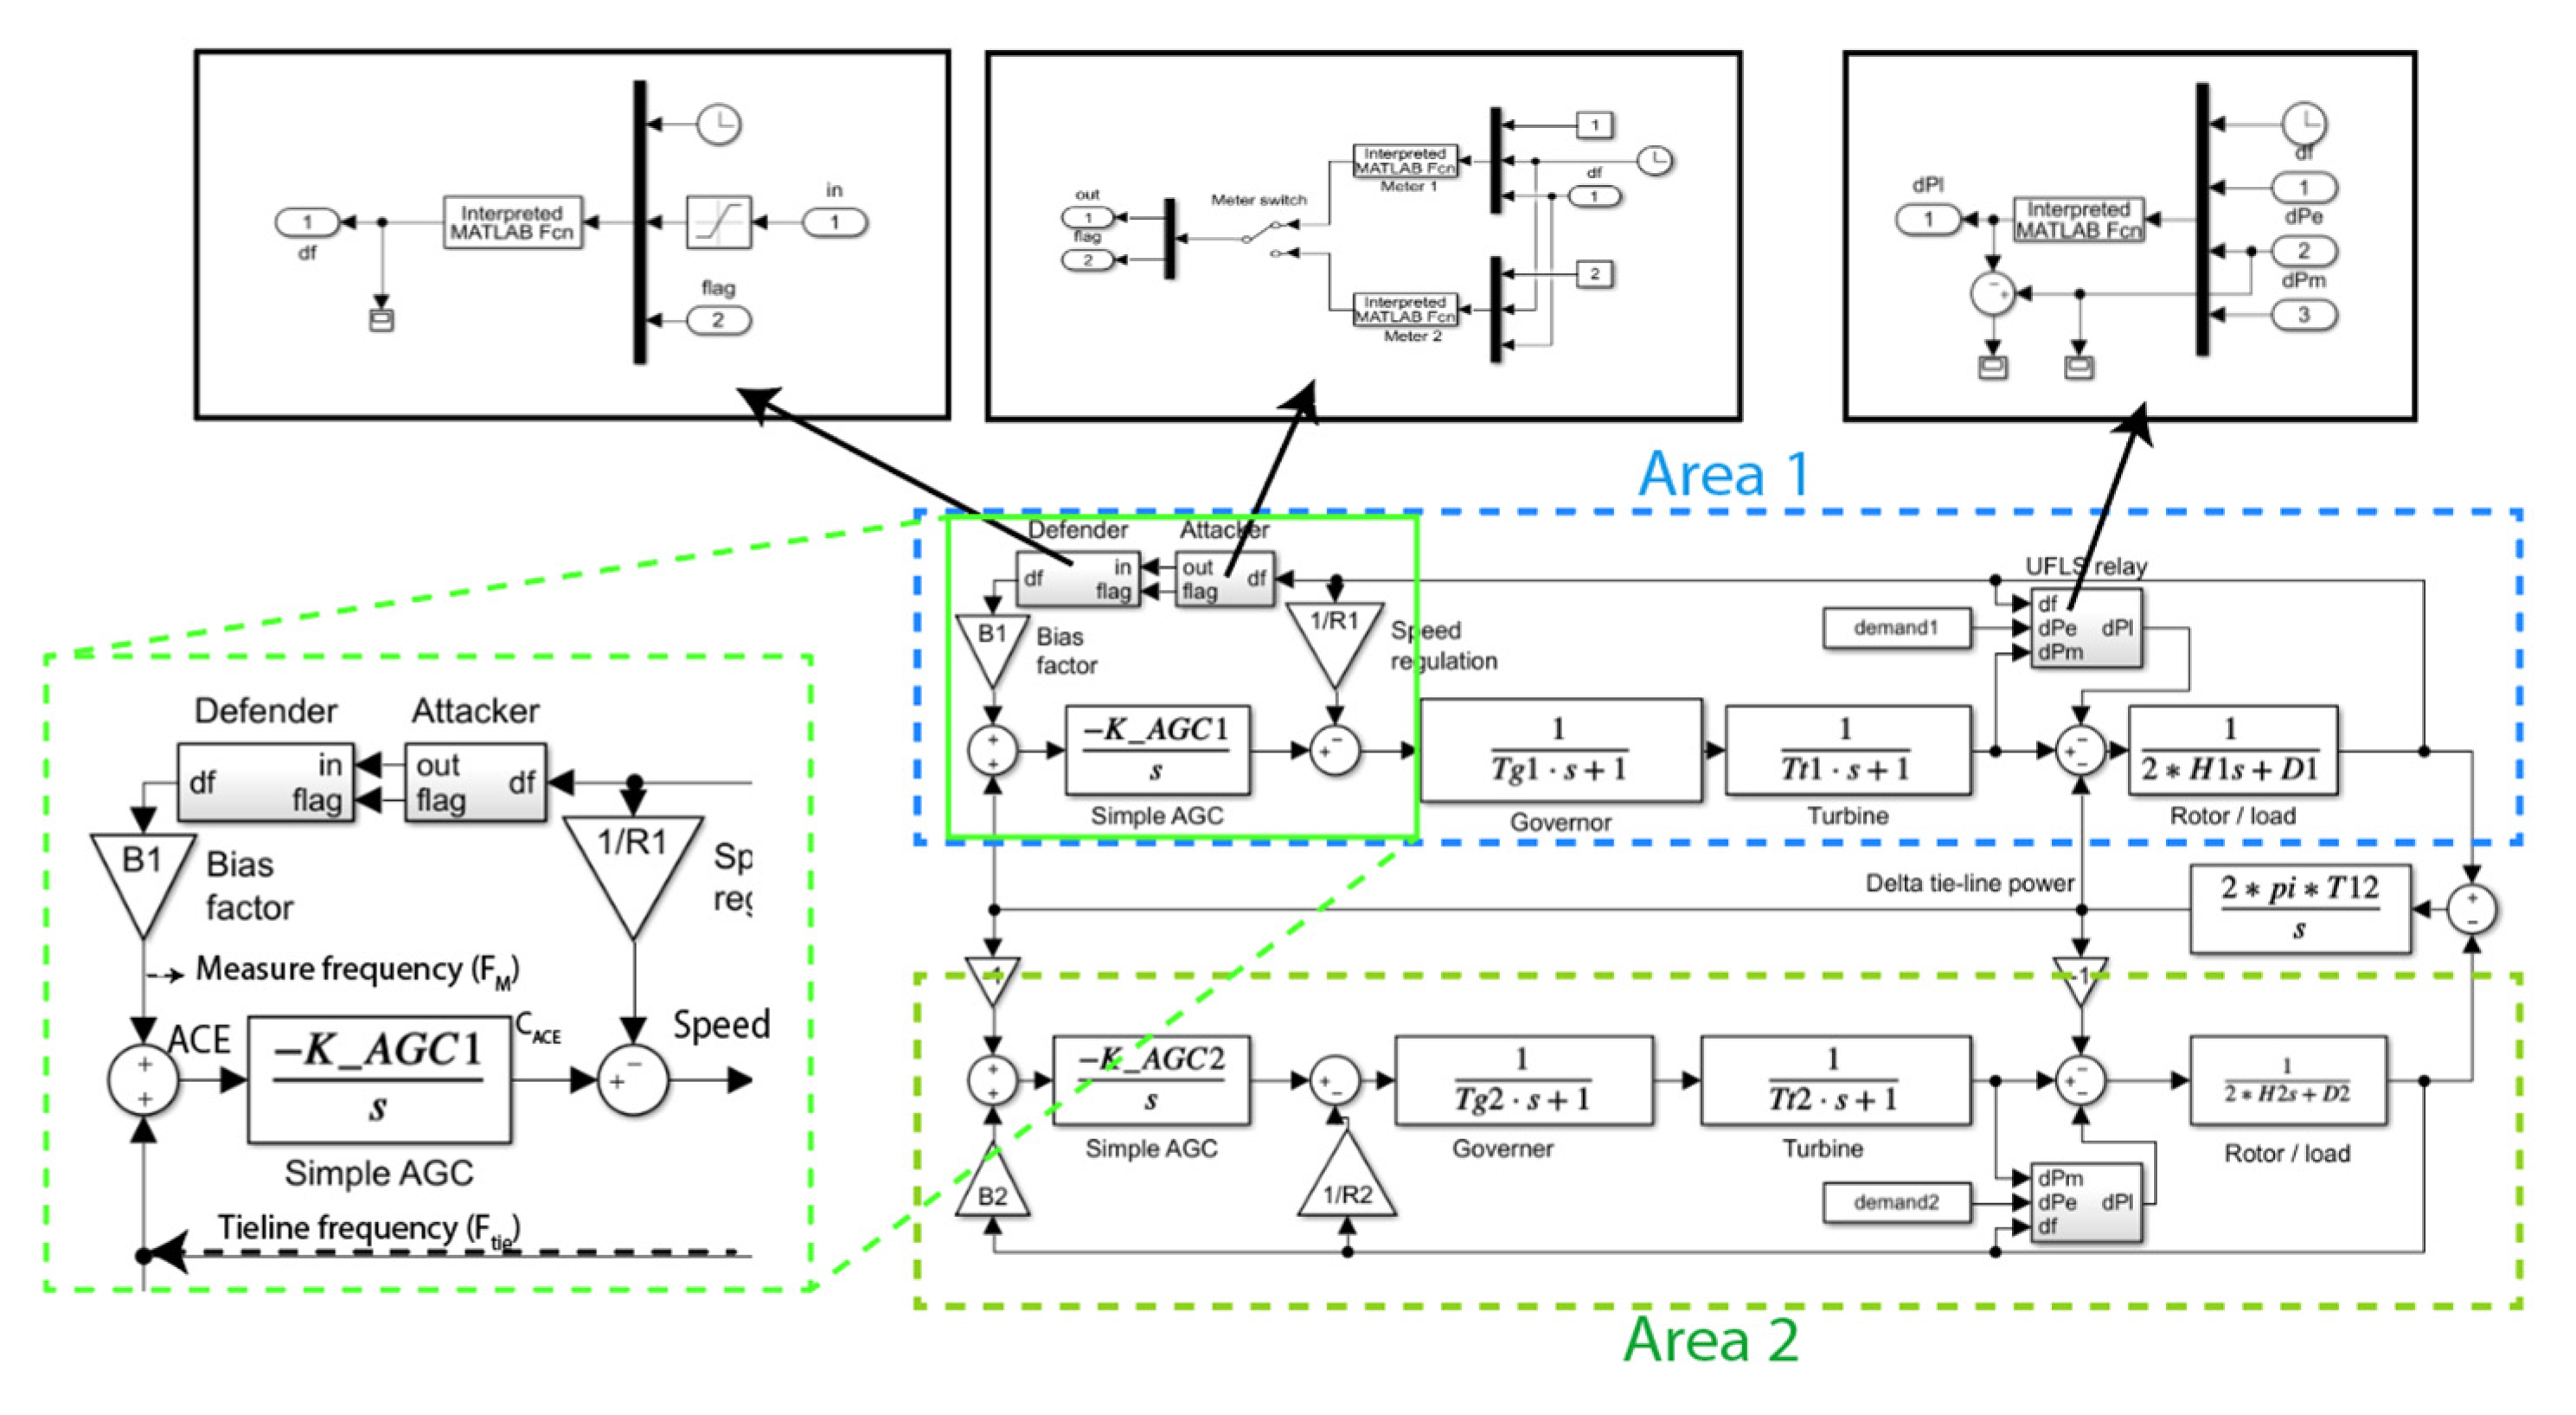
2.2. Attacks Applied in LFC

All the injection patterns are impossible to exhaust. The sophisticated attacks are based on the four basic patterns:

2.2.1. Constant Injection

If a constant false has been injected by an attacker, then the integral control loop effectively gets disabled. This causes the system frequency to converge to a non-nominal frequency. Then, the system will settle down to a below-nominal frequency if the value is false, causing the loads to be shed; otherwise, the system will set down to an above-nominal frequency, and it will trip the generators. Both cases lead to cascading failure.

2.2.2. Injecting the Bias

The effect is similar to that of constant injection; constant displacement happens if it is false, and it is normally true.

2.2.3. Overcompensation

If the former value is false, and there are many attempts, the attack will cause overcompensation effectively. As the frequency of the system sweeps the past overfrequency and underfrequency thresholds, by following cascade failures, the loads will be shed and generators will be tripped.

2.2.4. Negative Compensation

If bias is false, and there are many attempts, the intended effect of the integral control loop will be reversed effectively by the attack; the system frequency’s will be diverged to the nominal frequency. The generators will be directly triggered by this attack.
Once the generator is tripped, the supply hole will be filled by the engaged reverse spinning. In case of failure, the shedding of underfrequency relay loads will be started as a final measure. The load shedding is also caused by the direct attack’s trigger generator tripping. Due to maximal damage in both load shedding and tripping of the generator in terms of direct triggering, the overcompensation attacks have been concentrated in this study.

2.3. Preliminary Defenses

The defenses for overcompensation attack take the following states:

2.3.1. Saturation Filter

By using the limits of the input point of controller of frequency, we can constrain the attack, because at the Hz level, all spendable loads are shredded and all generators are tripped. Outage of generator happens at that specific frequency.

2.3.2. Redundancy

For critical grid parameters, the measurement of redundancy is provisioned routinely. Different grades of multiple frequency have been installed.

2.3.3. Detection

Using saturation filtering and redundancy, attacks’ success can be limited, but the source of attacks should be detected and removed. The system can be under attack if at certain point the threshold may be lower than the measured one or the measured one is observed by a threshold-based algorithm. Alternatively, taking the counts of clusters in a time series determined by a custom algorithm based on clustering, in normal circumstances, the values of clusters tend to be zero. If more than one cluster has been found, then the system could be under attack. Generally, the clustering has been considered as a versatile approach when compared to the thresholding for anomaly detection.

3. Results

The two-area system was made in MATLAB, R2017b, Khadarvali, bangalore, India Simulink. The data for two areas were taken from [4]. The system was modelled to control the frequency and tie line power. It works with an integral controller where the bias factors act as proportional gain. When the two areas are considered as the smart grid where the attacker attacks, the system is as mentioned in previous section. Then, the defense actions take place, such as limiting the frequency and then using the other meters for measuring the frequency, which are called redundancy meters. There is another protection: using under-frequency load shedding (UFLS) [25]. This sheds the load when the frequency is reduced by an attacker.
Figure 5 shows the conventional LFC with two areas [4] using an integral controller with attacking and defending actions. The integral controller was used here, and the parameters used for control were taken from [4]. Figure 6 shows the proposed LFC with two-area control [4] using an ANN controller with attacking and defending actions. The PI controller was tuned with ALO and then trained via the ANN. For the training of the ANN, the performance of the validation of ANN data is shown as a graph. Figure 7 shows the performance validation of the ANN. This graph shows that the mean square error (MSE) was minimized to 0.1213. If the MSE is as low as possible, the ANN is optimally trained. It took around 914 iterations to achieve this.
The performance gradient is shown in Figure 8. This shows the ANN’s training status in each iteration. The data on this graph should also be minimal so that it shows the training was successful. Figure 9 shows the attack without control and with load shedding. Without a controller, load shedding cannot ensure system stability. The frequency change increased every second. This instability caused instability in the two-area system. Figure 10 shows the attack without control, with load shedding, and with changes in frequency. The response time change in frequency is also shown in the figure. This also increases and deviates. The attacker output is shown in Figure 11. The zoomed view is shown in the same figure as the inline figure. Then, Figure 12 shows the defender’s detection of the attacks (1—attacked, 0—no attack). The corrective action was performed by the controller, which is shown in Figure 13. It shows the correction signal created by the integral controller and the ANN. Figure 14 shows the demand change in two areas and the frequency output after the defender action using integral control and the ANN. It can be seen at the bottom of the figure that the ANN produced reduced disturbance. Then, Figure 15 shows the changes in power output after the defender’s action using integral control and the ANN. This also shows that there were few disturbances and that both the integral control and the ANN make the system stable.
However, according to the power system, the faster the response, the safer the system is. Table 2 shows the signal information of the two-area frequency change and tie line power change. Accordingly, the objective settling time must be less than the frequency and tie line power. Thus, the ANN provides a 37.6% reduction in setting time in area 1, a 52% reduction in area 2 frequency change, and a 33% reduction in tie line power settling time. The ANN output used the integral controller when it was trained with the data of the ALO-PI controller.
Figure 16 shows the frequency deviations in five area systems using PI controller. Figure 17 show the tie power in a 5-area system using PI controller. Figure 18 shows the frequency deviation in five area system using NN controller. Figure 19 shows the tie power using NN controller. Table 2 shows the comparison of the settling time and other information of the curves. Table 3 shows that the NN controller performs better compared to the conventional PI controller used in the 5-area system.

4. Conclusions

The two-area LFC was simulated in MATLAB Simulink with an integral controller, including frequency attacks and defender actions. Security games were used in defending actions. Then, the system was analyzed with an ALO-trained PI controller instead of an integral controller. The data of the ACE were accumulated, and these data were trained with the ANN controller. The comparison of the conventional integral controller and the proposed ANN, including the attacker’s and defender’s actions, was performed, and the ANN outperformed the integral controller in the setting time. With the ANN, a maximum reduction of 52% in settling time is achieved.

Author Contributions

Conceptualization, S.K. and V.M.; methodology, S.K. and V.M.; software, S.K.; validation, S.K., V.M. and R.K.; formal analysis, S.K.; investigation, S.K.; resources, S.K.; data curation, S.K.; writing—original draft preparation, S.K., V.M. and R.K.; writing—review and editing, S.K., V.M. and R.K.; visualization, S.K.; supervision, V.M. and R.K. All authors have read and agreed to the published version of the manuscript.

Funding

This research received no external funding.

Institutional Review Board Statement

Not applicable.

Informed Consent Statement

Not applicable.

Data Availability Statement

Not applicable.

Conflicts of Interest

The authors declare no conflict of interest.

References

  1. Kundur, P. Power System Stability and Control; McGraw-Hill: New York, NY, USA, 1994. [Google Scholar]
  2. Wu, F.; Moslehi, K.; Bose, A. Power system control centers: Past, present, and future. Proc. IEEE 2005, 93, 1890–1908. [Google Scholar] [CrossRef] [Green Version]
  3. Ten, C.-W.; Liu, C.-C.; Manimaran, G. Vulnerability assessment of cybersecurity for SCADA systems. IEEE Trans. Power Syst. 2008, 23, 1836–1846. [Google Scholar] [CrossRef]
  4. Bevrani, H. Robust Power System Frequency Control; Power Electronics and Power Systems; Springer: New York, NY, USA, 2009. [Google Scholar]
  5. Shoham, Y.; Leyton-Brown, K. Multiagent Systems: Algorithmic, Game-Theoretic, and Logical Foundations; Cambridge Univ. Press: Cambridge, UK, 2009. [Google Scholar]
  6. Sommestad, T.; Ekstedt, M.; Nordstrom, L. Modeling security of power communication systems using defense graphs and influence diagrams. IEEE Trans. Power Deliv. 2009, 24, 1801–1808. [Google Scholar] [CrossRef]
  7. Esfahani, P.M.; Vrakopoulou, M.; Margellos, K.; Lygeros, J.; Andersson, G. A robust policy for automatic generation control cyber attack in two area power network. In Proceedings of the 49th IEEE Conference on Decision and Control (CDC), Atlanta, GA, USA, 15–17 December 2010. [Google Scholar]
  8. Esfahani, P.M.; Vrakopoulou, M.; Margellos, K.; Lygeros, J.; Andersson, G. Cyber attack in a two-area power system: Impact identification using reachability. In Proceedings of the 2010 American Control Conference, Baltimore, MD, USA, 30 June–2 July 2010. [Google Scholar]
  9. Mounzer, J.; Alpcan, T.; Bambos, N. Dynamic control and mitigation of interdependent IT security risks. In Proceedings of the 2010 IEEE International Conference on Communications, Cape Town, South Africa, 23–27 May 2010; pp. 1–6. [Google Scholar]
  10. Conejo, A.J.; Carrión, M.; Morales, J.M. Decision Making Under Uncertainty in Electricity Markets; Springer Science + Business Media: New York, NY, USA, 2010. [Google Scholar]
  11. Ten, C.-W.; Manimaran, G.; Liu, C.-C. Cybersecurity for critical infrastructures: Attack and defense modeling. IEEE Trans. Syst. Man Cybern. Part A Syst. Hum. 2010, 40, 853–865. [Google Scholar] [CrossRef]
  12. Liu, N.; Zhang, J.; Zhang, H.; Liu, W. Security assessment for communication networks of power control systems using attack graph and MCDM. IEEE Trans. Power Deliv. 2010, 25, 1492–1500. [Google Scholar] [CrossRef]
  13. Alpcan, T.; Başar, T. Network Security: A Decision and Game Theoretic Approach; Cambridge Univ. Press: Cambridge, UK, 2011. [Google Scholar]
  14. Kim, T.T.; Poor, H.V. Strategic protection against data injection attacks on power grids. IEEE Trans. Smart Grid 2011, 2, 326–333. [Google Scholar] [CrossRef]
  15. Hahn, A.; Govindarasu, M. Cyber attack exposure evaluation framework for the smart grid. IEEE Trans. Smart Grid 2011, 2, 835–843. [Google Scholar] [CrossRef]
  16. Sridhar, S.; Manimaran, G. Data integrity attack and its impacts on voltage control loop in power grid. In Proceedings of the IEEE PES General Meeting, Detroit, MI, USA, 24–28 July 2011; pp. 1–6. [Google Scholar]
  17. Mohsenian-Rad, A.; Leon-Garcia, A. Distributed internet-based load altering attacks against smart power grids. IEEE Trans. Smart Grid 2011, 2, 667–674. [Google Scholar] [CrossRef]
  18. Bommannavar, P.; Alpcan, T.; Bambos, N. Security risk management via dynamic games with learning. In Proceedings of the 2011 IEEE International Conference on Communications (ICC), Kyoto, Japan, 5–9 June 2011; pp. 1–6. [Google Scholar]
  19. Kundur, D.; Feng, X.; Mashayekh, S.; Liu, S.; Zourntos, T.; Butler-Purry, K.L. Towards modelling the impact of cyber-attacks on a smart grid. Int. J. Secur. Netw. 2011, 6, 2–13. [Google Scholar] [CrossRef] [Green Version]
  20. Chen, P.-Y.; Cheng, S.-M.; Chen, K.-C. Smart attacks in smart grid communication networks. IEEE Commun. Mag. 2012, 50, 24–29. [Google Scholar] [CrossRef]
  21. Law, Y.W.; Alpcan, T.; Palaniswami, M.; Dey, S. Security games and risk minimization for automatic generation control in smart grid. In Proceedings of the 3rd Conference Decision and Game Theory for Security (GameSec 2012), Budapest, Hungary, 5–6 November 2012; LNCS. Springer: Berlin/Heidelberg, Germany, 2012; Volume 7638, pp. 281–295. [Google Scholar]
  22. Law, Y.W.; Alpcan, T.; Palaniswami, M. Security games for voltage control in smart grid. In Proceedings of the 012 50th Annual Allerton Conference on Communication, Control, and Computing, Monticello, IL, USA, 1–5 October 2012. [Google Scholar]
  23. Sridhar, S.; Govindarasu, M.; Liu, C.-C. Risk Analysis of Coordinated Cyber-Attacks on Power Grid. In Control and Optimization Methods for Electric Smart Grids; Springer: New York, NY, USA, 2012; pp. 275–294. [Google Scholar]
  24. Liu, S.; Liu, X.; Saddik, A.E. Denial-of-Service (DoS) attacks on load frequency control in smart grids. In Proceedings of the 2013 IEEE PES Innovative Smart Grid Technologies (ISGT), Washington, DC, USA, 24–27 February 2013; pp. 1–6. [Google Scholar]
  25. Law, Y.W.; Alpcan, T.; Palaniswami, M. Security Games for Risk Minimization in Automatic Generation Control. IEEE Trans. Power Syst. 2015, 30, 223–232. [Google Scholar] [CrossRef]
  26. Mirjalili, S. The Ant Lion Optimizer. Adv. Eng. Softw. 2015, in press. [Google Scholar] [CrossRef]
  27. Khadarvali, S.; Madhusudhan, V.; Kiranmayi, R. Robust Cooperative Control in Multi Area Power System Using Differential Game theory Under Weak Grid Condition. ARPN J. Eng. Appl. Sci. 2019, 1400–1406. [Google Scholar]
  28. Khadarvali, S.; Madhusudhan, V.; Kiranmayi, R.; Al Farawn, A.; Rjeib, H.D.; Al-Sadawi, B. Differential Game Theory with FPA Optimization in Multi-Area Power System. Int. J. Power Electron. Drive Syst. 2020, 11, 302–308. [Google Scholar] [CrossRef] [Green Version]
  29. Khadarvali, S.; Madhusudhan, V.; Kiranmayi, R. Differential Game Theory with ALO Control in Multi-Area Power System. Int. J. Adv. Sci. Technol. 2020, 29, 608–614. [Google Scholar]
  30. Khadarvali, S.; Madhusudhan, V.; Kiranmayi, R. Load Frequency Control of Two Area System with Security Attack and Game Theory Based Defender Action Using ALO Tuned Integral Controller. In Proceedings of the 2021 International Conference on Computational Intelligence and Computing Applications (ICCICA), Nagpur, India, 26–27 November 2021; pp. 1–5. [Google Scholar] [CrossRef]
Figure 1. Conventional integral technique in two area system with integral controller [25].
Energies 15 05715 g001
Figure 2. Flowchart of ALO.
Energies 15 05715 g002
Figure 3. ANN controller with a plant model.
Energies 15 05715 g003
Figure 4. Layers of a feed forward neural network.
Energies 15 05715 g004
Figure 5. Conventional LFC in a two-area system [4] using an integral controller with attacking and defending actions.
Energies 15 05715 g005
Figure 6. Proposed LFC with a two-area system [4] using the ANN controller with attacking and defending actions.
Energies 15 05715 g006
Figure 7. Performance validation in ANN.
Energies 15 05715 g007
Figure 8. Performance gradient in ANN.
Energies 15 05715 g008
Figure 9. Attack without control with load shedding.
Energies 15 05715 g009
Figure 10. Attack without control with load shedding and change in frequency.
Energies 15 05715 g010
Figure 11. Area 1 frequency attack.
Energies 15 05715 g011
Figure 12. Defender detection of attack (1—attacked, 0—no attack).
Energies 15 05715 g012
Figure 13. Correction signal created by the integral controller and ANN.
Energies 15 05715 g013
Figure 14. Demand change in two areas and frequency output after the defender action using integral control and ANN.
Energies 15 05715 g014
Figure 15. Change in two-area tie power output after the defender’s action using integral control and the ANN.
Energies 15 05715 g015
Figure 16. Frequency deviation using the PI controller.
Energies 15 05715 g016
Figure 17. Tie power using the PI controller.
Energies 15 05715 g017
Figure 18. Frequency deviation using the NN controller.
Energies 15 05715 g018
Figure 19. Tie power using the NN controller.
Energies 15 05715 g019
Table 1. Units within ANN controller.
ANN UnitAvailability Status of Training Data
ControllerAvailable to train the controller
PlantLFC model
Table 2. Signal analysis after attacking and defending with the comparison of integral and ANN controllers.
Integral Controller [25]NN Controller
Δf1 (Hz)Δf2 (Hz)ΔPtie (p.u)Δf2 (Hz)Δf2 (Hz)ΔPtie (p.u)
Rise Time(s)0.0008160.0001490.020576.61320.007140.01136
Settling Time (s)2727.85138.77117.37618.28525.846
Settling Min(s)−1.06124.8252−0.89933−0.2872−0.2957−0.7447
Settling Max(s)0.530520.551371.41330.102660.104311.297
Overshoot (ratio)16,2092.70 × 10519,5603941323.166,981
Undershoot (ratio)1.70 × 10530,90712,51024,24154,43938,515
Peak Value5.52154.82521.41335.03773.99041.297
Peak Time (s)1.251.950.751.231.8930.741
Table 3. Signal analysis after attacking and defending with the comparison of PI and ANN controllers in a 5-area system.
PI ControllerNN Controller
Rise Time (s)2.09680.30207
Settling Time (s) 34.45124.842
Settling Min (s)0.0630620.78426
Settling Max (s)25.77927.734
Overshoot (ratio)40,3153435
Undershoot (ratio)00
Peak value 25.77927.734
Peak Time (s)9.50242.301
Publisher’s Note: MDPI stays neutral with regard to jurisdictional claims in published maps and institutional affiliations.

