Article

Investigation into Power Line Supporting Structure Dynamic Properties by Means of Impulse Test

1
Department of Robotics and Mechatronics, Faculty of Mechanical Engineering and Robotics, AGH University of Science and Technology, Mickiewicz Alley 30, 30-059 Krakow, Poland
2
Department of Biocybernetics and Biomedical Engineering, Faculty of Electrical Engineering, Automatics, Computer Science and Biomedical Engineering, AGH University of Science and Technology, Mickiewicz Alley 30, 30-059 Krakow, Poland
3
Department of Power Systems and Environmental Protection Facilities, Faculty of Mechanical Engineering and Robotics, AGH University of Science and Technology, Mickiewicz Alley 30, 30-059 Krakow, Poland
*
Author to whom correspondence should be addressed.
Energies 2022, 15(15), 5707; https://doi.org/10.3390/en15155707
Submission received: 21 June 2022 / Revised: 30 July 2022 / Accepted: 3 August 2022 / Published: 5 August 2022

Abstract

:
Dynamic analysis of a large, full-scale construction requires proper excitation in order to induce vibrations that can be measured and further processed. The amount of delivered energy over the frequency band must be sufficient to excite all the mode shapes in the studied range. The paper concerns the pseudo-impulse pull-and-release method that allows to determine frequency response functions of a large, lightly damped structure and estimate its modal parameters. The main advantage of the developed method is the great independence of the repetitiveness of the experiment’s operational parameters. The output time histories from subsequent partial experiments are accurately synchronised and normalised without measuring the signal of input excitation. The research conducted for the full-scale transmission tower results in modal parameters, estimated by classical and pseudo-impulse methods. The applied pseudo-impulse improves the conditioning of the excitation and results in the better readability of stabilisation diagrams as well as in a better stabilisation of the poles that are not clearly represented in the input data. The proposed method allows for the visualisation of poles which are non-detectable in cases of classical analysis.

Graphical Abstract

1. Introduction

Truss systems are frequently used in civil engineering in the construction of bridges, towers, chimneys, power pylons or other supporting structures. Continuous technical development provides tools for ever-better structure optimisation in terms of maximizing strength while reducing weight and costs of construction and exploitation [1]. Assessment of the technical state of such structures is one of the most important ways to ensure structural integrity, security and to avoid major financial losses caused by failures [2].
Among the most popular and responsible engineering structures, the power line supporting structures deserve special attention since power line breakdowns have serious technical and financial consequences [3,4]. Due to a lack of knowledge regarding the weakest link (the particular pole), usually the renovation is carried out for the whole line. Moreover, weakening of the load capacity of a single supporting structure (e.g., due to incorrect welds, loose screw connections, too shallow foundations, poorly recognised type of soil) affects the reliability of the entire line, which consists of hundreds or even thousands of such supporting structures [5,6]. It is typical for failures of transmission lines to be experienced by thousands of people, to last from several hours to several days, and to have a wide territorial range and destructive effects on all areas of life, including industry and transport [7,8]. In practice, they mean paralysis of cities and entire regions.
Nowadays, repairs of transmission lines are carried out at the time when a failure appears or based on the resources determining the statistical time between consecutive repairs. Replacing repairs performed after the failure of a resource with repairs resulting from the precise recognition of the system’s technical condition result in the reduction in the number of renovated poles while preserving the reliability of the whole line to be close to the reliability of a new one [9]. Such a renovation strategy has already found application in the aviation industry, where many years ago the service-life estimates were abandoned in favour of the non-destructive diagnostic tests or embedded SHM (Structural Health Monitoring) systems [10,11]. In the case of power lines, the change in the repair strategies implies a reduction in materials used for renovation, such as steel (profiles), paints, solvents and propellants used by repair crews for transport and technological purposes (welding, earthworks). Increasing the reliability of the line, and hence, reducing the number or virtually eliminating the failures, brings about a huge benefit for the environment due to the lack of environmental costs associated with emergency power generation by less efficient sources, e.g., small backup generators. The environmental burden resulting from the interrupted industrial processes (in chemical plants, cement and sewage treatment plants, and electrostatic precipitators), as well as the generation of additional vehicular traffic as a result of breaks in railway traffic, switching off traffic lights, etc., is also avoided [12].
Among many different methods of fault detection, due to the simplicity of their usage, the most popular methods are the methods based on the analysis of vibroacoustical phenomena [13,14,15]. Based on the dynamic system responses, it is possible to extract the unique information indicating damage initialisation and propagation. Frequently, discussed methods also allow for detection, location and assessment of damage size [10]. In the literature, there are numerous reported vibration-based diagnostic methods that do not depend on modal models. Pascual et al. [16] introduced the FDAC (Frequency Domain Assurance Criterion) and FRAC (Frequency Response Assurance Criterion), which are estimated by operating directly on the frequency response functions. Quantification of the level of correlation between the models of the damaged and the undamaged system allows for damage detection. In [17], Worden presented a damage identification method that employs a transmissibility function. As the method main advantages the possibility of examining objects under operating conditions on the basis of the vibroacoustic signals and the lack of the necessity of a numerical model formulation can be considered. Other techniques based on a transmissibility function estimation were presented in [18,19]. Taajobian et al. [20] proposed a fault-diagnosing method for mechanical parts based on the statistical techniques and artificial neural network that allow for the extraction of information from the vibroacoustic data. The technique is low cost, quick and very accurate. A wide range of diagnostic vibration-based methods are techniques based on modal models. They find applications in structural health monitoring and allow the detection and assessment of damage by observing changes in the modal parameters of the considered system, such as natural frequencies, mode shapes and modal damping factors. Modal analysis is used to investigate the technical state of many different objects such as wind turbine blades [21], engine cylinder blocks [22], bridges [23], reinforced concrete containers [24], masonry structures [25], composite components [26] and many others. Historically, novel solutions in the field of construction state monitoring have been introduced mainly in the areas threatened by the occurrence of natural disasters and unfavourable geological structures, as well as in cases of the longest, highest and largest engineering facilities in the world. In the following years, monitoring of technical conditions has begun to be introduced to facilities with a high risk of loss of load-bearing capacity, where a failure would threaten health or life. Such structures include mainly hanging bridges and skyscrapers [27,28]. In the case of bridge crossings of significant lengths of spans, sometimes reaching up to 2 km, the highest care for the safety of users becomes indispensable, since neglecting any premises for failure may be catastrophic.
Additionally, the supporting structures of power lines, due to their great economic importance, are the objects that constitute a significant problem in technical diagnostics. Their structures are complex, often composed of more than four hundred beam elements connected by both welded and screwed connections. Such structures are anchored to the foundation, which has a significant impact on ensuring the proper dynamic behaviour.
Frequently, it happens that the conditions of the pole’s foundation work change in the course of exploitation, due to foundation washing, subsidence or underground work (mining works, construction of tunnels, underground reservoirs, shelters, etc.), which is why diagnostic tests should also take into account this part of the structure.
On the other hand, the impact of power wires suspended on the pole crown has a huge influence on the behaviour of the entire structure. Long wires can be treated as additional resonance systems that can influence the dynamic responses of the poles and the entire structure of the power line. Both factors, i.e., the influence of foundations and wires, significantly complicate the analysis of dynamic properties of power line poles since the measured responses of such constructions combine various phenomena generated by various mechanisms [29].
The paper is organised in the following way: the first two sections concern the issues related to condition monitoring and SHM of the power line supporting structures and the methods of testing the large, full-scale engineering structures. In the third section the details of the carried out identification experiments are presented. In the following section the novel method for synchronizing the measured system responses to impulse excitation is discussed. The results of the investigation into the power line supporting structure dynamic properties are presented in Section 5. Finally, the paper is summarised and concluded in the last two sections: “Discussion” and “Conclusions”.

2. Methods of Testing Large, Full-Scale Structures

Testing the large, full-scale structures is usually an expensive and time-consuming task. A tower testing station allows to verify the design conditions and performance of a transmission tower under a given static load. The largest stations in India, China, Brazil, Saudi Arabia and other countries are capable of testing transmission towers more than 70 m high, with voltage ratings up to 1200 kV. The hydraulic actuators that apply the transverse loading to the tower can generate the maximum overturning moment from 12,000 to over 60,000 ton.m [30]. In Poland, Szafran [31] performed an experiment in order to establish the failure mechanism for a 40 m-high lattice telecommunication tower under the breaking load. These experiments can ensure a higher level of structural reliability for construction, and validity of major design assumptions and numerical models. However, the static test cannot provide the full information about the tower behaviour under dynamic loads, which has boundary conditions that in theoretical models are usually simplified to the rigid or articulated joints [30,32]. In the case of transmission towers, the influence of conductors on the construction is also vital.
The major problem related to the experimental dynamic analysis of large, full-scale construction is to deliver the sufficient amount of energy to the structure over the desired frequency band. The common approach consists of taking advantage of the operational conditions that affect the structure which, in the case of towers, is usually the wind. The studies based on the wind-induced vibrations were performed for steel transmission towers [33], an RC control tower [34], the 432 m-high Guangzhou West Tower [35], the 610 m-high Canton Tower [36], a super-large cooling tower [37] and others. The experiments under operating conditions provide the in situ measurements with natural boundary conditions and excitation. On the other hand, it is assumed that excitation covers the frequency range of interest, and usually, long time histories are required [38]. Because of the random character of wind, it is not possible to gain control over this phenomena and, therefore, the measurements can take a very long time while waiting for a moderate wind.
The controlled excitation can be obtained with the use of shakers or over the course of the impulse tests. The hydraulic shakers are often applied to experimental investigation into the seismic response of the reinforced concrete buildings [39]. However, usually such experiments are limited to the part of the structure due to the size, weight and strength of the objects. The shaker testing provides a great variety of input signals, but the experiment setup is complex while the research itself is time-consuming and expensive due to the need for an advanced measuring system and highly qualified operator. Impact hammer testing is a commonly used technique, especially in field measurements. It is relatively inexpensive, quick, easy to carry out and, what is most important, there is virtually no influence of the system dynamics on the input [1]. The main issue of this method is to deliver enough energy in order to induce the vibrations of a large, full-scale structure. Therefore, the very high peak forces may lead to local damage of the tested structure.
The alternative impulse testing to hammer impact testing is the pluck test, which is also called “the pull-and-release test”. The application of pluck loading, which is similar to impact loading, results in excitation of many modes of the structure of interest [40]. This method is typically used in determining dynamic properties of trees [41,42]. Natural frequencies and damping coefficients were computed from the acceleration time histories of a freely swaying light pole N96 [43], a monotubular, conical lighting column, a tapered lighting column, a 30 m-high geo tower [44] and a wind turbine blade [45]. The pull-and-release method is well suited for linear, lightly damped systems [46]; however, it is not widely used in the modal analysis of transmission towers.
Experimental investigation into the dynamic properties of large technical structures usually requires application of the operational techniques. In such a case, in order to estimate the modal model, the usage of a broadband white noise excitation is assumed. Frequently, such an assumption is not satisfied in the real exploitational conditions and, what is more, the excitation amplitudes are often too low. Examination of objects with the application of random inputs (e.g., wind) makes it difficult to obtain a sufficiently wide frequency band of the excitation or requires long-term measurements in order to allow the usage of statistical procedures, which is a certain inconvenience of tests under the operating conditions. It should be remembered that the sufficient amount of energy should be supplied to the system to excite all the important mode shapes. It is, therefore, very important to obtain an additional, and at least partially controlled, force signal. In the case of the approach presented in this paper, the additional energy associated with bringing the power line supporting structure out of the equilibrium position by means of the pretensioned rope and the subsequent release of this tension provides the system responses in the form of the decaying free vibrations. The literature survey indicates the lack of commonly used impulse methods in dynamic testing of large, full-scaled supporting structures.
The measurements provide the response signals only; however, it is important that the information about the nature of these responses can be additionally used. The classical processing of response signals with the application of the statistical procedures, leading, in turn, to the estimation of the modal model on the basis of the correlation function or spectral densities, introduces an additional bias to the estimators. Introduction of additional information concerning the nature of the excitation and taking it into account in the course of the identification procedure should allow for the reduction of this bias. In the research presented in this paper, additional information about the nature of the excitation was introduced through the usage of a pseudo-impulse modelling of the excitation of the considered object’s free vibrations. Normalisation and synchronisation of the assumed pseudo-impulse made it possible to use the classical formulation of frequency response functions (FRFs) in the process of modal model estimation. The paper also concerns the influence of the usage of additional information about the nature of the excitation on the modal model estimation process. To assess this influence, the results and stabilisation process of two procedures were compared. In the first estimation procedure, only measured system responses were used, whereas in the second, additional information concerning the nature of the applied excitation was taken into account.

3. Identification Experiment

Experimental research was carried out for the real supporting structure in the continuous use: twin-conductor, B2-type support of the overhead, high-voltage (110 kV) transmission line, which allows for the transmission of components of lateral forces resulting from the tension of cables bending at angles different from 180°. The considered supporting structure was made of bolted and welded steel angles and was fixed to the foundation by means of the welded joints and anchors (Figure 1 left). The influence of the cable tension force related to the temperature or other atmospheric conditions was not taken into account during the tests.
The measurements were carried out at an air temperature of approximately 20 °C, in windless conditions. On the supporting structure, after visual inspection, no mechanical damage to the elements and connections of the truss was found. Three triaxial ICP accelerometers (PZB Piezotronics) were mounted on the three corner angles of the tested object (Figure 1) and connected to the National Instruments 12-bit measurement card (NI PCI-6024E 12-Bit DAQ Card). The measurement data were collected in 11 repeated measurement series with a sampling frequency of 10 kHz. In each series, measurements were made at three selected points on the tested structure in three orthogonal directions of the assumed Cartesian coordinate system. For the assumed sampling of signals at the level of 10 kHz, time series containing about 146,000 samples were obtained. Signal processing was performed in the MATLAB environment with the use of the Signal Processing Toolbox and proprietary algorithms. The modal model parameters were estimated using the VIOMA toolbox.
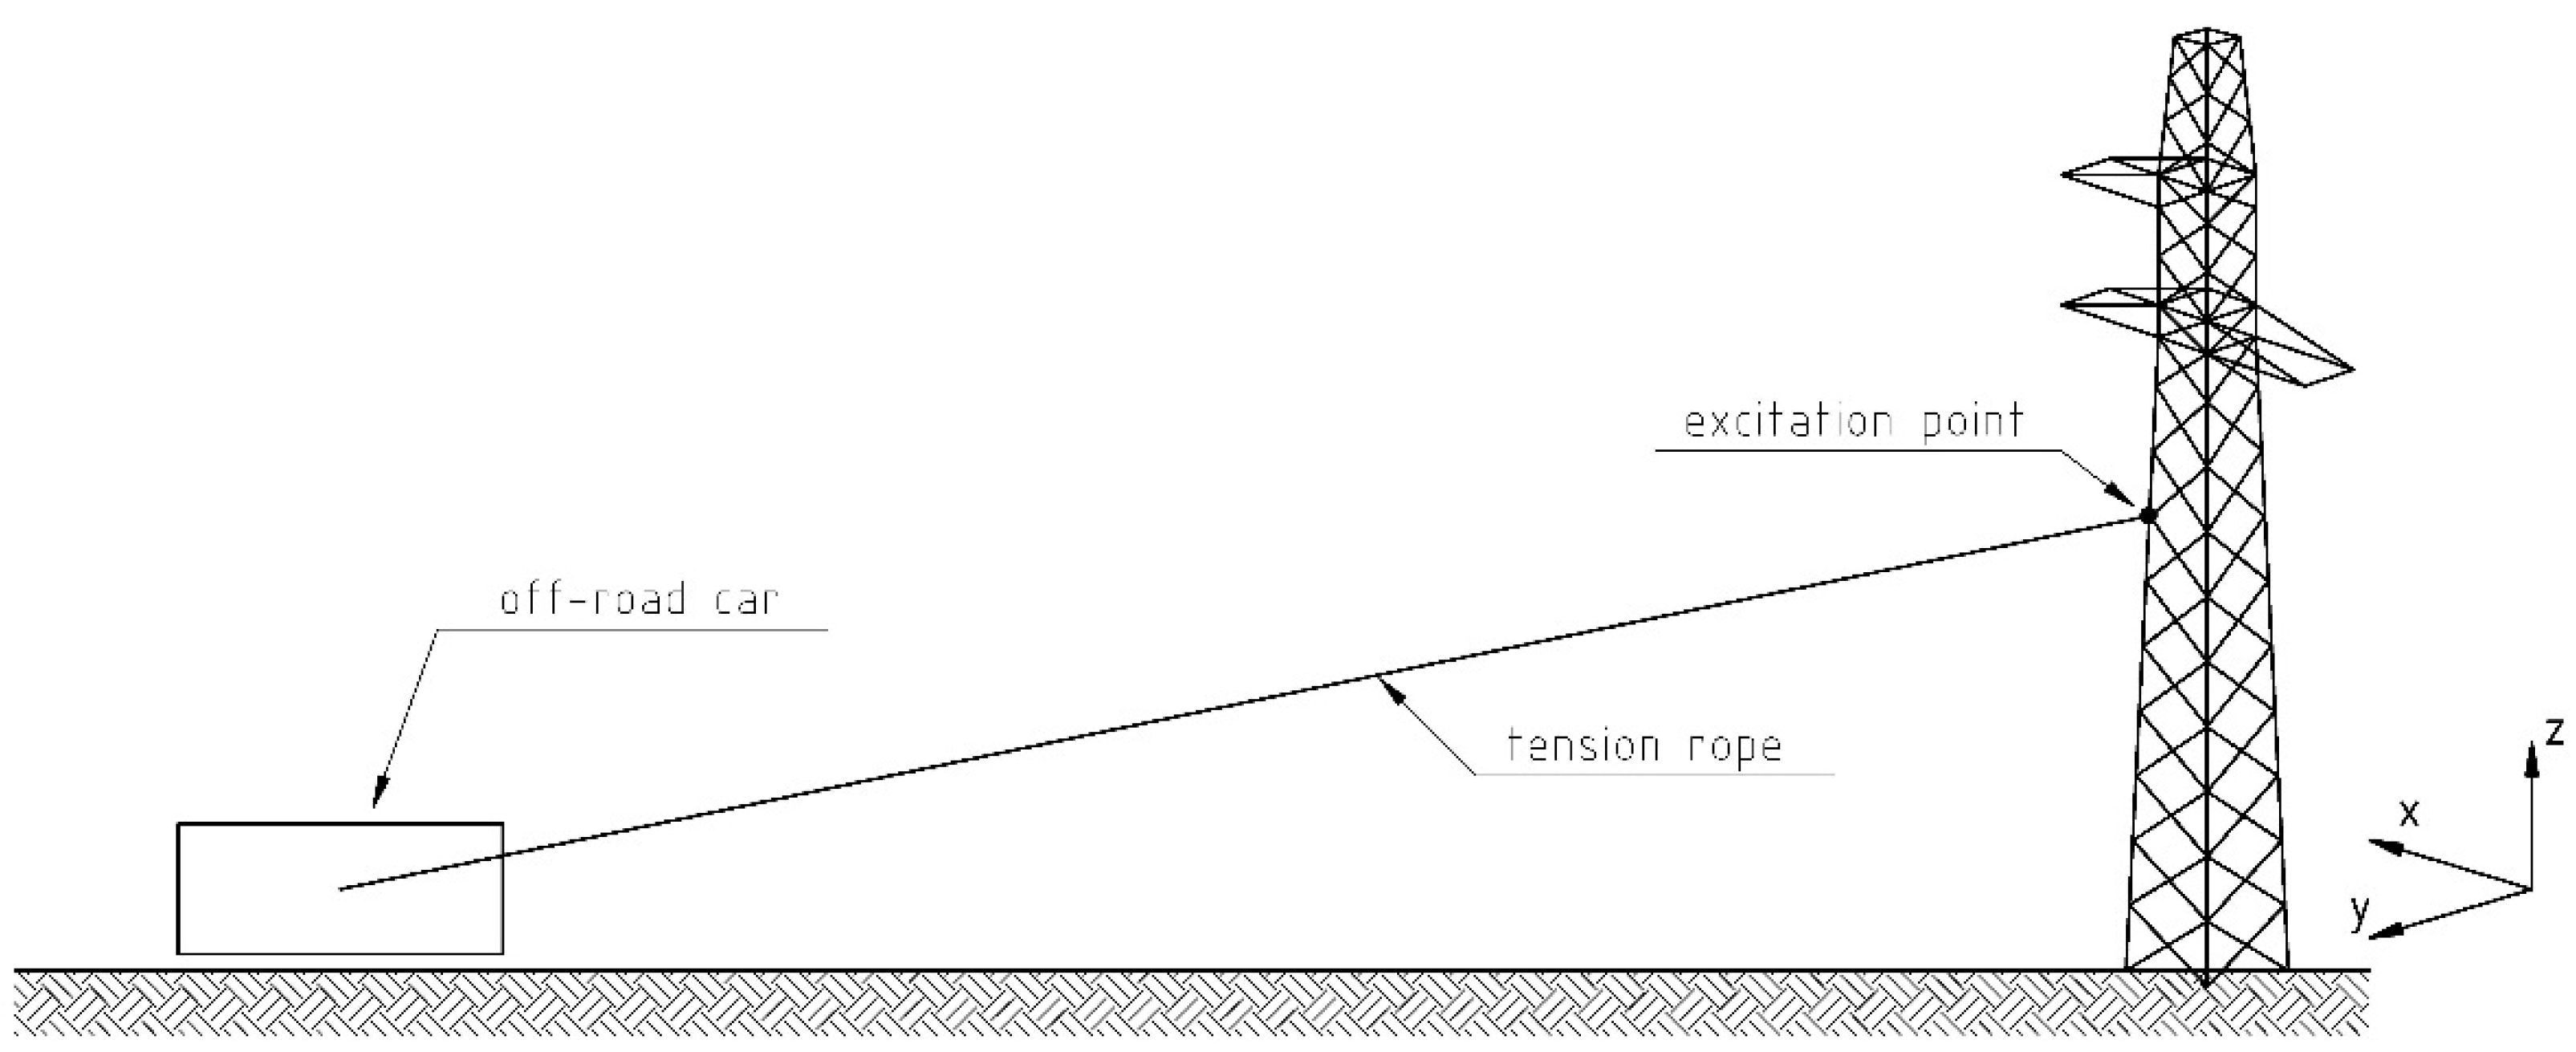
In the course of the carried out experiments, the system of interest was excited to vibrations by tensioning the rope attached to the structure and, subsequently, releasing it (Figure 2). Measurement points (sensors) and the point of excitation application (rope attachment) were located in the middle of the structure’s height (in the same cross-section, Figure 3).
Time histories of system responses to impulse excitation were collected in 11 measurement series. In each series, measurements were performed for the three selected points on the tested structure in three orthogonal directions of the assumed Cartesian coordinate system. A sampling frequency of 10 kHz was assumed.

4. Proposed Method

Non-destructive damage detection and identification methods play a vital role in the assessment of the physical system’s technical condition. They find applications in the condition monitoring systems for both newly-developed and worn objects, which are often on the border of their operational lifetime. Early fault detection and diagnostics allow for detection of impending emergency states and minimisation of downtime periods [47]. The selection of a suitable identification method from the variety of available methods depends on the system’s structural and material properties as well as the types of damage that may arise in the considered system. In recent years, much attention has been paid to the development of damage detecting methods based on the measurements of acoustic quantities and vibrations, as well waves propagated in the considered system [47,48,49].

4.1. Classical Modal Analysis Methods

In the carried out research, the output-only methodology of modal identification was used. Before determining the cross-spectral densities, the signal sampling was reduced by decimating it to a sampling frequency of 200 Hz, which resulted in the useful analysis bandwidth of 100 Hz.
Estimators of cross-spectral densities were computed with the use of the periodogram method [50] on the basis of all the available 11 measurement repetitions. In order to estimate the considered system’s natural frequencies and modal damping factors, the LSCE and BR methods were used [46].

4.2. Proposed Pseudo-Impulse Approach

In the proposed pseudo-impulse approach, additional information concerning the applied excitation was used. The system of interest was excited to vibrations by tensioning the rope attached to the structure and, subsequently, releasing it suddenly. As a result, after the release of the rope, the structure performed free vibrations related to the system’s return to the state of equilibrium. From the point of view of data analysis, such a situation is equivalent to the analysis of the system’s responses to the impulse excitation [51,52]. It was assumed that in the course of the analysis, the pseudo-impulse was generated and used for the purpose of the pseudo-frequency response function’s estimation.
The usage of a pseudo-impulse can only make sense in the case of accurate synchronisation of time histories obtained in subsequent partial experiments. In order to synchronise the measured time histories of system responses, it was necessary to perform the following computational steps:
  • Selection of the reference signal, on the basis of which synchronisation is carried out;
  • Determination of synchronisation points (cutting times);
  • Signal decimation [53];
  • Addition of a pseudo-impulse;
  • Estimation of the pseudo-frequency response function.
Computational steps required by the proposed method for processing measured system responses to impulse excitation are presented in the form of a flowchart in Figure 4.
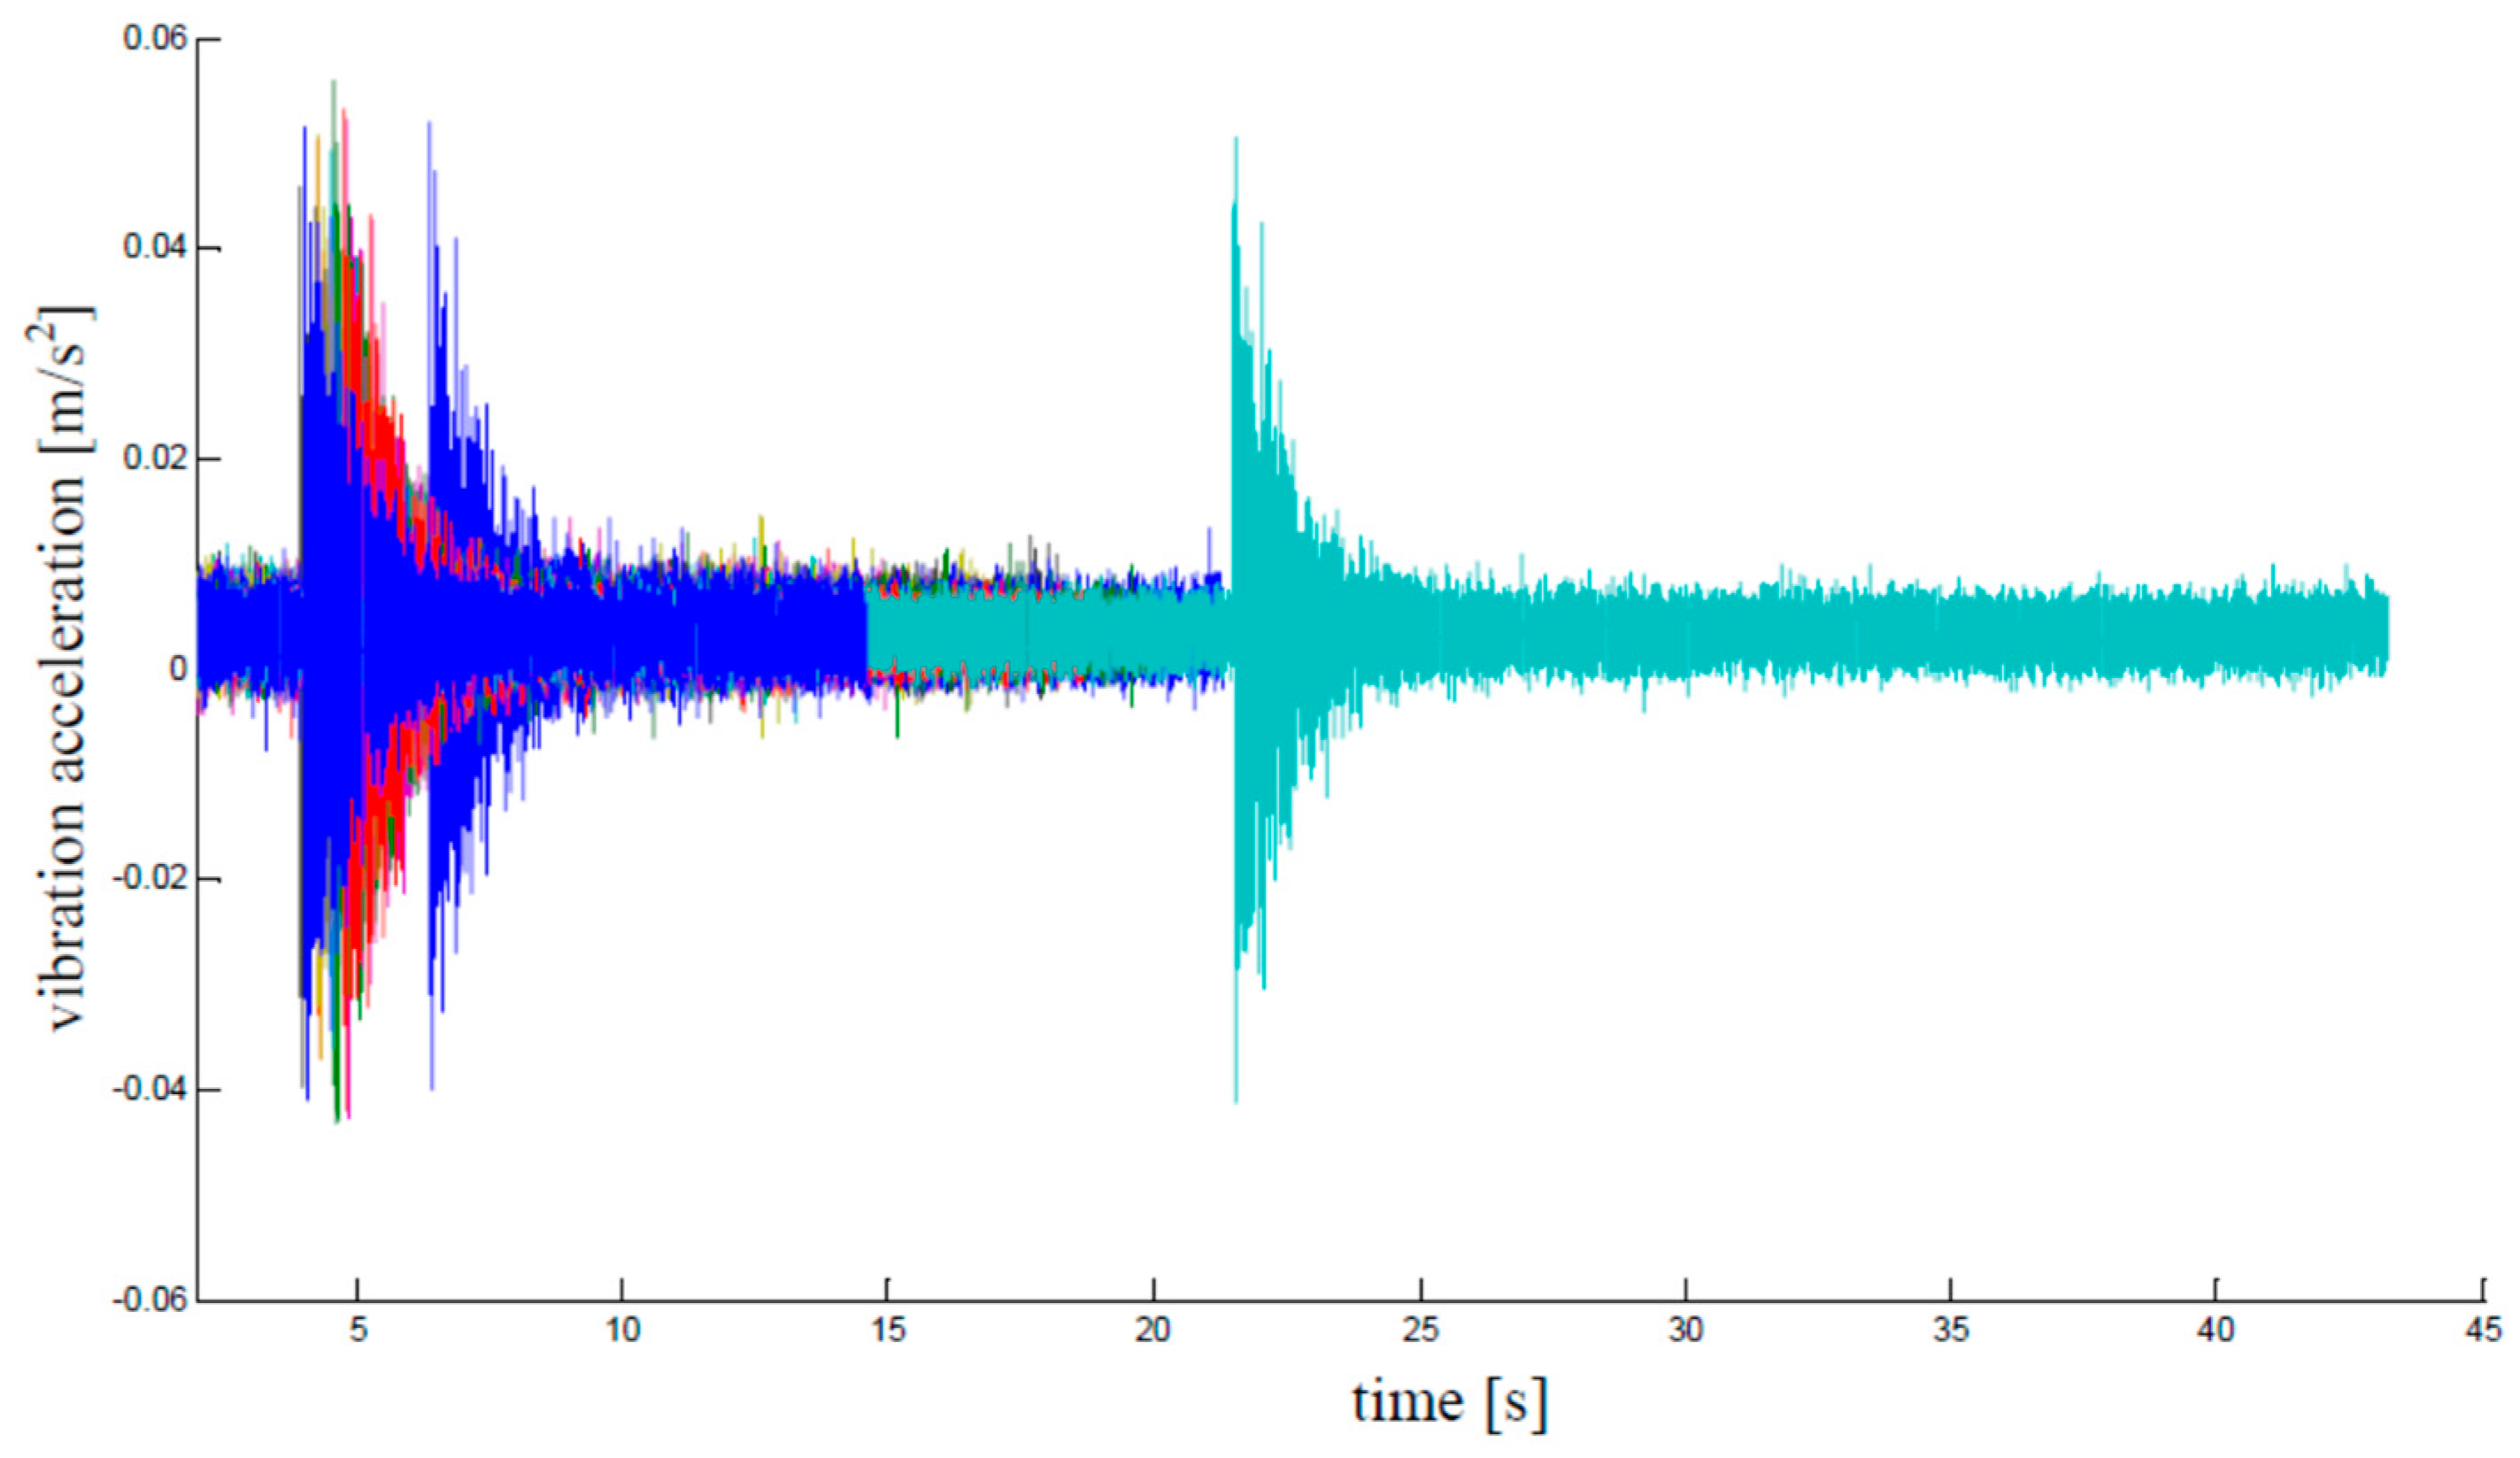
The first step of the proposed approach consists of the selection of the reference signals, on the basis of which data cutting times are determined. On the basis of all the measured response time histories being available (Figure 5), it was necessary to select the point and direction for which all measurement repetitions have:
-
The best signal-to-noise ratio;
-
The steepest slope associated with the increase in response amplitude after the rope releasing.
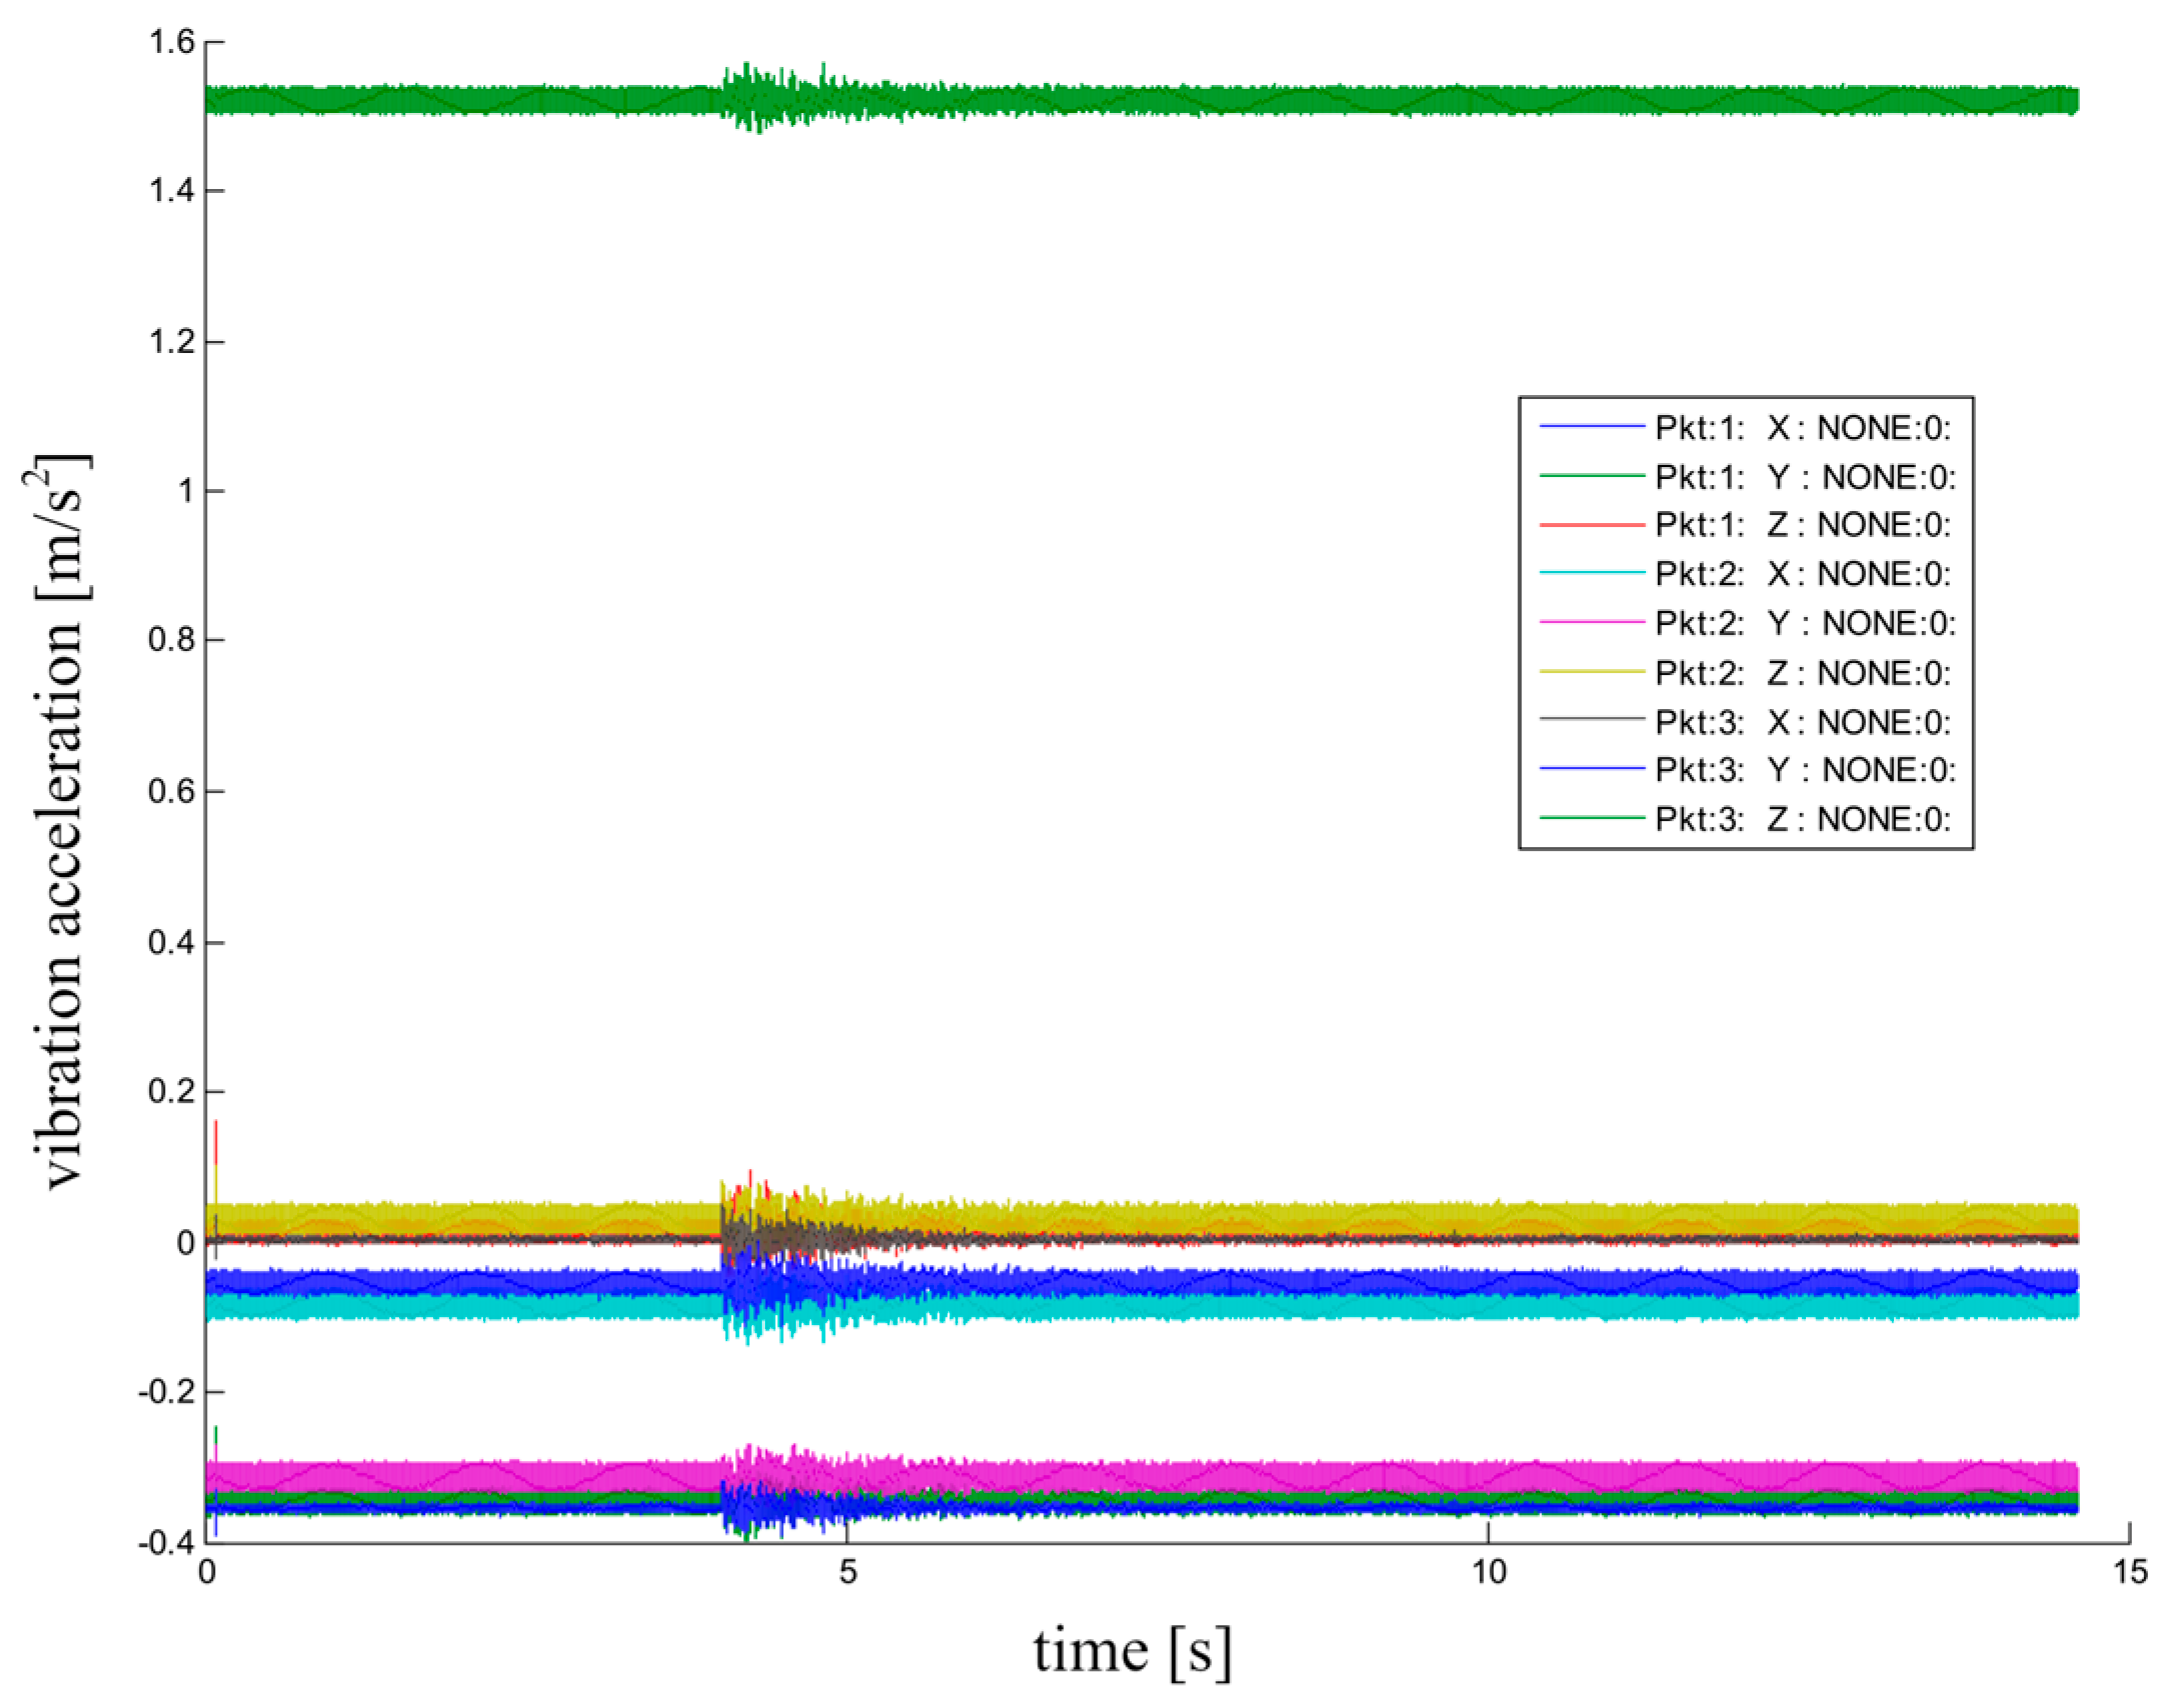
Figure 5. System responses at all the available measurement points.
Energies 15 05707 g005
System responses at all the available measurement points are presented in Figure 5. From the point of view of the best signal-to-noise ratio, the third measurement point and the OX direction were selected.
Determining cutting times is an operation that has a decisive impact on the synchronisation of data collected in the subsequent partial experiments. In order not to worsen the synchronisation parameters, it should be performed for a natively sampled signal since decimation reduces its time-domain resolution.
In Figure 6, time dependencies between system responses measured at the reference point in all the 11 partial experiments are presented.
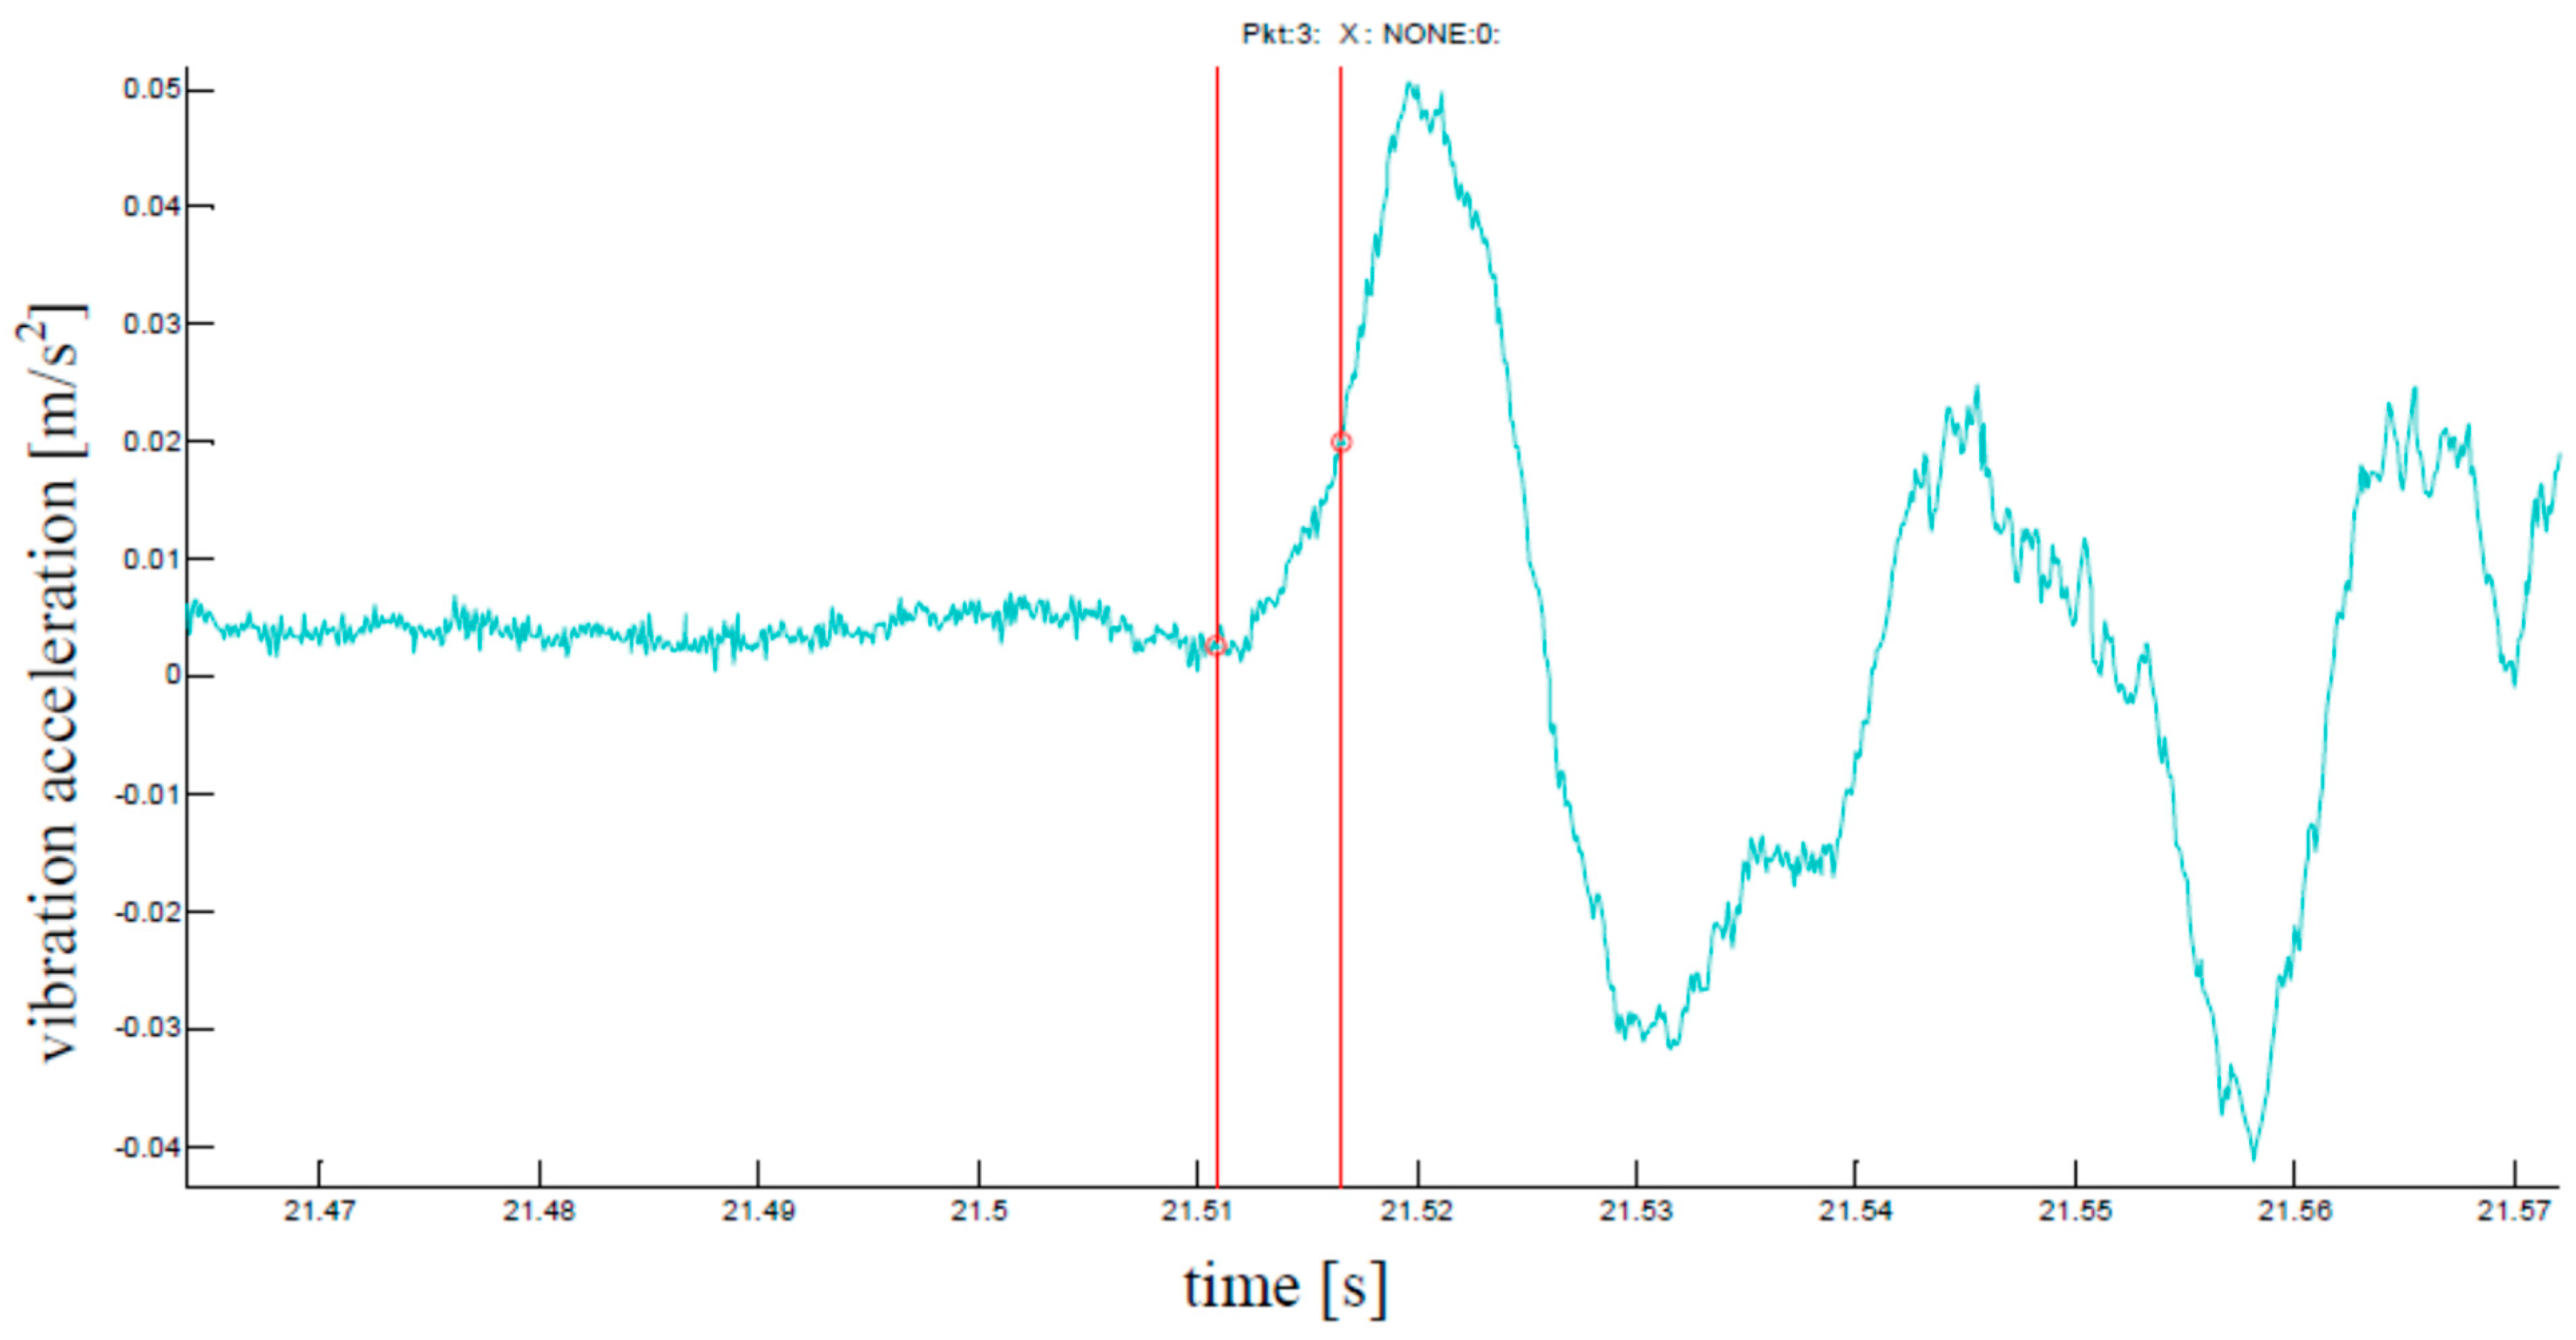
As a reference level, the value of 0.02 m/s2 was assumed. It was assumed that 0.005 s before the determined point, a marker of excitation was added. Classically, this operation is associated with setting the pre-trigger for the excitation signal. Time instants associated with the beginning of the response signal amplitude that increase and reach the assumed reference level are presented in Figure 7.
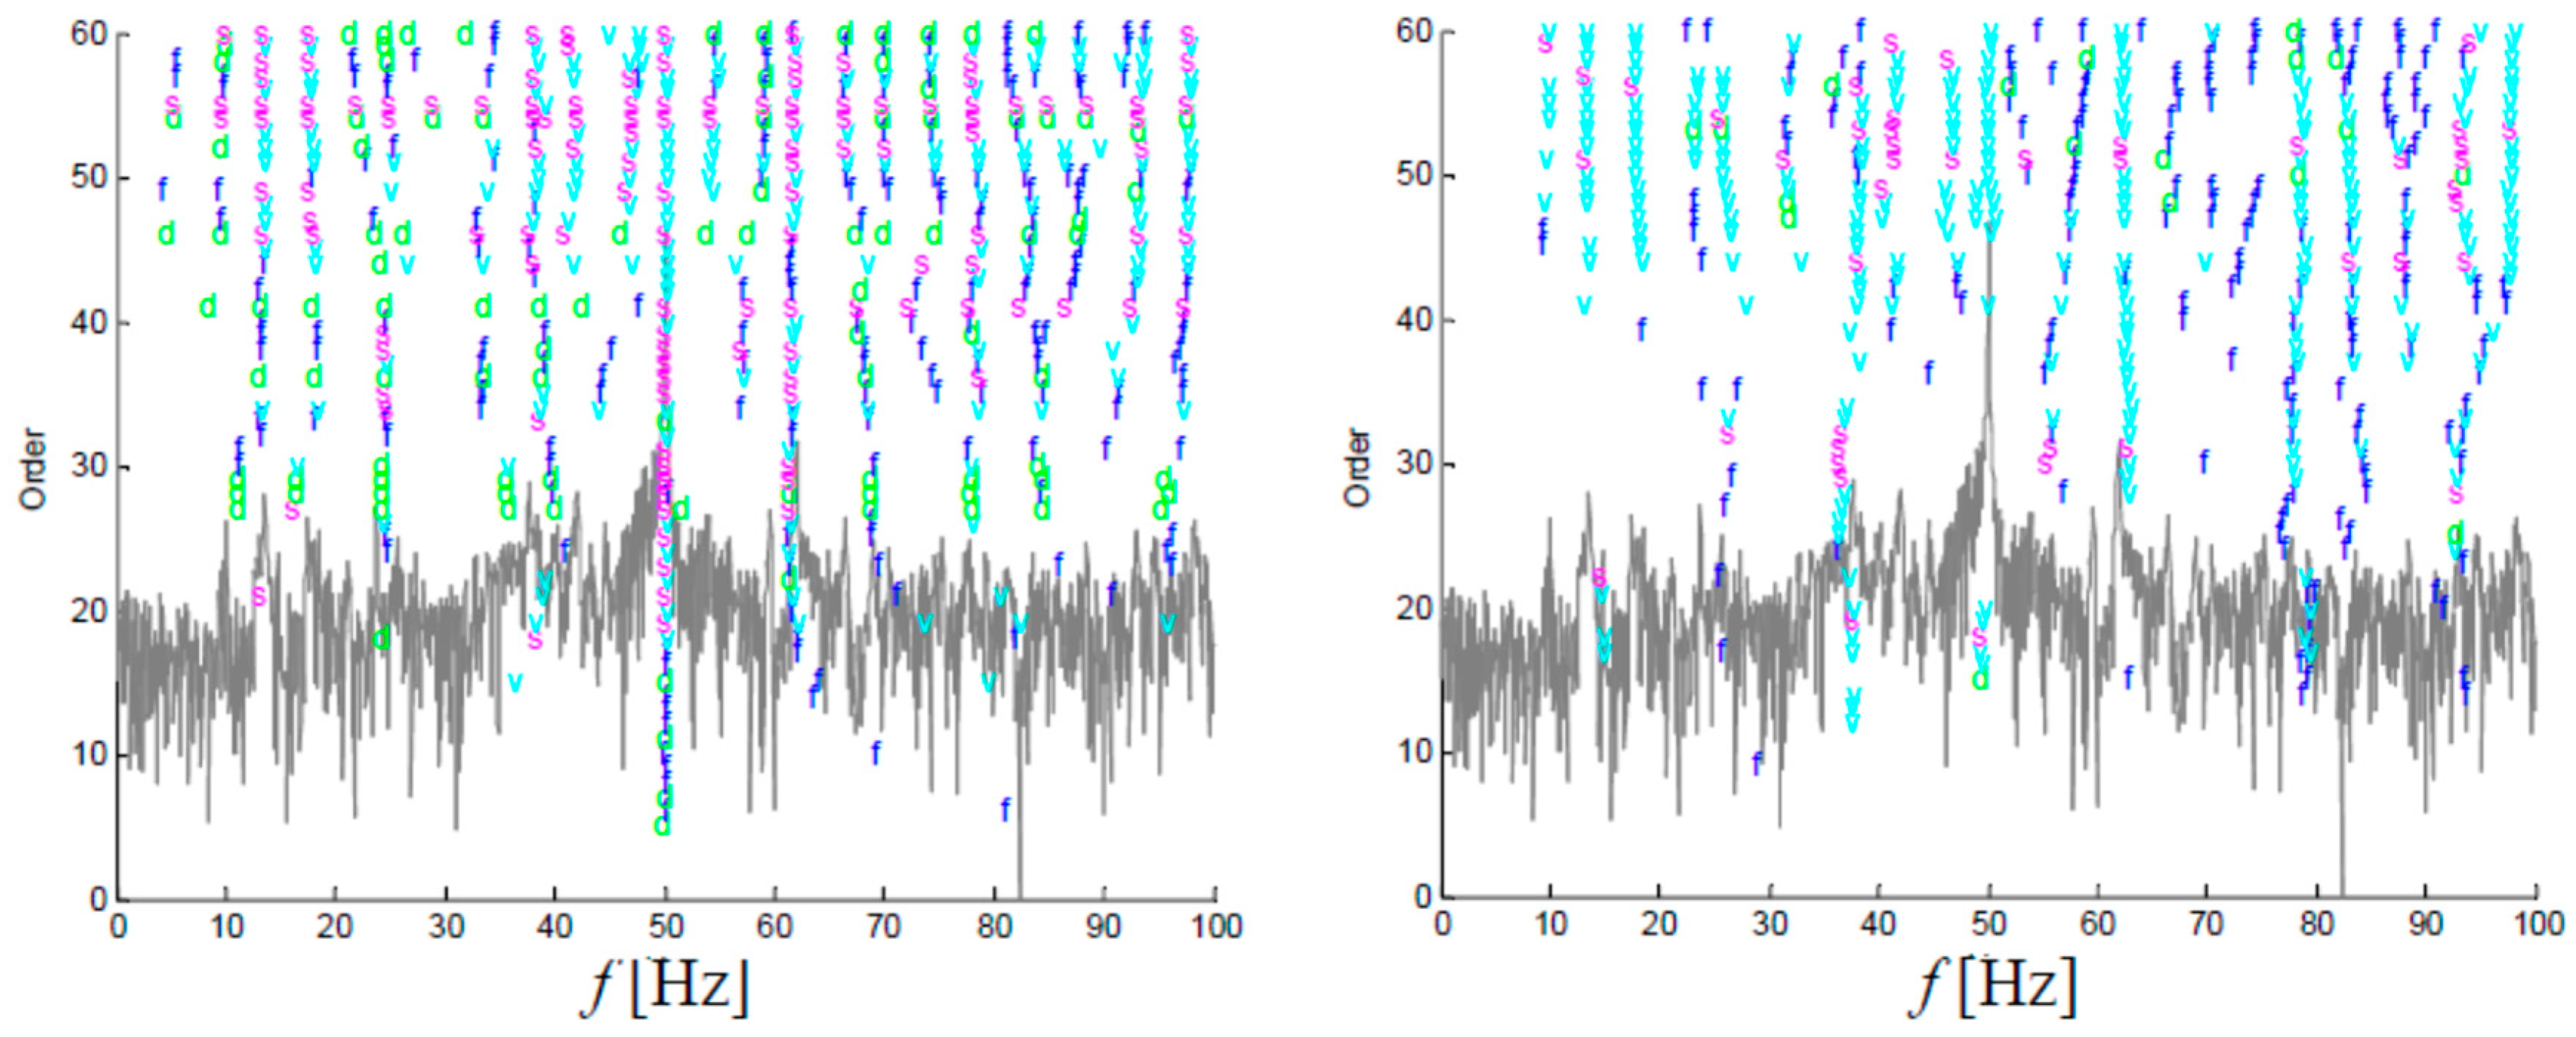
The following step of the discussed algorithm consists of signal decimation. Due to the high sampling frequency of 10 kHz, signal dynamics in low frequencies are masked by the system behaviour in the higher frequencies. This issue is presented in Figure 8, where it is clearly visible that the estimation of modal parameters in the broad frequency band makes it possible to stabilise system poles in the high frequency band only. The idea of the stabilisation diagram method consists of performing the complete pole identification process using the models of increasing order. The symbols used for indicating the poles on the diagram have the following meanings: o—new pole, f—stable frequency, d—stable frequency and damping, v—stable frequency and eigenvector and s—all criteria stable.
In order to improve the discussed situation, signal decimation can be performed [48]. In the course of the signal decimation the low pass filter should be used, which protects the signal against aliasing [54].
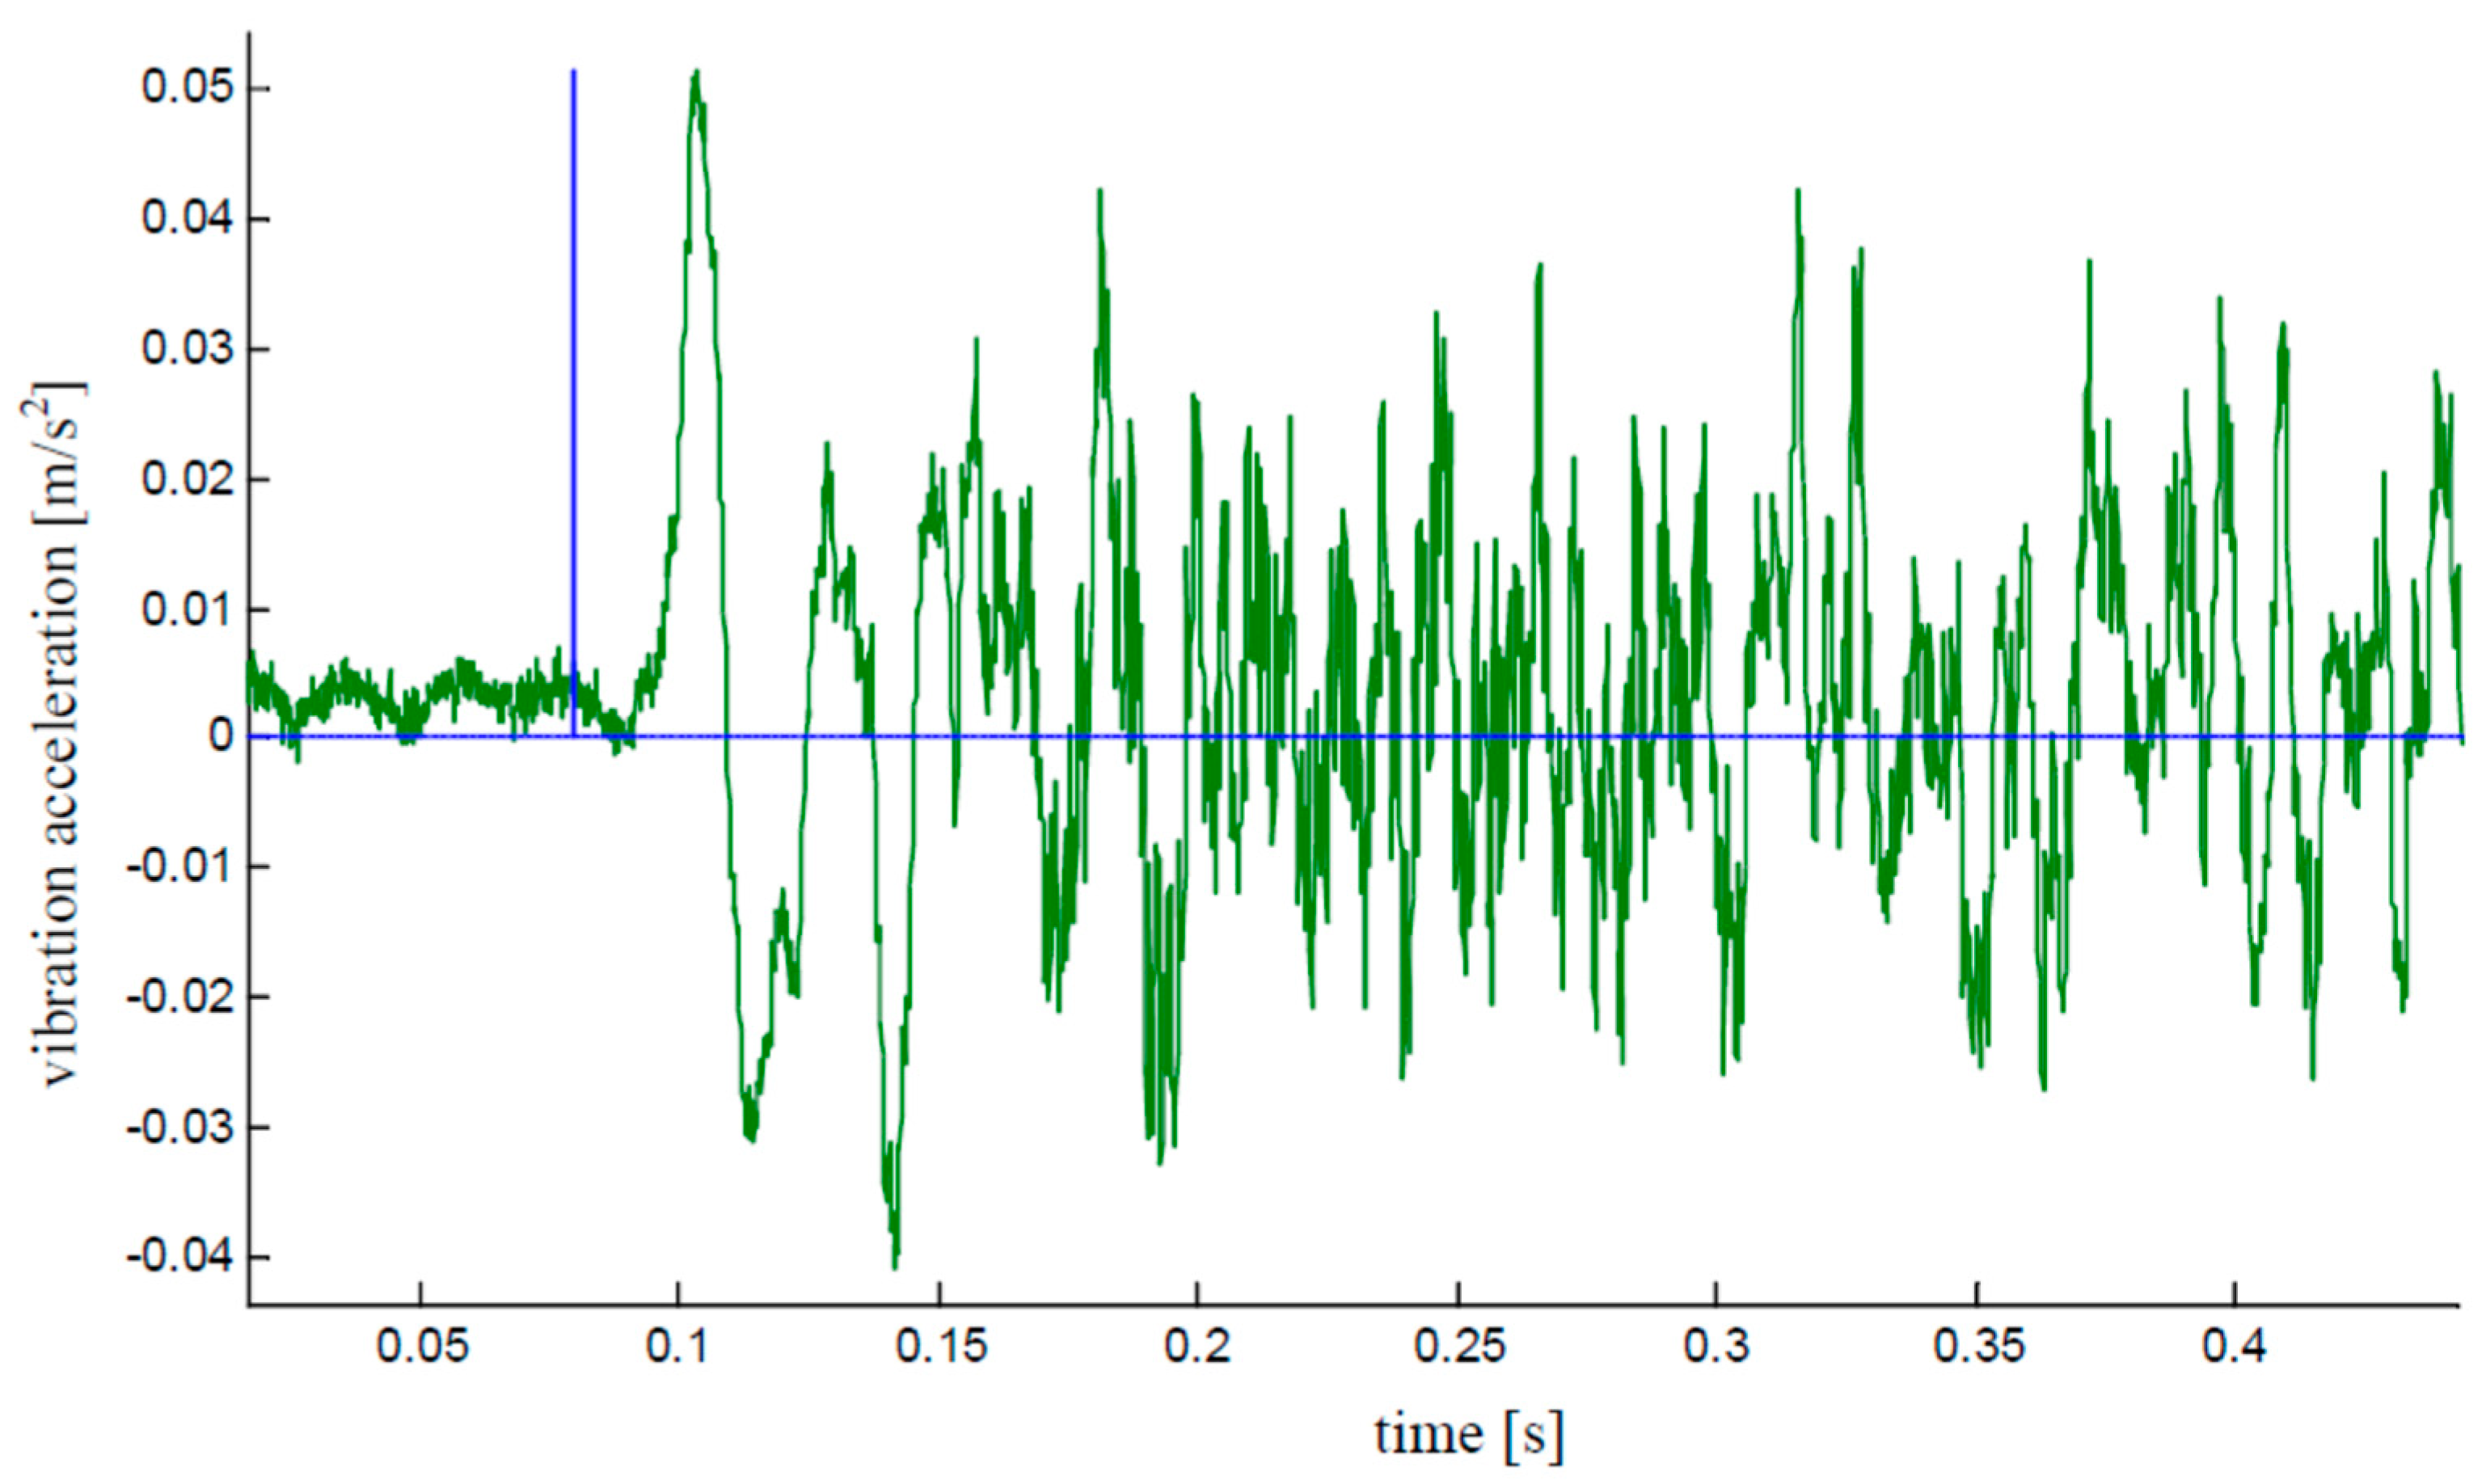
Measurement data were collected during 11 measurement sessions. In each series, the object was brought out of equilibrium, and then, after removing the static force, returned to the equilibrium position by performing free vibrations. Due to the different values of force leading the system out of balance, the amplitudes of free vibrations in each of the measurements were different. In order to normalise them, a pseudo-impulse was introduced, the amplitude of which depended on the maximum amplitude of the signal selected as the reference. Adding a pseudo-impulse to the previously assumed cutting time allowed to maintain phase relations for all the time histories for a given experiment session. Moreover, introduction of the pseudo-impulse allowed for the estimation of the frequency response function, which should significantly improve the quality of the estimation of modal parameters. The generated pseudo-impulse should guarantee that it “overtakes” the beginning of the rise of the slope of all the system response time histories. Therefore, it was additionally accelerated by 100 ms. Figure 9 shows an example of the generated pseudo-impulse and response time history.
The fifth step of the proposed algorithm consists of establishing the pseudo-frequency response function. Frequency response functions are computed based on the system responses to the provided excitation. In the case of the considered identification experiment, the excitation is simulated by the pseudo-impulse, which is treated as the excitation signal. Measured system responses provide information on the dynamics of the examined object. In the course of the frequency response function estimation, two approaches minimizing bias of an estimator can be used: averaging in the time or frequency domain. Averaging in the frequency domain is used in cases of operational measurements for which it is not possible to synchronise data collected during the experiment, e.g., due to system excitation with white noise. A classic example of this type of estimation is the Welch method [55] or the periodogram method used for estimation of spectral density. In this method the signal is divided into frames. Each frame is transformed to the frequency domain with the application of the Fourier transform, and after the transformation, averaged with subsequent frames. If the data can be synchronised, time-domain averaging can be applied.
For signals with a large noise component, the time-domain averaging approach can give better signal smoothing effects. In this approach, the estimator of the frequency response function is obtained by transforming the already averaged signal. As an example of a common application of time-domain averaging, the impulse test can be considered. In the approach proposed in the paper, data synchronisation and the use of a pseudo-impulse also make it possible to use time-domain averaging.
In Figure 10, the set of synchronised data collected during all the 11 experiments for one selected measurement point on the structure is presented. Figure 11 shows a comparison of frequency response functions estimated with the application of the discussed methods of averaging. It is clearly visible that for both averaging methods, practically the same results of frequency response estimation were obtained.
The authors’ experience in estimating modal parameters based on the waveforms in the frequency domain shows that increasing the frequency resolution above 8 spectral lines per Hz does not improve the quality of the estimated parameters of the modal model. Therefore, in the performed experiment, the FRF functions were estimated in such a way that the frequency resolution was at the level of 0.125 Hz. Frequently, the frequency resolution criterion is also used as an indicator for the selection of the window length in the time domain.
The last step of the proposed algorithm consists of the estimation of modal parameters on the basis of the pseudo-frequency response functions. For this purpose, classical methods of modal analysis can be used. It should be stressed that despite the usage of classical modal analysis algorithms, the obtained modal model is not scalable. Such a situation results from the fact that the pseudo-impulse amplitude was assumed arbitrarily: although it helps in normalizing the measured signals, it does not allow for scaling them.

5. Estimation Results

In this section, the estimation results in the frequency range from 0 to 100 Hz are discussed. Apart from the system modal parameters, stabilisation diagrams are presented as an indicator related to the quality of input data for modal analysis procedures. Due to the fact that the measurements were carried out at three points on the structure only, it was not possible to visualise the system’s mode shapes over the course of the analysis.

5.1. Exploitational Approach

An operational approach was implemented due to the lack of the measured excitation signals. It should be stressed that the exciting force was different for each identification experiment and, due to its exploitational character, impossible to measure. Two algorithms for modal parameter estimation were used: LSCE and BR. Estimation results were verified by means of the stabilisation diagram method. Stabilisation diagrams resulting from the estimation of modal parameters are presented in Figure 12.
It is clearly visible that both stabilisation diagrams (Figure 12) are difficult to interpret. On the one hand, many pole lines are obtained, but on the other hand, the modal parameters exhibit great variability.

5.2. Application of Pseudo-Impulse

As the result of the pseudo-impulse approach application (Figure 13), the pole lines are stabilised more clearly than in the case of the operational approach, which indicates less variability of the estimated modal parameters. In the case of the LSCF algorithm, the lines are completely clear, without additional calculational poles. It can be assumed that the introduction of an additional pseudo-impulse signal improved the quality of the estimated modal parameters in this case.
Table 1 and Table 2 present the results of the modal parameter estimation. In the consecutive rows, the corresponding poles of the modal model are gathered. As the main comparison criterion, the frequency at which individual poles appear was assumed.
For the purposes of the modal model estimation, in both considered cases, two estimation algorithms were selected. In this way, it was checked whether the choice of a specific implementation of the modal analysis algorithm had no direct influence on the obtained modal model. When reviewing the data in the tables of results, it seems that in both considered cases, both algorithms worked in a consistent manner and the obtained results were related to the interpretation of information carried by the dynamics of the tested object.

6. Discussion

For the operational approach, the LSCE (Last Squares Complex Exponential) and BR (Balanced Realization) algorithms were assumed, while in case of the approach with the pseudo-impulse the LSCE and LSCF (Last Squares Complex Frequency) algorithms were applied. The LSCE algorithm requires the analysis of the set of decaying waveforms of the responses of the tested system, thus in this case it was an obvious choice. The operational version of this algorithm is based on the autocorrelation and cross-correlation functions as input. In this case, the data pre-processing procedure for the algorithm is described in Section 4.1. According to that procedure, for the purposes of the correct normalisation of the data, it is necessary to determine the power spectral density and cross-power spectral density functions for the measured system responses, where one of the arbitrarily selected responses is treated as a normalizing signal. Then, after the averaging, the frequency waveforms are transformed back to the time domain. The BR algorithm is also performed in the time domain for the correlation functions. In this algorithm, the determination of the stochastic subspace and its analysis are of key importance.
In the case of the data analysis based on the assumed pseudo-impulse, correlation analysis was avoided. In this case, the normalisation was performed not on the basis of arbitrarily selected response characteristics, but by controlling the maximal values of amplitudes obtained by means of introducing the initial tension in the exciting system. Moreover, application of the pseudo-impulse made it possible to use the classical procedure of determining the frequency response functions (FRFs). Additionally, in this case, for the purposes of applying the LSCE algorithm, it was necessary to perform the transformation back to the time domain and to use the impulse response functions. However, in the case of the LSCF algorithm, also known as POLYmax implementation, transformation back to the time domain was not required due to the fact that the LSCF algorithm is performed in the frequency domain. Nowadays, the LSCF algorithm is recognised as one of the most stable algorithms for modal analysis, characterised by obtaining very clear stabilisation diagrams that minimise the operator’s influence on their interpretation.
Analysis of the modal model parameters’ estimation results in the considered cases proved that the application of the pseudo-impulse improves the conditioning of the input data. It results in the better readability of stabilisation diagrams, as well as in a better stabilisation of the poles that are not clearly represented in the input data. The comparison of stabilisation diagrams for the classical and proposed approach shows that the usage of the pseudo-impulse results in stabilisation of the pole lines for the lower order and appearance of the stable pole lines, which are absent in the case of the classical operational approach. Clearly, the analysis of stabilisation diagrams results directly in the number of poles listed in Table 1 and Table 2. The most important cases are the ones in which the analysis based on the applied pseudo-impulse allows for the visualisation of poles which are non-detectable in the case of the classical analysis. In this case, in the analysed frequency range, the following poles can be indicated: 20, 23, 24, 30, 41, 43 and 45, which were estimated only by means of the proposed procedure. It should also be stressed that in other cases, where the poles are estimated by all the algorithms used in the test procedure, the obtained modal parameters are stable and repeatable.

7. Conclusions

Examination of dynamic properties of large technical structures with the application of random excitation usually does not meet the requirements concerning sufficient broadband energy excitation. On the other hand, the commonly used impulse methods often require good repeatability and/or input signal measurement. In this paper, the authors proposed the pseudo-impulse method that allows to determine modal parameters of large, lightly damped constructions. The experiment was conducted for a full-scale transmission tower, and the results obtained by the proposed method and classical methods were compared. The conclusions drawn from the study are summarised as follows:
  • The proposed method is suitable for investigation into dynamic properties of large, lightly damped mechanical structures, such as supporting structures of power lines.
  • In comparison to the methods in which operational excitation is used, in the proposed approach vibrations of the structure of interest are forced by means of wide-frequency-band excitation, providing enough energy to excite individual natural mode shapes in the tested range. A single measurement series is short and there is no need to wait for the appropriate operating conditions (e.g., wind).
  • The input parameters (rope release time and pulling force) are unknown and different in each test. The pseudo-impulse method is independent of the excitation parameters.
  • The most important steps of the developed algorithm are the synchronisation of the output signals in the time domain and the amplitude normalisation, which enable averaging the characteristics from individual measurements.
  • The stabilisation diagrams show that the usage of the pseudo-impulse results in stabilisation of the pole lines for the lower order and appearance of the stable pole lines, which allows for the visualisation of poles that are non-detectable in cases of classical analyses.
  • The modal parameters obtained by the application of the proposed method can be used for the purposes of non-destructive diagnostics and monitoring of the technical condition of the large, full-scale constructions in order to improve the safety and reliability of their exploitation.

Author Contributions

Conceptualisation, M.I.; methodology, M.I. and P.K.; software, P.K.; validation, M.I., J.I., P.K. and K.S.; formal analysis, M.I., J.I., P.K. and K.S.; investigation, M.I., J.I., P.K. and K.S.; writing—original draft preparation, J.I.; writing—review and editing, J.I. and K.S.; visualisation, K.S.; supervision, J.I.; project administration, M.I. All authors have read and agreed to the published version of the manuscript.

Funding

This research was funded by The National Centre for Research and Development (NCBiR, Poland), grant number: NR03-0034-10 (Diagnostic system of power transmission lines) and AGH University of Science and Technology, Faculty of Mechanical Engineering and Robotics: subvention No. 16.16.130.942.

Institutional Review Board Statement

Not applicable.

Informed Consent Statement

Not applicable.

Conflicts of Interest

The authors declare no conflict of interest.

References

  1. Uhl, T. Computer Aided Identification of Models of Mechanical Structures; WNT: Warsaw, Poland, 1997. [Google Scholar]
  2. Nguyen, K.D.; Chan, T.H.; Thambiratnam, D.P.; Nguyen, A. Damage identification in a complex truss structure using modal characteristics correlation method and sensitivity-weighted search space. Struct. Health Monit. 2019, 18, 49–65. [Google Scholar] [CrossRef] [Green Version]
  3. Iwaniec, J.; Iwaniec, M.; Kasprzyk, S. Transverse vibrations of transmission tower of variable geometrical structure. J. Low Freq. Noise Vib. Act. Control 2019, 38, 774–786. [Google Scholar] [CrossRef] [Green Version]
  4. Szopa, K.; Iwaniec, M.; Iwaniec, J. Identification of technical condition of the overhead power line supporting structure. Eksploat. Niezawodn.–Maint. Reliab. 2019, 21, 115–124. [Google Scholar] [CrossRef]
  5. Panth, D. Reasons for Failure of Transmission Lines and Their Prevention Strategies. Int. J. Electr. Electron. Data Commun. 2014, 2, 1–4. [Google Scholar]
  6. Yang, S.; Zhou, W.; Zhu, S.; Wang, L.; Ye, L.; Xia, X.; Li, H. Failure probability estimation of overhead transmission lines considering the spatial and temporal variation in severe weather. J. Mod. Power Syst. Clean Energy 2019, 7, 131–138. [Google Scholar] [CrossRef] [Green Version]
  7. Haes Alhelou, H.; Hamedani-Golshan, M.E.; Njenda, T.C.; Siano, P. A Survey on Power System Blackout and Cascading Events: Research Motivations and Challenges. Energies 2019, 12, 682. [Google Scholar] [CrossRef] [Green Version]
  8. Karamitsos, I.; Konstantinos, O. Blackouts in electric power transmission systems. In Proceedings of the 5th WSEAS International Conference on Applications of Electrical Engineering, Prague, Czech Republic, 12–14 March 2006; pp. 44–47. [Google Scholar]
  9. Gan, J.; Li, L. Research on the Technical Reliability of the Overhead Transmission Lines Based on the Life Cycle Technology. In IOP Conference Series: Earth and Environmental Science; IOP Publishing: Bristol, UK, 2020; Volume 558, p. 052037. [Google Scholar] [CrossRef]
  10. Chiachío, J.; Chiachío, M.; Derriso, M.M.; Goebel, K.; Hong, M.; Huang, W.; Jiang, X.; Li, F.; Lim, Y.Y.; Liu, P.; et al. Structural Health Monitoring (SHM) in Aerospace Structures; Yuan, F.-G., Ed.; Woodhead Publishing: Cambridge, UK, 2016; ISBN 9780081001486. [Google Scholar] [CrossRef]
  11. Markus, G.; Sause, R.; Jasiūnienė, E. (Eds.) Structural Health Monitoring Damage Detection Systems for Aerospace; Springer Aerospace Technology; Springer: Cham, Switzerland, 2021. [Google Scholar] [CrossRef]
  12. Sroka, K.; Złotecka, D. The risk of large blackout failures in power systems. Arch. Electr. Eng. 2019, 68, 411–426. [Google Scholar]
  13. Esfandiari, A.; Bakhtiari-Nejad, F.; Rahai, A. Theoretical and experimental structural damage diagnosis method using natural frequencies through an improved sensitivity equation. Int. J. Mech. Sci. 2013, 70, 79–89. [Google Scholar] [CrossRef]
  14. Jassim, Z.; Ali, N.; Mustapha, F.; Abdul Jalil, N. A review on the vibration analysis for a damage occurrence of a cantilever beam. Eng. Fail. Anal. 2013, 31, 442–461. [Google Scholar] [CrossRef]
  15. Maia, N.M.M.; Almeida, R.A.B.; Urgueira, A.P.V.; Sampaio, R.P.C. Damage detection and quantification using transmissibility. Mech. Syst. Signal Process. 2011, 25, 2475–2483. [Google Scholar] [CrossRef]
  16. Pascual, R.; Golinval, J.C.; Razeto, M. A Frequency Domain Correlation Technique for Model Correlation and updating. In Proceedings of the 15th International Modal Analysis Conference, Orlando, FL, USA, 3–6 February 1997; pp. 587–592. [Google Scholar]
  17. Worden, K. Structural Fault Detection Using a Novelty Measure. J. Sound Vib. 1997, 201, 85–101. [Google Scholar] [CrossRef]
  18. Lang, Z.Q.; Park, G.; Farrar, C.R.; Todd, M.D.; Mao, Z.; Zhao, L.; Worden, K. Transmissibility of non-linear output frequency response functions with application in detection and location of damage in MDOF structural systems. Int. J. Non-Linear Mech. 2011, 46, 841–853. [Google Scholar] [CrossRef]
  19. Yan, W.-J.; Chronopoulos, D.; Yuen, K.-V.; Zhu, Y.-C. Structural anomaly detection based on probabilistic distance measures of transmissibility function and statistical threshold selection scheme. Mech. Syst. Signal Process. 2022, 162, 108009. [Google Scholar] [CrossRef]
  20. Taajobian, M.; Mohammadzaheri, M.; Doustmohammadi, M.; Amouzadeh, A.; Emadi, M. Fault diagnosis of an automobile cylinder head using low frequency vibrational data. J. Mech. Sci. Technol. 2018, 32, 3037–3045. [Google Scholar] [CrossRef]
  21. Kaewniam, P.; Cao, M.; Alkayem, N.F.; Li, D.; Manoach, E. Recent advances in damage detection of wind turbine blades: A state-of-the-art review. Renew. Sustain. Energy Rev. 2022, 167, 112723. [Google Scholar] [CrossRef]
  22. Mohammadzaheri, M.; Amouzadeh, A.; Doustmohammadi, M.; Emadi, M.; Jamshidi, E.; Ghodsi, M.; Soltani, P. Fuzzy Analysis of Resonance Frequencies for Structural Inspection of an Engine Cylinder Block. Fuzzy Inf. Eng. 2021, 13, 266–276. [Google Scholar] [CrossRef]
  23. Li, X.Y.; Guan, Y.H.; Law, S.S.; Zhao, W. Monitoring abnormal vibration and structural health conditions of an in-service structure from its SHM data. J. Sound Vib. 2022, 537, 117185. [Google Scholar] [CrossRef]
  24. Eiras, J.N.; Payan, C.; Rakotonarivo, S.; Garnier, V. Experimental modal analysis and finite element model updating for structural health monitoring of reinforced concrete radioactive waste packages. Constr. Build. Mater. 2018, 180, 531–543. [Google Scholar] [CrossRef] [Green Version]
  25. Pallarés, F.J.; Betti, M.; Bartoli, G.; Pallaré, L. Structural health monitoring (SHM) and Nondestructive testing (NDT) of slender masonry structures: A practical review. Constr. Build. Mater. 2021, 297, 123768. [Google Scholar] [CrossRef]
  26. Mironovs, D.; Ručevskis, S.; Dzelzītis, K. Prospects of Structural Damage Identification Using Modal Analysis and Anomaly Detection. Procedia Struct. Integr. 2022, 37, 410–416. [Google Scholar] [CrossRef]
  27. Li, Q.; He, Y.; Zhou, K.; Han, X.; He, Y.; Shu, Z. Structural health monitoring for a 600 m high skyscraper. Struct. Des. Tall Spec. Build. 2018, 27, e1490. [Google Scholar] [CrossRef]
  28. Svendsen, B.T.; Frøseth, G.T.; Øiseth, O.; Rønnquist, A. A data-based structural health monitoring approach for damage detection in steel bridges using experimental data. J. Civ. Struct. Health Monit. 2022, 12, 101–115. [Google Scholar] [CrossRef]
  29. Chojnacki, A.L. Assessment of the Risk of Damage to 110 kV Overhead Lines Due to Wind. Energies 2021, 14, 556. [Google Scholar] [CrossRef]
  30. Paiva, F.; Henriques, J.; Barros, R.C. Review of Transmission Tower Testing Stations around the World. Procedia Eng. 2013, 57, 859–868. [Google Scholar] [CrossRef] [Green Version]
  31. Szafran, J. An experimental investigation into failure mechanism of a full-scale 40 m high steel telecommunication tower. Eng. Fail. Anal. 2015, 54, 131–145. [Google Scholar] [CrossRef]
  32. Szopa, K.; Iwaniec, M.; Iwaniec, J. Modelling and identification of bolted truss structure with the use of design of experiment approach. Structures 2020, 27, 462–473. [Google Scholar] [CrossRef]
  33. Moschas, F.; Stiros, S. High accuracy measurement of deflections of an electricity transmission line tower. Eng. Struct. 2014, 80, 418–425. [Google Scholar] [CrossRef]
  34. Denoon, R.O.; Kwok, K.C.S. Full-scale measurements of wind-induced response of an 84 m high concrete control tower. J. Wind Eng. Ind. Aerodyn. 1996, 60, 155–165. [Google Scholar] [CrossRef]
  35. Fu, J.Y.; Wu, J.R.; Xu, A.; Li, Q.S.; Xiao, Y.Q. Full-scale measurements of wind effects on Guangzhou West Tower. Eng. Struct. 2012, 35, 120–139. [Google Scholar] [CrossRef]
  36. Guo, Y.L.; Kareem, A.; Ni, Y.Q.; Liao, W.Y. Performance evaluation of Canton Tower under winds based on full-scale data. J. Wind Eng. Ind. Aerodyn. 2012, 104–106, 116–128. [Google Scholar] [CrossRef]
  37. Wang, H.; Ke, S.T.; Ge, Y.J. Research on non-stationary wind-induced effects and the working mechanism of full scale super-large cooling tower based on field measurement. J. Wind Eng. Ind. Aerodyn. 2019, 184, 61–76. [Google Scholar] [CrossRef]
  38. Experimental Modal Analysis; Brüel & Kjær Sound & Vibration Measurement A/S: Nærum, Denmark, 2003.
  39. Shin, J.; Scott, D.W.; Stewart, L.K.; Yang, C.-S.; Wright, T.R.; DesRoches, R. Dynamic response of a full-scale reinforced concrete building frame retrofitted with FRP column jackets. Eng. Struct. 2016, 125, 244–253. [Google Scholar] [CrossRef] [Green Version]
  40. Baqersad, J.; Bharadwaj, K. Strain expansion-reduction approach. Mech. Syst. Signal Process. 2018, 101, 156–167. [Google Scholar] [CrossRef]
  41. Reiland, M.; Kane, B.; Modarres-Sadeghi, Y.; Ryan, H.D.P. The effect of cables and leaves on the dynamic properties of red oak (Quercus rubra) with co-dominant stems. Urban For. Urban Green. 2015, 14, 844–850. [Google Scholar] [CrossRef]
  42. Weissteiner, C.; Rauch, H.P. The architecture and dynamic properties of young Salix purpurea trees in the context of riparian engineering systems. Ecol. Eng. 2018, 123, 161–167. [Google Scholar] [CrossRef]
  43. Desjardins, S.; Poitras, G. In-operation performance evaluation of damped light poles using fatigue life estimations. Eng. Struct. 2022, 258, 114081. [Google Scholar] [CrossRef]
  44. Pagnini, L.C.; Solari, G. Damping measurements of steel poles and tubular towers. Eng. Struct. 2001, 23, 1085–1095. [Google Scholar] [CrossRef]
  45. Janeliukstis, R. Continuous wavelet transform-based method for enhancing estimation of wind turbine blade natural frequencies and damping for machine learning purposes. Measurement 2021, 172, 108897. [Google Scholar] [CrossRef]
  46. Heylen, W.; Lammens, S.; Sas, P. Modal Analysis Theory and Testing; KUL: Leuven, Belgium, 1994. [Google Scholar]
  47. Worden, K.; Burrows, A.P. Optimal sensor placement for fault detection. Eng. Struct. 2001, 23, 885–901. [Google Scholar] [CrossRef]
  48. Farrar, C.R.; Doebling, S.W. An Overview of modal-based damage identification methods. In Proceedings of the DAMAS Conference, Sheffield, UK, 30 June–2 July 1997. [Google Scholar]
  49. Iwaniec, J.; Kurowski, P. Experimental verification of selected methods sensitivity to damage size and location. J. Vib. Control 2017, 23, 1133–1151. [Google Scholar] [CrossRef]
  50. Naidu, P.S. Modern Spectrum Analysis of Time Series; CRC Press: Boca Raton, FL, USA, 1996. [Google Scholar]
  51. Inman, D.J. Engineering Vibration, 2nd ed.; Prentice Hall: Hoboken, NJ, USA, 2001. [Google Scholar]
  52. Ewins, D.J. Modal Testing: Theory and Practice; Research Studies Press: Letchworth, UK, 1984. [Google Scholar]
  53. Antoniou, A. Digital Signal Processing; McGraw-Hill: New York, NY, USA, 2006. [Google Scholar]
  54. Bendat, J.S.; Piersol, A.G. Random Data, 2nd ed.; John Wiley: New York, NY, USA, 1986. [Google Scholar]
  55. Welch, P.D. The use of Fast Fourier Transform for the estimation of power spectra: A method based on time averaging over short, modified periodograms. IEEE Trans. Audio Electroacoust. 1967, 15, 70–73. [Google Scholar] [CrossRef] [Green Version]
Figure 1. Considered B2-type support of the overhead, high-voltage transmission line (left) and distribution of sensors over the considered structure (right).
Energies 15 05707 g001
Figure 2. The proposed method of exciting the considered system to vibrations.
Energies 15 05707 g002
Figure 3. Cross-section of the considered supporting structure at the middle of its height: location of sensors (●) and point in which the excitation was provided (♦).
Energies 15 05707 g003
Figure 4. Computational steps of the proposed signal processing method.
Energies 15 05707 g004
Figure 6. Time dependencies between system responses measured at the reference point in all the 11 partial experiments.
Energies 15 05707 g006
Figure 7. Time instants associated with the beginning of the response signal amplitude that increase and reach the assumed reference level.
Energies 15 05707 g007
Figure 8. System dynamics in low frequencies masked by the system behaviour in the higher frequencies.
Energies 15 05707 g008
Figure 9. Example of the generated pseudo-impulse and response time history.
Energies 15 05707 g009
Figure 10. Set of synchronised data collected during all the 11 experiments for one selected measurement point on the structure.
Energies 15 05707 g010
Figure 11. Frequency response function estimated with the application of the discussed methods of averaging.
Energies 15 05707 g011
Figure 12. Stabilisation diagrams obtained for the LSCE (left) and BR (right) algorithms.
Energies 15 05707 g012
Figure 13. Stabilisation diagrams obtained for the pseudo-impulse approach with the application of the LSCE (left) and LSCF (right) methods.
Energies 15 05707 g013
Table 1. Comparison of modal parameters estimated with the application of classical and pseudo-impulse methods (modes 1–22).
No.Frequency (Hz)Damping (%)
Classical MethodPseudo-ImpulseClassical MethodPseudo-Impulse
LSCEBRLSCELSCFLSCEBRLSCELSCF
1.---1.50---32.90
2.--5.85---9.89-
3.--5.996.16--7.611.12
4.9.829.7710.029.945.193.743.900.72
5.---11.41---0.23
6.13.5213.2213.5513.474.641.682.001.27
7.---14.79---0.05
8.17.8017.6317.4117.533.061.722.190.25
9.--17.63---1.73-
10.21.92-21.28-5.21-3.05-
11.24.9223.1723.5323.683.811.003.300.15
12.-26.0224.8425.61-2.552.550.13
13.33.6431.7633.46-3.443.313.20-
14.38.1336.6834.4836.272.034.271.070.38
15.38.8038.4338.3637.783.481.931.700.28
16.39.07--39.834.33--0.26
17.41.7041.6841.8941.932.723.701.750.33
18.---43.16---0.12
19.46.8646.5745.3144.573.353.352.660.04
20.--47.7748.03--2.610.34
21.50.0549.8149.8348.950.0380.440.450.12
22.54.3355.9653.7652.571.703.641.520.14
Table 2. Comparison of modal parameters estimated with the application of classical and pseudo-impulse methods (modes 23–45).
No.Frequency (Hz)Damping (%)
Classical MethodPseudo-ImpulseClassical MethodPseudo-Impulse
LSCEBRLSCELSCFLSCEBRLSCELSCF
23.--54.5253.85--1.740.06
24--54.6255.88--1.240.12
25.57.0857.5056.2957.715.101.382.590.17
26.--58.95---1.14-
27.61.7162.3161.8361.951.080.450.550.10
28.66.42-66.2866.500.83-0.490.04
29.69.9470.2869.7069.030.880.300.790.03
30.--69.7270.52--0.780.11
31.74.30-74.3575.190.92-1.040.06
32.--74.45---0.82-
33.78.0378.5277.5277.841.520.500.750.11
34.--80.93---0.76-
35.--81.04---0.93-
36.82.6683.1483.7883.541.170.580.860.10
37.84.28-83.99-2.86-0.84-
38.--85.11---1.23-
39.87.8987.4986.83-1.590.801.27-
40.--88.61---1.34-
41.--91.6490.76--1.840.05
42.92.9793.4293.0992.981.061.881.900.12
43.--93.4594.52--0.750.06
44.97.6297.72-97.230.710.13-0.03
45.--98.0998.22--0.670.08
Publisher’s Note: MDPI stays neutral with regard to jurisdictional claims in published maps and institutional affiliations.