Article

Cable-Partial-Discharge Recognition Based on a Data-Driven Approach with Optical-Fiber Vibration-Monitoring Signals

College of Energy and Electrical Engineering, Hohai University, Nanjing 210098, China
*
Author to whom correspondence should be addressed.
Energies 2022, 15(15), 5686; https://doi.org/10.3390/en15155686
Submission received: 12 July 2022 / Revised: 29 July 2022 / Accepted: 1 August 2022 / Published: 5 August 2022
(This article belongs to the Section F: Electrical Engineering)

Abstract

:
The effective pattern recognition of cable partial discharges (PDs) enables prompt corresponding measures to ensure cable safety. Traditional PD monitoring methods have limitations in online monitoring and accurate positioning, and the feature extraction of the monitored electrical signals requires significant prior knowledge. Therefore, this paper reports the performance of the distributed optical-fiber vibration-sensing monitoring of PDs on a cable with different insulation defects, and proposes a data-driven recognition approach based on the monitoring signals. The time series of the backscattered Rayleigh light intensity (BRLI) changes at the PD position were collected as the sample data. The coefficients of the time series’ autoregressive moving average (ARMA) models were extracted as features. Next, a classification model trained by the random forest (RF) algorithm was established. After the model’s validation with the experimental data and a comparative analysis with previously published methods, the PD recognition model was simply optimized based on the RF principle. The results showed that the proposed method achieved a high recognition accuracy, of about 98%, indicating that the data-driven approach—combining the ARMA model and the RF—is effective for cable-PD pattern recognition in distributed optical-fiber vibration-sensing systems.

Graphical Abstract

1. Introduction

Insulation defects inevitably occur in power cables due to process defects, external force damage, water-tree invasion, and so on. Cable partial discharges (PDs) are early indicators of these insulation defects and can cause them to deteriorate [1,2]. Different defects cause different PDs, with varying degrees of damage to the insulation and safe operation of cables [3]. Therefore, it is important to recognize cable-PD patterns based on online-monitoring signals, since corresponding maintenance plans can be developed in time to decrease the occurrence of cable faults.
Many studies on cable-PD recognition have been conducted. Convolutional neural networks (CNNs) [4,5,6], support vector machines (SVMs) [7,8], and clustering algorithms [9] are the more widely used among them. However, they focus primarily on the classification of the signals obtained by traditional PD monitoring methods. The signal features extracted are mainly phase-resolved partial-discharge (PRPD) spectrum features [6] and waveform time-frequency domain features of the PD pulse or ultrasonic wave [10,11], all of which require significant professional knowledge about PD mechanisms and signal-processing technologies. Furthermore, traditional PD-monitoring technologies, such as the high-frequency current technique (HFCT), the ultra-high-frequency (UHF) method and the traditional ultrasonic method, have limitations that increase the difficulty of cable-PD recognition. They are mainly offline, and their monitoring locations are centralized, which causes positioning errors. Their online-monitoring systems for long-distance cables require many sensors and dedicated communication networks for data transmission [12,13].
Distributed optical-fiber sensing technologies have recently attracted significant attention in PD monitoring due to their benefits in distribution, real time, and electrical-interference resistance [14,15]. The PD signals collected by different optical fiber technologies are diverse, and the corresponding recognition methods are different. The authors of [16,17] studied the recognition methods of GIS PD optical signals based on fluorescent-fiber monitoring. This monitoring method for PDs in gas or liquid insulation has received acceptance, but for PDs in solid insulation, such as cables, it has not been fully studied. Optical-fiber interferometers and fiber Bragg grating (FBG) sensors for the detection of cable PDs have been researched significantly, but dedicated research on PD recognition has not yet been published [18,19,20]. The φ-OTDR has the ability to conduct long-distance distributed measurements, and has progressed in theory and practice for cable-PD monitoring [21,22]. The authors of [23] collected the acoustic signals of cable PDs based on φ-OTDR, calculated the mel-frequency cepstrum coefficient (MFCC) feature images, and built a CNN model for PD recognition. This recognition method requires significant acoustic knowledge and image-processing technologies for feature extraction. The authors of [21] proved that vibration monitoring based on φ-OTDR achieves high sensitivity in detecting cable PDs by analyzing the time series of the backscattered Rayleigh light intensity (BRLI) in optical fibers. However, the quantitative relationship between the PDs of different defects and the BRLI was not studied. Therefore, based on the optical-signal time series, this paper aims to propose a data-driven approach to recognizing cable PDs, which does not require the construction of an accurate physical model [24].
In this study, the cable-PD-monitoring signals of three typical insulation defects were collected through a distributed optical-fiber vibration-sensing experiment. Subsequently, the acquired optical signals—the time series of BRLI changes—were divided into multiple sets of sample data for PD recognition. Next, the autoregressive moving average (ARMA) model coefficients of the time series were extracted as the feature vectors. With the feature vectors as the inputs, a classification model trained by the random forest (RF) learning algorithm was established for different cable PDs. Finally, the PD recognition model based on the data-driven approach with the optical signals was tested with the experimental data and compared with some published methods to verify its feasibility and superiority and simply optimized according to the decision principle of the RF.

2. Acquisition of Cable-PD-Monitoring Signals

2.1. Typical Insulation Defects

A 10-kilovolt three-core nonarmored cable with a length of 5 m was chosen for the monitoring experiment. According to the operation of cables and on-site maintenance, three typical insulation defects were simulated and set on each phase of the cable body. The defects were as follows, and the specific method for defect manufacturing can be found in [25].
  • The micropore defect: Gas by-products from the extrusion of cables with extruded insulation may remain in the cross-linked polyethylene (XLPE), forming air gaps. The air gaps have a higher-electric field intensity than the insulation, resulting in PDs.
  • The scratch defect: When cables are dragged during the laying process, the outermost insulation is easily scratched, producing an uneven voltage distribution at the insulation/air interface, resulting in PDs.
  • The floating-electrode defect: During the production of cables, the residual impurities on the surface of cable insulation, such as metal detritus, become suspensions and result in PDs.

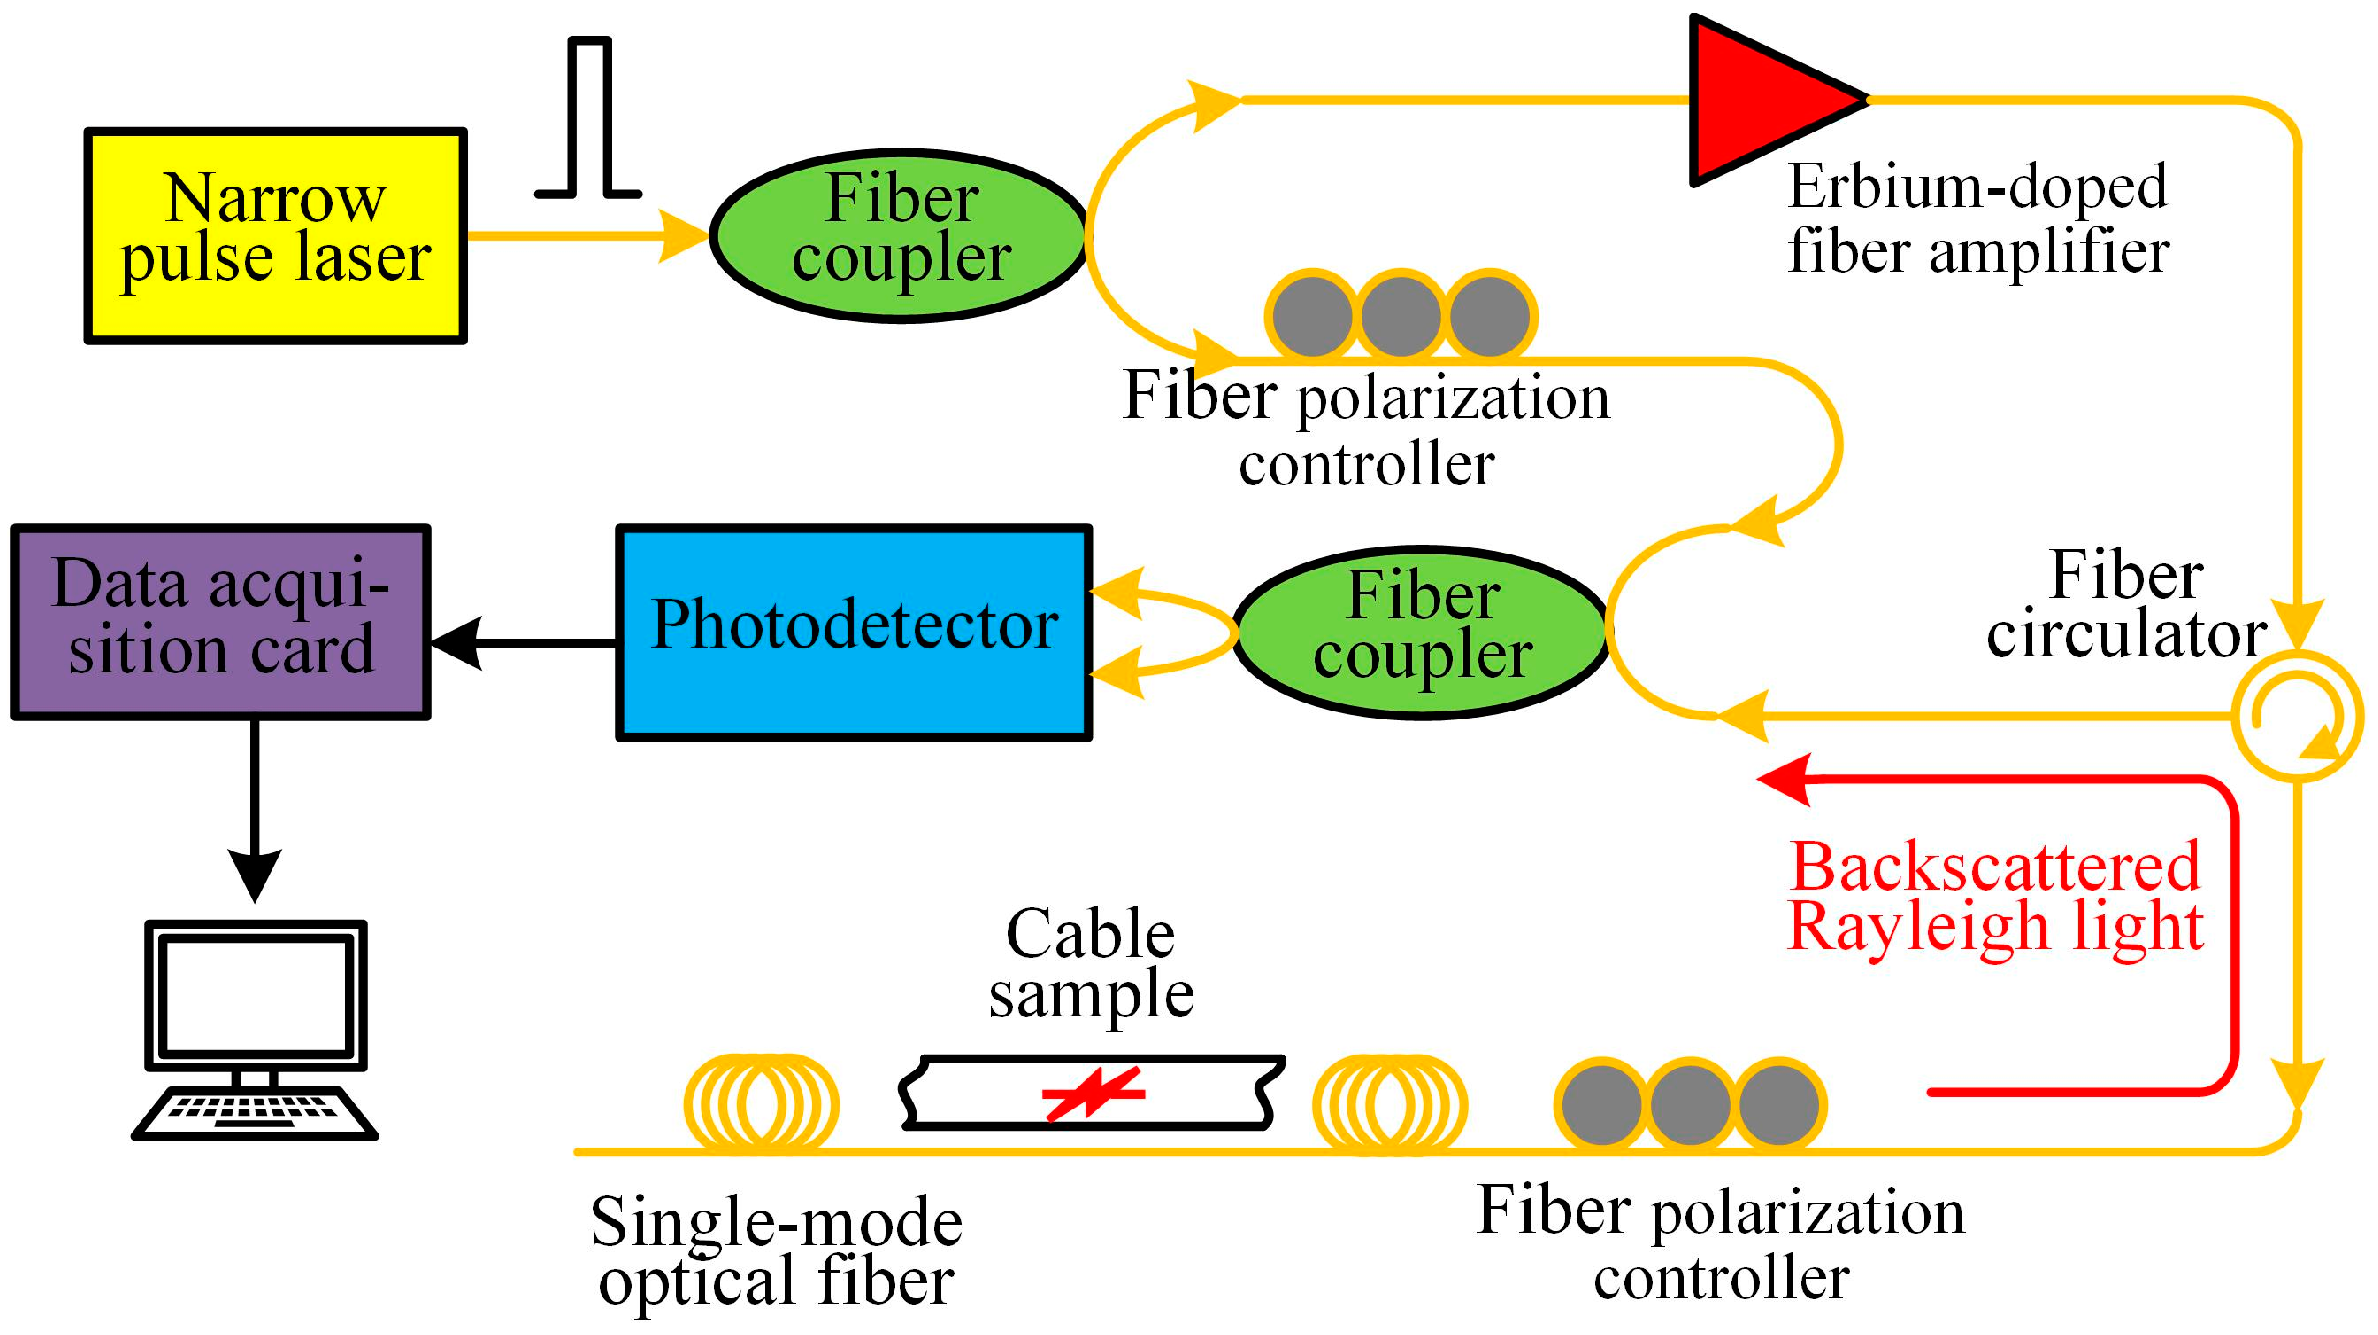
2.2. Optical-Fiber Monitoring-Signal Collection for PDs

To acquire PD-monitoring signals, an experiment on distributed optical-fiber vibration monitoring based on φ-OTDR was set up on the cable sample. The schematic diagram is shown in Figure 1. The narrow pulse laser had a repetition frequency of 3 kHz, and the data-collecting card had a frequency of 150 MHz. Comprehensively considering the influence of the measurable length and the space resolution on the experiment effect, the space resolution was set to 2 m. The sensing optical fiber was wrapped tightly around the cable surface to improve the space resolution and simulate the monitoring of a long-distance cable.
In the experiment, the applied voltage was gradually increased from 0. When the test voltage was greater than 6.8 kV, the apparent discharge of cable PD presented a step increase, and the discharge volume fluctuated wildly. Considering the safety of the cable sample and the experimental effects, monitoring results under the voltage of 7 kV were obtained. The average apparent discharge measured was 100 pC for the scratch and the floating electrode defects, and 200 pC for the micropore defect. According to [21], the optical-fiber vibration-monitoring sensitivity is 50 pC in this experiment. Therefore, the monitoring system can completely detect PDs of the cable sample.
When the ultrasonic waves generated by cable PDs propagate through the insulation to the optical fiber, the vibration of the PDUW vibrates the optical fiber, causing the optical fiber to deform. According to the fundamentals of optics and the principle of coherent superposition in light interference [26], fiber deformation changes the phase of the backscattered Rayleigh light, affecting the coherent superposition component and resulting in a change in the BRLI.
Figure 2 shows the vibration intensity of the optical fiber at different locations and different moments recorded by the monitoring system. The greater the vibration at a given point, the greater the BRLI change and the more considerable the discharge. The BRLI changes at the cable-PD position are different from that in the non-PD section, and the BRLI changes caused by different insulation defects are also distinct. Therefore, the BRLI change between two measurements can be calculated from the strain change of the fiber, in order for the cable PDs to be monitored. The BRLI change between two measurements, Δ I m ( z n ) , is
Δ I m ( z n ) = | I m ( z n ) I m 1 ( z n ) |
where the subscript m represents the m th measurement, and z n is the n th monitoring section of the optical fiber.
The PD detection equipment on the experimental platform was calibrated before the experiment. To eliminate background-noise interference, Fast Fourier Transform (FFT) filtering was performed on the signals obtained, and the vibration signals below 1 kH were eliminated. The BRLI changes at the PD position were acquired and normalized as sample data. To analyze the sample data of different cable defects with limited prior knowledge, a data-driven recognition method based on the principle of mathematic statistics and machine learning was applied as described below.

3. Feature Extraction Based on ARMA Model

In the experiment, the acquired optical-fiber vibration-monitoring signals of the cable PDs were BRLI changes over time, which were time series. Therefore, time-series-analysis methods could be applied to the feature extraction of the PDs caused by different defects. The ARMA model is the most widely used form of time-series analysis to fit stationary time series. For a nonstationary series, the difference operation can be performed to stabilize it before establishing its ARMA model [27].
The n observed value of a given event’s time series is expressed as
{ x 1 , x 2 , , x n }
Consequently, the ARMA model can be expressed as
{ x t = ϕ 0 + ϕ 1 x t 1 + + ϕ p x t p + ε t θ 1 ε t 1 θ q ε t q ϕ p 0 , θ q 0 E ( ε t ) = 0 , V a r ( ε t ) = σ ε 2 , E ( ε t ε s ) = 0 , s t E ( x s ε t ) = 0 , s < t
where ϕ 0 , ϕ 1 , ϕ p , and θ 1 , θ 2 , θ q are coefficients of the model; { ε t } is a stochastic distribution sequence; E stands for the mathematical expectation; Var stands for the variance. The second line of Equation (3) ensures that the order of the ARMA model is (p, q). If p = 0 and q 0 , the ARMA(p, q) model degenerates to an MA(q) model; if p 0 and q = 0 , the ARMA(p, q) model degenerates to an AR(p) model. The third line indicates that { ε t } is a white-noise series with a mean value of zero, and the fourth line indicates that the current value of random interference does not correlate with the historical value.
Once the ARMA model of the BRLI changes is established, the model coefficients can be calculated and extracted as the feature vector of the PD-monitoring signals. The flow chart of the specific process is shown in Figure 3.

3.1. Data Preprocessing

The PDUW vibration signals were collected at a frequency of 3 kHz at the same position. A total of 30,000 continuous measurements were taken on each of the three defects, and 30,000 sample data from each defect were obtained. The monitoring period was set to 0.08 s, and the sample data in a monitoring period were combined into a sample time series. Thus, the sample data of each defect were divided into 125 sample time series, and the length of each sample time series was 240. In all, 375 sample time series were obtained. Figure 4 shows the schematic diagram of the data preprocessing for each defect.

3.2. Randomness and Stationarity Tests

A Ljung–Box (LB) statistic test was used to exclude interference signals caused by problems such as monitoring-equipment failure and to ensure that the extracted signals were effective PD-monitoring signals, rather than white-noise signals. The expression of the LB statistic is
L B = N ( N + 2 ) k = 1 m ( ρ ^ k 2 N k )
where N is the length of the time series, m is the given lagged order, ρ ^ k represents the autocorrelation coefficient of the k-order lagged sample, and 1 k m .
The LB test results when k = 1–14 are shown in Figure 5. The significant level of white noise is 0.05. It can be seen that the LB statistics of the sample time series of the three defects are all outside the white-noise interval, and as k increases, their distance to the white noise interval increases. Therefore, the sample time series can be regarded as meaningful monitoring signals at a 95% confidence level.
Next, the stationarity of the time series was examined by an augmented dickey fuller (ADF) test to determine whether the ARMA model could be established directly. The ADF statistic is expressed as
τ = ρ ^ S ( ρ ^ )
where ρ ^ represents the least-squares estimation of the variable ρ, S ( ρ ^ ) represents the sample standard deviation of the variable ρ, and ρ = | ϕ 1 + ϕ 2 + ϕ p | 1 .
The significant level was set to 0.01 and the corresponding test quantile was obtained by examining the percentile table of ADF statistics. The test results are shown in Figure 6. It can be seen that the sample time series of the three typical defects were all stationary.

3.3. Order Determination of ARMA Model

According to the autocorrelation function (ACF) and partial autocorrelation function (PACF) of the time series, it can be determined whether the model order p or q is zero. Table 1 shows the criterion for the order determination. The function value has a k-order truncation property if it becomes zero after a k-order lag, whereas the function value has a trailing property if it always has a non-zero value. In practice, the correlation function of the sample will not appear to be the perfect situation of theoretical truncation. The absolute value of the function with k-order truncation will suddenly decrease after a k-order lag, but it will not completely become zero. Therefore, the range of two times the standard deviation is generally used to judge the truncation of the correlation function [27].
The ACF and PACF plots of the sample time series are shown in Figure 7. The blue area is the range of twice the standard deviation of ACF or PACF. It can be seen that the ACFs of the three cable defects had a tailing property, while the PACFs had truncation. According to the criterion in Table 1, an AR(p) model was selected for fitting.
Finally, the optimal model-selection criterion needed to be applied to the AR(p) model with convergent coefficients. Bayesian information criterion (BIC) is suitable for samples of different sizes. The model is judged to be optimal when the BIC function takes the minimum value. Therefore, the 375 sample time series were fitted using AR(p) models of different orders and the corresponding BIC function value was calculated by
B I C = ln ( σ ^ 2 ) + n N ln ( N )
where σ ^ 2 is the variance of the residual between the series fitted by the AR(p) model and the monitored series, and n is the number of coefficients of the AR(p) model. It can be determined from Equation (3) that n = p + 1 .
After calculation, it was found that the AR(p) model coefficients of the time series of three typical cable defects were not completely convergent when p > 7 , and the BIC function value of the model for each defect was the smallest when p = 7 . Therefore, the AR(7) model was used to fit the sample time series and extracted its coefficients [ ϕ 0 , ϕ 1 , , ϕ 7 ] as the feature vector of the cable PD patterns.

4. Random Forest for PD Recognition

Various classification algorithms available have different advantages and disadvantages, and they are applicable to different targets. The research in [28] shows that the RF classification algorithm has the highest accuracy for 121 classification problems out of 178 algorithms, with accuracy of over 90% for 84.3% of the classification problems, indicating that the RF is widely applicable and highly accurate. Therefore, without prior knowledge of the optical-fiber vibration-monitoring data, the RF can assure the effectiveness and stability of the cable-PD recognition.
The RF performs learning tasks by establishing and combining multiple base learners [29]. The schematic diagram of an RF model is shown in Figure 8.
In this paper, the obtained optical-fiber vibration-monitoring signals of the cable PDs caused by three defects were marked as (scratch, 1), (micropore, 2), and (floating electrode, 3). Three hundred sample time series of the BRLI changes were selected as the training data, and the others formed the test set. Next, the RF classification model was established with the feature vectors [ ϕ 0 , ϕ 1 , , ϕ 7 ] of the BRLI change time series as the inputs and the types of cable defects [ 1 , 2 , 3 ] as the outputs. The specific building process of the RF model for cable-PD recognition is as follows:
  • Establishment of training set: The bootstrap sampling method is used to obtain the training set of the RF. It conducts sampling m times with a replacement for a given data set D containing m samples, and each time the sampling number is one, then the training set D i is obtained. The probability that a sample in data set D is not be selected is 36.8%, that is, 36.8% of the samples in D are not be collected, and these samples are formed as the out-of-bag data set, which is recorded as D D i .
  • Training of base leaners: The classification and regression tree (CART) decisions are used as base learners. CART decision selects the features of data partition through the Gini index. A certain feature in the data set D is denoted as a. Let a have two values { a 1 , a 2 } , because CART is a binary tree. Divide D based on a, and the data set with the feature value a i is denoted as D i . The expression of the Gini index of D is
    Gini ( D , a ) = | D 1 | | D | Gini ( D 1 ) + | D 2 | | D | Gini ( D 2 )
    where the symbol | | represents the number of samples in the data set. The smaller the Gini ( D , a ) , the greater the consistency of the samples in the data set divided by a, and the better the classification effect.
  • Combination of decision results: The data set D i is classified by the multi-layer CART to obtain the classification results of the subtree. The RF has multiple subtrees, and their results are not unique. Therefore, a combination strategy is needed to obtain the final results. Voting is a commonly used combination strategy. To obtain the final output, plurality voting was chosen to be the combination method of the RF. If the subtrees with a classification result account for the largest proportion of all subtrees, the result is output as the final result.
  • Validation of RF model: Since few sample time series were obtained in the experiment, the out-of-bag estimate (OOB) and 10-fold cross validation were used to validate the classification effect of the RF model. The test sets are different in the two methods. The OOB takes the above-mentioned data set D D i as the test set. The 10-fold cross validation divides the data set D into 10 subsets of the same size, and they have the relationship shown in
    { D = D 1 D 2 D 10 D i D j = ,                     i j ;     1 i , j 10
Each time the model is trained, nine subsets are formed as the training set, and the remaining subset is used as the test set. Each test set gives a test result, and the final test result of the model is the average of the results from 10 tests.

5. Analysis of the PD-Recognition Results

5.1. Model Test and Comparative Analysis

For the model validation, the results of the OOB test and the 10-fold cross validation for the RF models with different scales were calculated as shown in Figure 9. It can be seen that as the base learners increase, the accuracy of the recognition model gradually increases; but when the number of base learners exceeds 20, the accuracy remains almost unchanged. When testing the model with the experimental data, it was found that when there were 20 base learners, the recognition accuracy remained at 98.67% with the OOB test, and at 98.99% with 10-fold cross-validation.
Considering the complexity and accuracy, the RF model with 20 base learners was selected. The confusion matrix of the recognition results on the test set is shown in Table 2. According to Table 2, the macro-precision, macro-sensitivity, and macro-specificity are 98.81%, 98.77%, and 99.31%, respectively.
Table 3 compares the performance of the proposed cable-PD-recognition model and five other methods published in recent years. It shows that of the six methods, the method proposed in this paper has the highest accuracy. The last four methods in Table 3 are based on traditional PD-monitoring technologies. Their feature extraction requires a heavy preprocessing workload and significant professional prior knowledge [30]. The second method requires a φ-OTDR system with a weak fiber Bragg grating (wFBG) array. Compared with the proposed method, this optical fiber sensing system is more complex. Furthermore, the CNN is a black-box model without discernible decision rules, whereas the RF is a white-box model, which is interpretable and easily integrated into online monitoring programs [31].
In conclusion, based on the optical-fiber vibration-monitoring signals, the data-driven approach—combining the ARMA model and the RF—can be a simple but effective method for cable-PD pattern recognition.

5.2. Optimization of the Recognition Model

According to the RF decision principle, the utilization factor of each parameter of the feature vector [ ϕ 0 , ϕ 1 , , ϕ 7 ] in the decision process was calculated. The higher the utilization factor, the greater the importance of this parameter and its effect on the recognition. The utilization factor of each parameter is shown in Table 4. It can be seen that the importance of each parameter is different in the recognition. Taking the utilization factor of 10% as the dividing standard, the more important parameters were ϕ 3 , ϕ 5 , ϕ 6 , ϕ 7 .
Next, the ϕ 3 , ϕ 5 , ϕ 6 , ϕ 7 of the original feature vector were extracted to form a new feature vector, with which a simplified PD recognition model was established. When testing the model with experimental data, it was found that when there were 20 base learners, the recognition accuracy remained at 97.67% with the OOB test, and at 98.31% with 10-fold cross validation. Compared with the original test results, the recognition accuracy of the simplified model was slightly lower, but the model complexity was reduced. Figure 10 plots the decision region of the simplified PD-recognition model on the two-dimensional plane. It shows that the new model has a good recognition effect on the cable PDs.
Therefore, the RF model can be optimized by selecting the more important ARMA model coefficients in the decision as features. The optimization is useful to reduce the calculation time while keeping high accuracy, especially when there are large amounts of data or many coefficients of the fitted ARMA model.

6. Conclusions

This paper proposes a data-driven approach to the pattern recognition of cable PDs caused by different insulation defects based on optical-fiber vibration-monitoring signals and verifies the feasibility of this method with experimental data. The following conclusions were drawn from the research results.
  • The BRLI changes acquired by the distributed optical-fiber vibration monitoring of cable PDs can reflect different PD patterns. With little prior knowledge of the optical signals, a data-driven approach based on the principle of mathematical statistics and machine learning can achieve good results in cable-PD recognition.
  • The combination of the feature extraction based on the ARMA model of the BRLI changes and the RF classification model had a significant effect on the PD recognition. The precision, sensitivity, and specificity were 98.81%, 98.77%, and 99.31%, respectively, according to the experimental data.
  • Selecting the ARMA model coefficients with high importance in the RF decision as features can effectively improve the recognition efficiency and ensure high accuracy (about 98%), producing a simple optimization of the PD-recognition model.
  • This paper provides a new approach to identifying different PDs of cable bodies, with the potential for application to optical-fiber composite power-cable-monitoring systems. However, because the monitoring data were obtained through the experiment, further research on denoising in an engineering site is required.

Author Contributions

Conceptualization, W.P. and X.C.; methodology, X.C. and K.Z.; software, X.C. and K.Z.; validation, W.P. and X.C.; formal analysis, X.C. and K.Z.; investigation, K.Z.; data curation, X.C. and K.Z.; writing—original draft preparation, X.C.; writing—review and editing, X.C.; visualization, X.C. and K.Z.; supervision, W.P.; project administration, W.P.; funding acquisition, W.P. All authors have read and agreed to the published version of the manuscript.

Funding

This research was funded by the State Key Laboratory of Smart Grid Protection and Control, grant number SGNR0000KJJS1907536, and supported by the Program of Introducing Talents of Discipline to Universities, grant number B14022.

Institutional Review Board Statement

Not applicable.

Informed Consent Statement

Not applicable.

Data Availability Statement

Not applicable.

Acknowledgments

The authors would like to thank the Research Institute of State Grid Jiangsu Electric Power Company Ltd. for its help in conducting the experiment of this work.

Conflicts of Interest

The authors declare no conflict of interest.

References

  1. Ra, N.; Mustafa, N.S.B.; Kawashima, T.; Murakami, Y.; Hozumi, N. Development of a partial discharge measuring method for a long-distance cable line. IEEJ Trans. Elect. Electron. Eng. 2019, 14, 996–1001. [Google Scholar] [CrossRef]
  2. IEC60270; High-Voltage Test Techniques: Partial Discharge Measurements. International Electrotechnical Commission: Geneva, Switzerland, 2015.
  3. Li, J.H.; Han, X.T.; Liu, Z.H.; Li, Y.M. Review on partial discharge measurement technology of electrical equipment. High Volt. Eng. 2015, 41, 2583–2601. [Google Scholar]
  4. Gao, A.; Zhu, Y.L.; Cai, W.H.; Zhang, Y. Pattern recognition of partial discharge based on VMD-CWD spectrum and optimized CNN with cross-layer feature fusion. IEEE Access 2020, 8, 151296–151306. [Google Scholar] [CrossRef]
  5. Peng, X.S.; Yang, F.; Wang, G.J.; Wu, Y.; Li, L.; Li, Z.; Bhatti, A.A.; Zhou, C.; Hepburn, D.M.; Reid, A.J. A convolutional neural network-based deep learning methodology for recognition of partial discharge patterns from high-voltage cables. IEEE Trans. Power Deliv. 2019, 34, 1460–1469. [Google Scholar] [CrossRef]
  6. Wu, J.; Hu, Y.G.; Jiang, C.H.; Zhang, X.X.; Li, K.Y.; Zhao, Z.Z. Classification of partial discharge signals in high-voltage cables based on convolutional neural network. J. Wuhan Univ. (Nat. Sci. Ed.) 2021, 67, 232–240. [Google Scholar]
  7. Chang, C.K.; Boyanapalli, B.K.; Wu, R.N. Application of fuzzy entropy to improve feature selection for defect recognition using support vector machine in high voltage cable joints. IEEE Trans. Dielectr. Electr. Insul. 2020, 27, 2147–2155. [Google Scholar] [CrossRef]
  8. Wang, Y. Study on Partial Discharge Fault Diagnosis Based on Support Vector Machine and Information Fusion. Ph.D. Thesis, North China Electric Power University, Beijing, China, 2015. [Google Scholar]
  9. Gu, F.C.; Yau, H.T.; Chen, H.C. Application of chaos synchronization technique and pattern clustering for diagnosis analysis of partial discharge in power cables. IEEE Access 2019, 7, 76185–76193. [Google Scholar] [CrossRef]
  10. Chen, J.M.; Xu, C.H.; Li, P.; Shao, X.J.; Li, C.L. Feature extraction method for partial discharge pattern in GIS based on time-frequency analysis and fractal theory. High Volt. Eng. 2021, 47, 287–295. [Google Scholar]
  11. Yang, G. Study on Ultrasonic Signal Characteristics and Pattern Recognition Method of Typical Defect Partial Discharge. Master’s Thesis, Southwest Jiaotong University, Chengdu, China, 2020. [Google Scholar]
  12. Zhang, L.Q.; Sheng, B.J.; Jiang, W.; Zhou, W.J.; Tian, Z.; Dong, X.; Tang, Z.Y. On-line partial discharge localization in cross-bonded HV cable systems. High Volt. Eng. 2015, 41, 2706–2715. [Google Scholar]
  13. Ni, H.L.; Yao, W.Q.; Fu, C.Z.; Wei, B.G.; Yan, N.P.; Wu, X.T.; Si, W.R. Review on Technical Standards for Measurement of Partial Discharge in Electrical Equipment. High Voltage Apparatus. Available online: https://kns.cnki.net/kcms/detail/61.1127.tm.20210420.1419.002.html (accessed on 21 April 2021).
  14. Philipp, R.; René, E.; Katerina, K. Distributed acoustic sensing: Towards partial discharge monitoring. In Proceedings of the 24th International Conference on Optical Fiber Sensors, Curitiba, Brazil, 28 September–2 October 2015; pp. 96341C1–96341C14. [Google Scholar]
  15. Sun, T.X.; Chen, H.; Qian, S.; Guo, X.K.; Xu, Y. Progress of fiber optic sensor in partial discharge detection for power cables. High Volt. Appar. 2018, 54, 1–8. [Google Scholar]
  16. Xie, R.; Ge, X.Y.; Zhu, J.P.; Hu, R.P.; Sun, Z. Study on optical-electrical signal characteristics of partial discharge of gas-insulated electric equipment. In Proceedings of the 3rd International Electrical and Energy Conference (CIEEC), Beijing, China, 7 September–9 September 2019; pp. 354–358. [Google Scholar]
  17. Tang, J.; Zeng, F.P.; Fan, Q.T.; Liu, Y.G.; Zhang, X.X. Multifractal spectrum identification of partial discharge in GIS based on fluorescence optical fiber detection. High Volt. Eng. 2014, 2, 465–473. [Google Scholar]
  18. Hao, Y.P.; Chen, Y.W.; Chen, Y.; Huang, T.; Xiao, J.P.; Yang, L. A partial discharge detection system for XLPE cable terminals and acoustic wave sensing characteristics based on fiber optic mach-zehnder interferometer. IEEE Sens. J. 2021, 21, 21782–21790. [Google Scholar] [CrossRef]
  19. Li, R.D. Research on Detection Methods of Cable Partial Discharge Based on Optical Fiber Sensing. Master’s Thesis, North China Electric Power University, Beijing, China, 2020. [Google Scholar]
  20. Wu, X.T.; Li, R.D.; Ni, H.; Ding, P.; Li, X.G.; Zhou, X.; Cheng, Y.C.; Yu, H.B. Integrated detection of temperature and partial discharge on cables based on FBG. In Proceedings of the 2nd International Conference on Electrical Materials and Power Equipment (ICEMPE), Guangzhou, China, 7 April–10 April 2019; pp. 385–389. [Google Scholar]
  21. Pan, W.X.; Zhao, K.; Xie, C.; Li, X.R.; Chen, J.; Hu, L.B. Distributed online monitoring method and application of cable partial discharge based on φ-OTDR. IEEE Access 2019, 7, 144444–144450. [Google Scholar] [CrossRef]
  22. Zhu, P.; Wen, H.q.; Che, Q.; Li, X.Y. Disturbed partial discharge detection system based on improved φ-OTDR assisted by a wFBG array. Appl. Opt. 2020, 59, 4367–4370. [Google Scholar] [CrossRef]
  23. Che, Q.; Wen, H.Q.; Li, X.Y.; Peng, Z.Q.; Chen, K.P. Partial discharge recognition based on optical fiber distributed acoustic sensing and a convolutional neural network. IEEE Access 2019, 7, 101758–101764. [Google Scholar] [CrossRef]
  24. Chen, K.J.; Vantuch, T.; Zhang, Y.; Hu, J.; He, J.L. Fault detection for covered conductors with high-frequency voltage signals: From local patterns to global features. IEEE Trans. Smart Grid 2021, 12, 1602–1614. [Google Scholar] [CrossRef]
  25. Li, Z.; Xu, Y.P.; Jiang, X.C. Pattern recognition of DC partial discharge on XLPE cable based on ADAM-DBN. Energies 2020, 13, 4566. [Google Scholar] [CrossRef]
  26. Zhou, L.; Wang, F.; Wang, X.C.; Pan, Y.; Sun, Z.Q.; Hua, J.; Zhang, X.P. Distributed strain and vibration sensing system based on phase-sensitive OTDR. IEEE Photon. Technol. Lett. 2015, 27, 1884–1887. [Google Scholar] [CrossRef]
  27. Wang, Y. Applied Time Series Analysis, 3rd ed.; China Renmin University Press: Beijing, China, 2012; pp. 41–82. [Google Scholar]
  28. Fernandez-Delgado, M.; Cernadas, E.; Barro, S.; Amorim, D. Do we need hundreds of classifiers to solve real world classification problems? J. Mach. Learn. Res. 2014, 15, 3133–3181. [Google Scholar]
  29. Zhou, Z.H. Machine Learning; Tsinghua University Press: Beijing, China, 2016. [Google Scholar]
  30. Rosle, N.; Muhamad, N.A.; Rohani, M.N.K.H.; Jamil, M.K.M. Partial discharges classification methods in XLPE cable: A review. IEEE Access 2021, 9, 133258–133273. [Google Scholar] [CrossRef]
  31. Li, J.S.; Wu, Y.J.; Wang, G.J.; Peng, X.S.; Liu, T.W.; Jiao, Y.H. Gradient boosting decision tree and random forest based partial discharge pattern recognition of HV cable. In Proceedings of the China International Conference on Electricity Distribution (CICED), Tianjin, China, 17–19 September 2018; pp. 327–331. [Google Scholar]
  32. Duan, Y.B.; Zhang, H.; Hu, X.L.; Jin, A.L.; Sun, X.B. PD pattern recognition of XLPE cable based on parameter optimal support vector machine algorithm. In Proceedings of the 14th IEEE Conference on Industrial Electronics and Applications (ICIEA), Xi’an, China, 19–21 June 2019; pp. 355–359. [Google Scholar]
  33. Jin, S.; Zhang, R.B.; Du, G. Partial discharge pattern recognition of cables considering attenuation of damped AC voltages. High Volt. Eng. 2021, 47, 2583–2590. [Google Scholar]
Figure 1. Schematic diagram of cable-PD-monitoring experiment based on optical-fiber vibration sensing.
Energies 15 05686 g001
Figure 2. The interface of optical-fiber vibration monitoring for cable PDs.
Energies 15 05686 g002
Figure 3. Flow chart of feature extraction of PD patterns.
Energies 15 05686 g003
Figure 4. Schematic diagram of data preprocessing for each defect.
Energies 15 05686 g004
Figure 5. LB test results.
Energies 15 05686 g005
Figure 6. ADF test results.
Energies 15 05686 g006
Figure 7. ACF and PACF plots of sample time series: (a) ACF plot of scratch defect; (b) ACF plot of micropore defect; (c) ACF plot of floating electrode defect; (d) PACF plot of scratch defect; (e) PACF plot of micropore defect; (f) PACF plot of floating electrode defect.
Energies 15 05686 g007
Figure 8. Schematic diagram of the RF for PD recognition.
Energies 15 05686 g008
Figure 9. Relationship between the scale and accuracy of the RF models.
Energies 15 05686 g009
Figure 10. Decision region of the simplified PD recognition model.
Energies 15 05686 g010
Table 1. Criterion for order determination of ARMA model.
ACFPACFOrder Determination
trailingp-order truncationAR(p) model
q-order truncationtrailingMA(q) model
trailingtrailingARMA(p, q) model
Table 2. Confusion matrix of recognition results.
ActualPredicted
ScratchMicroporeFloating
Scratch2100
Micropore0270
Floating0126
Table 3. Comparison between proposed PD-recognition model and previous methods.
MethodMonitoring MethodFeature ExtractionClassifierAccuracy
1 (proposed method)Optical-fiber vibration sensingExtract the ARMA model coefficients of the BRLI changesRF98.7%
2 [23]fiber-optic distributed acoustic sensingCalculate the mel-frequency cepstrum Coefficients (MFCC) of the acoustic signals2D CNN96.3%
3 [5]HFCTCombine 17 parameters of PD pulse signals and 16 wavelet featuresCNN
SVM
BPNN
92.57%
87.81%
86.10%
4 [25]HFCTExtract PD pulse waveform features preproce-ssed by CannyADAM-DBN93.8%
5 [32]Pulse-current methodExtract fractal dimensions representing the intrinsic fractal features of the gray imageGA-SVM96.5%
6 [33]oscillating wave testTransform PD signals to periodic phase-resolved partial discharge (P-PRPD) and extract a combined feature by a CNNRNN92%
Table 4. Utilization factor of each parameter of feature vector in recognition.
Parameter ϕ 0 ϕ 1 ϕ 2 ϕ 3 ϕ 4 ϕ 5 ϕ 6 ϕ 7
Utilization factor (%)0.699.732.6817.046.2917.1223.2523.2
Publisher’s Note: MDPI stays neutral with regard to jurisdictional claims in published maps and institutional affiliations.

