
Impact of Wind Power Plant Operation on Voltage Quality Parameters—Example from Poland


Abstract
:1. Introduction
2. Materials and Methods
- arithmetic mean
- median
- standard deviation
- striae
- coefficient of variation
- A positive test result (a “+” sign) means that there are no grounds to reject the hypothesis of independence of the tested variables at the given significance level α;
- A negative test result (“−” sign) means that the hypothesis of independence of the tested variables at the given significance level α should be rejected.
3. Results
4. Discussion
5. Conclusions
Author Contributions
Funding
Institutional Review Board Statement
Informed Consent Statement
Data Availability Statement
Conflicts of Interest
References
- Kaldellis, J.K.; Zafirakis, D. The wind energy (r)evolution: A short review of a long history. Renew. Energy 2011, 36, 1887–1901. [Google Scholar] [CrossRef]
- Adem, A.; Çolak, A.; Dağdeviren, M. An integrated model using SWOT analysis and hesitant fuzzy linguistic term set for evaluation occupational safety risks in life cycle of wind turbine. Saf. Sci. 2018, 106, 184–190. [Google Scholar] [CrossRef]
- Ellabban, O.; Abu-Rub, H.; Blaabjerg, F. Renewable energy resources: Current status, future prospects and their enabling technology. Renew. Sustain. Energy Rev. 2014, 39, 748–764. [Google Scholar] [CrossRef]
- de Falani, S.Y.A.; González, M.O.A.; Barreto, F.M.; de Toledo, J.C.; Torkomian, A.L.V. Trends in the technological development of wind energy generation. Int. J. Technol. Manag. Sustain. Dev. 2020, 19, 43–68. [Google Scholar] [CrossRef]
- Herbert, G.J.; Iniyan, S.; Sreevalsan, E.; Rajapandian, S. A review of wind energy technologies. Renew. Sustain. Energy Rev. 2007, 11, 1117–1145. [Google Scholar] [CrossRef]
- Hau, E. Wind Turbines: Fundamentals, Technologies, Application, Economics; Springer Science & Business Media: Berlin/Heidelberg, Germany, 2013. [Google Scholar]
- Leung, D.Y.; Yang, Y. Wind energy development and its environmental impact: A review. Renew. Sustain. Energy Rev. 2012, 16, 1031–1039. [Google Scholar] [CrossRef]
- Brennan, N.; van Rensburg, T.M. Public preferences for wind farms involving electricity trade and citizen engagement in Ireland. Energy Policy 2020, 147, 111872. [Google Scholar] [CrossRef]
- Michalak, P.; Zimny, J. Wind energy development in the world, Europe and Poland from 1995 to 2009; current status and future perspectives. Renew. Sustain. Energy Rev. 2011, 15, 2330–2341. [Google Scholar] [CrossRef]
- Gulski, E.; Anders, G.J.; Jongen, R.A.; Parciak, J.; Siemiński, J.; Piesowicz, E.; Paszkiewicz, S.; Irska, I. Discussion of electrical and thermal aspects of offshore wind farms’ power cables reliability. Renew. Sustain. Energy Rev. 2021, 151, 111580. [Google Scholar] [CrossRef]
- Farhoodnea, M.; Mohamed, A.; Shareef, H.; Zayandehroodi, H. Power Quality Impact of Renewable Energy Based Generators and Electric Vehicles in Distribution Systems. In Proceedings of the 4th International Conference on Electrical Engineering and Informatics (ICEEI), Selangor, Malaysia, 24–25 June 2013; pp. 11–17. [Google Scholar]
- Kumar, K.S.V.P.; Venkateshwarla, S. A Review of Power Quality in Grid Connected Renewable energy system. CVR J. Sci. Technol. 2013, 5, 57–61. [Google Scholar] [CrossRef]
- El-Samahy, I.; El-Saadany, E. The Effect of DG on Power Quality in a deregulated Environment. In Proceedings of the IEEE Power Engineering Society General Meeting 2005, San Francisco, CA, USA, 12–16 June 2005; Volume 3, p. 67. [Google Scholar]
- Skibko, Z.; Tymińska, M.; Romaniuk, W.; Borusiewicz, A. Impact of the Wind Turbine on the Parameters of the Electricity Supply to an Agricultural Farm. Sustainability 2021, 13, 7279. [Google Scholar] [CrossRef]
- Enemuoh, F.O.; Onuegbu, J.C.; Anazia, E.A. Modal Based Analysis and Evaluation of Voltage Stability on Bulk Power System. Int. J. Eng. Res. Dev. 2013, 6, 71–79. [Google Scholar]
- Dai, J.; Tang, Y.; Yi, J. Adaptive gains control scheme for PMSG-based wind power plant to provide voltage regulation service. Energies 2019, 12, 753. [Google Scholar] [CrossRef] [Green Version]
- Vittal, E.; O’Malley, M.; Keane, A. A steady-state voltage stability analysis of power systems with high penetrations of wind. IEEE Trans. Power Syst. 2010, 25, 433–442. [Google Scholar] [CrossRef]
- Li, T.; Wang, L.; Wang, Y.; Liu, G.; Zhu, Z.; Zhang, Y.; Zhao, L.; Ji, Z. Data-driven virtual inertia control method of doubly fed wind turbine. Energies 2021, 14, 5572. [Google Scholar] [CrossRef]
- Xu, B.; Zhang, L.; Yao, Y.; Yu, X.; Yang, Y.; Li, D. Virtual inertia coordinated allocation method considering inertia demand and wind turbine inertia response capability. Energies 2021, 14, 5002. [Google Scholar] [CrossRef]
- Krpan, M.; Kuzle, I. Dynamic characteristics of virtual inertial response provision by DFIG-based wind turbines. Electr. Power Syst. Res. 2020, 178, 106005. [Google Scholar] [CrossRef]
- Ghijselen, J.A.; Willems, J.L. Determining Customer Contribution to Voltage Distortion in Power Systems. L’Energia Elettr. 2004, 81, 116–122. [Google Scholar]
- Emanuel, A.E. On the assessment of harmonic pollution. IEEE Trans. Power Deliv. 1995, 10, 1693–1698. [Google Scholar] [CrossRef]
- PN-EN 50160:2010; Supply Voltage Parameters in Public Distribution Networks. PN-EN: Bialystok, Poland, 2010.
- Arrillaga, J.; Watson, N.R. Power System Harmonics; John Wiley & Sons: Hoboken, NJ, USA, 2003. [Google Scholar]
- Lubosny, Z. Wind Turbine Operation in Electric Power Systems; Springer: Berlin/Heidelberg, Germany, 2003. [Google Scholar]
- Kowalski, Z. The Quality of Electricity; Wydawnictwo Politechniki Łódzkiej: Łódź, Poland, 2007. [Google Scholar]
- An, Z.; Ren, Y.; Li, H. Analysis and testing of wind farm power quality in Inner Mongolia. In Proceedings of the 2011 International Conference on Electrical and Control Engineering, Yichang, China, 16–18 September 2011; pp. 2002–2005. [Google Scholar] [CrossRef]
- Moloi, K.; Hamam, Y.; Jordaan, J.A. Power Quality Assessment of A Wind Power-Integrated System into the Power Grid. In Proceedings of the 2020 5th International Conference on Renewable Energies for Developing Countries (REDEC), Marrakech, Morocco, 29–30 June 2020; pp. 1–6. [Google Scholar] [CrossRef]
- Hongbo, L.; Baoming, L.; Lin, N.; Qi, N.; Lei, W.; Lingling, S.; Lijuan, G. Research on the Influence of Distributed Power Sources on Power Quality. In Proceedings of the 2021 6th Asia Conference on Power and Electrical Engineering (ACPEE), Chongqing, China, 8–11 April 2021; pp. 1531–1535. [Google Scholar] [CrossRef]
- Mahela, O.P.; Dev Kansal, K.; Agarwal, S. Detection of Power Quality Disturbances in Utility Grid with Wind Energy Penetration. In Proceedings of the 2018 8th IEEE India International Conference on Power Electronics (IICPE), Jaipur, India, 13–15 December 2018; pp. 1–5. [Google Scholar] [CrossRef]
- Muljadi, E.; Butterfield, C.P.; Chacon, J.; Romanowitz, H. Power quality aspects in a wind power plant. In Proceedings of the 2006 IEEE Power Engineering Society General Meeting, Montreal, QC, Canada, 18–22 June 2006; p. 8. [Google Scholar] [CrossRef]
- Shalukho, A.V.; Lipuzhin, I.A.; Voroshilov, A.A. Power Quality in Microgrids with Distributed Generation. In Proceedings of the 2019 International Ural Conference on Electrical Power Engineering (UralCon), Chelyabinsk, Russia, 1–3 October 2019; pp. 54–58. [Google Scholar] [CrossRef]
- Pawelek, R.; Wasiak, I.; Gburczyk, P.; Mienski, R. Impact of wind power plant on electrical power system—Comparison of calculation method and measurements. In Proceedings of the 11th International Conference on Electrical Power Quality and Utilisation, Lisbon, Portugal, 17–19 October 2011; pp. 1–5. [Google Scholar] [CrossRef]


| Diameter | 90 m |
| Swept Area | 6362 m2 |
| Rotational Speed Static, Rotor | 14.9 rpm |
| Speed, Dynamic Operation Range | 9.6–17.0 rpm |
| Rotational Direction | Clockwise (front view) |
| Orientation | Upwind |
| Tilt | 6° |
| Hub Coning | 2° |
| Number of Blades | 3 |
| Aerodynamic Brakes | Full feathering |
| Type Description | Asynchronous Doubly Fed Induction Generator (DFIG) with wound rotor, slip rings and VCS |
| Rated Power (PN) | 2.0 MW |
| Rated Apparent Power | 2.08 MVA (Cosφ = 0.96) |
| Frequency | 50 Hz |
| Voltage, Generator | 690 Vac |
| Voltage, Converter | 480 Vac |
| Number of Poles | 4 |
| Winding Type (Stator/Rotor) | Random/Form |
| Winding Connection, Stator | Star/Delta |
| Rated Efficiency (Generator only) | >97% |
| Power Factor (cos) | 0.96 ind–0.98 cap |
| Overspeed Limit According to IEC (2 min) | 2900 rpm |
| Vibration Level | ≤1.8 mm/s |
| Weight | Approximately 7500 kg |
| Type Description | Dry-type cast resin |
| Primary Voltage | 15.0 kV |
| Rated Power | 2100 kVA |
| Secondary Voltage 1 | 690 V |
| Rated Power 1 at 690 V | 1900 kVA |
| Secondary Voltage 2 | 480 V |
| Rated Power 2 at 480 V | 200 kVA |
| Vector Group | Dyn5 |
| Frequency | 50 Hz |
| HV-Tappings | ±2 × 2.5% off-circuit |
| Size | Unit | Me | s | xmin | xmax | R | V | |
|---|---|---|---|---|---|---|---|---|
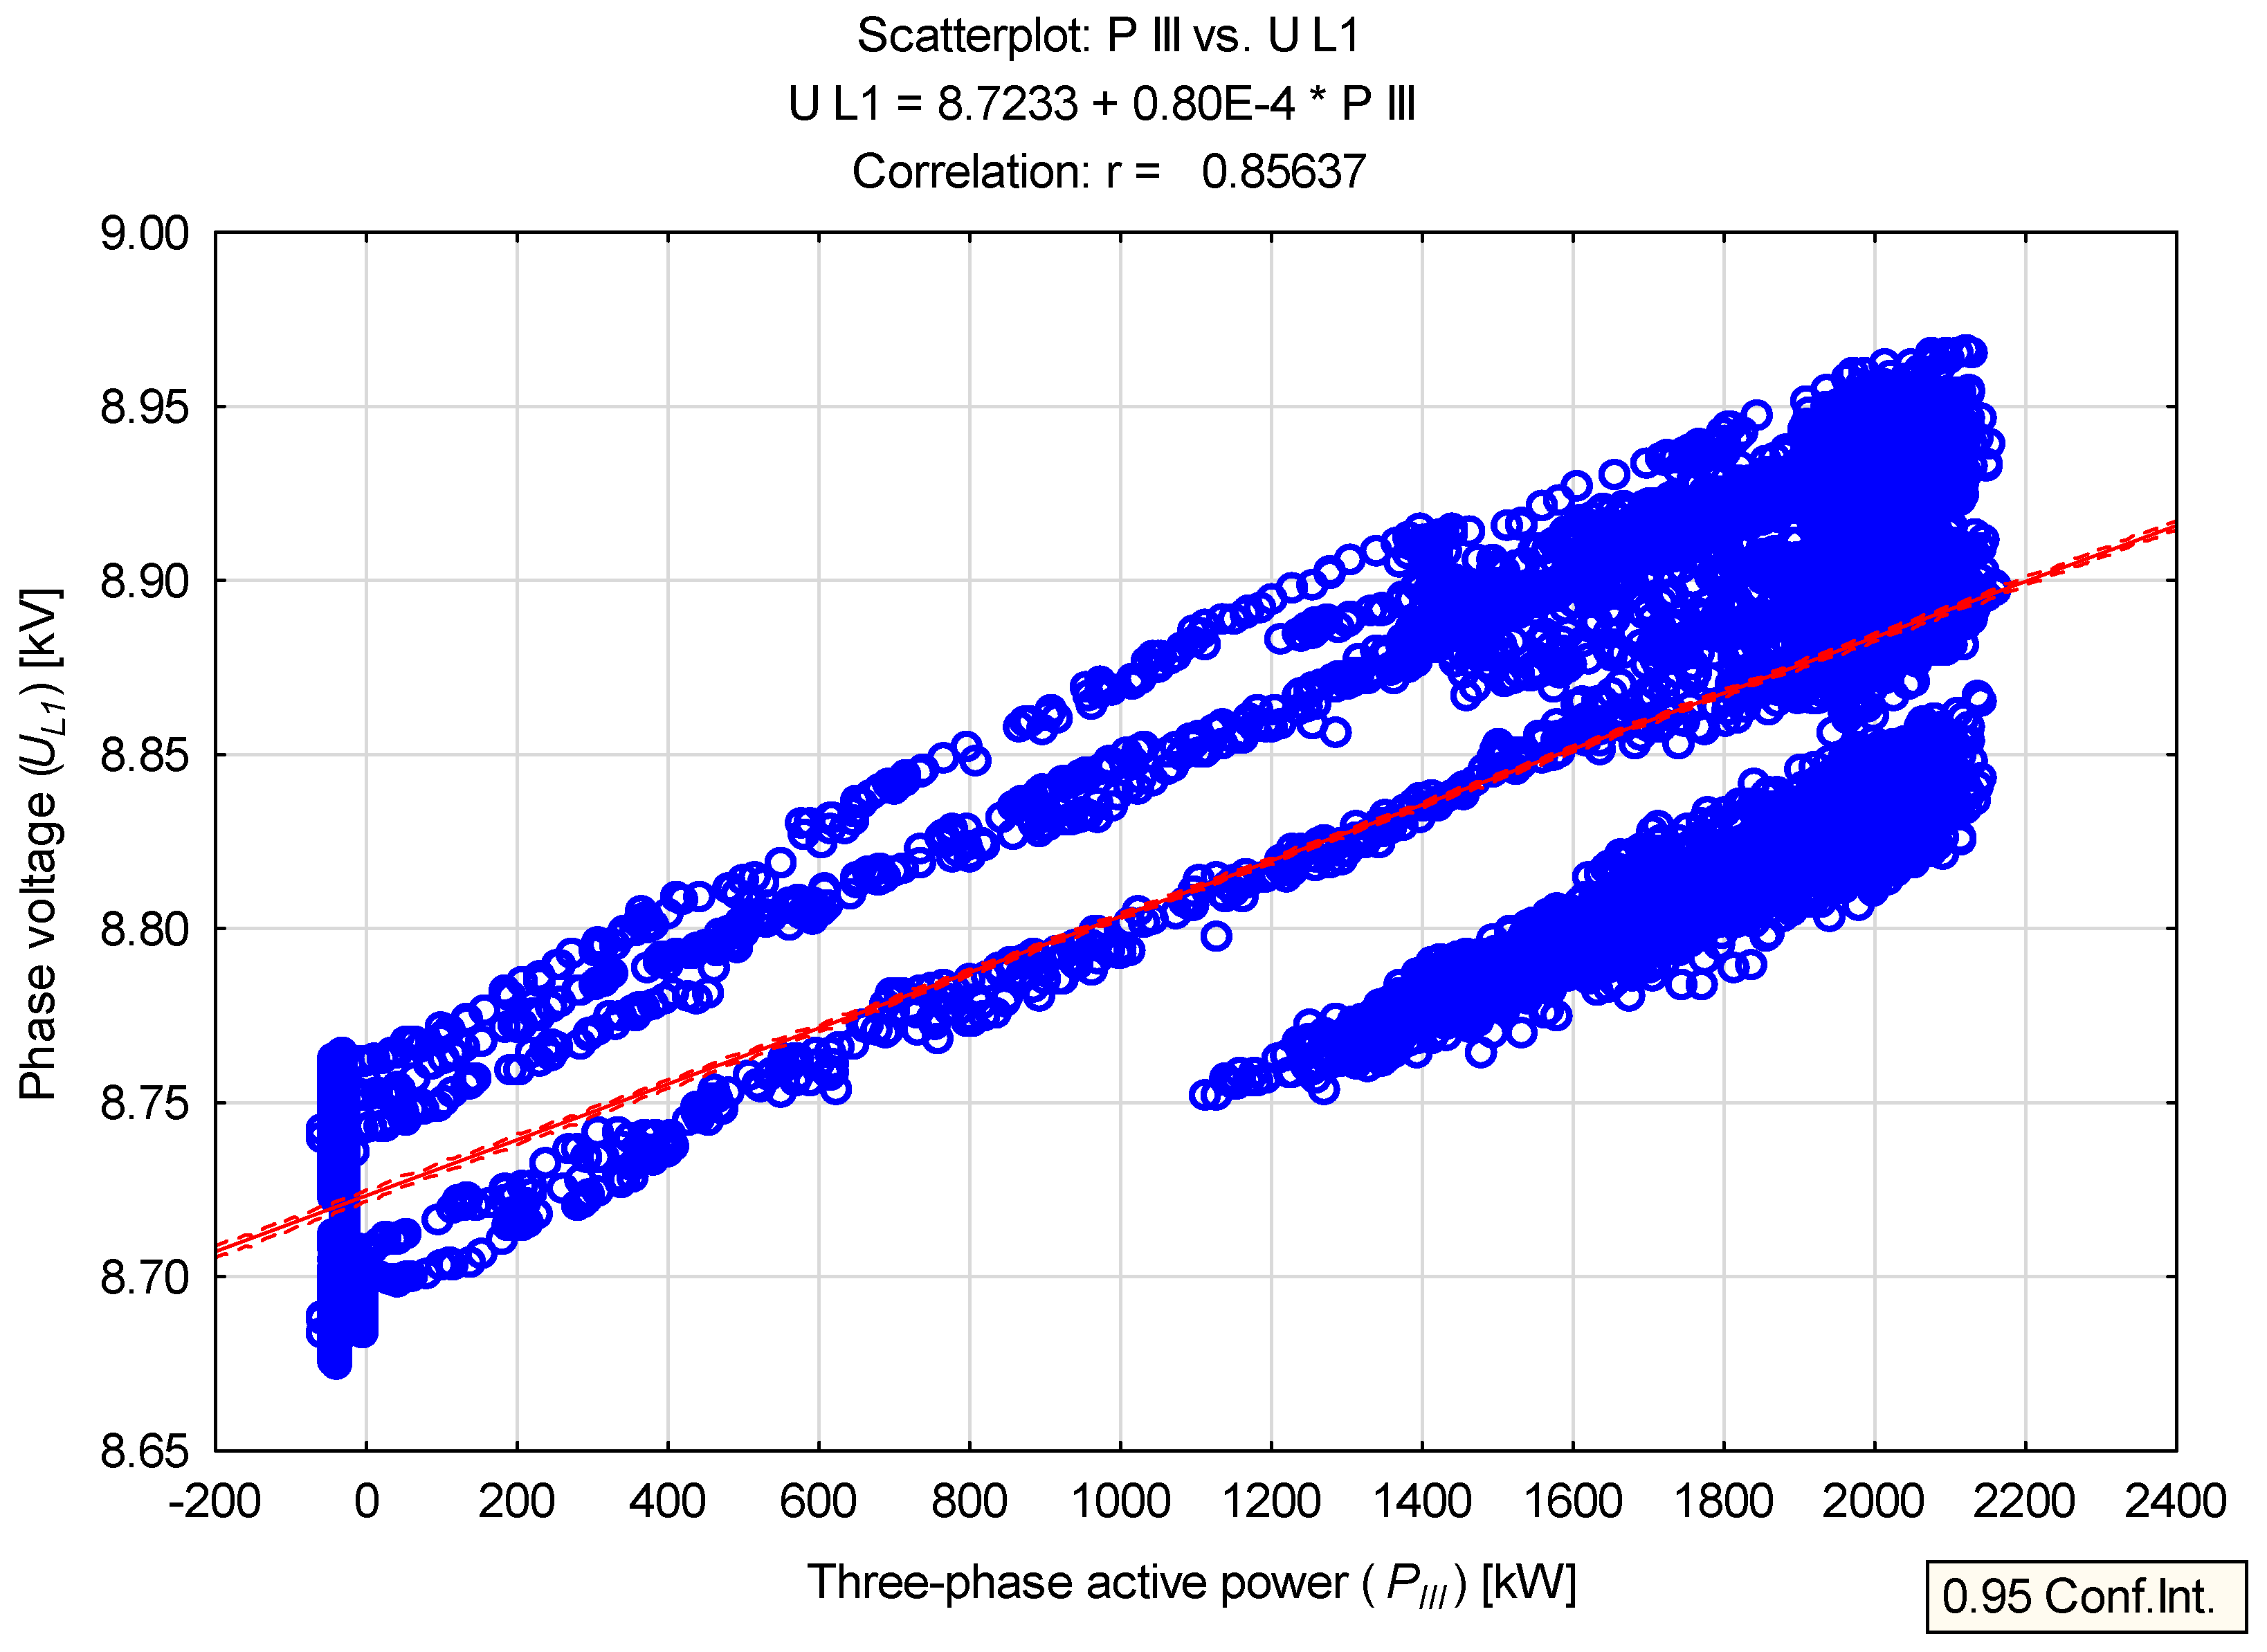
| UL1 | kV | 8.830 | 8.835 | 0.078 | 8.674 | 8.965 | 0.291 | 0.892 |
| UL2 | kV | 9.855 | 9.857 | 0.087 | 9.678 | 9.997 | 0.318 | 0.890 |
| UL3 | kV | 8.783 | 8.793 | 0.085 | 8.608 | 8.919 | 0.311 | 0.975 |
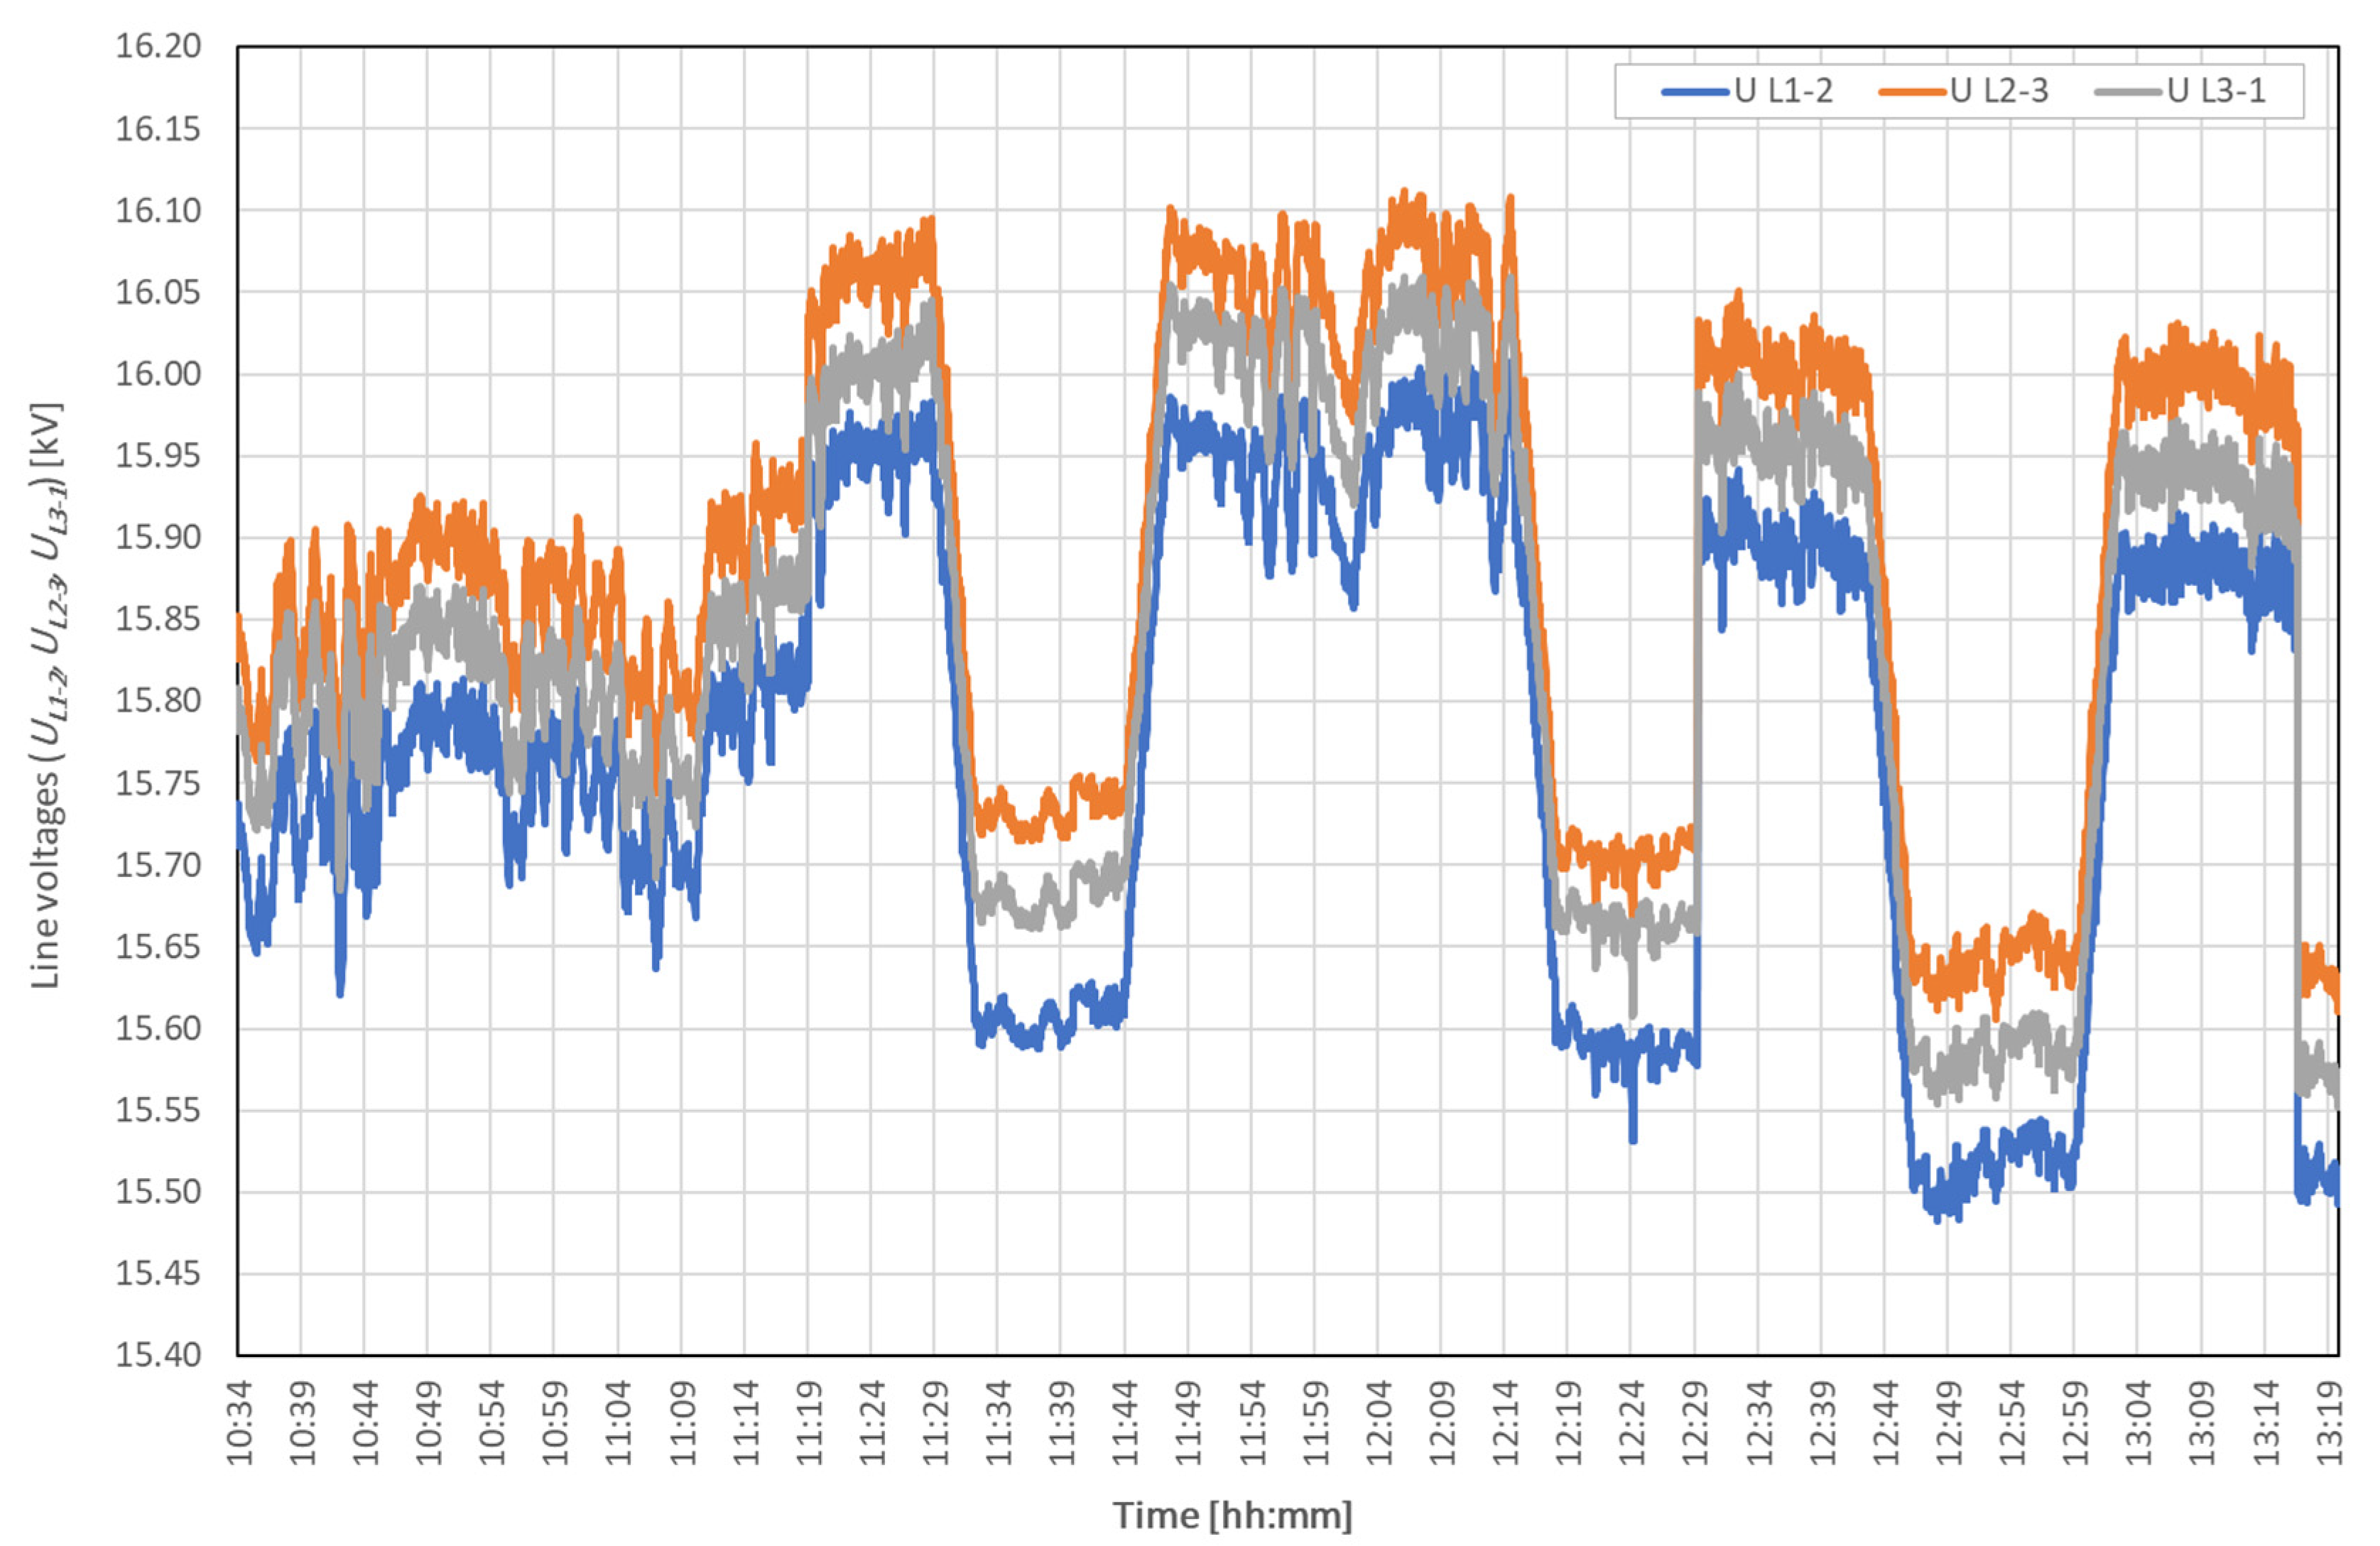
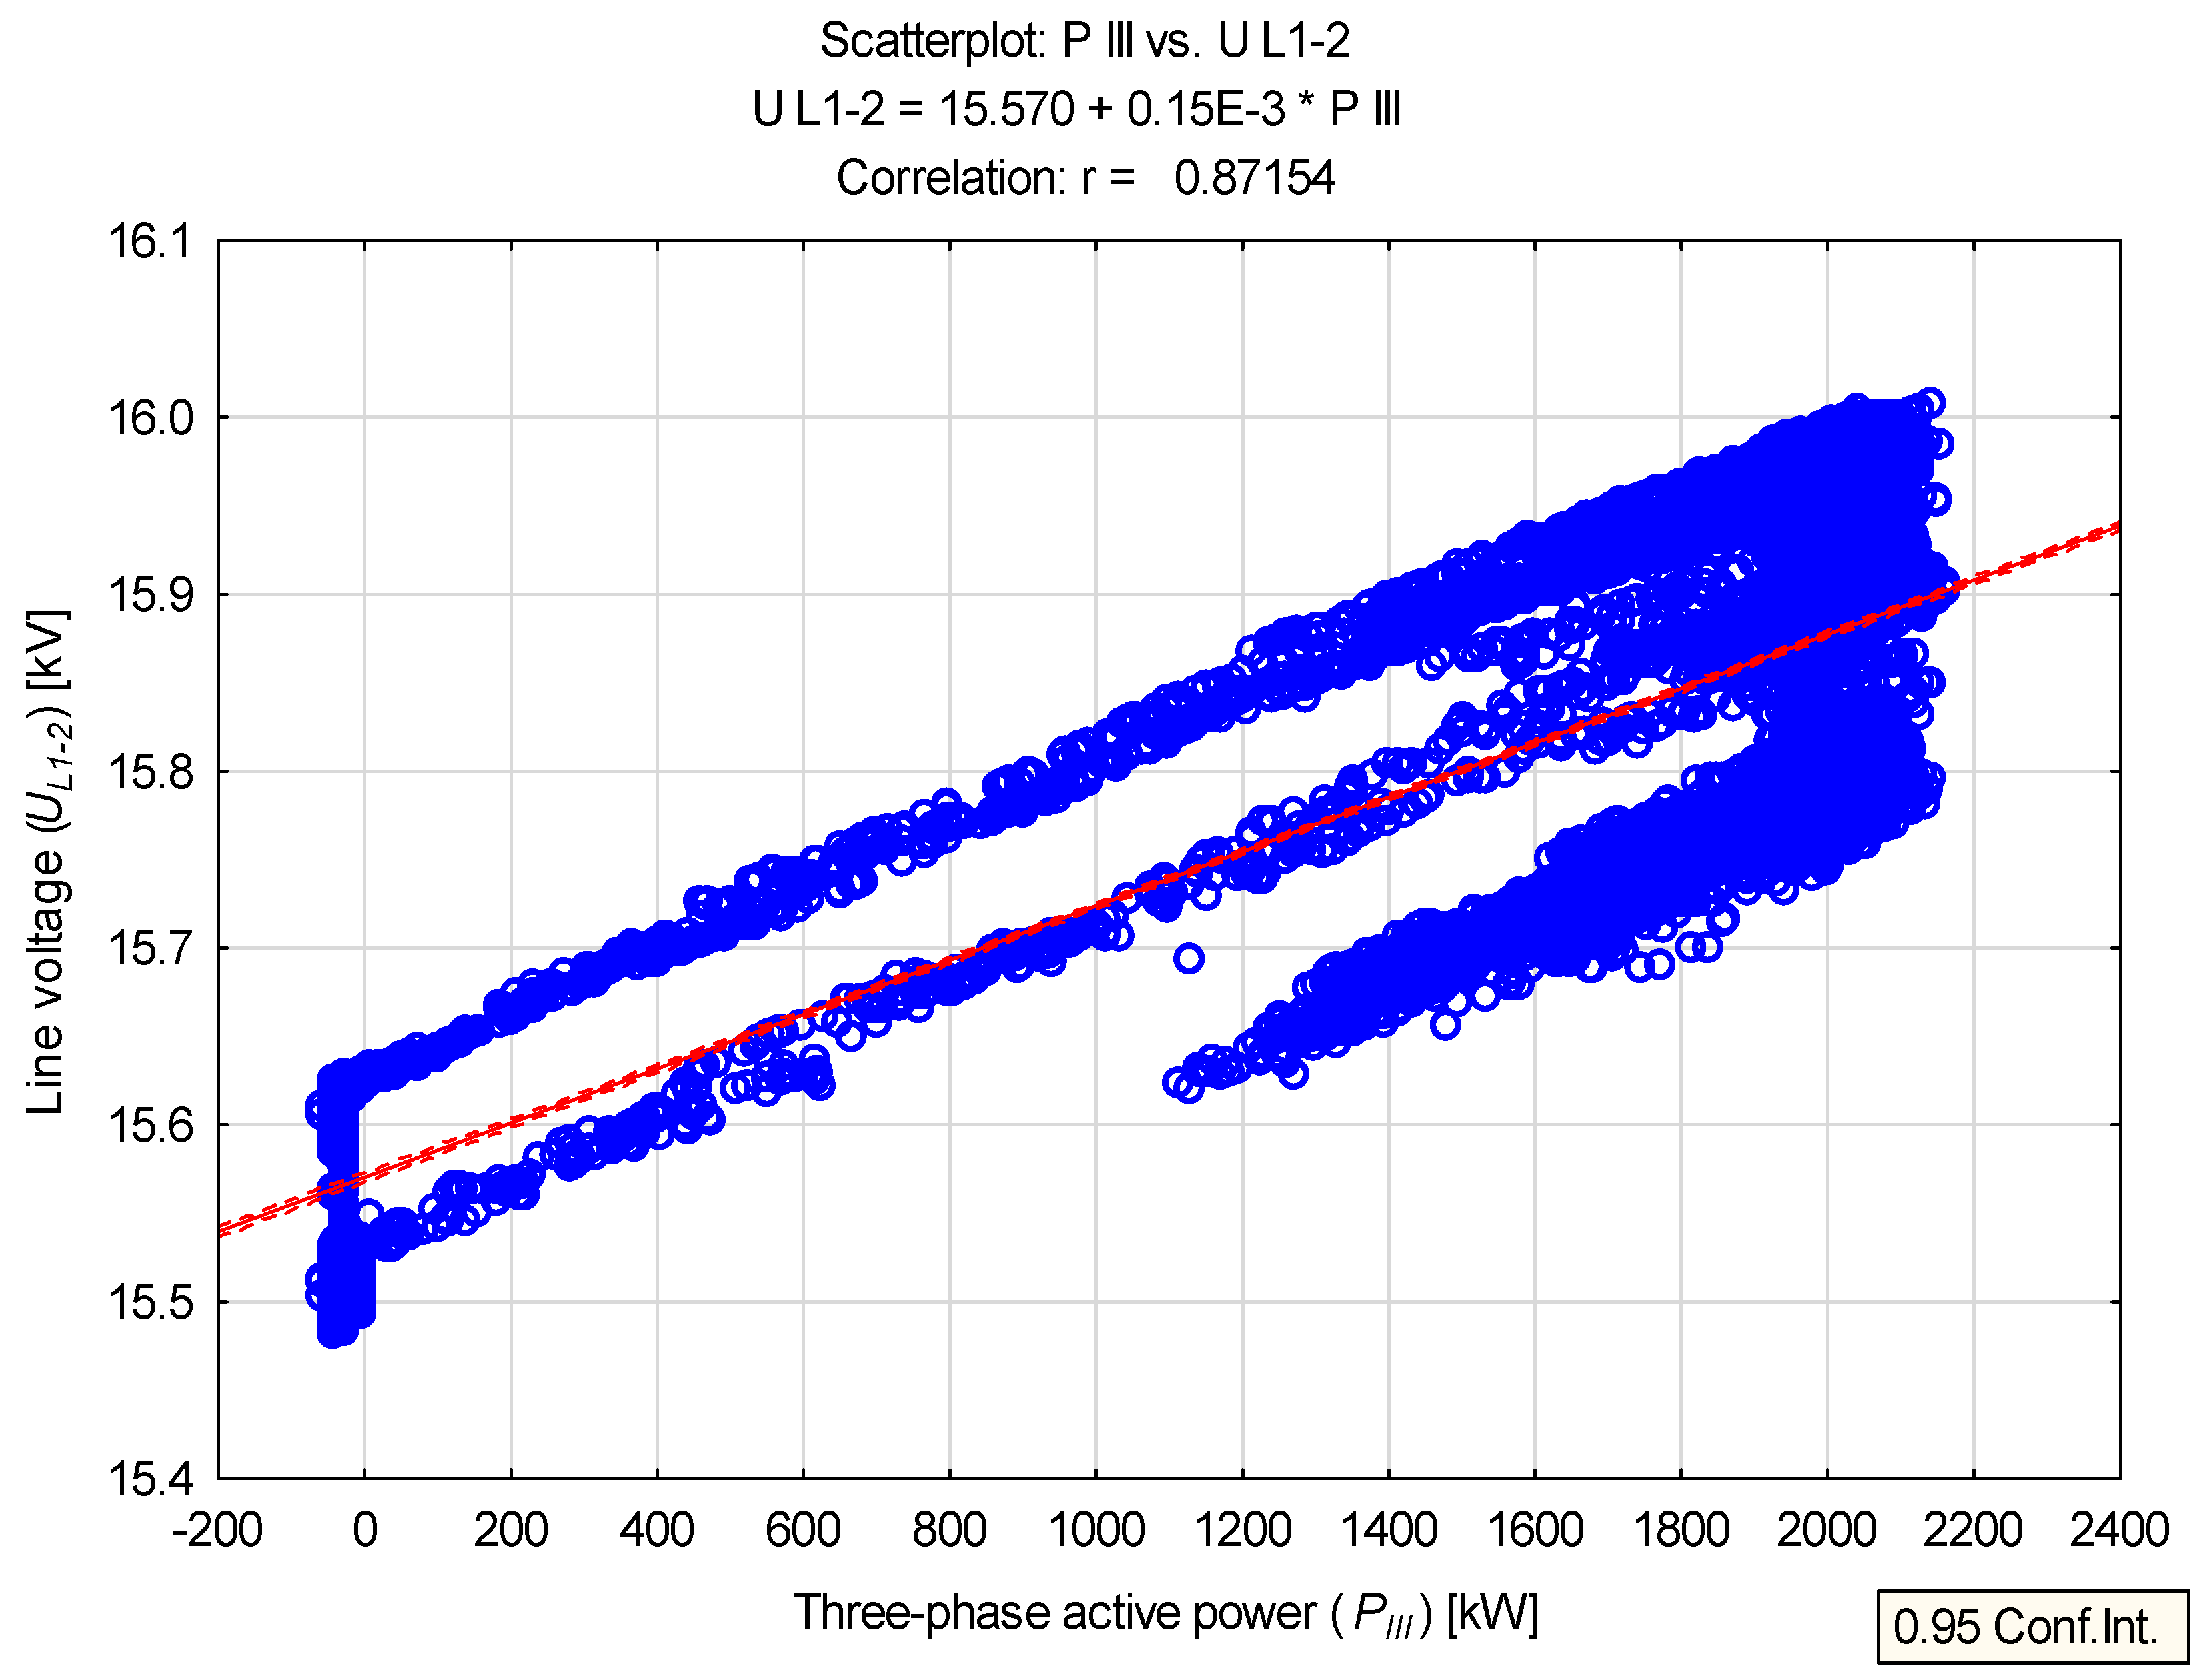
| UL1-2 | kV | 15.775 | 15.787 | 0.148 | 15.482 | 16.007 | 0.525 | 0.939 |
| UL2-3 | kV | 15.888 | 15.896 | 0.143 | 15.605 | 16.112 | 0.506 | 0.905 |
| UL3-1 | kV | 15.837 | 15.845 | 0.144 | 15.551 | 16.060 | 0.508 | 0.909 |
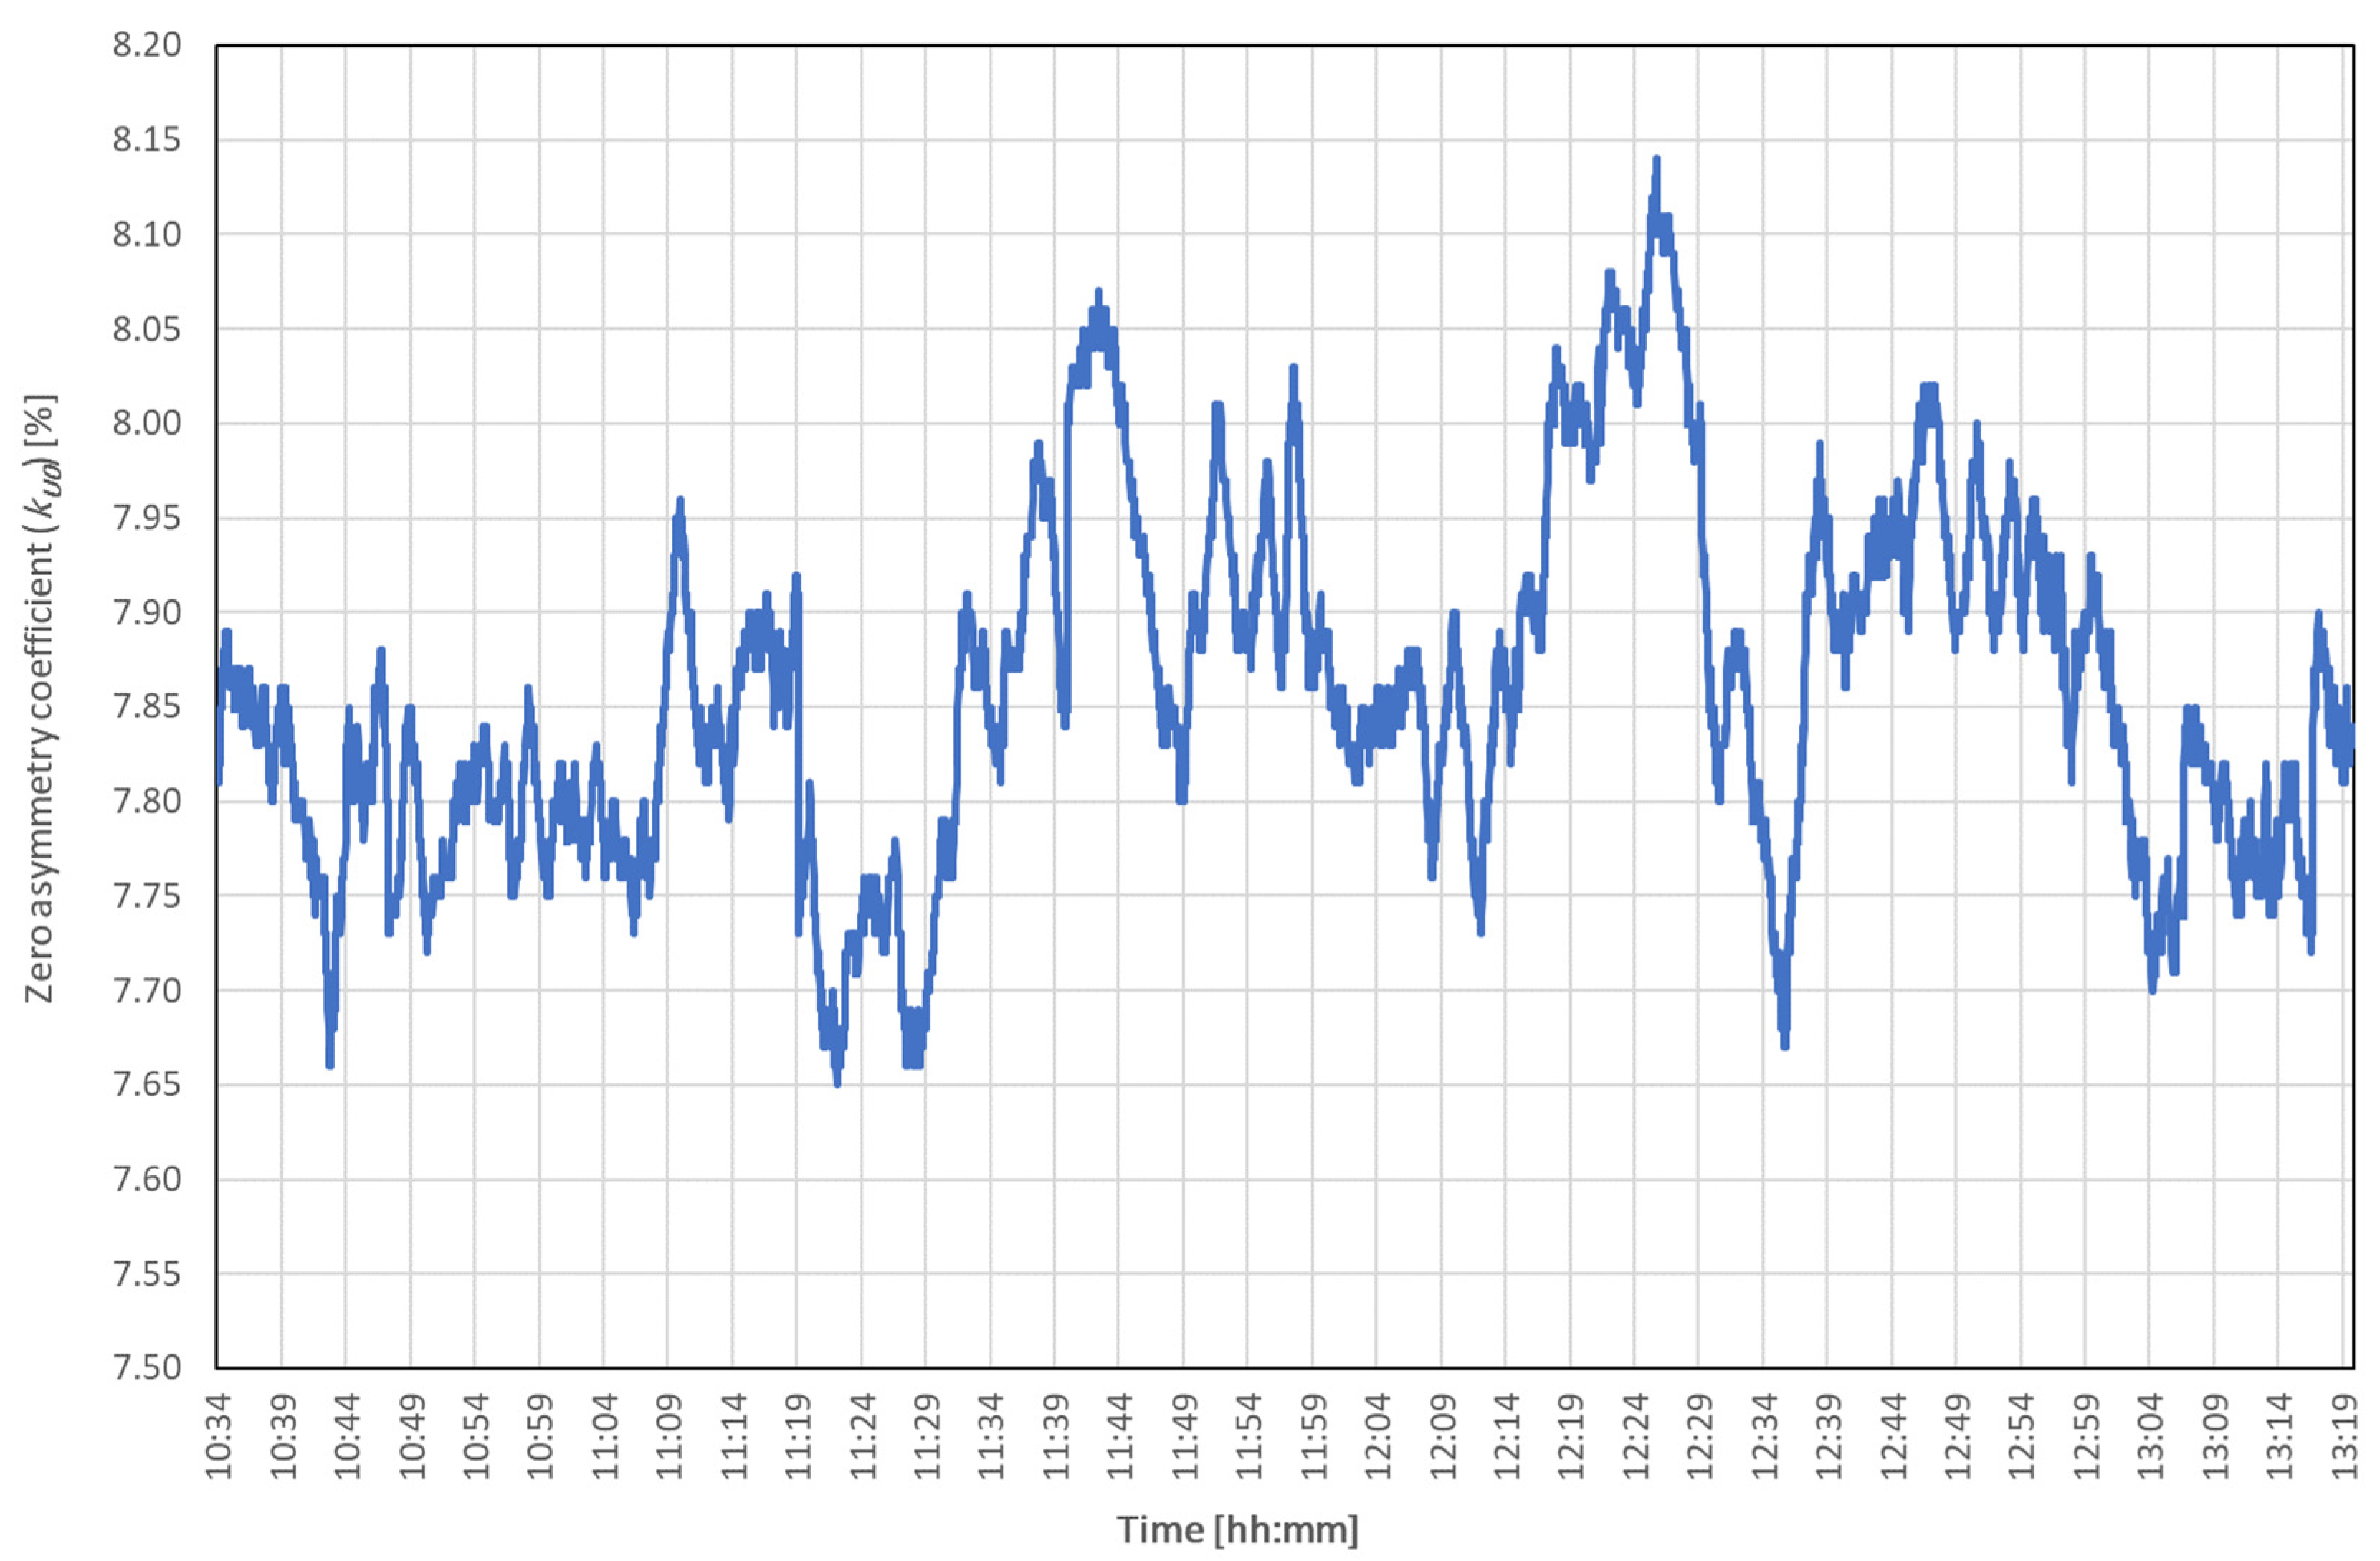
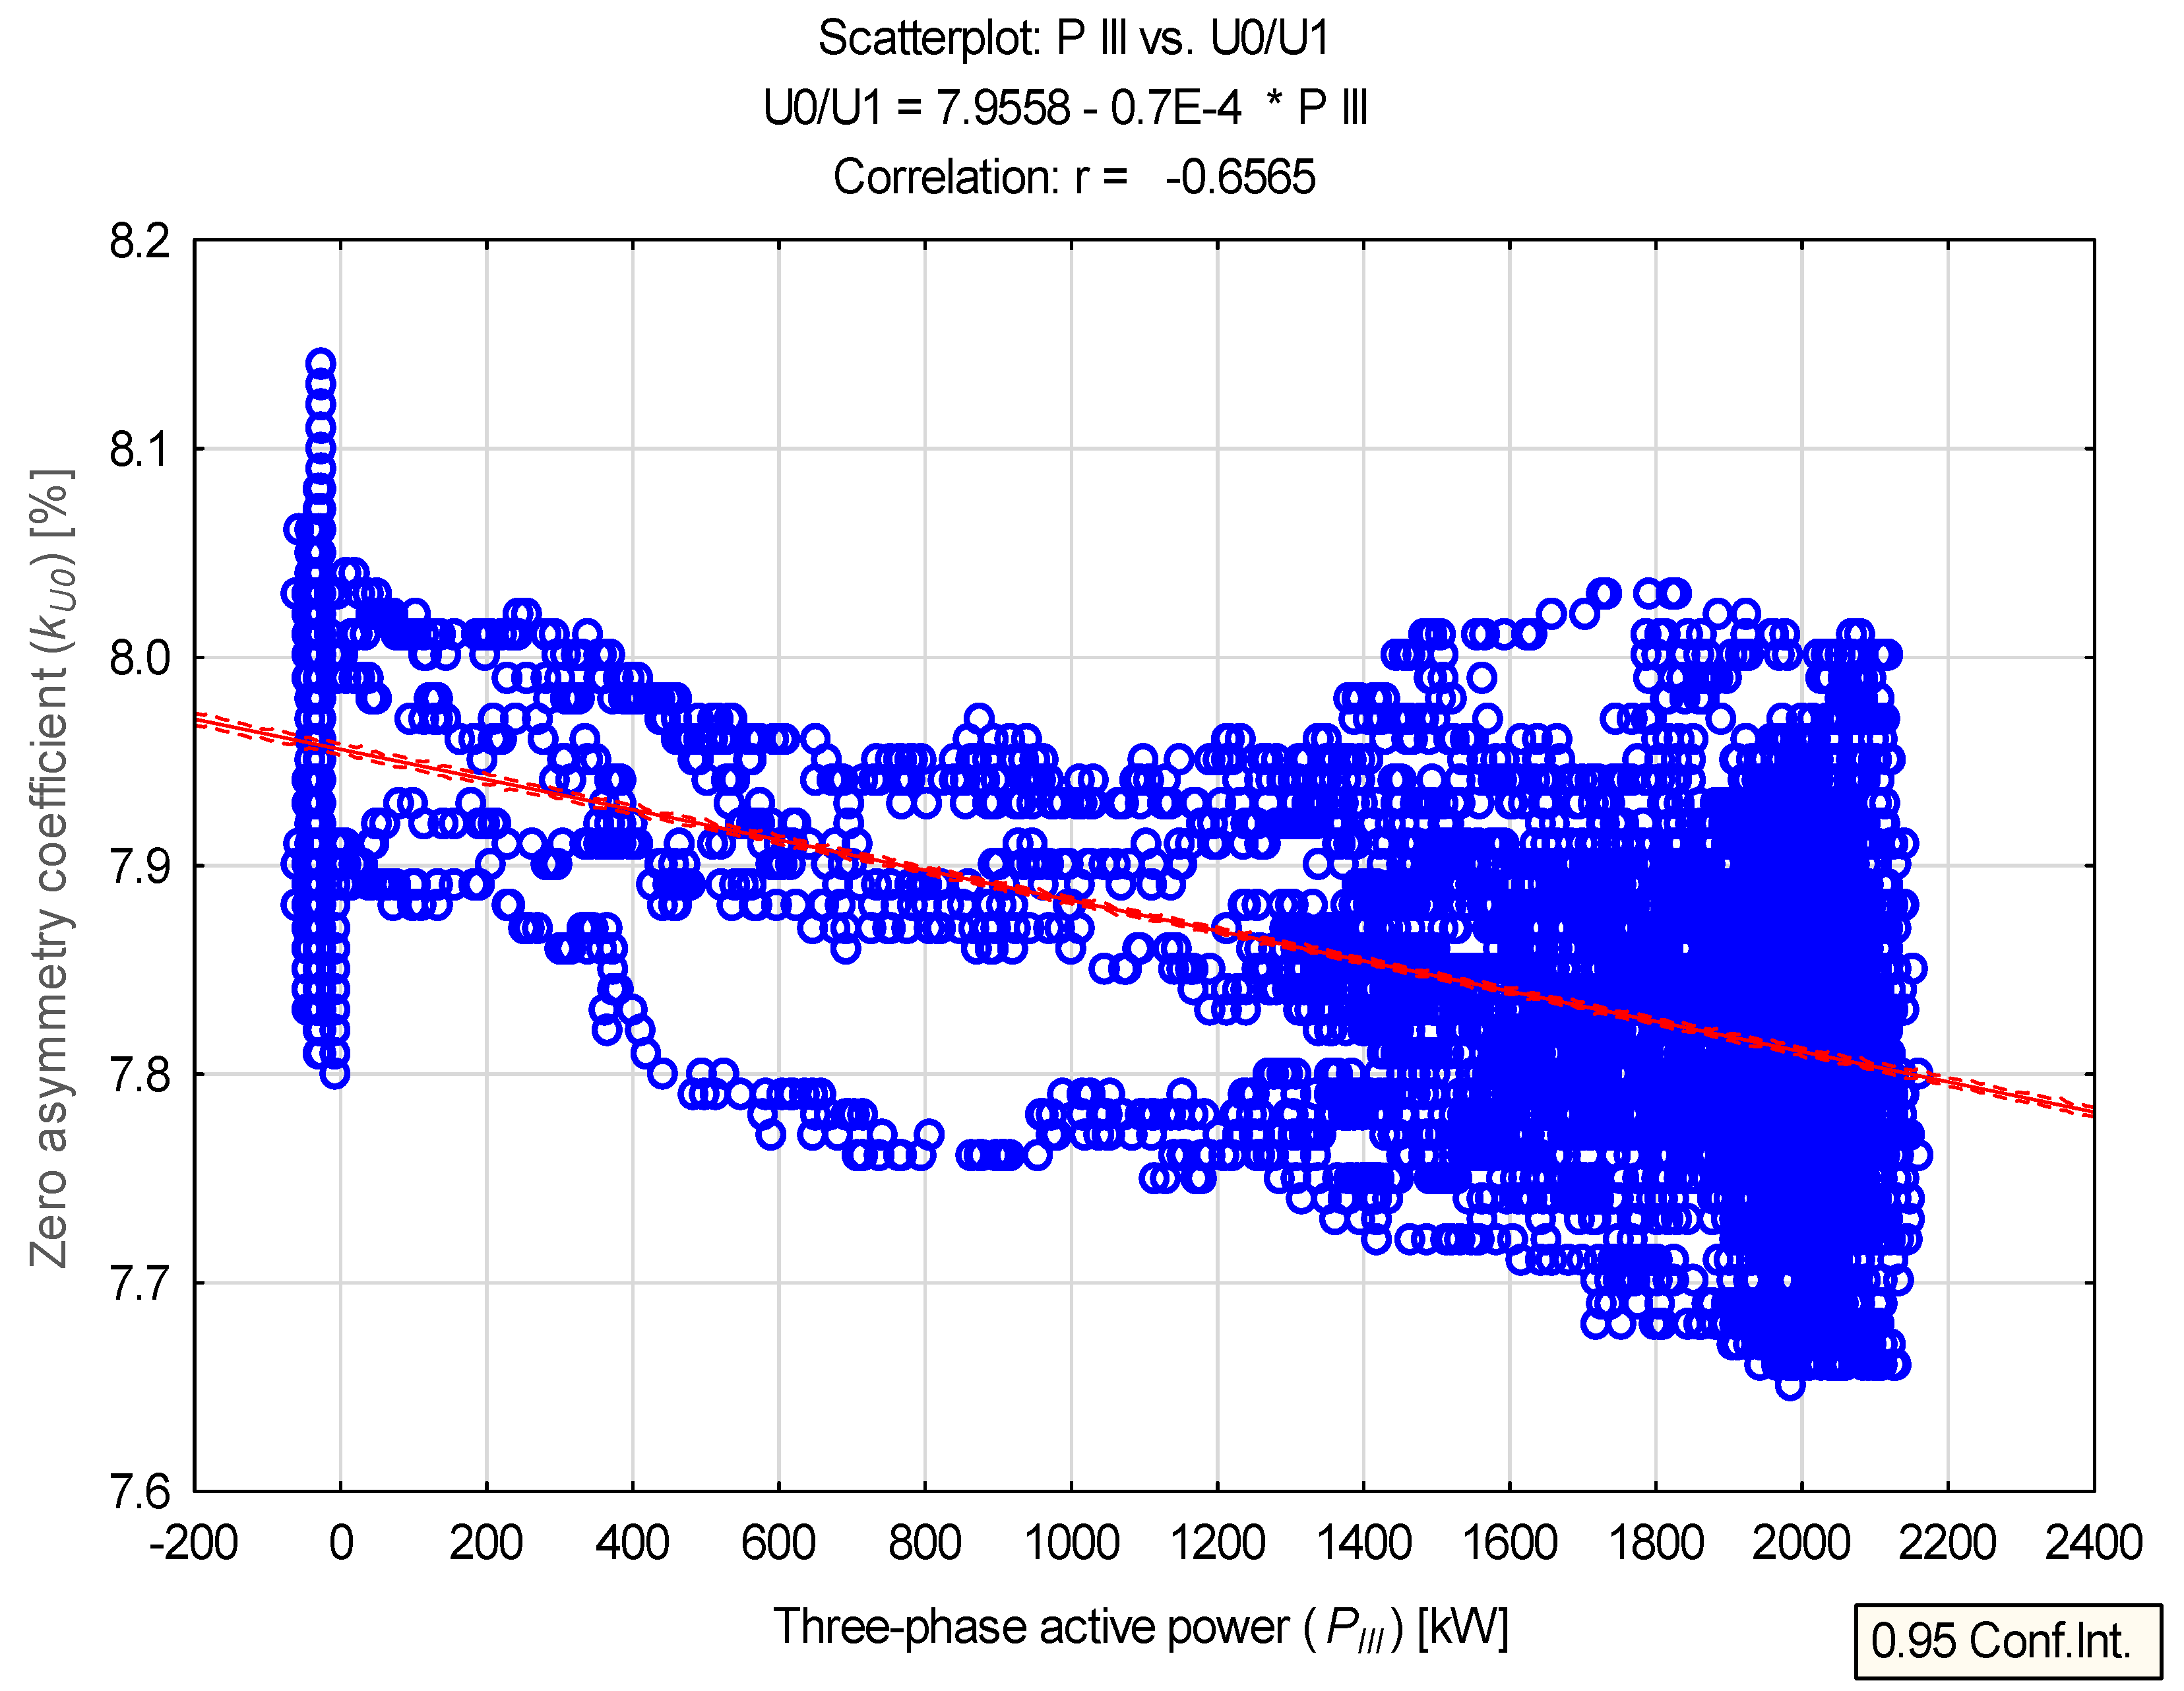
| kU0 | % | 7.859 | 7.850 | 0.092 | 7.650 | 8.140 | 0.490 | 1.180 |
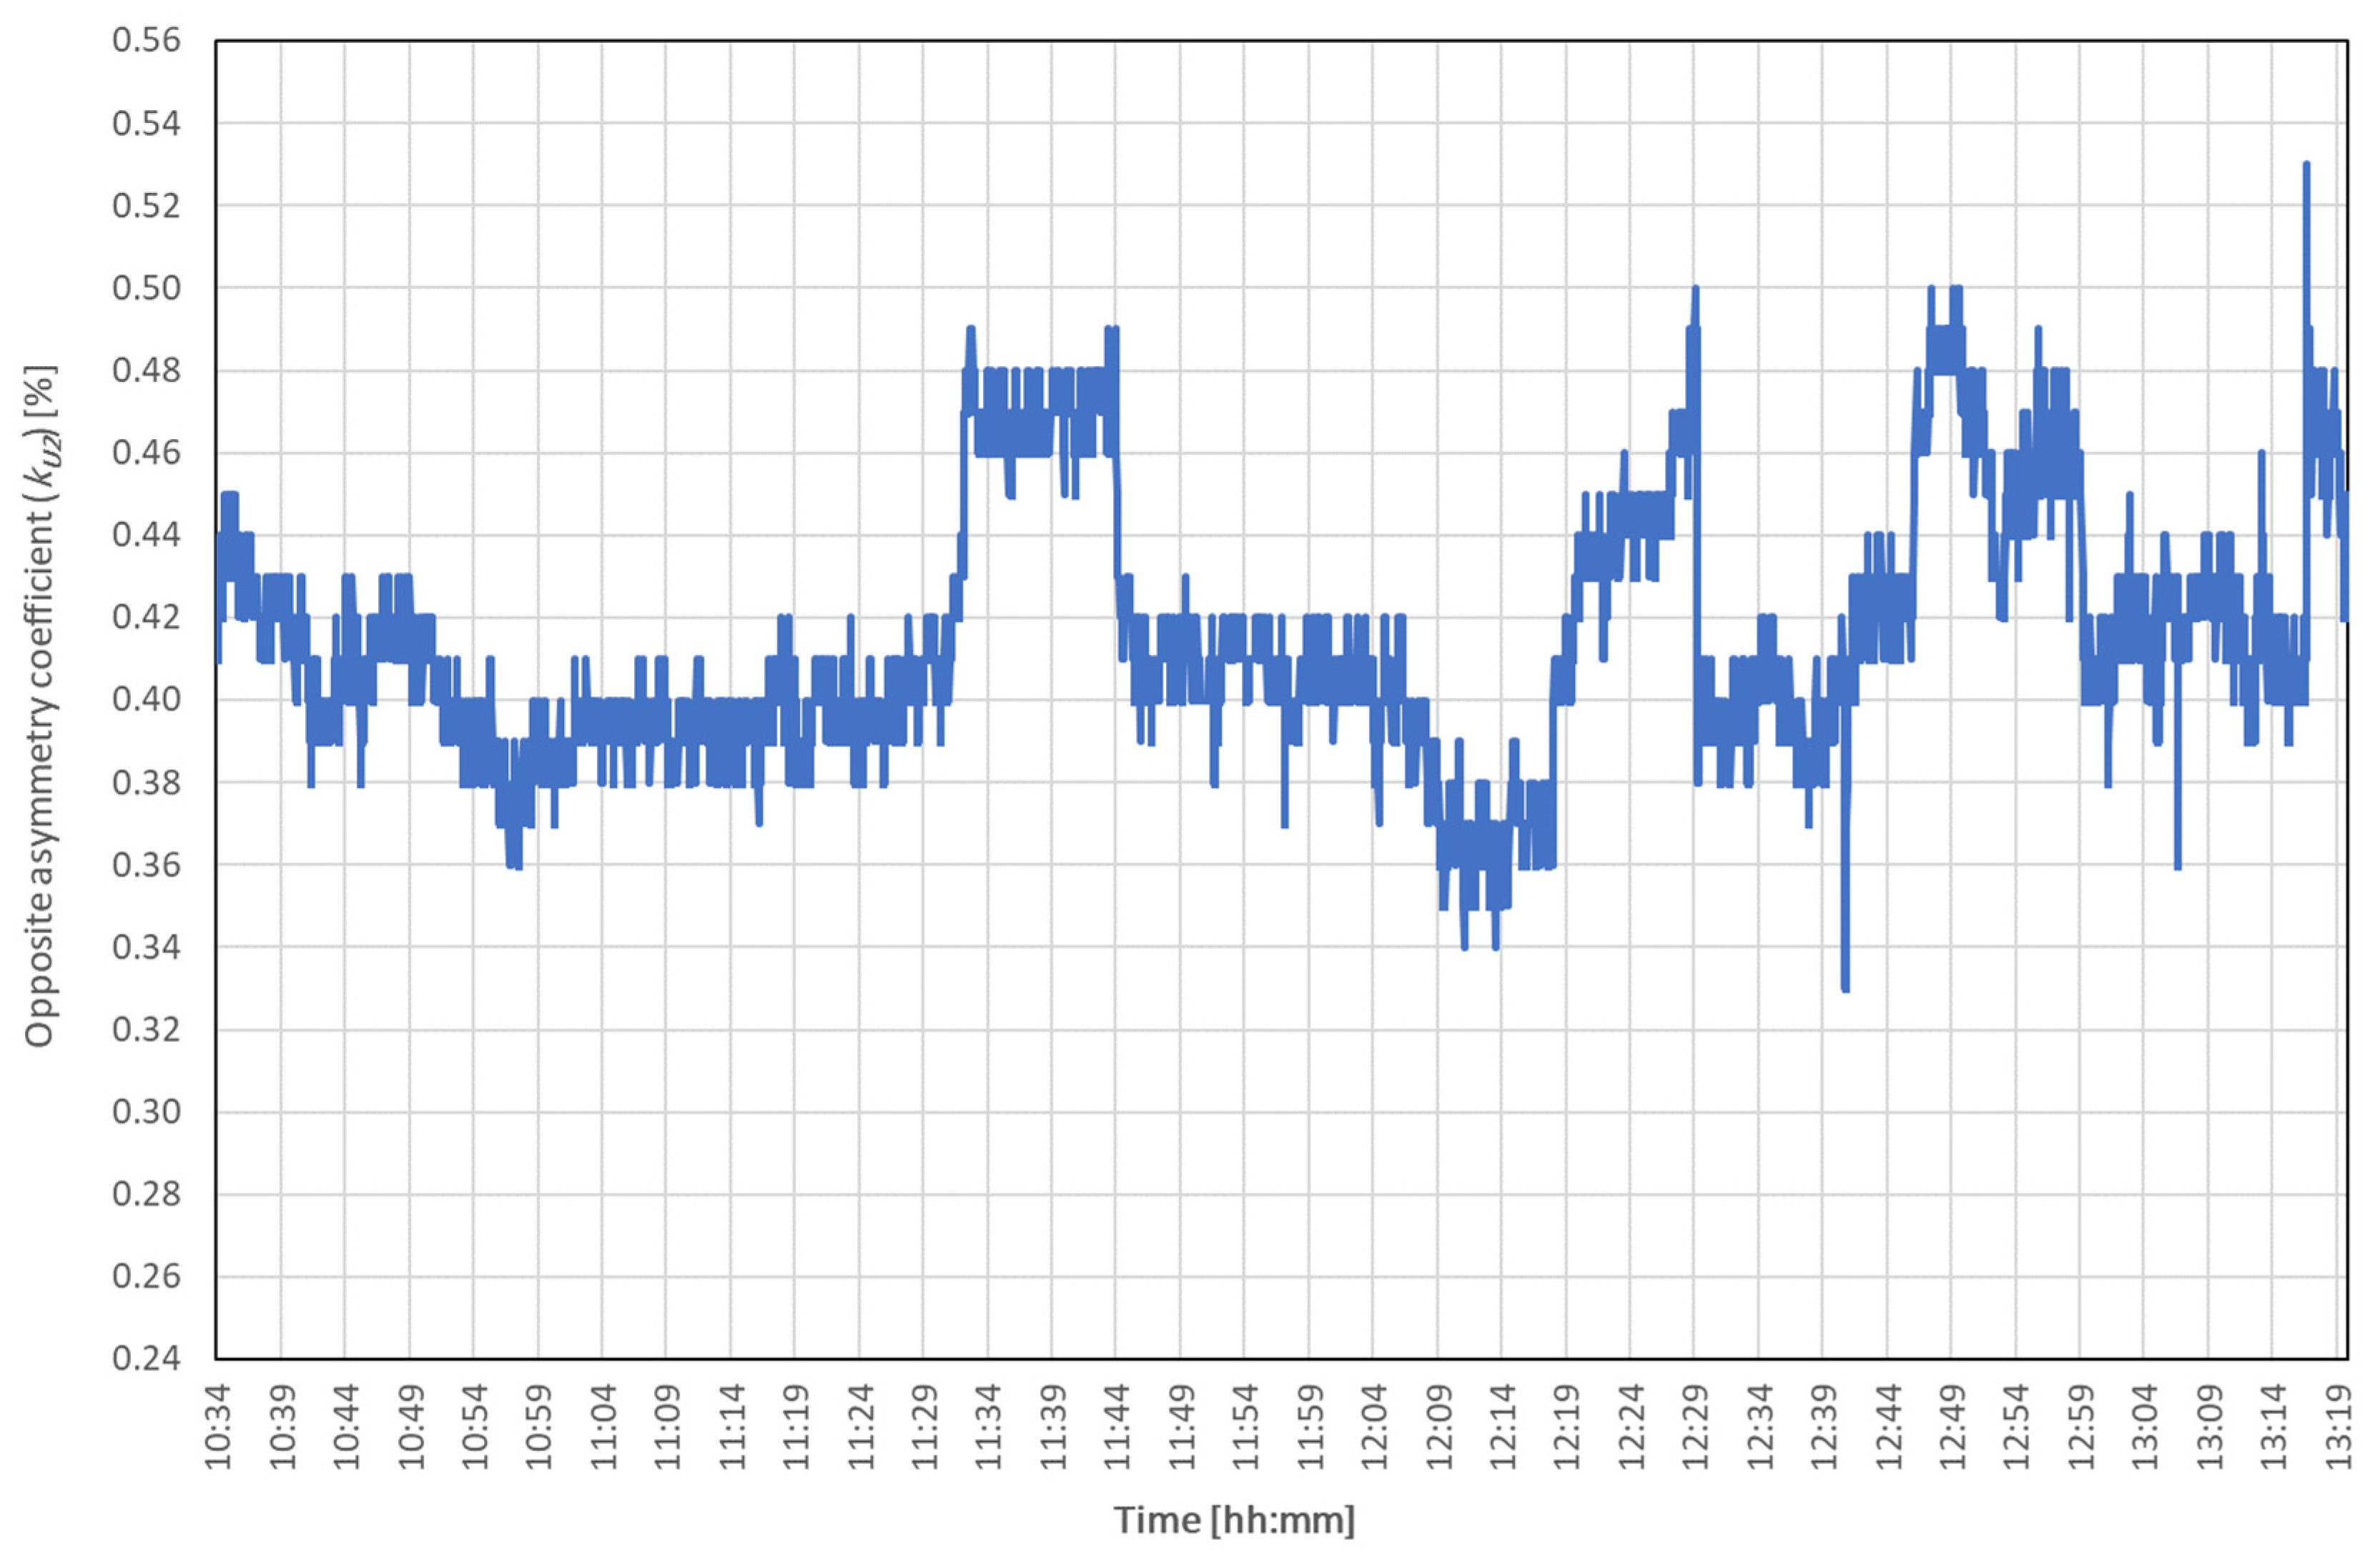
| kU2 | % | 0.416 | 0.410 | 0.030 | 0.330 | 0.530 | 0.200 | 7.231 |
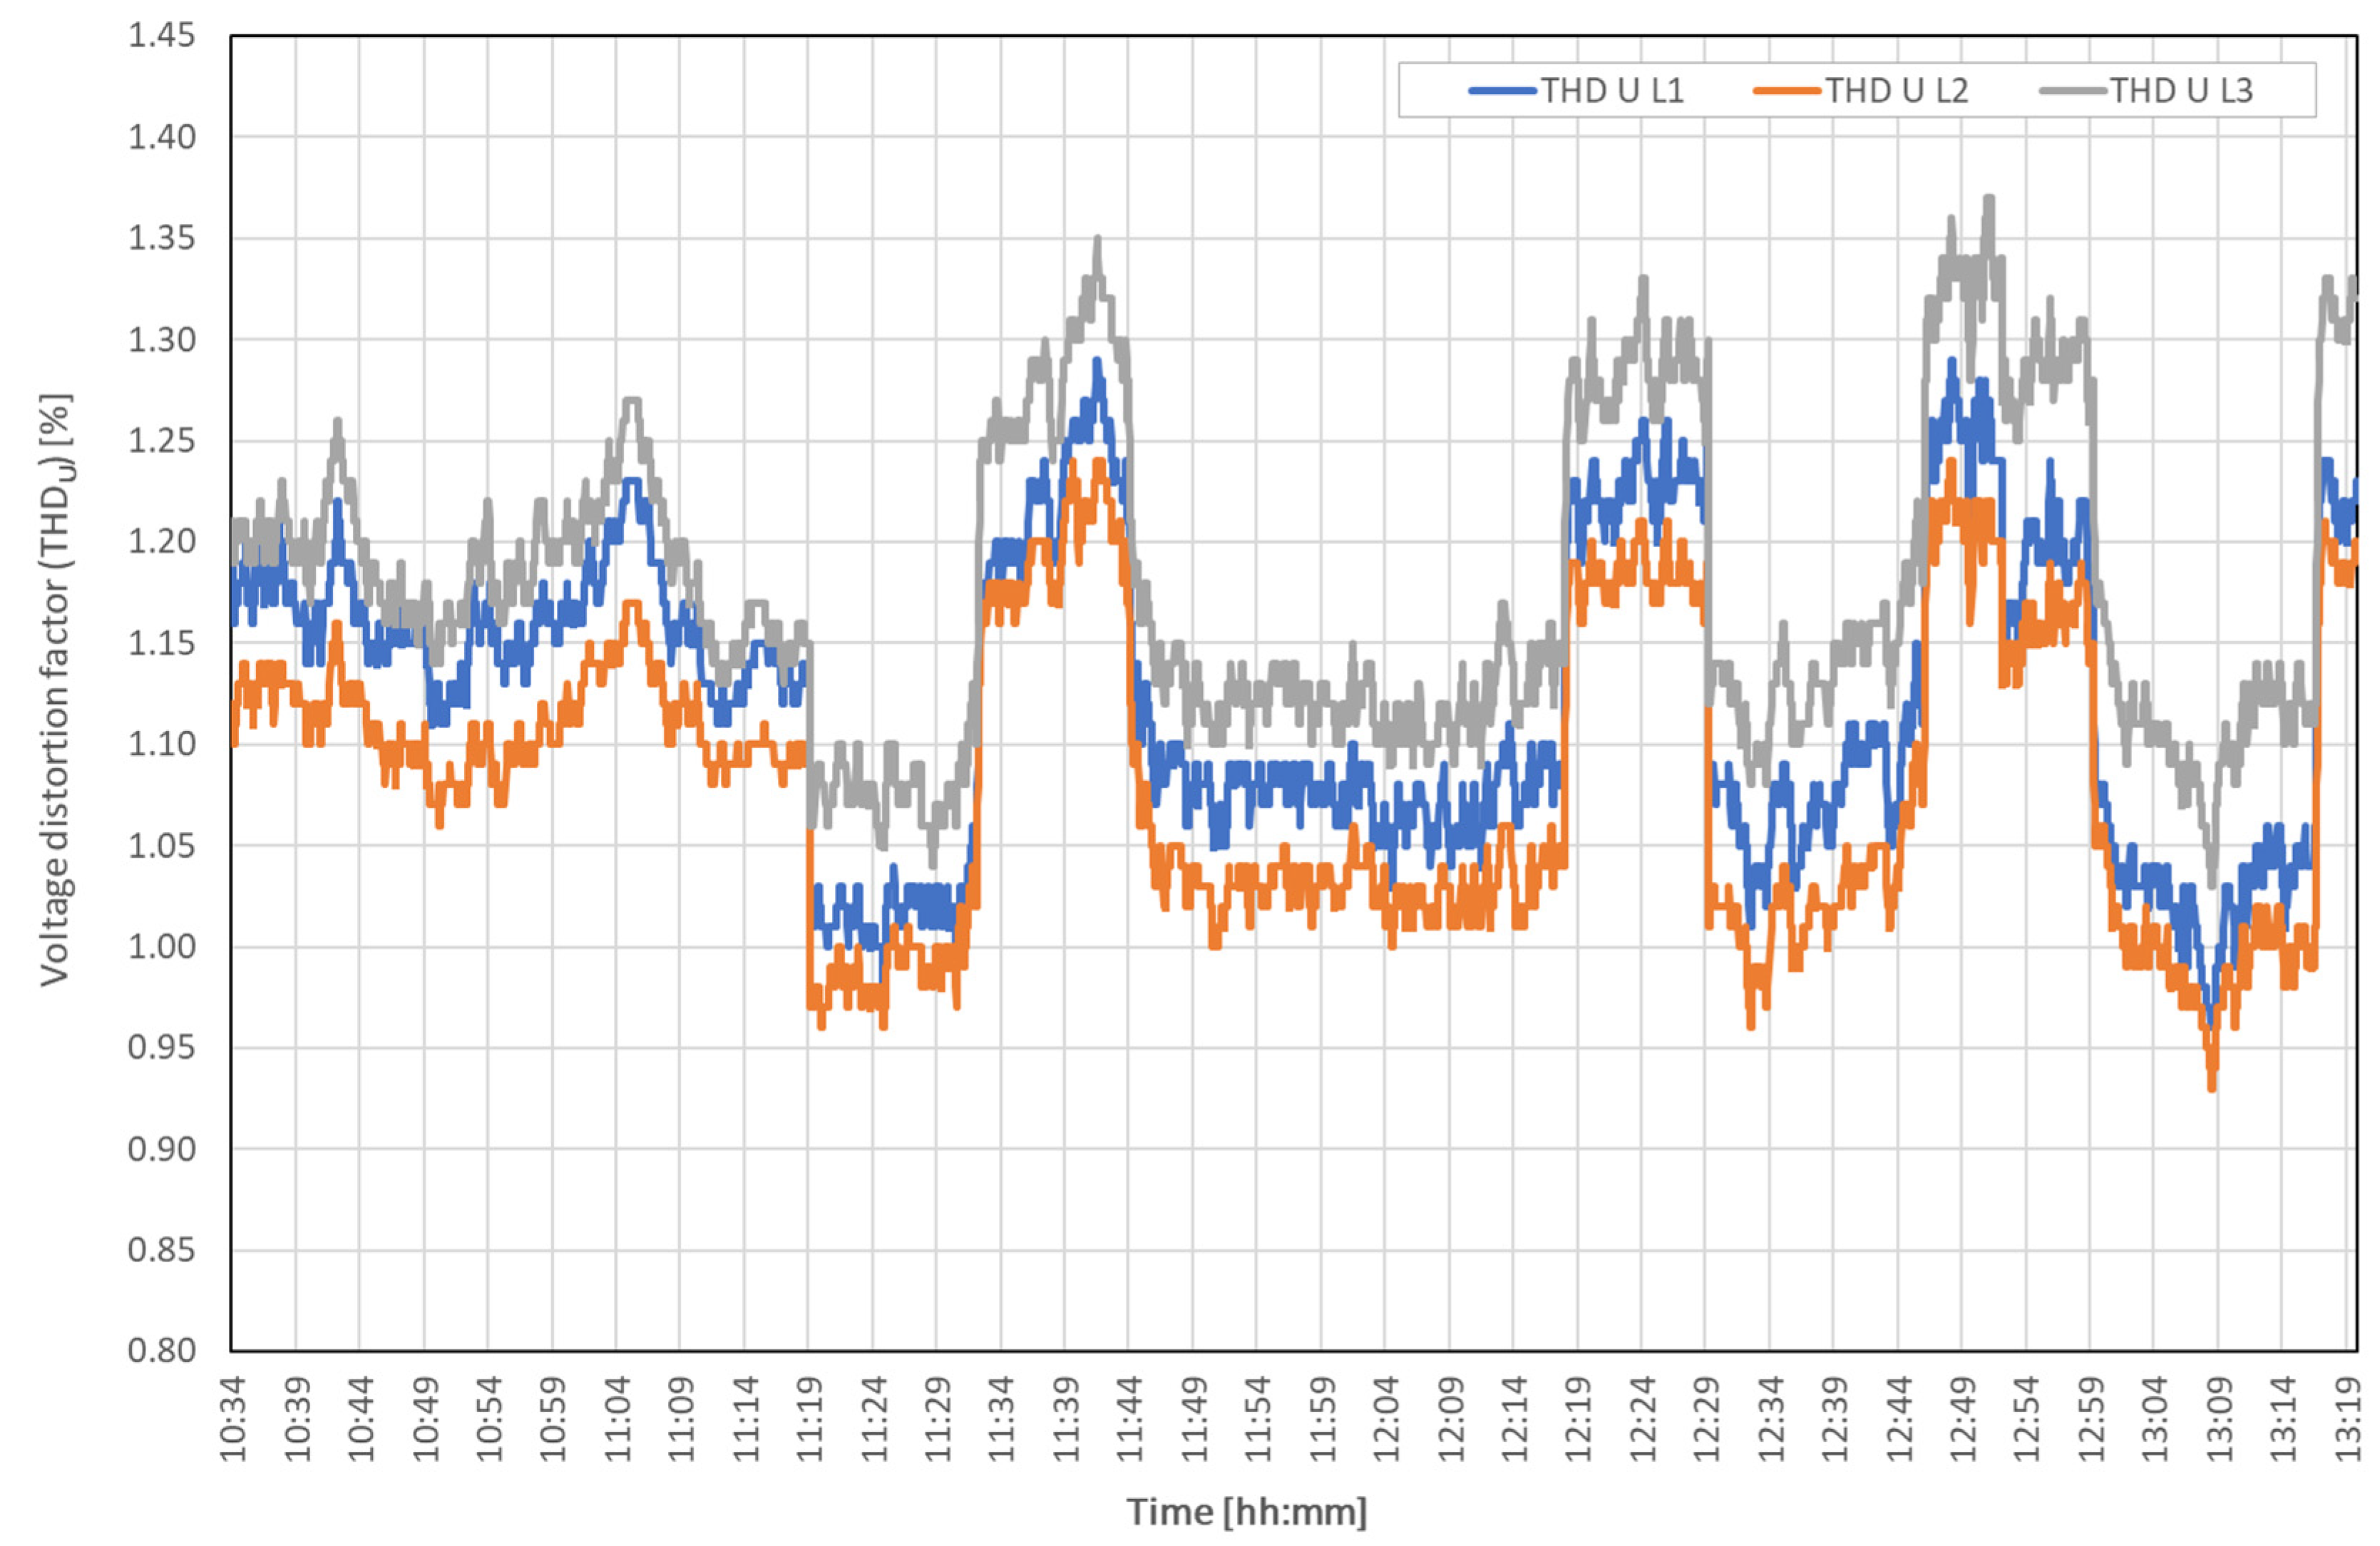
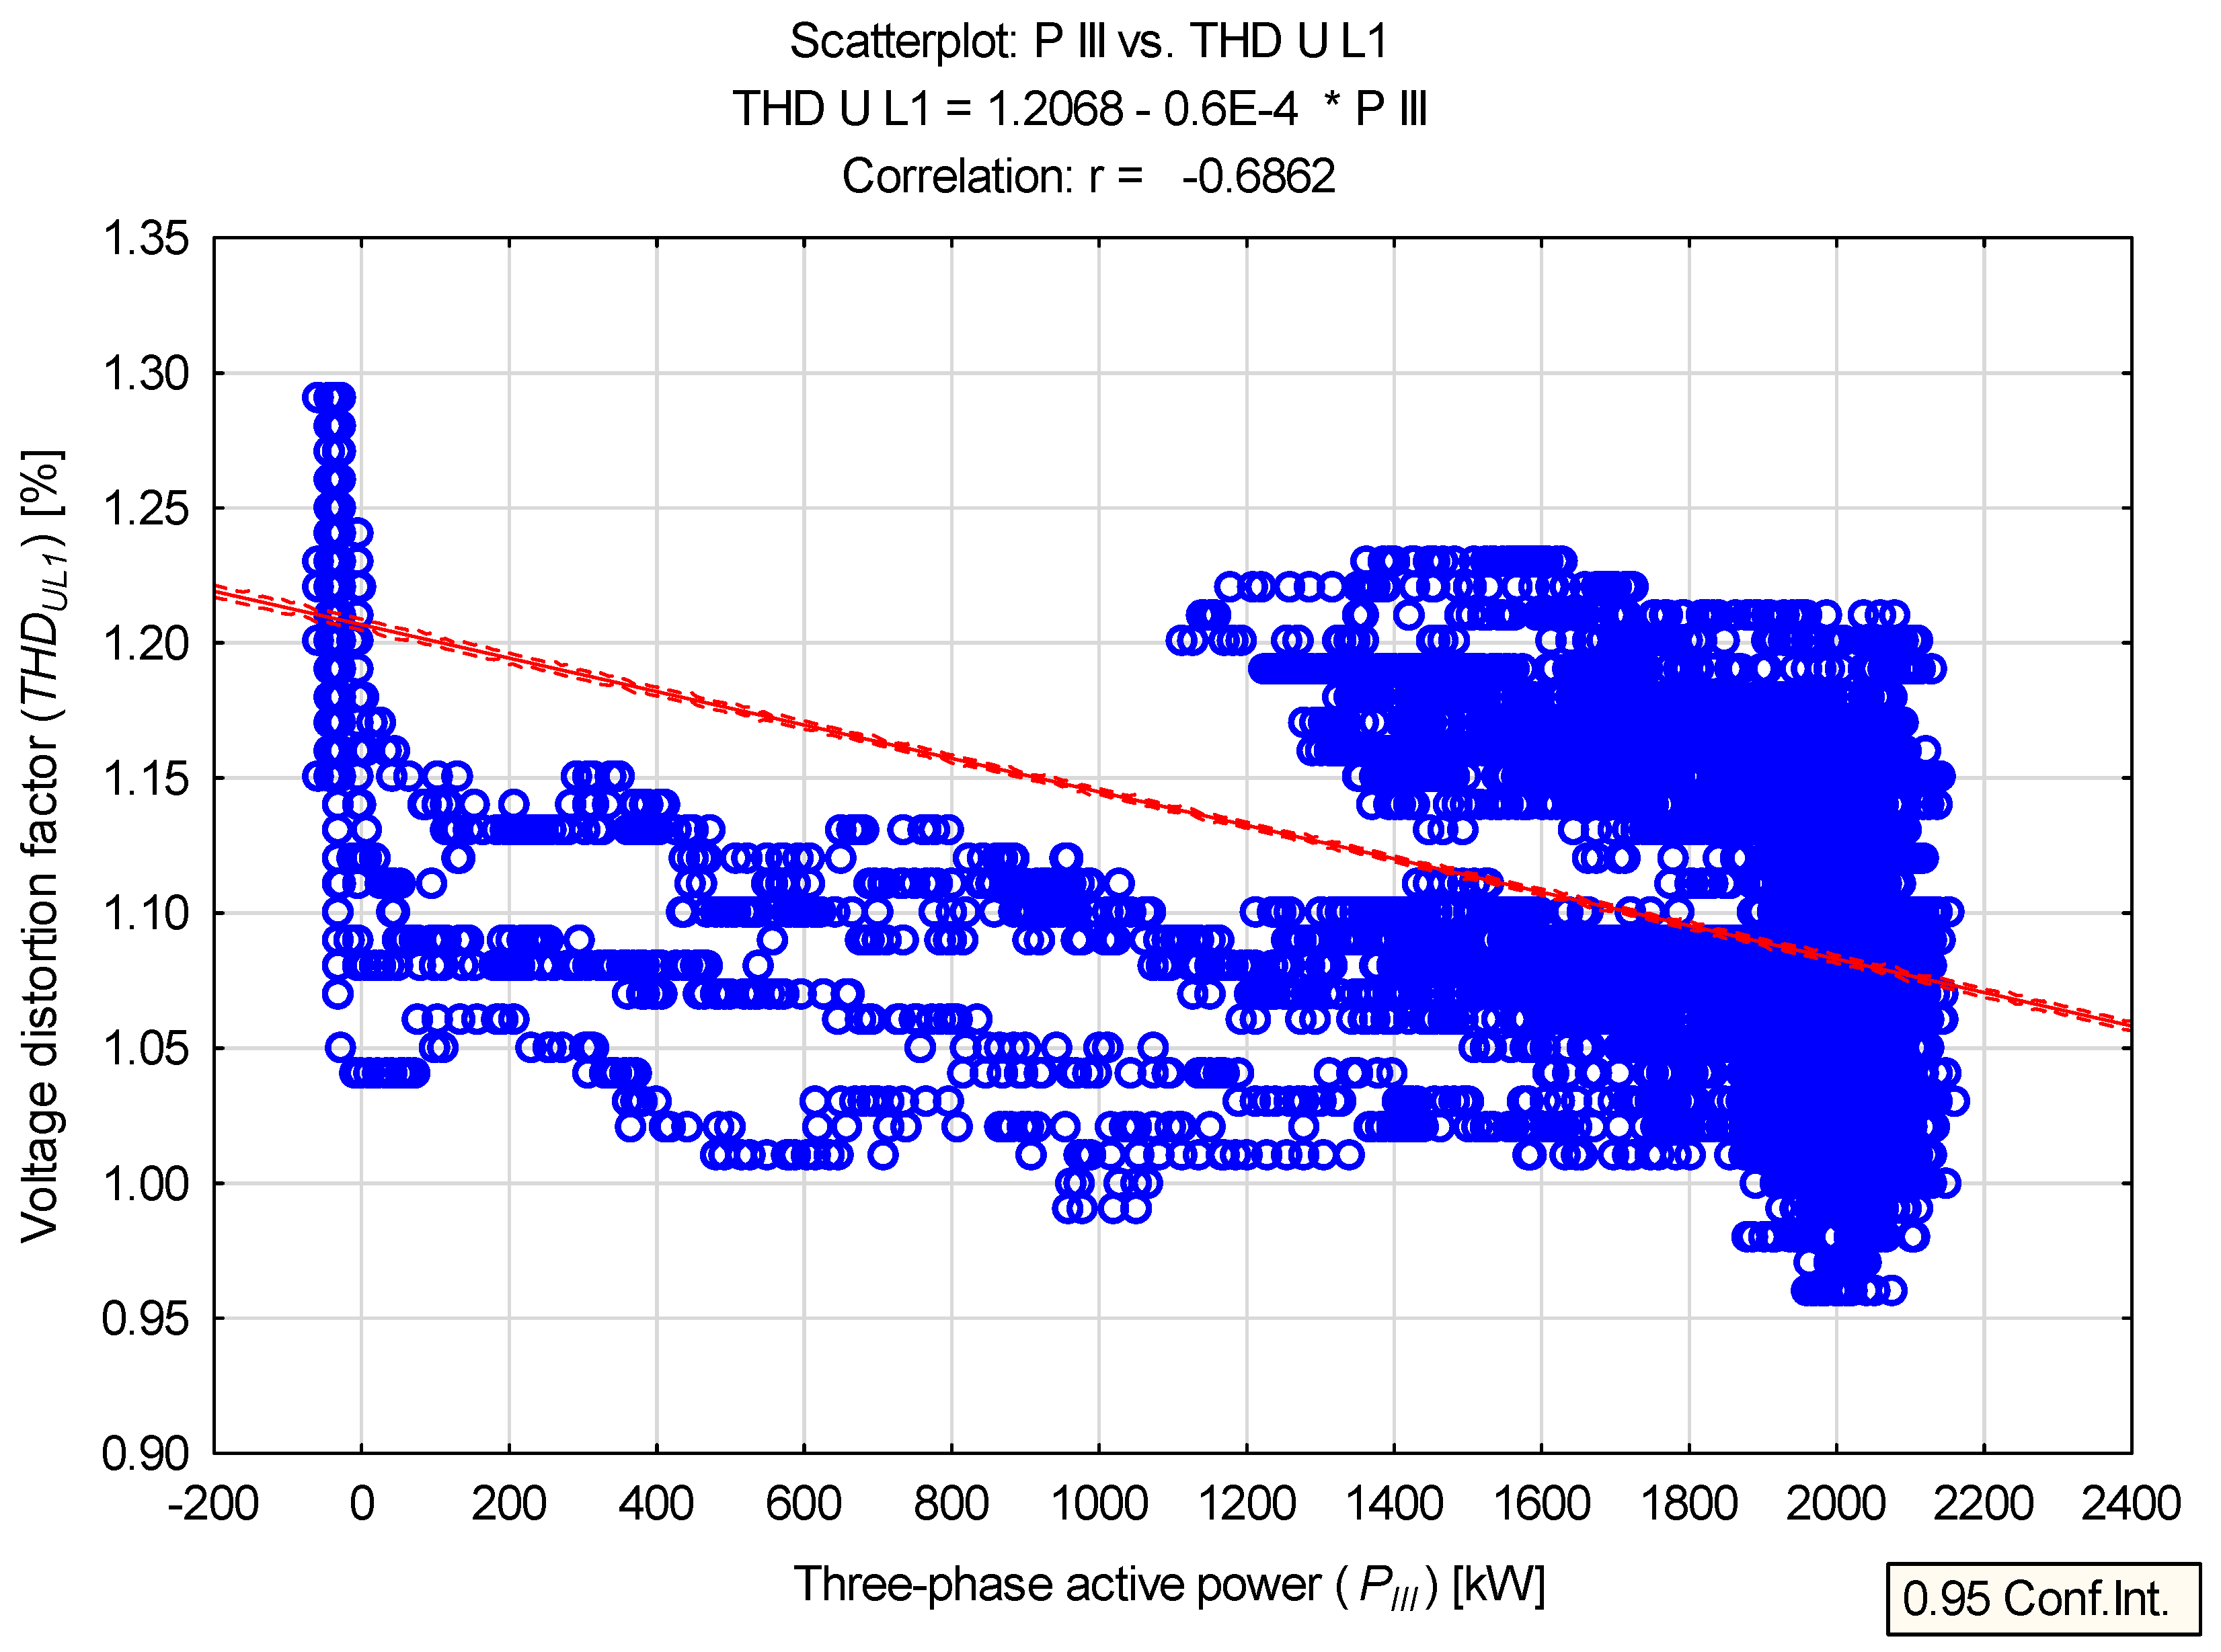
| THDUL1 | % | 1.124 | 1.120 | 0.075 | 0.960 | 1.290 | 0.330 | 6.749 |
| THDUL2 | % | 1.083 | 1.080 | 0.074 | 0.930 | 1.240 | 0.310 | 6.867 |
| THDUL3 | % | 1.178 | 1.160 | 0.076 | 1.030 | 1.370 | 0.340 | 6.484 |
| PL1 | kW | 420.348 | 559.446 | 265.756 | −20.018 | 681.728 | 701.747 | 63.222 |
| PL2 | kW | 479.254 | 637.063 | 301.787 | −18.699 | 777.342 | 796.041 | 62.970 |
| PL3 | kW | 430.951 | 573.585 | 273.605 | −20.678 | 703.075 | 723.753 | 63.488 |
| PIII | kW | 1330.554 | 1769.900 | 841.138 | −58.727 | 2161.960 | 2220.687 | 63.217 |
| Size | Linear Correlation Coefficient r | Critical Level of Significance α | Test Result α > 0.05 |
|---|---|---|---|
| UL1 | 0.856 | 0.000 | - |
| UL2 | 0.847 | 0.000 | - |
| UL3 | 0.879 | 0.000 | - |
| UL1-2 | 0.872 | 0.000 | - |
| UL2-3 | 0.863 | 0.000 | - |
| UL3-1 | 0.858 | 0.000 | - |
| kU0 | −0.657 | 0.000 | - |
| kU2 | −0.745 | 0.000 | - |
| THDUL1 | −0.686 | 0.000 | - |
| THDUL2 | −0.754 | 0.000 | - |
| THDUL3 | −0.803 | 0.000 | - |
Publisher’s Note: MDPI stays neutral with regard to jurisdictional claims in published maps and institutional affiliations. |
© 2022 by the authors. Licensee MDPI, Basel, Switzerland. This article is an open access article distributed under the terms and conditions of the Creative Commons Attribution (CC BY) license (https://creativecommons.org/licenses/by/4.0/).
Share and Cite
Skibko, Z.; Hołdyński, G.; Borusiewicz, A. Impact of Wind Power Plant Operation on Voltage Quality Parameters—Example from Poland. Energies 2022, 15, 5573. https://doi.org/10.3390/en15155573
Skibko Z, Hołdyński G, Borusiewicz A. Impact of Wind Power Plant Operation on Voltage Quality Parameters—Example from Poland. Energies. 2022; 15(15):5573. https://doi.org/10.3390/en15155573
Chicago/Turabian StyleSkibko, Zbigniew, Grzegorz Hołdyński, and Andrzej Borusiewicz. 2022. "Impact of Wind Power Plant Operation on Voltage Quality Parameters—Example from Poland" Energies 15, no. 15: 5573. https://doi.org/10.3390/en15155573
APA StyleSkibko, Z., Hołdyński, G., & Borusiewicz, A. (2022). Impact of Wind Power Plant Operation on Voltage Quality Parameters—Example from Poland. Energies, 15(15), 5573. https://doi.org/10.3390/en15155573