
Identification of Breakpoints in Carbon Market Based on Probability Density Recurrence Network


 , and
, and 
Abstract
:1. Introduction
2. Preliminaries and Proposed Method
2.1. Preliminaries
2.1.1. Bai–Perron Test
2.1.2. Recurrence Network
2.2. The Proposed Method
2.2.1. Probability Density Recurrence Network
2.2.2. Definition of Break Index and Statistical Test Based on Community Structure
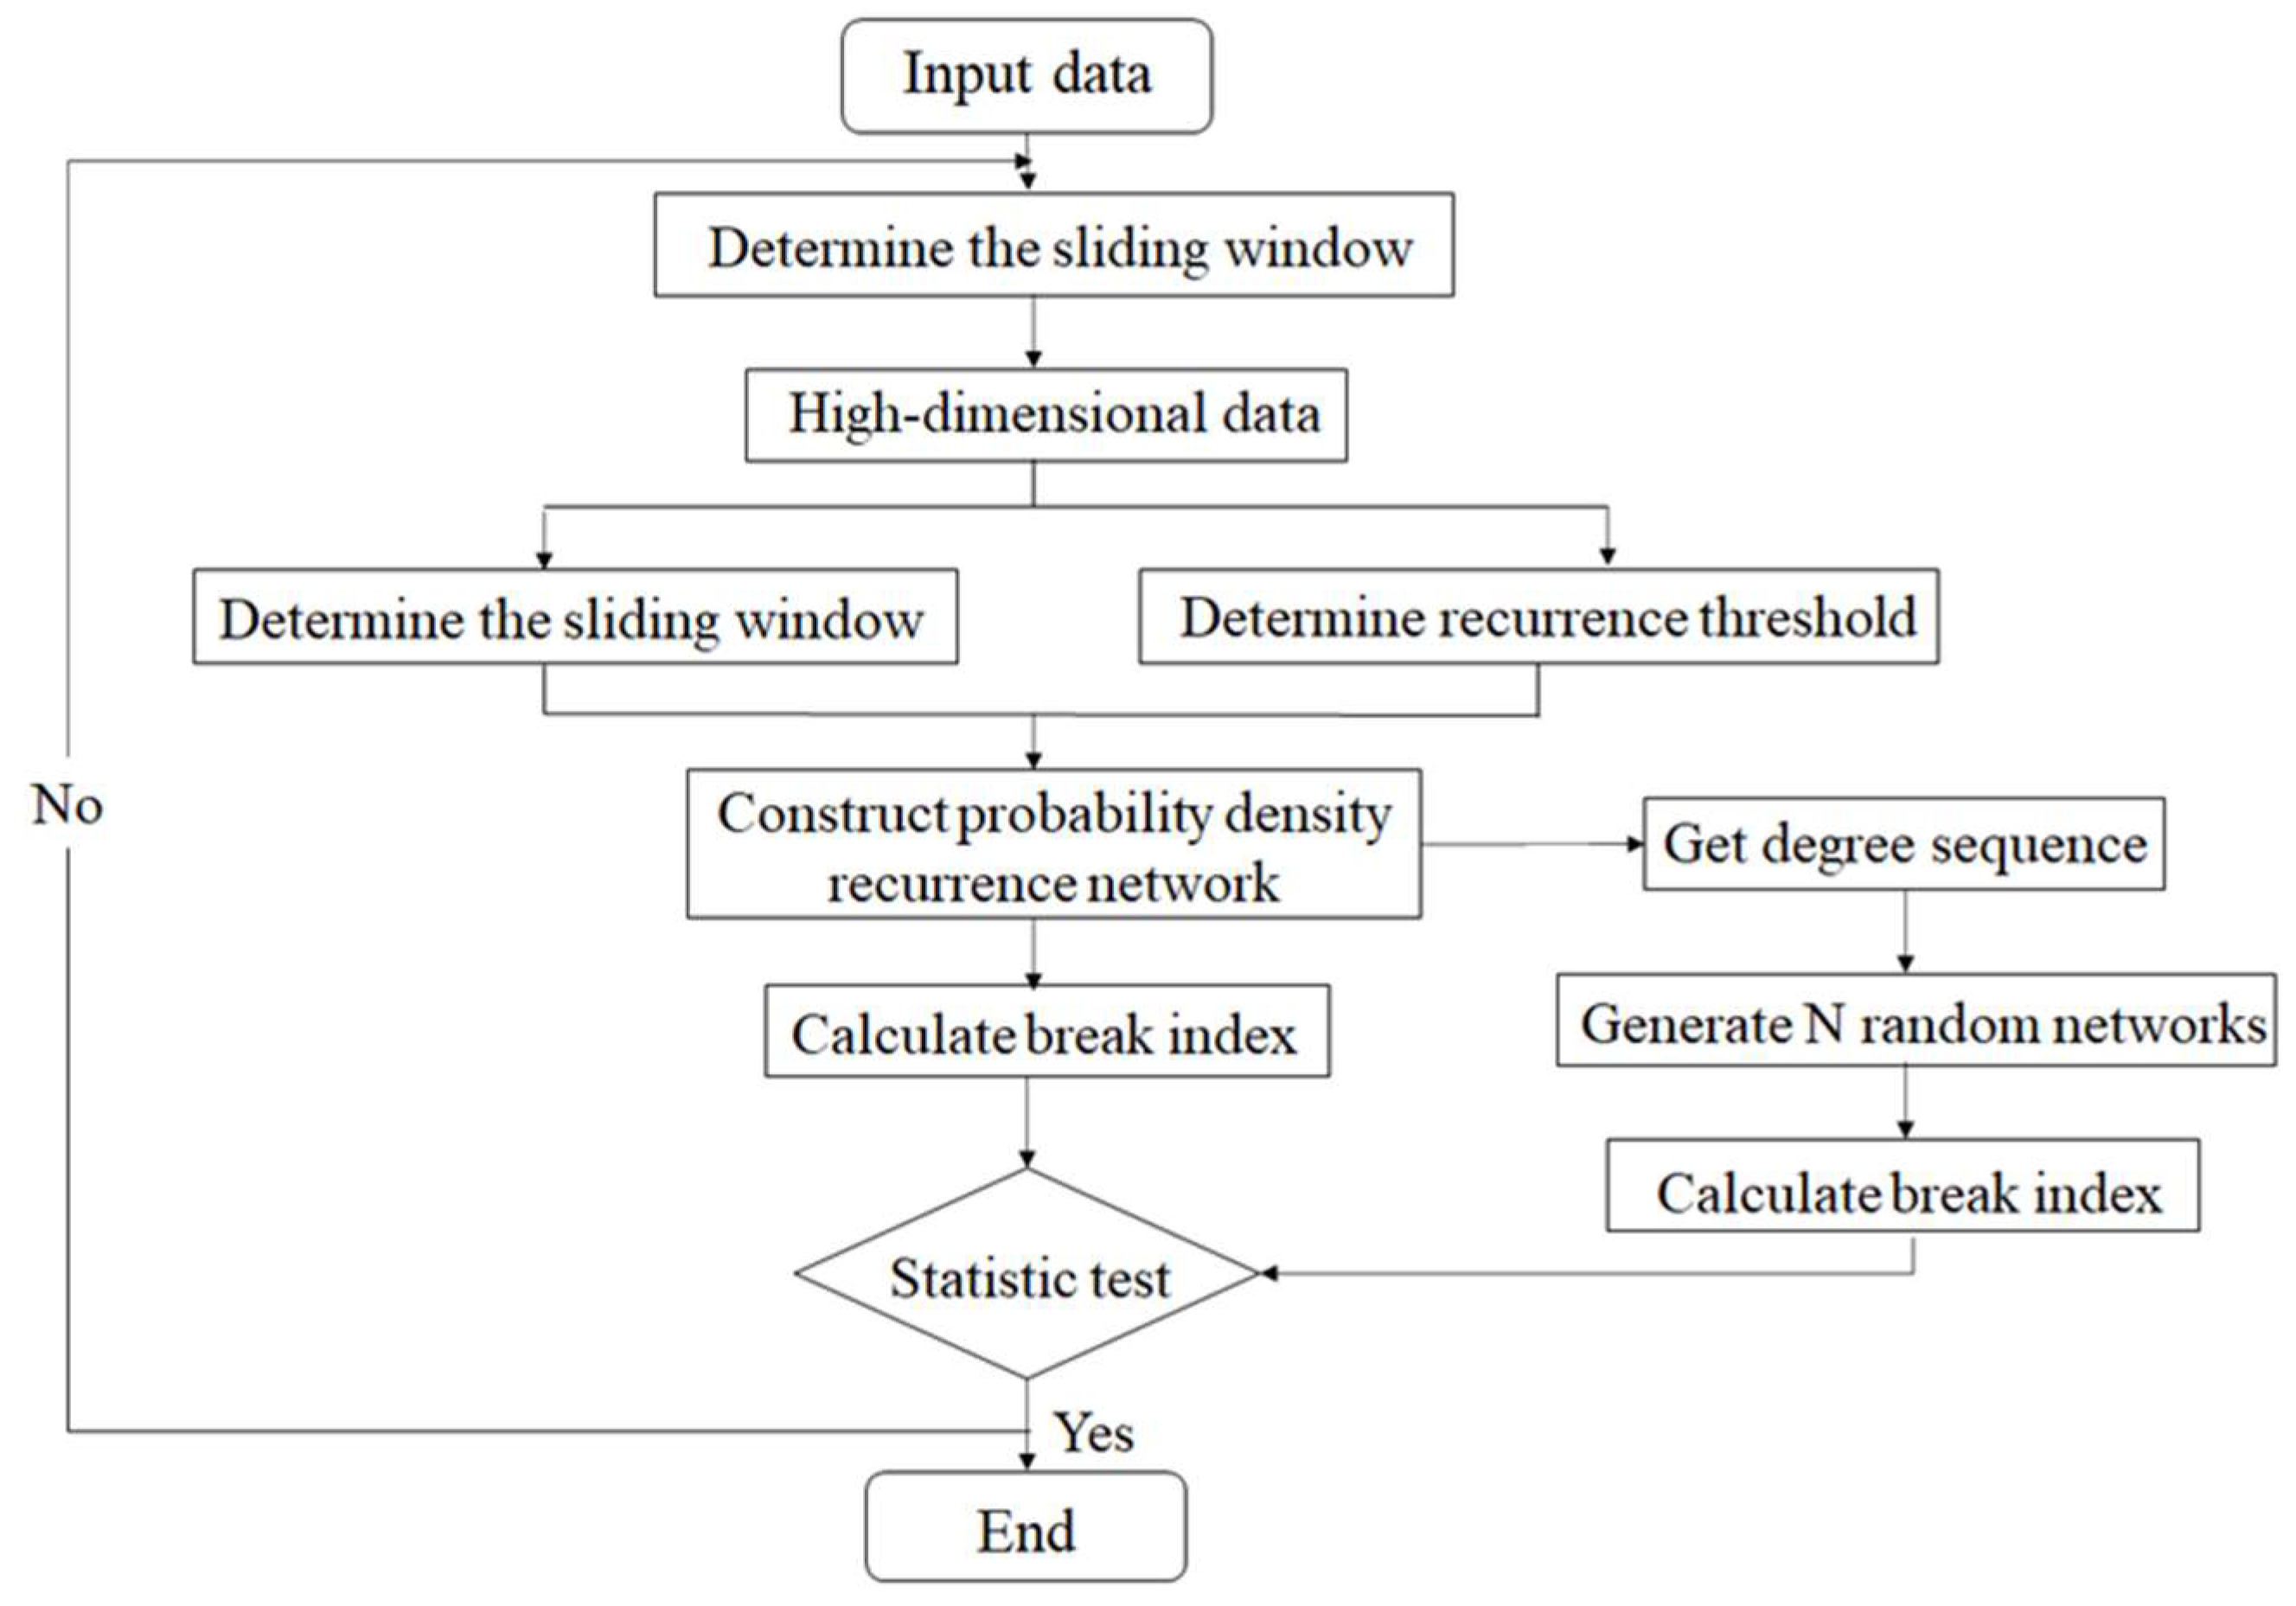
2.2.3. Method to Identify Breakpoints in Carbon Market Based on PDRN
Method to Identify Breakpoints of One-Dimensional Carbon Price Data
Method to Identify Breakpoints of High-Dimensional Carbon Price Data
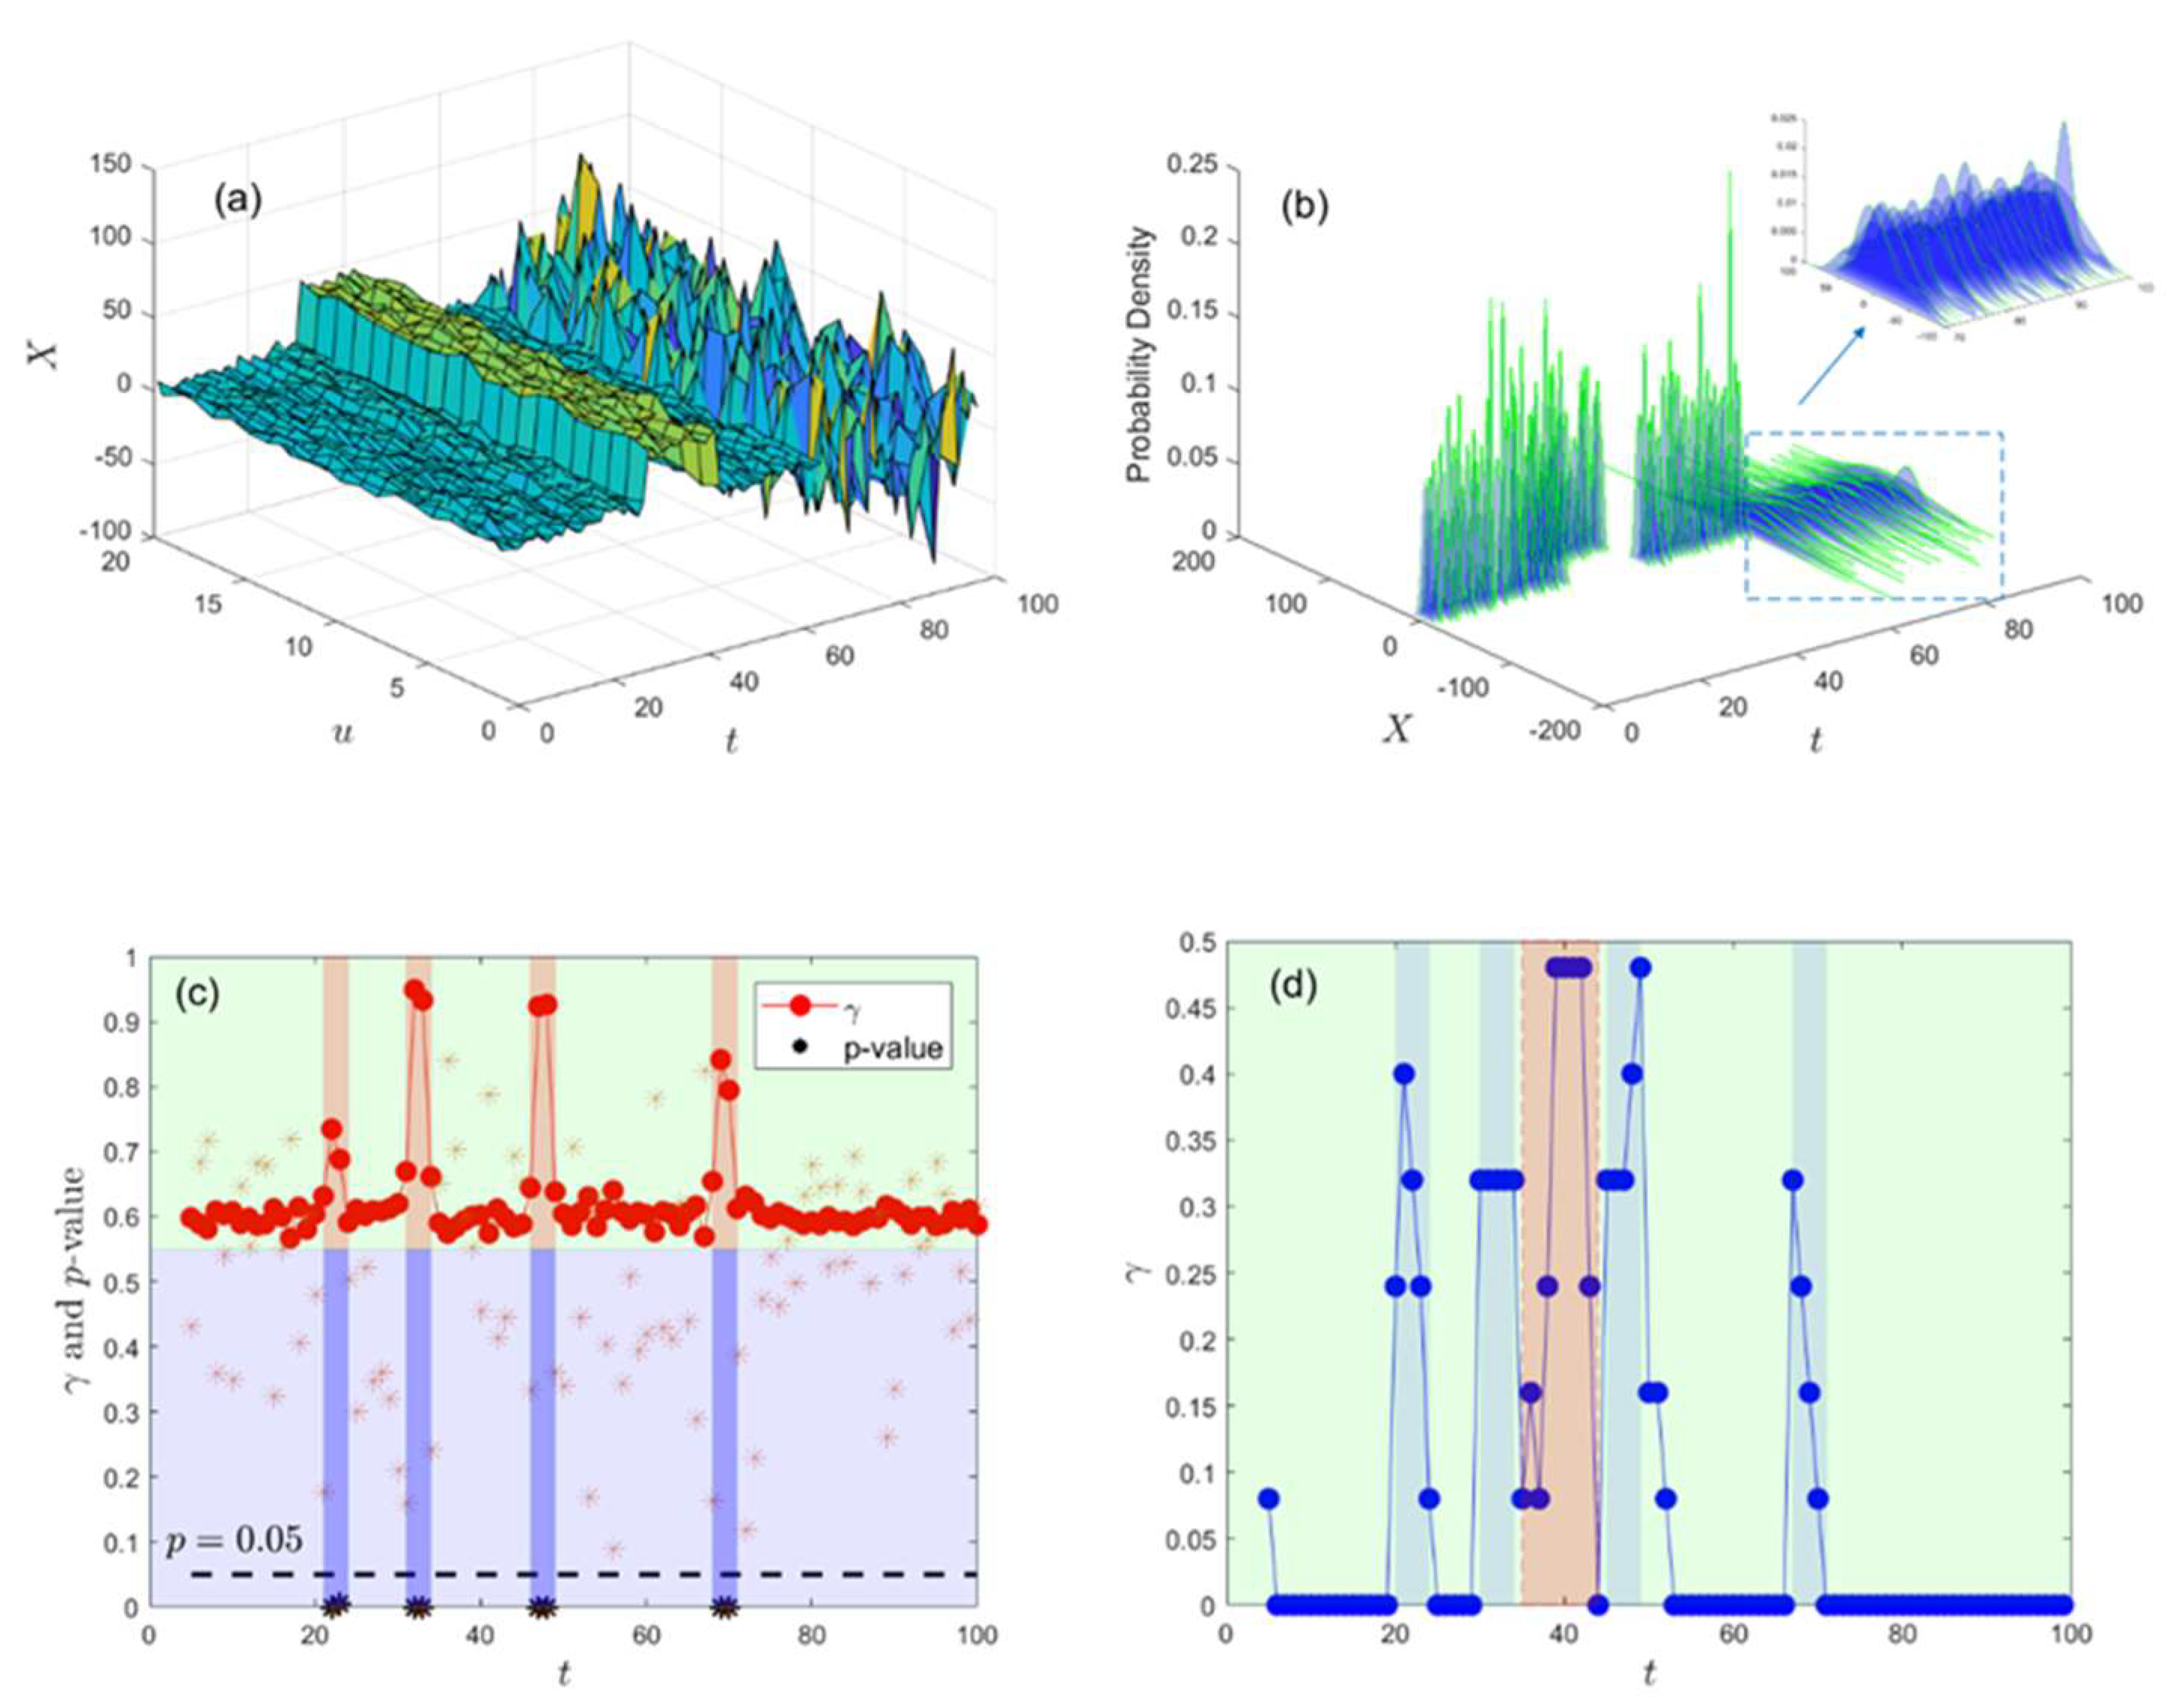
3. Numerical Simulation
4. Empirical Analysis of Breakpoints Identification in EU ETS
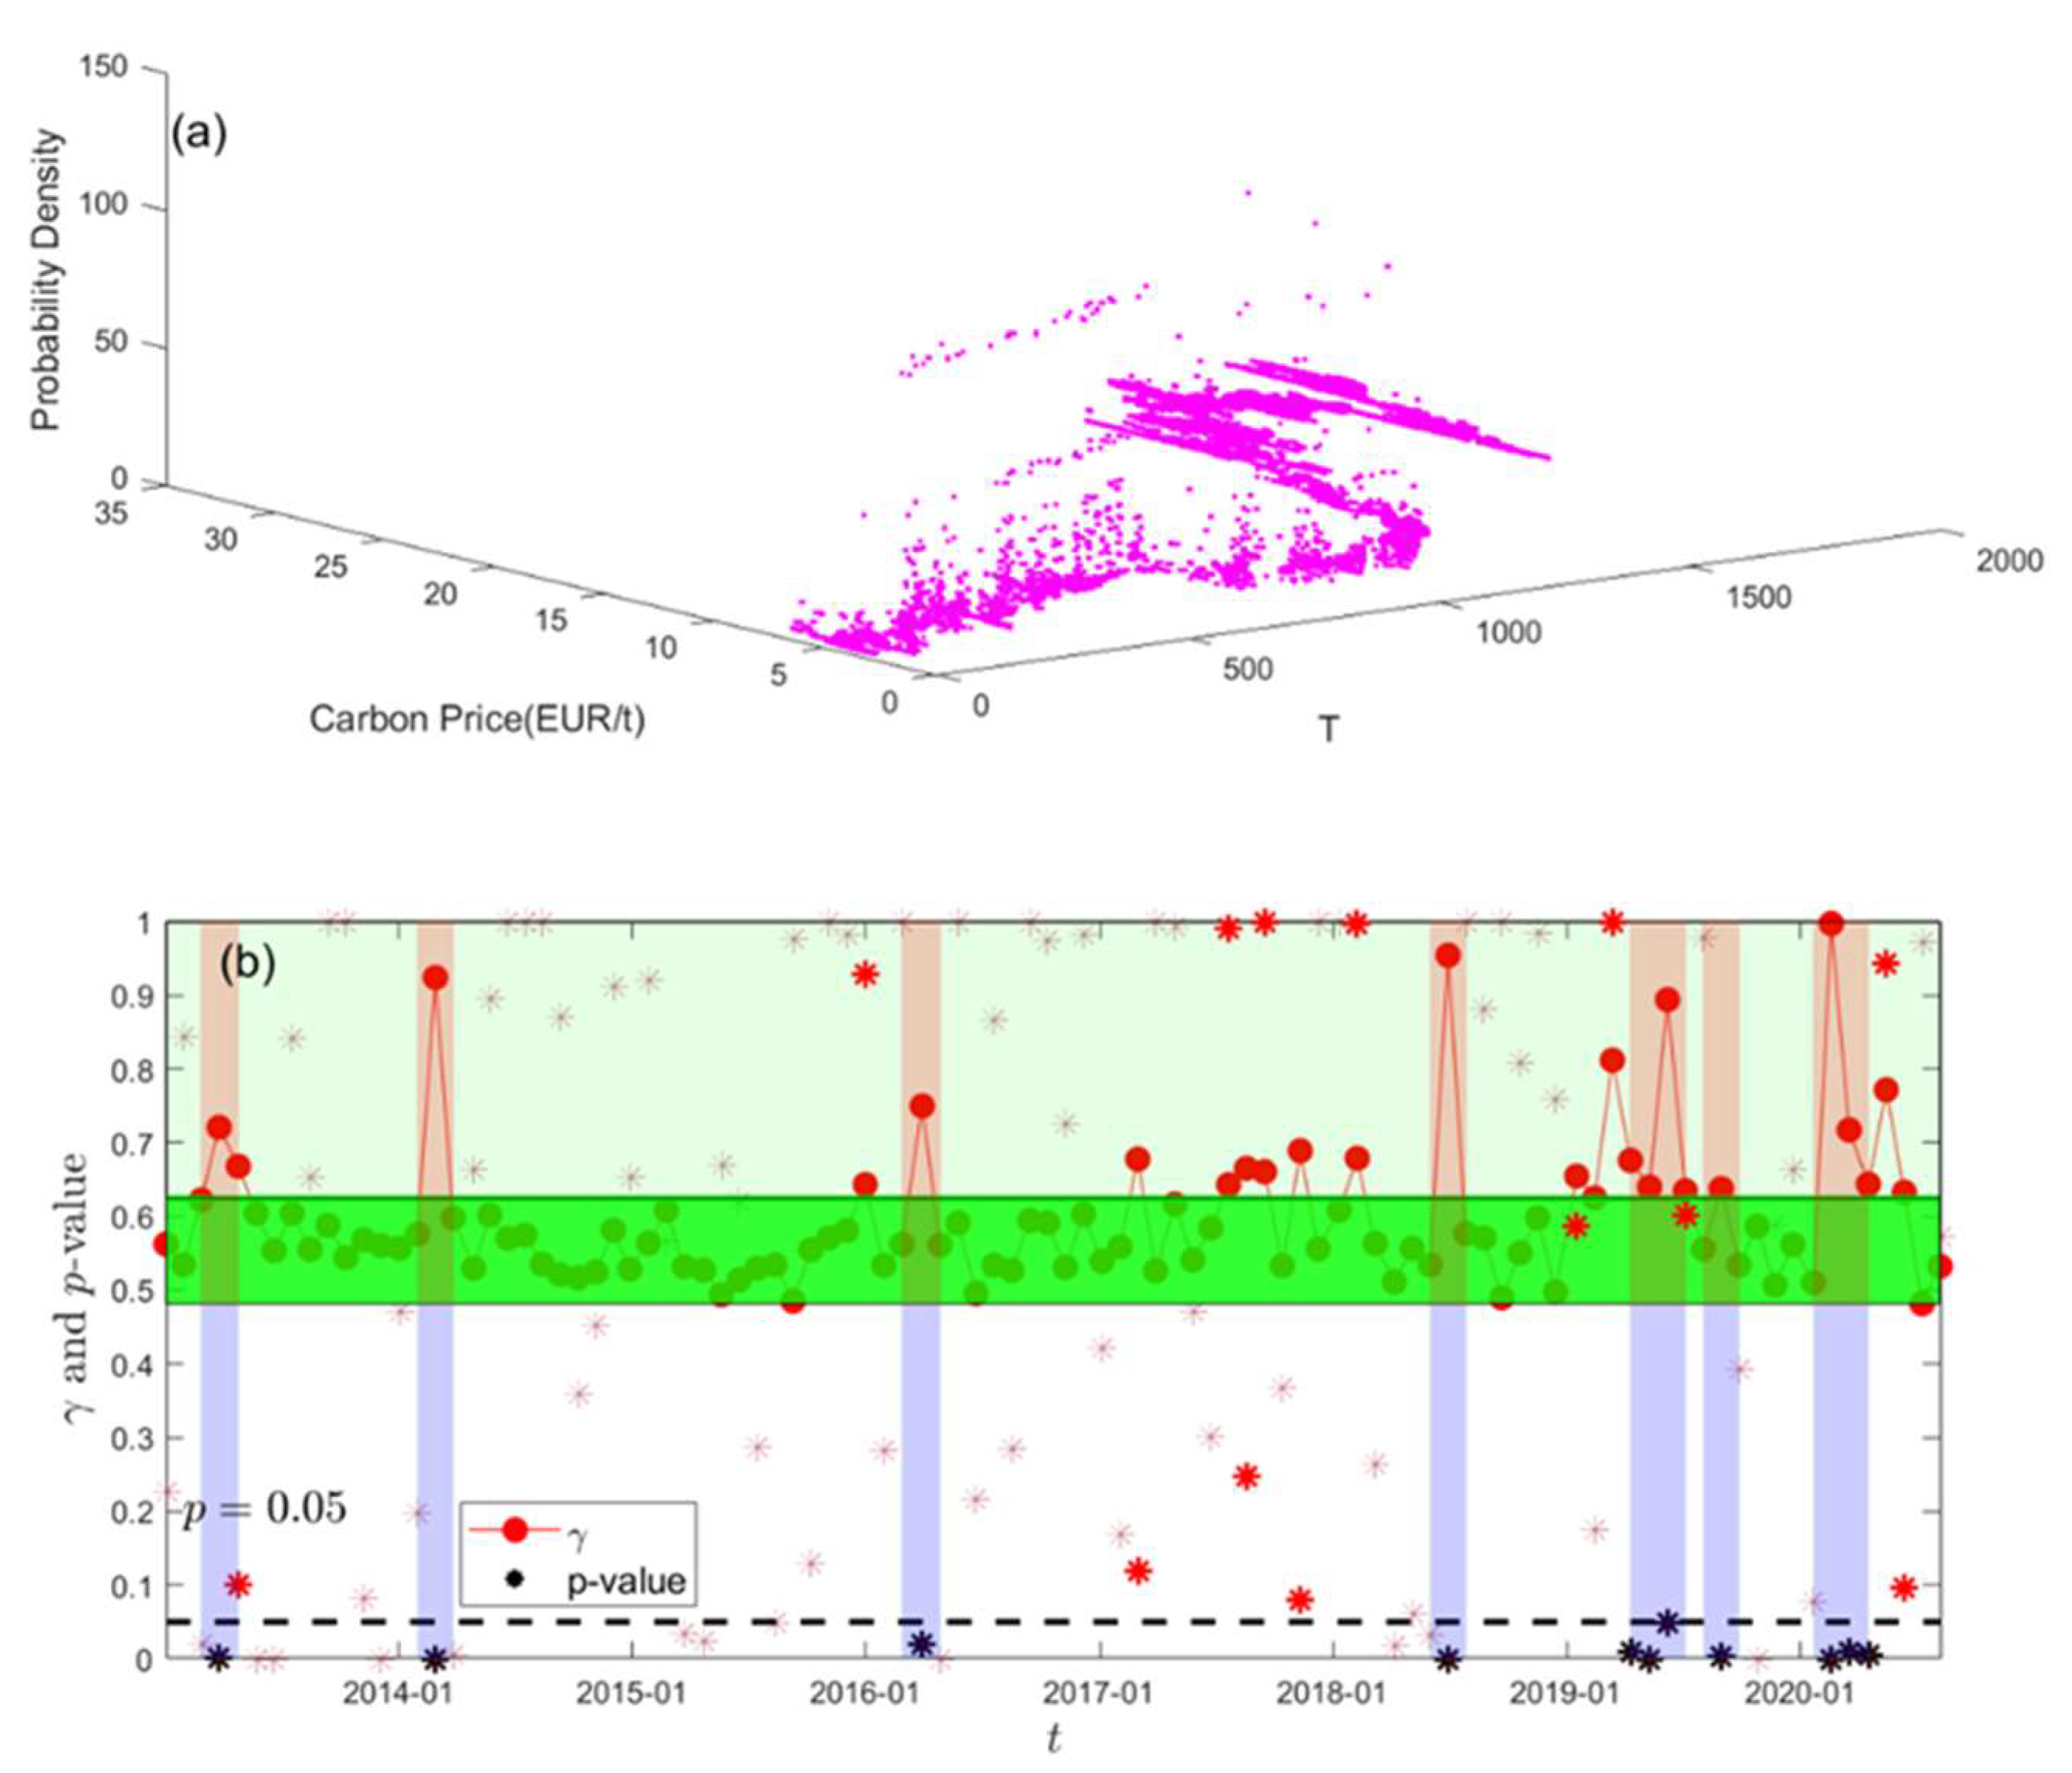
4.1. Identification of Breakpoints of Carbon Price in the EU ETS Based on Daily Highest–Lowest Prices
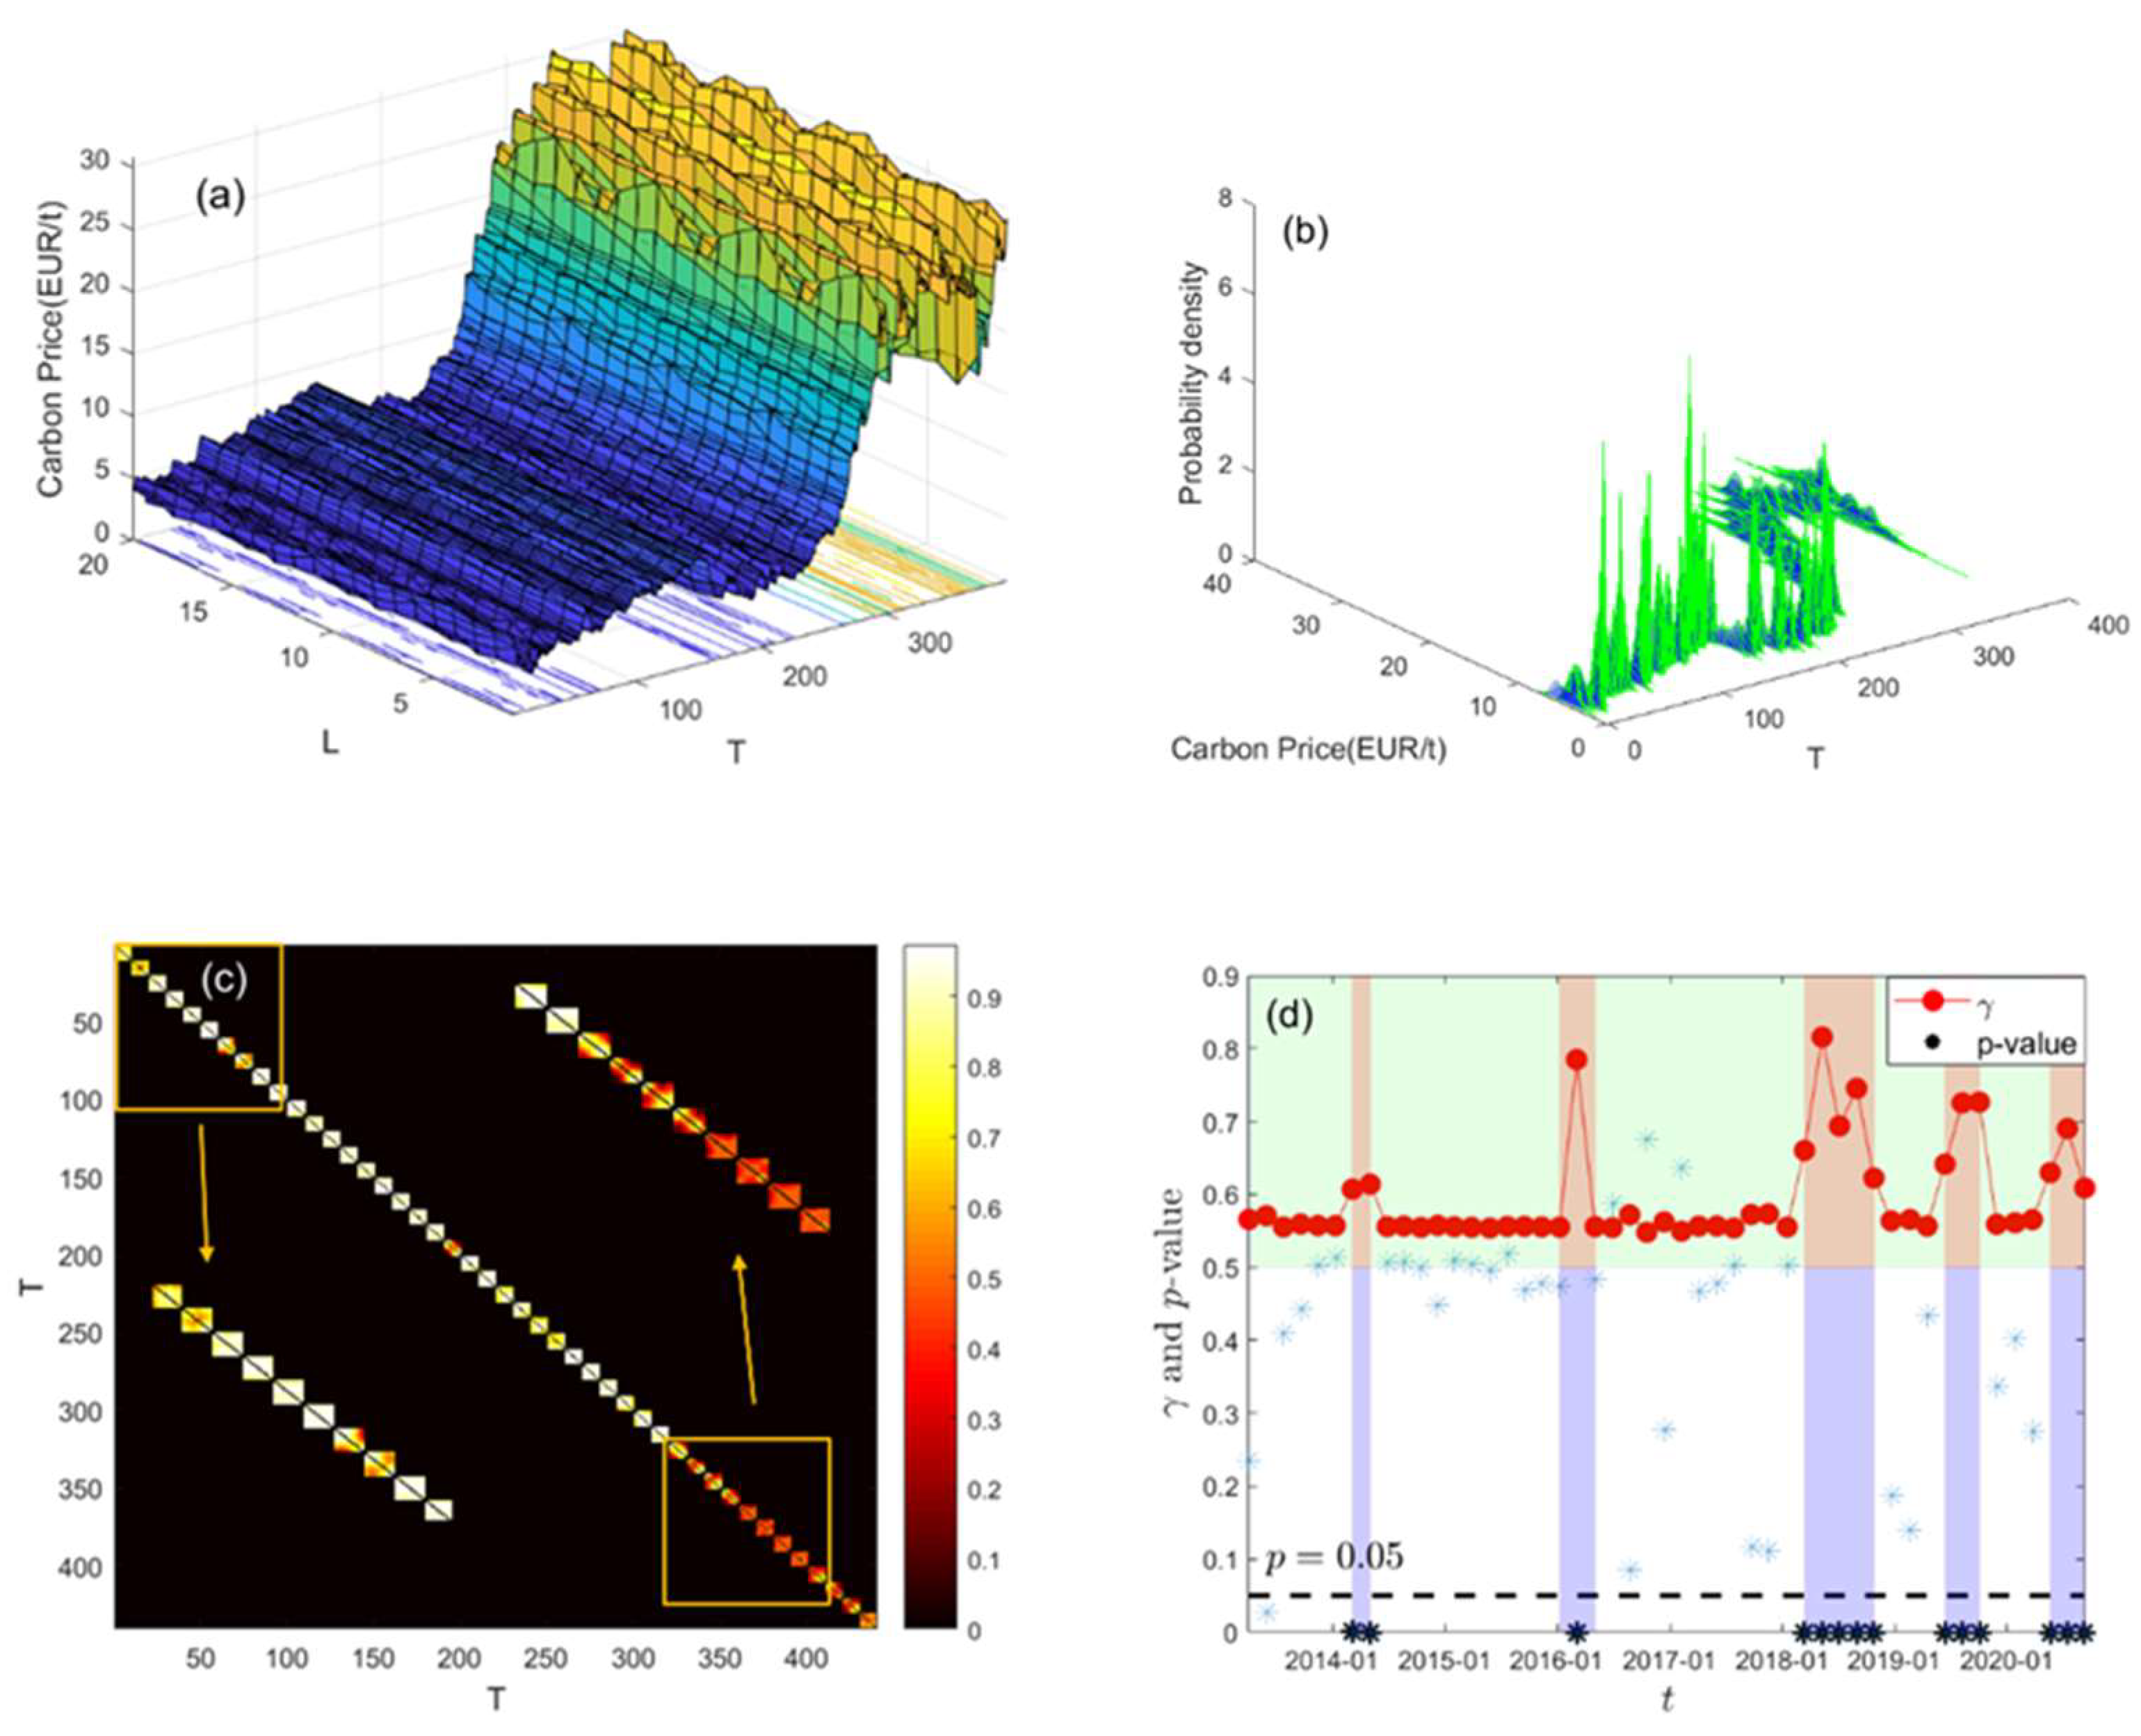
4.2. Identification of Breakpoints of Carbon Price in the EU ETS Based on Daily Closing Price
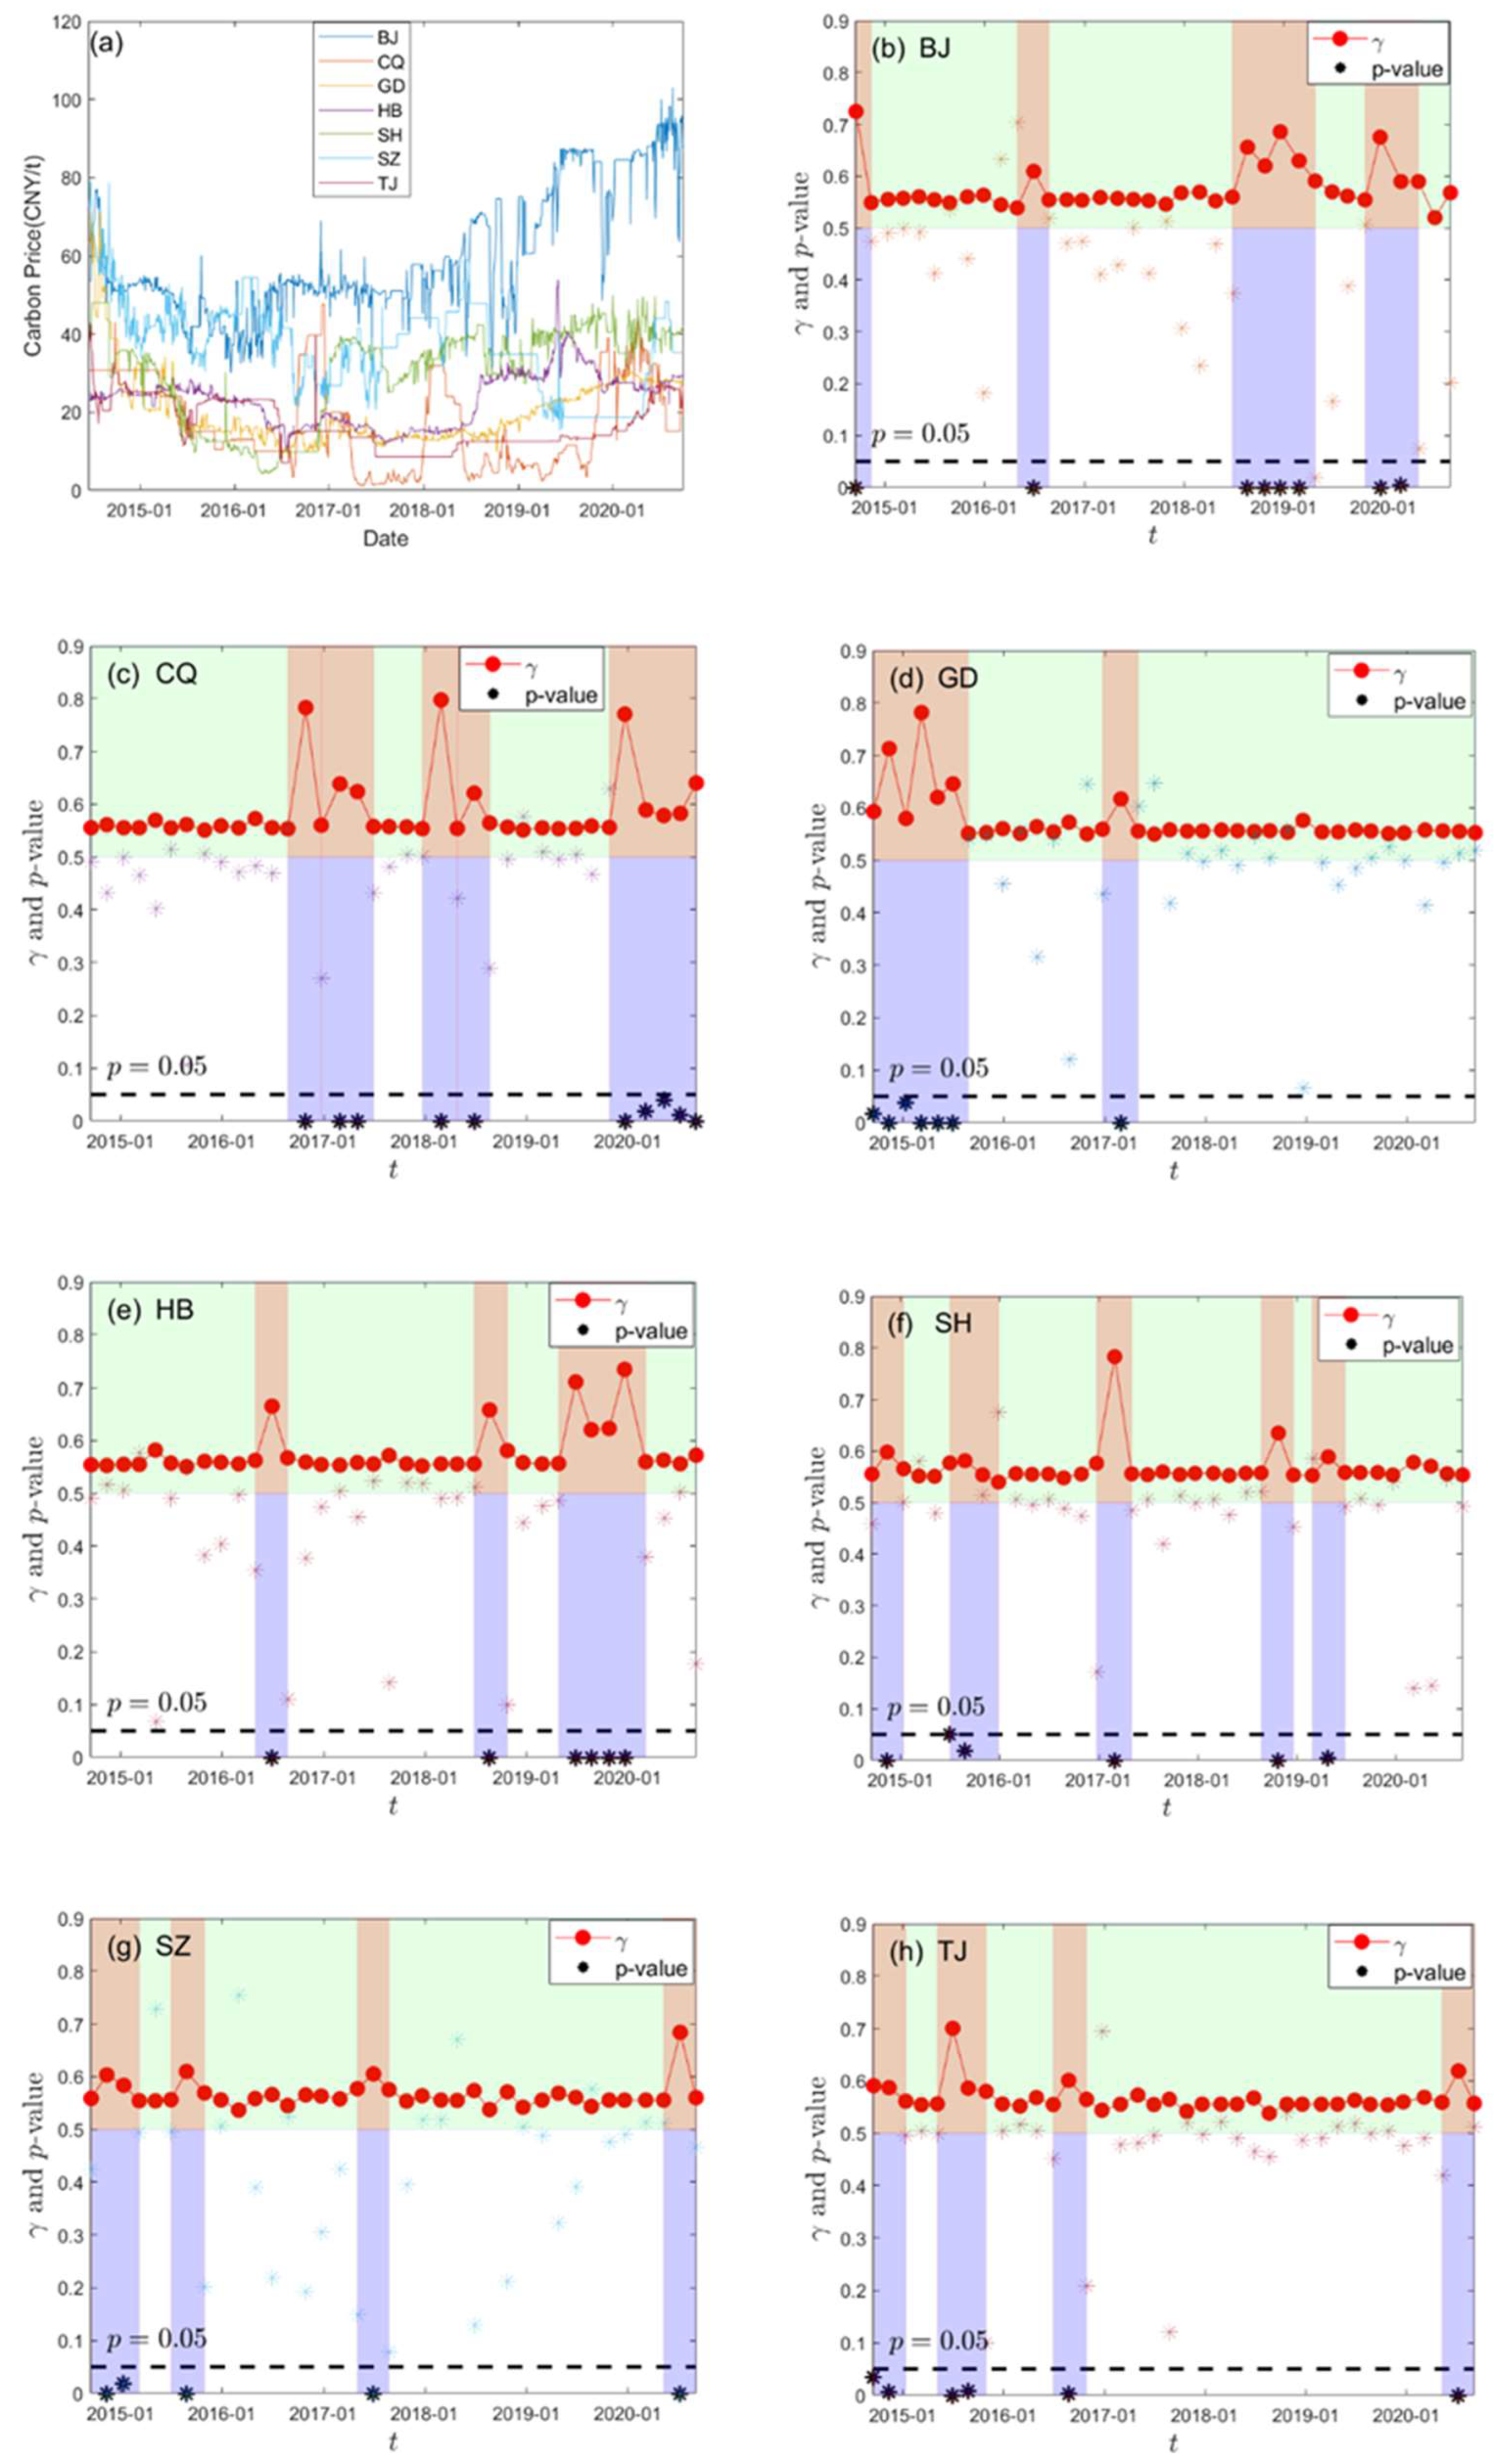
5. Empirical Analysis of Identification of Carbon Price Breakpoint in China’s Carbon Market
6. Conclusions
Author Contributions
Funding
Institutional Review Board Statement
Informed Consent Statement
Data Availability Statement
Conflicts of Interest
Appendix A


References
- Ai, M.; Wang, H.; Wen, W.; Pan, X. Analysis on the Influencing Factors of European Union Carbon Future Prices. J. Environ. Econ. 2018, 3, 19–31. [Google Scholar] [CrossRef]
- Li, Y.; Zheng, P.J. On Returns Volatility Characteristics of China’s Carbon Emissions Permits Trading Market. Sci. Technol. Manag. Land Resour. 2020, 37, 74–81. [Google Scholar]
- Hintermann, B. Allowance price drivers in the first phase of the EU ETS. J. Environ. Econ. Manag. 2010, 59, 43–56. [Google Scholar] [CrossRef] [Green Version]
- Lutz, B.J.; Pigorsch, U.; Rotfuß, W. Nonlinearity in cap-and-trade systems: The EUA price and its fundamentals. Energy Econ. 2013, 40, 222–232. [Google Scholar] [CrossRef] [Green Version]
- Perron, P. The Great Crash, the Oil Price Shock, and the Unit Root Hypothesis. Econometrica 1989, 57, 1361–1401. [Google Scholar] [CrossRef]
- Zivot, E. Further Evidence on the Great Crash, the Oil-Price Shock, and the Unit-Root Hypothesis. J. Bus. Econ. Stat. 1992, 10, 3. [Google Scholar]
- Lumsdaine, R.L.; Papell, D.H. Multiple Trend Breaks and the Unit-Root Hypothesis. Rev. Econ. Stat. 1997, 79, 212–218. [Google Scholar] [CrossRef]
- Lee, J.; Strazicich, M.C. Minimum LM Unit Root Test with One Structural Break. Econ. Bull. 2013, 33, 2483–2492. [Google Scholar]
- Bai, J.; Perron, P. Computation and analysis of multiple structural change models. J. Appl. Econom. 2003, 18, 1–22. [Google Scholar] [CrossRef] [Green Version]
- Lin, Y.N.; Lin, A.Y. Pricing the cost of carbon dioxide emission allowance futures. Rev. Futures Mark. 2007, 16, 1–16. [Google Scholar]
- Alberola, E.; Chevallier, J.; Chèze, B. Price drivers and structural breaks in European carbon prices 2005–2007. Energy Policy 2008, 36, 787–797. [Google Scholar] [CrossRef]
- Benz, E.; Trück, S. Modeling the price dynamics of CO2 emission allowances. Energy Econ. 2009, 31, 4–15. [Google Scholar] [CrossRef]
- Daskalakis, G.; Psychoyios, D.; Markellos, R.N. Modeling CO2 emission allowance prices and derivatives: Evidence from the European trading scheme. J. Bank. Financ. 2009, 33, 1230–1241. [Google Scholar] [CrossRef]
- Chevallier, J. Detecting instability in the volatility of carbon prices. Energy Econ. 2011, 33, 99–110. [Google Scholar] [CrossRef] [Green Version]
- Andrews, D.W.K. Tests for Parameter Instability and Structural Change with Unknown Change Point. Econometrica 1993, 61, 821–856. [Google Scholar] [CrossRef] [Green Version]
- Andrews, D.W.K.; Ploberger, W. Optimal Tests when a Nuisance Parameter is Present Only Under the Alternative. Econometrica 1994, 62, 1383–1414. [Google Scholar] [CrossRef]
- Ploberger, W.; Krämer, W. The Cusum Test with Ols Residuals. Econometrica 1992, 60, 271–285. [Google Scholar] [CrossRef]
- Chu, C.-S.J.; Stinchcombe, M.; White, H. Monitoring Structural Change. Econometrica 1996, 64, 1045–1065. [Google Scholar] [CrossRef] [Green Version]
- Leisch, F.; Hornik, K.; Kuan, C.M. Monitoring Structural Changes with the Generalized Fluctuation Test. Econom. Theory 2000, 16, 835–854. [Google Scholar] [CrossRef] [Green Version]
- Conrad, C.; Rittler, D.; Rotfuß, W. Modeling and explaining the dynamics of European Union Allowance prices at high-frequency. Energy Econ. 2012, 34, 316–326. [Google Scholar] [CrossRef] [Green Version]
- Wu, Z.X.; Wan, F.L.; Wang, S.P.; Hu, A.M. Test of Structural Breaks on EU ETS Carbon Price Fluctuations. J. Appl. Stat. Manag. 2015, 34, 9. [Google Scholar]
- Zhu, B.; Chevallier, J.; Ma, S.; Wei, Y. Examining the structural changes of European carbon futures price 2005–2012. Appl. Econ. Lett. 2015, 22, 335–342. [Google Scholar] [CrossRef]
- Junjun, J.; Wu, H.; Zhu, X.; Li, J.; Fan, Y. Price Break Points and Impact Process Evaluation in the EU ETS. Emerg. Mark. Financ. Trade 2019, 56, 1691–1714. [Google Scholar]
- Yang, M.; Zhu, S.Z.; Li, W.W. Study on the Effectiveness of the European Union and China Carbon Market based on Structural Breakpoints. J. Ind. Technol. Econ. 2020, 39, 92–99. [Google Scholar]
- Li, F.F.; Qian, W.D.; Xu, Z.S. Analysis on the Influencing Factors and Structural Break-points of Carbon Price in Seven Pilot Provinces and Cities. J. Xichang Coll. Nat. Sci. Ed. 2020, 34, 27–32. [Google Scholar] [CrossRef]
- Dong, F.; Gao, Y.; Li, Y.; Zhu, J.; Hu, M.; Zhang, X. Exploring volatility of carbon price in European Union due to COVID-19 pandemic. Environ. Sci. Pollut. Res. 2021, 29, 8269–8280. [Google Scholar] [CrossRef]
- Nguyen, V.C.; Vu, D.B.; Nguyen, T.H.Y.; Pham, C.D.; Huynh, T.N. Economic growth, financial development, transportation capacity, and environmental degradation: Empirical evidence from Vietnam. J. Asian Financ. Econ. Bus. 2021, 8, 93–104. [Google Scholar]
- Zheng, Y.; Yin, H.; Zhou, M.; Liu, W.; Wen, F. Impacts of oil shocks on the EU carbon emissions allowances under different market conditions. Energy Econ. 2021, 104, 105683. [Google Scholar] [CrossRef]
- Zahoor, Z.; Khan, I.; Hou, F. Clean energy investment and financial development as determinants of environment and sustainable economic growth: Evidence from China. Environ. Sci. Pollut. Res. 2021, 29, 16006–16016. [Google Scholar] [CrossRef]
- Yang, P.; Hou, X. Research on Dynamic Characteristics of Stock Market Based on Big Data Analysis. Discret. Dyn. Nat. Soc. 2022, 2022, 8758976. [Google Scholar] [CrossRef]
- Duan, K.; Ren, X.; Shi, Y.; Mishra, T.; Yan, C. The marginal impacts of energy prices on carbon price variations: Evidence from a quantile-on-quantile approach. Energy Econ. 2021, 95, 105131. [Google Scholar] [CrossRef]
- Edenhofer, O.; Kosch, M.; Pahle, M.; Zachmann, G. A whole-economy carbon price for Europe and how to get there. Eur. Energy Clim. J. 2021, 10, 49–61. [Google Scholar] [CrossRef]
- Goswami, B.; Boers, N.; Rheinwalt, A.; Marwan, N.; Heitzig, J.; Breitenbach, S.F.; Kurths, J. Abrupt transitions in time series with uncertainties. Nat. Commun. 2018, 9, 48. [Google Scholar] [CrossRef] [PubMed]
- Marwan, N.; Carmenromano, M.; Thiel, M.; Kurths, J. Recurrence plots for the analysis of complex systems. Phys. Rep. 2007, 438, 237–329. [Google Scholar] [CrossRef]
- Wang, M.; Hua, C.; Zhu, M.; Xie, S.; Xu, H.; Vilela, A.L.; Tian, L. Interrelation measurement based on the multi-layer limited penetrable horizontal visibility graph. Chaos Solitons Fractals 2022, 162, 112422. [Google Scholar] [CrossRef]
- Wang, M.; Zhu, M.; Tian, L. A novel framework for carbon price forecasting with uncertainties. Energy Econ. 2022, 112, 106162. [Google Scholar] [CrossRef]
- Parab, N.; Reddy, Y.V. The dynamics of macroeconomic variables in Indian stock market: A Bai–Perron approach. Macroecon. Financ. Emerg. Mark. Econ. 2020, 13, 89–113. [Google Scholar] [CrossRef]
- Williamson, R.C.; Downs, T. Probabilistic arithmetic. I. Numerical methods for calculating convolutions and dependency bounds. Int. J. Approx. Reason. 1990, 4, 89–158. [Google Scholar] [CrossRef] [Green Version]
- Rapp, P.E.; Darmon, D.M.; Cellucci, C.J. Hierarchical Transition Chronometries in the Human Central Nervous System. IEICE Proceeding Ser. 2014, 2, 286–289. [Google Scholar] [CrossRef]


| Index | Closing Price | Highest Price | Lowest Price |
|---|---|---|---|
| Mean | 11.63625 | 11.73901 | 11.44756 |
| Max | 30.77000 | 30.1000 | 30.24000 |
| Min | 2.700000 | 2.900000 | 2.490000 |
| Std | 8.438122 | 8.532572 | 8.295047 |
| Skewness | 0.895698 | 0.910802 | 0.904718 |
| Kurtosis | 2.110458 | 2.140502 | 2.133726 |
| JB test | 333.3657 *** | 338.0814 *** | 335.3738 *** |
| ADF test | −1.792782 (−3.433422) | −1.830002 (−3.433424) | −1.836951 (−3.433424) |
| Pilot Area | Break Time | Break Index γ | p-Values |
|---|---|---|---|
| Shanghai | 12 November 2014 | 0.5981 | 0.0040 |
| 1 July 2015 | 0.5772 | 0.0490 | |
| 26 August 2015 | 0.5814 | 0.0180 | |
| 28 February 2017 | 0.7834 | 0.0000 | |
| 24 October 2018 | 0.6351 | 0.0000 | |
| 26 April 2019 | 0.5889 | 0.0040 | |
| Shenzhen | 12 November 2014 | 0.6033 | 0.0000 |
| 12 January 2015 | 0.5836 | 0.0160 | |
| 26 August 2015 | 0.6098 | 0.0000 | |
| 29 June 2017 | 0.6052 | 0.0000 | |
| 7 July 2020 | 0.6838 | 0.0000 | |
| Tianjin | 17 September 2014 | 0.5907 | 0.0300 |
| 12 November 2014 | 0.5870 | 0.0080 | |
| 1 July 2015 | 0.7004 | 0.0000 | |
| 26 August 2015 | 0.5860 | 0.0060 | |
| 24 August 2016 | 0.6009 | 0.0010 | |
| 7 July 2020 | 0.6190 | 0.0000 |
Publisher’s Note: MDPI stays neutral with regard to jurisdictional claims in published maps and institutional affiliations. |
© 2022 by the authors. Licensee MDPI, Basel, Switzerland. This article is an open access article distributed under the terms and conditions of the Creative Commons Attribution (CC BY) license (https://creativecommons.org/licenses/by/4.0/).
Share and Cite
Zhu, M.; Xu, H.; Gao, X.; Wang, M.; Vilela, A.L.M.; Tian, L. Identification of Breakpoints in Carbon Market Based on Probability Density Recurrence Network. Energies 2022, 15, 5540. https://doi.org/10.3390/en15155540
Zhu M, Xu H, Gao X, Wang M, Vilela ALM, Tian L. Identification of Breakpoints in Carbon Market Based on Probability Density Recurrence Network. Energies. 2022; 15(15):5540. https://doi.org/10.3390/en15155540
Chicago/Turabian StyleZhu, Mengrui, Hua Xu, Xingyu Gao, Minggang Wang, André L. M. Vilela, and Lixin Tian. 2022. "Identification of Breakpoints in Carbon Market Based on Probability Density Recurrence Network" Energies 15, no. 15: 5540. https://doi.org/10.3390/en15155540
APA StyleZhu, M., Xu, H., Gao, X., Wang, M., Vilela, A. L. M., & Tian, L. (2022). Identification of Breakpoints in Carbon Market Based on Probability Density Recurrence Network. Energies, 15(15), 5540. https://doi.org/10.3390/en15155540