Review

Machine Learning Methods for Automated Fault Detection and Diagnostics in Building Systems—A Review

1
Department of Mechanical Engineering, Energy Systems Laboratory, Texas AM University, College Station, TX 78412, USA
2
Department of Architecture, Energy Systems Laboratory, Texas AM University, College Station, TX 78412, USA
*
Author to whom correspondence should be addressed.
Energies 2022, 15(15), 5534; https://doi.org/10.3390/en15155534
Submission received: 6 July 2022 / Revised: 25 July 2022 / Accepted: 26 July 2022 / Published: 30 July 2022

Abstract

:
Energy consumption in buildings is a significant cost to the building’s operation. As faults are introduced to the system, building energy consumption may increase and may cause a loss in occupant productivity due to poor thermal comfort. Research towards automated fault detection and diagnostics has accelerated in recent history. Rule-based methods have been developed for decades to great success, but recent advances in computing power have opened new doors for more complex processing techniques which could be used for more accurate results. Popular machine learning algorithms may often be applied in both unsupervised and supervised contexts, for both classification and regression outputs. Significant research has been performed in all permutations of these divisions using algorithms such as support vector machines, neural networks, Bayesian networks, and a variety of clustering techniques. An evaluation of the remaining obstacles towards widespread adoption of these algorithms, in both commercial and scientific domains, is made. Resolutions for these obstacles are proposed and discussed.

1. Background: Prior Review Articles

1.1. Building Energy Consumption

The 2018 Global Status Report from the International Energy Agency (IEA) found that building operation accounts for 36% of global energy use [1]. Furthermore, Yang et al. found that heating, ventilation, and air conditioning (HVAC) systems account for 40% of all building energy consumption [2]. This leads to the knowledge that HVAC system consumption accounts for 14% of energy use across the world. Qin et al. found that in Hong Kong, 20.9% of commercial buildings operate continuously with faults, including sensor errors and actuator failures, which degrade their performance [3]. There are many failure points in a building system due to the thousands of sensors, dampers, or other controllable devices in a building. Katipamula et al. found that operational faults in buildings are the cause for 15–30% lost energy in commercial buildings [4].
In modern times, building management systems have been installed in many buildings. These systems provide an interface for continuous measurement and monitoring of the HVAC system components, which creates new possibilities for advanced fault detection and diagnostics.
Building management systems provide information about system components which can be analyzed using software tools. This information includes all sensor measurements in the building, such as actuator positioning or motor control. These measurements can be monitored for stability or anomalies, though interdependencies between components and self-correcting building programming can obscure the fault from detection.
Fault detection in building systems is an important energy conservation measure. HVAC system and lighting faults can increase energy consumption by up to 18% [5] and degrade occupant comfort and productivity when thermal setpoints are not met [6]. A sensor failure can increase energy consumption by misrepresenting the temperature of air through the system, which must be corrected by subsequent components. Failures such as these are represented in the data collected by building systems and may be detected using advanced analytics. Failures may be detected quickly and with limited additional manual analysis by using machine learning algorithms for fault detection and diagnostics in building systems, which reduces the building’s time spent in faulty operation and minimizes wasted energy and occupant productivity.

1.2. History of FDD in Building Systems

Katipamula et al. [4] conducted a review of established methods for fault detection and diagnostics (FDD) in building systems. The authors divide diagnostic methods into three groups: quantitative model based, qualitative model based, and process history based.
As of the time of Katipamula’s publication (2005), the majority of completed research belonged to the qualitative model-based methods, which include the most popular current form of fault detection in industry: the rule-based method. The strengths of these models lie in their simplicity and interpretability. It is easy to explain these rules to engineers of all knowledge levels. Rule-based models also perform strongly in projects with large amounts of data compared to those with less data. Breuker and Braun conducted an experiment on a building with two sets of data: one with six measurements and another with ten measurements. They were able to conclude that performance of a rule-based FDD algorithm increased by a factor of two when doubling the measurements by system sensors and using higher-order models [5].
The first iteration on advanced building analytics came in the form of model-based methods. Gertler et al. define model-based methods as relying on analytical redundancy rather than physical redundancy; the former involves the comparison between sensor values to calculated values from first-principles equations whereas the latter involves sensor values being compared to other sensor values [6]. Bendapudi and Braun developed a chiller model from first-principles equations to be used in FDD calculations [7]. However, these first-principles models are seldom used for FDD because of their required input parameters, which are extensive and may be missing from the building’s measurements. Lebrun and Bourdouxhe conducted a review of dynamic HVAC models, which covered over 500 references for all areas of the building system [8]. Though these models have become more commonplace as computation speeds have improved, there have been comparatively fewer than 25% applied to FDD in commercial buildings [9,10,11,12,13,14,15].
Rule-based systems are based on a series of if-then statements to produce rules that govern fault detection. These rules can be as simple as a single threshold limit or more complicated to include several statements chained together using and/or operators. PECI and Battelle conducted a review of commonly applied rules to validate their usefulness in real scenarios [16]. Engineers have also applied rules derived from first-principles equations [17,18]. House et al. developed a ruleset named “Air-Handling Unit Performance Assessment Rules” (APAR) aimed to detect faults in air handling units. The ruleset includes 28 rules to represent faults in common operation states in the air handling unit and possible causes for violations of these rules. The rules cover faults impacting occupant comfort, indoor air quality, energy, and equipment life. The authors note some drawbacks when using rule-based systems, namely that the concept of fault severity is missing when using singular rules; the output of a rule evaluation is binary and offers limited measures of how far the rule was violated. Fault severity metrics may be introduced by defining multiple rules, with a cost of added complexity to the model.
Zhao et al. also conducted a review of recent innovations in the use of artificial intelligence and machine learning methods for Automated Fault Detection and Diagnostics (AFDD) tasks [19]. Their research divides artificial intelligence (AI) methods into two broad categories: knowledge-driven and data-driven methods. They determined that while there has been increased interest in all artificial intelligence algorithms over the past two decades, a large percentage of these projects have focused on data-driven methods. The authors found that of the articles reviewed, 79% were based on data-driven methods and 21% were based on knowledge-driven methods.
Chen et al. conducted a review of AFDD methods and found that of the major HVAC system categories (building, variable refrigerant flow, heat pump, air handling unit (AHU), variable air volume (VAV) terminal, chiller, and sensor), 33% of reviewed research covered AHUs and 25% covered chillers [20]. Their references include knowledge and data-driven methods and provide a comprehensive picture of research in the field. Their survey is divided into three major sections: knowledge-driven, data-driven, and hybrid approaches. Similar to Katipamula and Zhao, the authors found that knowledge-driven AI approaches, still represent less than 25% of published research. Over 75% of AFDD research completed is in data-driven approaches.
The historical references above provide a summary of how FDD in building systems has evolved. This review paper discusses key historical developments and expands into Machine Learning (ML) technology research-related developments in the AFDD. It also includes current published applications of ML.
This review has been divided into the major parts shown in Figure 1, all of which are classified as data-driven methods by Katipamula and other reviews mentioned previously [4]. Within the focus of data-driven methods, there has been significant focus on supervised and unsupervised learning methods as well as accompanying methods such as Principal Components Analysis (PCA), which is often used as a preprocessing step before the former two methods [20]. Historically, less complex methods such as clustering, rule-based methods have been used [4]. Neural networks and Support Vector Machines (SVMs) have seen an exponential increase in attention in recent years as computer processing power has grown. With higher power, computers are able to optimize complicated networks in a fraction of the time and produce more accurate results.

2. Modern Machine Learning for Fault Detection in Building Systems

Computation power has increased dramatically in recent years along with substantial increases in data collection, creating new possibilities for fault detection methods using machine learning. Zhao et al. conducted a review in 2019 of the trends in industry using artificial intelligence methods for FDD [19]. The paper divided the methods into two broad categories: data-driven methods and knowledge-driven methods. Subcategories of machine learning algorithms which further divide these broad categories include supervised learning and unsupervised learning.
Common faults in building systems have been found to be [21]:
  • Actuator malfunction
  • Sensor faults
  • Blocked ducts
  • Filtration issues
  • Fluctuation of pressure setpoints
  • Motor failure
  • Fan malfunction
  • Coil fouling
Supervised learning methods utilize the input features of a dataset and the known output classes to train a model. These methods require more processed data than other types of algorithms, since the input datasets require additional information to represent their output classes. These output classes may be provided from the sensors in the building, or they may be assigned manually.
Unsupervised learning problems differ from supervised learning in that the training datasets contain only input values and lack output values. The unsupervised algorithm determines a probable output based on a set of inputs measured from the system. An unsupervised learning problem is often solved using clustering, where a dataset becomes grouped into several clusters forming density clouds. The supervised learning counterpart to this problem is classification, where a dataset is classified based on the known characteristics of the classified input data. Each of these are basic examples of algorithms used for supervised and unsupervised learning; many other algorithms exist to solve each problem.
Tidriri et al. considered a hybrid approach that combines data-driven and model-driven methods [22]. The authors found that performance of data-driven methods is highly dependent on the training data, while performance of model-driven methods is highly dependent on the mathematical model used in the analysis. The authors propose that a hybrid approach using data-driven methods for fault detection and model-driven methods for fault diagnostics could prove more successful than using data- or model-driven methods would individually. The authors also found that many researchers face problems bridging the two methods without an established framework, which makes the combination difficult to implement. While these are several examples of hybrid model applications [23,24,25,26], research in this area is just beginning to increase in the number publications.

2.1. Feature Selection

Feature selection is applicable to both supervised and unsupervised learning algorithms and is used to trim the input dataset of redundant or unnecessary data, which improves its training speed and accuracy, depending on the approach. Researchers have investigated to find optimal approaches to feature selection.
Changrashekar et al. conducted a review of the impact of feature selection in an analysis [27]. Changrashekar found that for one of their datasets, reducing from 34 features to just 9 features improved its modeled performance from 90% to 95%. Models containing excessive features may overfit the dataset and perform worse in testing. Though this suggests that pruning some features from the data is beneficial, another dataset including all features produced an accuracy of almost 80%, while reducing that dataset by 1 feature, to a total of 7, reduced its accuracy to just 71%. These examples show that pruning features from a dataset may degrade performance. The authors’ conclusions are that feature selection should be cross validated for each application.
Yan et al. evaluated the benefits of a feature selection algorithm for data preprocessing [26]. Yan found that feature selection can help define the information which improves model performance most significantly. This may be used when deciding which sensors to purchase because each sensor has been ranked according to its importance to the model. Cost-limited analysis, which simulates projects with a limited financial budget, evaluated this tradeoff and found that using just 16 sensors in their chiller system can provide enough information for machine learning analysis with greater than 95% accuracy.
Yan et al. used the ReliefF algorithm, which calculates a feature score for each feature to determine their importance, alongside SVM analysis for feature selection with success [28]. The authors used just 6 variables in the final model instead of the original 65 variables and produced models with greater than 90% accuracy.

2.2. Data-Driven Methods

Principal Component Analysis

Principal Component Analysis methods have been used extensively in sensor fault detection. PCA maps high-dimensional data into a lower dimension representing the dataset’s variance; the first Principal Component of the dataset is the dimension capturing the most of its variance. This process is illustrated in Figure 2. Wang and Xiao applied PCA to AHU sensors in their studies [29]. Li and Wen combined PCA methods and wavelet transforms to detect faults in AHUs [30]. Du et al. combined PCA and Fisher’s Discriminant Analysis for FDD in sensors in VAV systems [31].
Hu et al. studied the sensitivity of fault detection in different fault severity levels in chiller sensors [32]. However, there are limitations in using PCA methods for FDD. Zhao et al. found that principal components analysis uses linear assumptions, which are detrimental to performance because the chiller data are often nonlinear [33].
Beghi et al. used PCA to distinguish anomalies from normal operation and reconstructed the contributions of each variable to order variables according to their improvement to the model’s accuracy [34]. Mahadevan et al. used PCA and dynamic PCA to detect faults using established procedures and combined those results with a one-class support vector machine to perform fault diagnostics [35]. Zhang et al. combined PCA and clustering to detect and diagnose faults in building sensors [36].
Xiao et al. developed PCA models which monitor heat- and pressure-flow-balance in an AHU [37]. Wang and Xiao expanded on this research by employing expert rules to assist in diagnosing faults and developing separate models for heat and pressure-flow balance [38]. The authors research concludes with a third iteration that evaluates these models on simulated results [39]. Many researchers have studied the abilities of PCA to detect and diagnose sensor faults throughout an HVAC system [40,41,42].

2.3. Supervised Learning

Data-driven methods perform analysis using more statistical methods such as regression or multiclass classification. This category accounts for the majority (79%) of all implementations in industry [19]. Support vector machines have proven to be a powerful multiclass classification tool in all fields and have been applied extensively within building systems.
Dehestani et al. developed a boosting approach using an artificial neural network to generate data residuals, which were then used to train the SVM [43]. Yan et al. used sequential forward feature selection to reduce the number of input features before using their SVM-based FDD algorithm [28]. Chandrashekar and Sahin conducted a review of preprocessing methods in general computer science problems, specifically filter, wrapper, and embedded methods [27].
Han et al. developed a method for chillers using SVMs, which was able to reach 95% accuracy for several different faults [44]. Kriegel et al. developed an angle-based outlier detection algorithm which operates on the variance of angles between pairs of points, which resolves the curse of dimensionality of complicated datasets [45]. They found that the angle-based algorithm produced recall values and precision values within 10% of other popular fault detection algorithms such as the local outlier factor.
Bode et al. found that using a balanced dataset is important while developing machine learning algorithms [46]. Their experiment failed to produce any reliable metrics because of the high imbalance between normal and faulty data in their dataset. With 99.9% of samples in the dataset fault-free, the algorithm learned to predict the fault status of any dataset without a fault. While its test accuracy was high, it produced an unusable model that was unable to predict faults at all. This is particularly important in the building space, where it may be difficult to obtain a dataset with known faults.
Ebrahimifakhar et al. evaluated nine different classification algorithms to determine which performed best given their dataset consisting of 15 features with 8 possible output classes [47]. The authors determined that their SVM classifier produced the best accuracy of the nine algorithms they tested. Shohet et al. also evaluated several different algorithms to model non-condensing boilers and found that their decision trees and support vector machines produced the highest fault prediction accuracy, over 95% for each [48].
Lee et al. developed several supervised clustering methods to detect false alarm warnings of chillers in a data center [49]. The authors found their multiclass neural network to have the best performance, with a 99.6% prediction accuracy on its testing dataset. Wang et al. used the residual-based exponential weighted moving average method and boolean rules to detect and diagnose a variety of faults in AHUs [50].
Yu et al. developed a data-mining technique that utilized association rule mining (ARM), which determines rules based on common associations between variables, alongside outlier detection methods to model energy consumption of buildings in various climates [51].

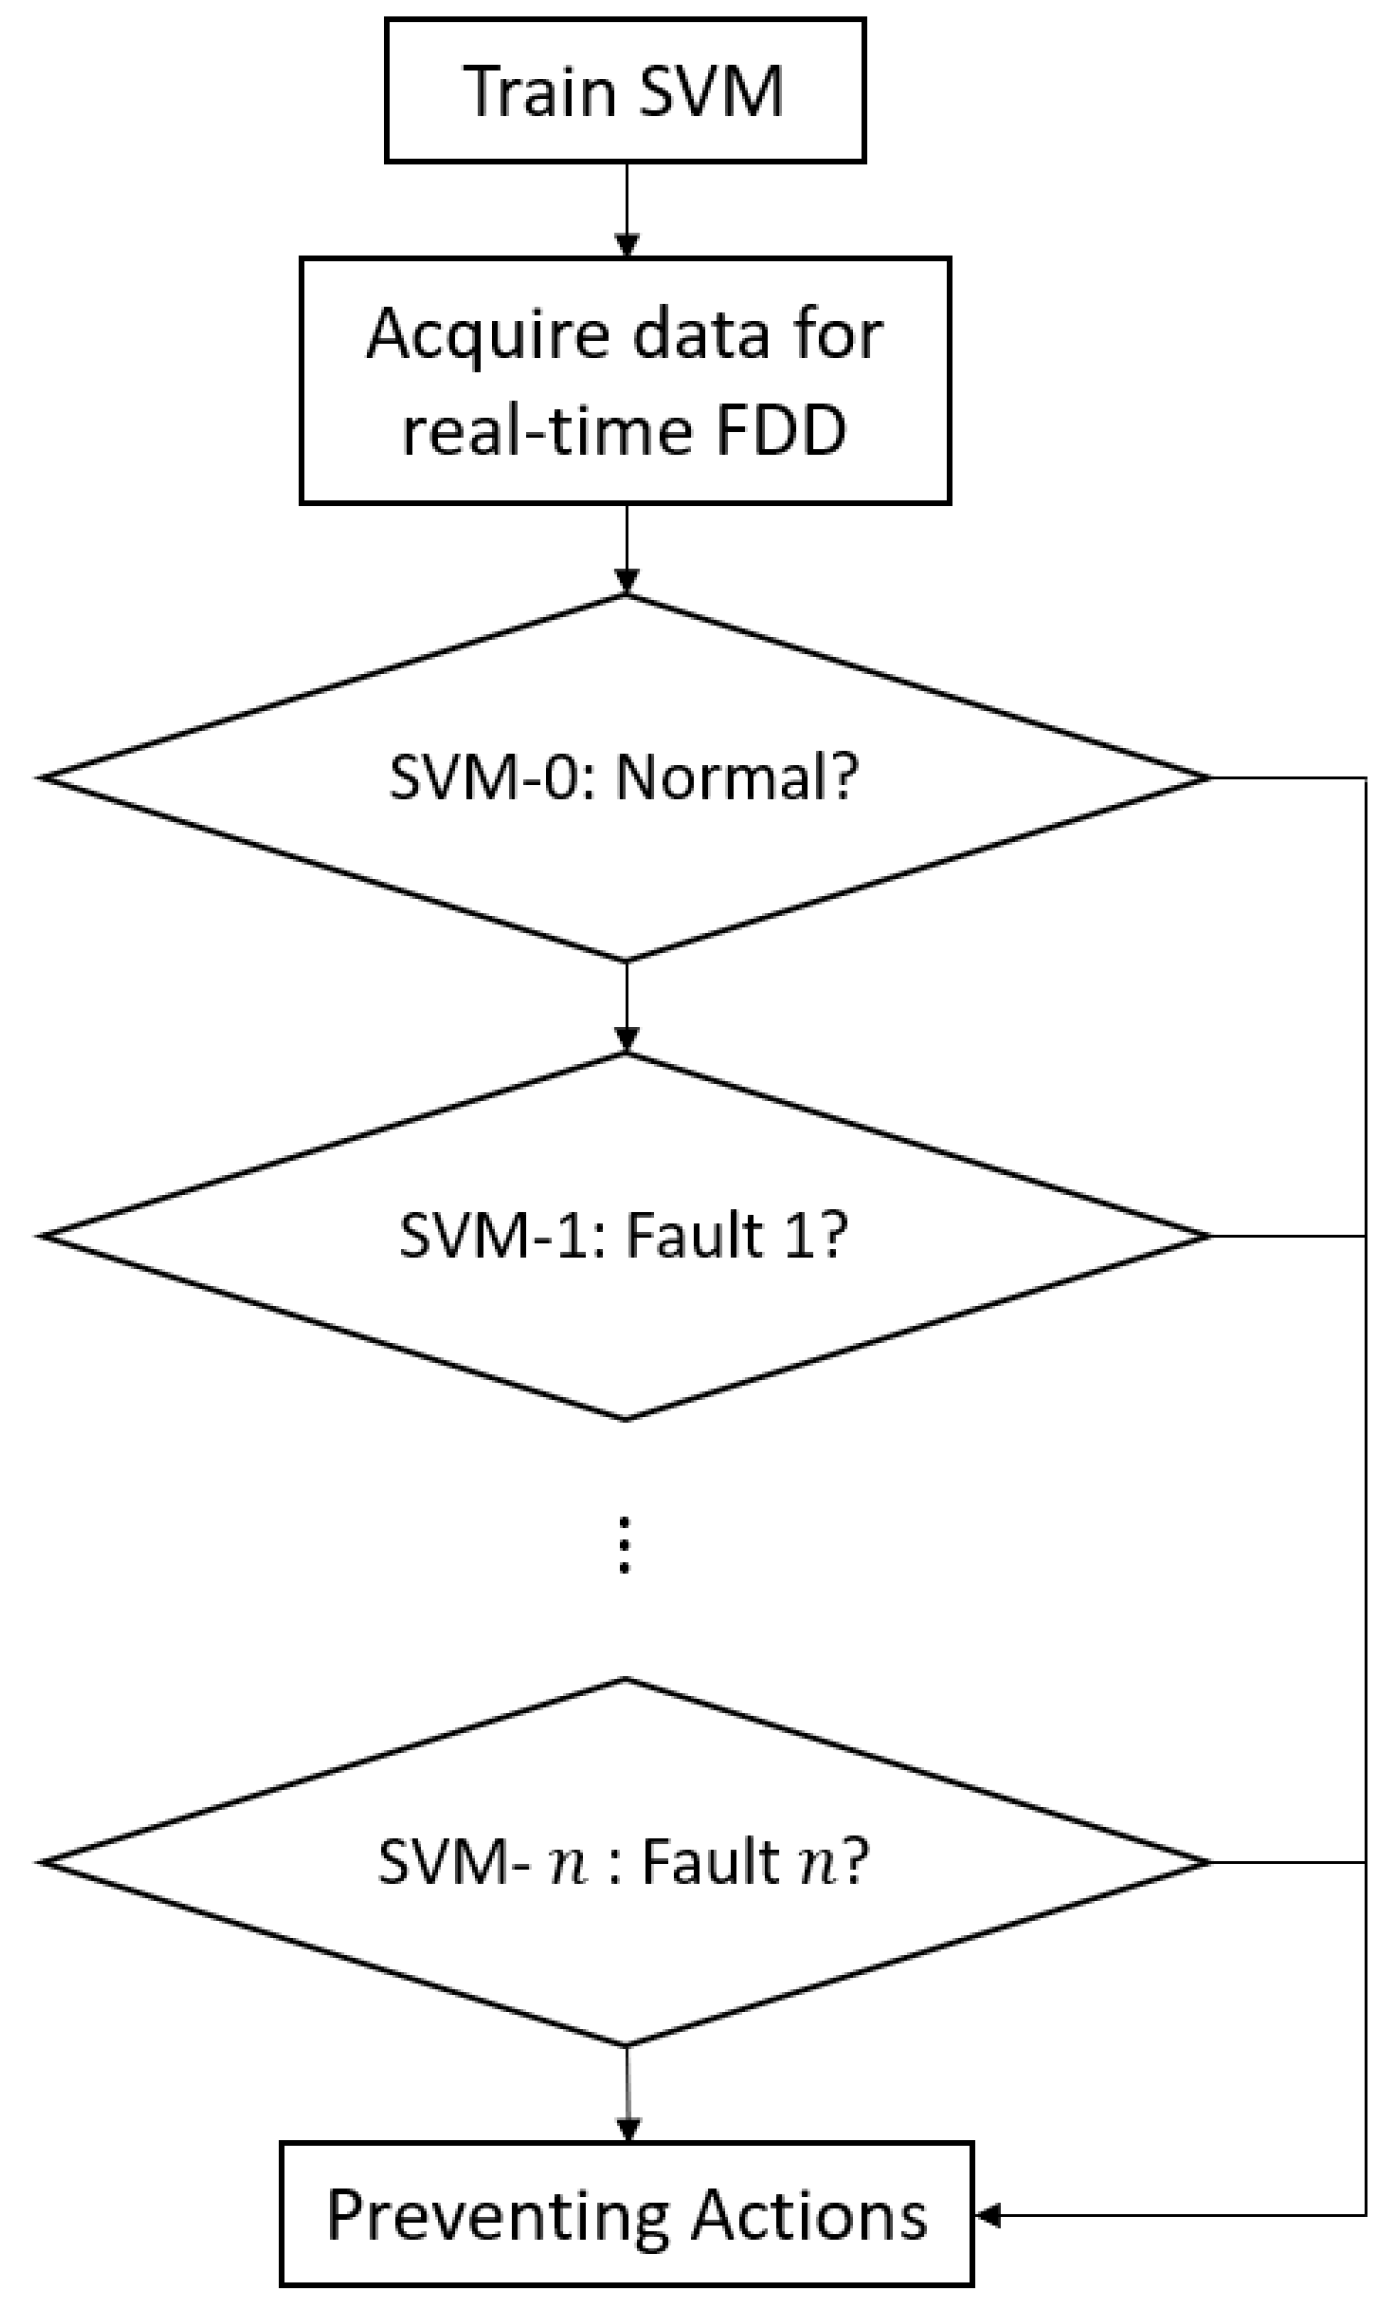
2.3.1. Support Vector Machines

Some researchers have worked to combine several established methods of FDD to create new, more powerful methods to detect faults. Liang et al. combined model-based FDD with SVMs [52]. Their model was developed using mass and energy balances in the system and was then simplified by using a lumped parameter method, which combines several components of the system into one parameter in the model; a chiller would become a single parameter in the final model despite it consisting of several sub-components. This model’s output data were analyzed first using residual analysis with several threshold alarms set to capture sufficiently different performance. This residual analysis acts as the fault detection step. After faulty performance has been identified, the data is sent to the SVM classifier, which has been configured as several layers of a one-vs-all structure, displayed in Figure 3, to identify which fault has been triggered. The authors of this paper were able to produce an accuracy of 100% for their classifier. Perfect accuracy was achieved by including only independent faults in the dataset. Thus, without interdependencies, the algorithm is able to perfectly separate each fault in the feature space.
SVMs have been used to classify building data. Suykens and Vandewalle developed least squares SVM classifiers for binary fault classification [53], which was used by Han et al. for chiller fault diagnosis [54]. Every et al. developed an unsupervised method for fault diagnostics using SVMs and Gaussian system models [55]. Han et al. developed another FDD algorithm which uses SVMs for classification in vapor compression systems [56], which makes use of measured data in the chiller from ASHRAE project 1043-RP. The authors chose the Gaussian Radial Basis Function (RBF) kernel function and used 10-fold cross validation to tune its parameters. Li et al. combined Binary Relevance with the SVM algorithm to create BR-SVM, which was able to successfully diagnose simultaneous faults in a system using a model trained only on single faults [57]. Wu et al. developed an SVM model of an AHU [58]. Their model had a test accuracy of 99.58% but failed to classify any of the faults it detected. Han et al. applied SVMs to detect multiple-simultaneous faults in chiller operational data, where they found that their models were able to predict over 99% of multiple-simultaneous faults in their dataset [44].
SVMs are also able to be successfully applied as regression models, as Tran et al. found [59]. SVMs map data into a higher-dimensional space to find a linear boundary between the output classes, as displayed in Figure 4. The authors modeled the ASHRAE RP-1043 dataset using a differential-evolution SVR algorithm and found that its correct detection rate for chiller faults was up to twice the value of the reference t-statistic model. Zhao et al. also used support vector regression (SVR) algorithms alongside exponentially weighted moving averages to detect chiller faults in the ASHRAE RP-1043 dataset [32].

2.3.2. Neural Networks

Artificial Neural Networks (ANN) are also able to classify fault data [61,62]. Afram et al. conducted a review of an ANN with a Model Predictive Control (MPC) system used in conjunction with a Best Network after Multiple Iterations (BNMI) model [63]. MPC implementations are used in combination with ANNs with a set of objectives in mind, including the minimization of energy consumption or maintaining thermal comfort, which the authors define as the Predicted Mean Vote (PMV) index. The PMV index is calculated as the mean vote from a set of people about their thermal comfort, where +3 is hot and −3 is cold. The objective of maintaining thermal comfort is to keep the PMV index within 0.5 points of 0.
Afram et al. followed the Universal Approximation Theorem [64] when designing their neural network, which was a Multi-Layer Perceptron (MLP) with one hidden layer and one output layer, as shown in Figure 5. The BNMI model iteratively finds the optimal parameter weights by computing the model’s goodness of fit after each iteration and subjecting that to a threshold of acceptable results. The BNMI model find an acceptable model when given enough iterations. The authors found that the BNMI model improved performance between 6% and 59% compared to their previous works.
Taheri et al. developed seven neural networks to model fifteen different variables from buildings at the Lawrence Berkeley National Laboratory [65]. The datasets used for their project consist of verified normal and faulty data. Their neural networks predicted the fault of the system given the input data. The trained models were evaluated using precision and recall. Precision is defined as the fraction of predictions which were correct, while recall is defined as the fraction of faulty points which were predicted correctly. Precision and recall are used to quickly communicate the type I and type II errors in the results. The authors found that one of their less complex models, consisting of fewer nodes, outperformed the more complicated ones and produced an average precision of 0.8 and 0.72 with an average recall of 0.85 and 0.77 for single-zone AHUs and multi-zone AHUs, respectively.
Tang et al. evaluated five different data-mining algorithms, including decision trees, support vector machines, and neural networks, to model their full HVAC system dataset and found that a multilayer perceptron ensemble performed best for clustering analysis [66]. Their clusters were able to successfully detect different scenarios of operation for the building to produce a model with a mean absolute percentage error of less than 4% of the system’s total energy consumption. Du et al. used combined neural networks and subtractive clustering to detect various faults in an HVAC system [67,68]. Fan et al. developed several neural networks, including back-propagation and Elman neural networks, to identify sensor faults in an AHU [69].
Guo et al. used a backpropagation neural network for fault detection of a variable refrigerant flow air conditioning system [70]. Magoulès et al. used a recursive deterministic perceptron to model building energy consumption [71], while Zhu et al. and Yang et al. combined neural networks with wavelet and fractal preprocessing to model sensor behavior [72,73]. Fan et al. attempted to perform AFDD using neural networks using limited labeled data in an AHU [74,75].
Shahnazari et al. developed layer recurrent neural networks (LRN) to detect and diagnose a variety of HVAC faults in a series of studies [76,77,78]. The authors found that the LRNs are suitable for fault detection because of the nonlinear dynamic functions used in their analysis. Their models are trained histories without faults and compare healthy data against up-to-date measured data for discrepancies.

2.4. Unsupervised Learning

Unsupervised learning algorithms can be distinguished further into popular methods, such as clustering, rule-based methods, and regression-based methods. Of these distinctions, rule-based methods have been historically the most widely used methods [4]. Principal components analysis and regression using complex algorithms in neural networks have been gaining popularity in recent years [19].

2.4.1. Clustering

Li et al. combined density clustering and PCA to improve on the single-PCA model approach [79]. The authors employed Density-Based Spatial Clustering of Applications with Noise (DBSCAN) [80] to distinguish between clusters of unknown shapes based on the connections between high- and low-density spaces. DBSCAN creates clusters based on point density, excluding sparse points. Figure 6 demonstrates the classification of dense points vs. sparse points. PCA was used in conjunction with DBSCAN to aid in visualization and result interpretation.
DBSCAN is used in the initial step of the algorithm to cluster historical data performance. Each operating condition was processed using a unique PCA model (described as sub-PCA by Li and Hu [79]), which is then clustered by the DBSCAN algorithm. Any new data collected from the building system is classified using the DBSCAN algorithm to predict which building operating mode is active. If the new data matches an operating condition which has already been trained by the algorithm, the corresponding model will be used for analysis. The DBSCAN-PCA approach to sensor fault analysis produced an improvement in detection ratio of 29.8% and diagnosis ratio or 27.9% over the classical PCA approach to analysis.
Dey et al. developed an event-area based clustering algorithm to determine the operating mode of Terminal Boxes (TB) [81]. The authors detected specific operational changes in the TB related to cooling or heating start and end events and calculated the area under those power curves to determine approximate efficiency metrics. They then clustered the average value of these events over the course of the day to produce approximate operational modes: normal and faulty states dependent on the power curves of cooling and heating equipment. Their methods produced precision and recall values greater than 0.9 for all test cases.
Gaitani et al. combined principal components analysis and clustering analysis to evaluate heating performance in 1100 school buildings [82]. The energy output describes the approximate rate of oil consumption used in the heating system. The authors used K-means clustering analysis, which assigns an output class to a data point according to the nearest cluster mean, on the principal components generated from the seven original input variables to determine which of the five classes the building operation belongs to. K-means analysis is shown in Figure 7, where Step 1 represents the initial random assignment of cluster centroids and the successive steps demonstrate the updating of cluster centroids and drawing of a new decision boundary. Their analysis was able to determine, with only 5% variance, the energy behavior class of the school building using only the seven inputs.
Luo et al. analyzed a chilled water system using the k-means clustering analysis, which assigns an output class to a data point according to the mean of the nearest cluster, coupled to the Davis–Bouldin value to determine the optimal number of clusters in the dataset [84]. Yang et al. used the k-shape clustering algorithm, which is a time-series clustering algorithm using centroids, to forecast building energy usage patterns using daily consumption datasets from an SVM model [85]. Hsu et al. also forecasted energy consumption of a building using many different algorithms, including K-means, and found that clusterwise regression performed the best, with a mean CVMSE of 0.3 and a standard deviation of 0.15 [86]. Lavin et al. also identified trends in energy usage profiles using k-means analysis and found that the algorithm was able to group similar-performing datasets together [87]. Several researchers have used clustering to assist in modeling occupant influence on a building’s energy consumption [50,88,89]. D’Oca et al. used k-means clustering to detect open and closed windows in an office using numerical and categorical variables [90].
Jakkula et al. used k-Nearest Neighbor (kNN), which assigns an output class to a data point according to the most common class of its k nearest neighbors, clustering for outlier detection in electric consumption datasets [91]. They found that the kNN algorithm was able to produce greater than a 90% accuracy in detecting outliers.
Yuwono et al. used the Swarm Rapid Centroid Estimation consensus clustering with a novel self-evolution strategy as a feature selection technique in their AFDD analysis [92]. They also used Ensemble Rapid Centroid Estimation techniques. Their results are grouped by season, and the model’s sensitivity and specificity metrics for each fault were greater than 97% throughout the 3 evaluated.
Shao et al. combined clustering with motif mining to disaggregate energy consumption in a building and determine which components are the heaviest consumers [93]. They found accurate performance for pumps, blowers, and fans, producing precision and recall of 0.99.
Guo et al. developed a Gaussian Mixture Modeling (GMM) approach to model failure modes of a variable refrigerant flow air-conditioning system [94]. The model was used to predict refrigerant over- and under-charge, outdoor unit fouling, and four-way reversing valve faults. The Gaussian mixture model is an unsupervised clustering algorithm which produces clusters in the original dataset and assigns each data point a probability of being in each cluster, as shown in Figure 8. They found that as the number of features increases, the GMMs were able to achieve greater than 99% accuracy. Karami et al. also used GMMs to successfully model a water-cooled multi-chiller plant system, with a RMSE of 0.7 and MAE of 13.52 kW [95].

2.4.2. Regression Algorithms

Regression algorithms have seen an explosion in popularity in recent years [19]. Yan et al. used classification and regression decision trees for FDD of air handling units [41]. The average f-score for the algorithm was 0.97, and a comparison of the diagnostic information with field expert knowledge show that the interpretability of the decision tree is strong, though some diagnostics were incorrect. Li et al. also used decision trees to detect and diagnose faults in a building’s cooling system [97]. The authors used a tree structured fault dependence kernel method, which produced an accuracy of up to 90%.
Jones used lateral priming adaptive resonance theory neural networks to detect and diagnose faults in building sub-systems [98]. These are coupled fuzzy adaptive resonance theory networks, which use self-organizing learning instead of gradient descent. Lee et al. also evaluated faults in building sub-systems using neural networks [99]. The authors found that the nonlinearity of the regression networks produce accurate models for building operation.
Howard et al. used spline regression models, which model a function as a piecewise definition, to model daily electricity consumption in a building [100]. Yang et al. developed a hybrid analysis using fractal correlation dimension for nonlinear signal processing with residual-based analysis for AHU sensor diagnosis [101].
Yan et al. developed an autoregressive model with exogenous terms (ARX) model, which models future performance based on past performance, for chillers which was used in conjunction with support vector machine analysis [22]. The authors found that without proper preprocessing, results were unusable. Yoshida et al. used a recursive ARX model to detect faults in a VAV AHU but found that datasets containing sensor errors will produce unacceptable results [102]. Several researchers have been able to develop a successful ARX model by using the ReliefF preprocessing method and SVM analysis on the ARX model parameters [28,103,104,105].

2.4.3. Rule-Based Methods

House et al. developed a comprehensive ruleset for AHUs complete with performance analysis for each rule [18]. In this system, rules are collected into several modes: heating, cooling with outdoor air, mechanical cooling with 100% outdoor air, and mechanical cooling with minimum outdoor air. Several rules were developed for each mode to capture several impact areas: comfort, indoor air quality, energy, and maintenance. Of the twenty-eight rules, thirteen monitor comfort performance in the building, two monitor its indoor air quality, twenty-five monitor energy consumption, and only one monitors behavior that would increase maintenance costs.
The rules are also grouped into various relationships: coils, mixing boxes, comfort requirements, zones, economizer operation, and controller logic. Each of these relationships contains rules from several operating modes to maximize the operating time coverage by the rule groups.
The rules were developed to require only 11 sensor measurements, each of which were expected to be available in most buildings at the time of this paper’s publication in 2001. These are (1) occupancy status, (2) supply air temperature set point, (3) supply air temperature, (4) return air temperature, (5) mixed air temperature, (6) outdoor air temperature, (7) cooling coil control, (8) heating coil control, (9) mixing box damper control, (10) return air relative humidity, and (11) outdoor air relative humidity.
The results of the study show that in general, the rules correctly identify faulty behavior in a building. However, House et al. found that the rules detected faults at a high rate in the field testing trials. The suggestion by the authors for the cause of this detection rate is improperly defined user thresholds for each of the rules, which aligns with the understanding that rule-based methods for FDD require a high level of configuration in each building to produce accurate results.
Schein and Bushby implemented a rule-based system based on the hierarchy of subsystems in an HVAC system to evaluate rules in boiler and chiller plants [106]. Their analysis correctly determined the source of the fault in 49 of 60 trials and 8 correct fault-free cases for a total correct response rate of 95%.
Tran et al. developed a set of rules corresponding to seven faults for fault diagnostics [107]. These rules consisted of relative metrics for five measured parameters in a chiller to describe whether the parameter increases, decreases, or remains relatively stable in each fault condition. The rules were used in conjunction with an RBF model for each feature value and were able to successfully diagnose condenser scaling when tested with measured data.

2.5. Characteristic Signatures

Characteristic signatures are normalized plots showing the difference between simulated and measured values as a function of outdoor air temperature [108]. Characteristic signatures can be created for any component in the building system. These characteristic signatures are historically used to calibrate a building’s energy consumption by guiding the user to adjust appropriate variables in the calibration process. When a simulation’s characteristic signature matches a predetermined signature, this equipment may be accepted as successfully calibrated. A similar process is completed for every component in the system until a significant difference is found between published and simulated characteristic signatures. This component’s simulation is incorrect and should be fixed. The calibrations are generally considered successful if they are able to reach 5–10% of the mean value of the consumption. The limitation is that only one variable can be used in each step of the calibration process.
The final calibrations are monitored using measured data for any significant deviations between measured and simulated energy consumptions. Plots of energy consumption against outside air temperature can be generated for the measured period and a second calibration of the baseline model against the measured plots is performed. The parameters of the original baseline model and the calibrated faulty model are compared to determine the approximate failure mode in the system.
First-principles equations may be used with the knowledge of the system to trace effects and provide a more complete understanding of the system’s new behavior. This concept has been used by Lin et al. to detect abnormal building energy consumption [109], but not when detecting component faults in a building.

2.6. Challenges

Yang et al. claim it is difficult to generate enough real data to do full-scale analysis of a building [110]. Machine learning analysis requires a large amount of training data evenly distributed among fault classes for the best performance. In reality, this is difficult to guarantee because it is often unknown which faults are active in a building at all times. This leads to mislabeled training data, which produces a model which will predict incorrect output classes.
In addition, generalization of machine learning analysis is an ongoing problem [49,75,104]. Research has been completed over many specific buildings or pre-compiled datasets, but little research has been completed which has been designed to apply across a variety of buildings with different configurations [111]. Additionally, research tailored to a single dataset may produce very high accuracies which are unattainable when using other datasets.
Granderson et al. conducted a review of currently established AFDD tools in commercial buildings [112]. This paper provides insight on the differences between trends in the field and the more practical use cases. Fourteen tools were evaluated, and twelve of these fourteen make use of rule-based algorithms. While many of these tools use other methods alongside the rules, the studies show their reliability and establish the rule-based tools as most popular in current applications. Only three of the fourteen tools use black-box models to perform fault detection.
Hacker et al. found that the majority (63%) of surveyed building managers see the adoption of AFDD tools to be a difficult change to their workflow [113]. 70% of those managers find the lack of standardized data access to be a major barrier toward widespread adoption of these AFDD routines. There have been recent efforts to provide standardized data access [114]. However, over 90% of these managers see high value in reducing energy consumption and costs in their buildings. If their major barriers to entry are resolved, they have communicated an interest in the benefits that AFDD tools may provide.

2.7. Machine Learning Methods in the Future

Machine learning algorithms and applications are improved continuously by identifying their weaknesses and proposing solutions. Researchers have conducted studies to identify weaknesses in machine learning applications for building system AFDD and constructively proposed their solutions.
Shohet et al. found that physical models, which are defined by first-principles equations, are able to be generalized [48], but research using physical models is less common than data-driven models [19]. Physical models are mathematically complex and can be difficult to develop. In addition, adapting the mathematically complex model to specific building equipment requires configuration, which requires an experienced user [4]. To avoid the pitfalls of physical models, generalizable data-driven models should be developed. As buildings continue to measure large amounts of data, data-driven models are well suited for solving building problems.
It has been proposed that hybrid approaches to AFDD may perform better than either strictly model-based or data-driven approaches [22]. Hybrid models can offer a solution to the mathematical complexities of physical model analysis and the data collection restrictions in data-driven models. The main obstacle, according to Tidriri et al., is having no clear framework to interface between model-based analysis and data-driven machine learning. This obstacle results in tools either designed for a specific case or a tool making use of purely physical models or data-driven algorithms, with no interface between them.
While the reviewed research found success in using machine learning algorithms in AFDD applications, their analysis requires configuration only possible to users with advanced knowledge of machine learning algorithms. In practice, it is unrealistic to expect all building engineers to have the required knowledge of machine learning algorithms to design their own solution. Applications of these algorithms should be designed to minimize the knowledge required by the user to maximize the usability of the software. This may be achieved by simplifying data processing and model tuning.
The format of results produced by the algorithms in this review require a similar amount of training to interpret. As the algorithm’s complexity increases, so does the complexity of its results. Results should be post-processed into an interpretable format that requires no additional training to read. The output should be a human-readable description of the event. Interpretability scales in difficulty as the analysis is generalized. For a given building, the results may be easily interpreted because of the knowledge of the structured dataset and available sensors. As the analysis is generalized, the structure of each training dataset may change and results must be further post-processed to maintain readability.

3. Concluding Thoughts

The literature reviewed in this study provides an overview of current trends in machine learning analysis for fault detection and diagnosis. The review focuses on the data-driven and hybrid methods which is representative of research performed in the building energy analytics field [19]. Additional research has been performed on fault detection without diagnostics, which requires manual diagnostics by a skilled engineer.
The data-driven methods are further divided into supervised and unsupervised learning as well as PCA-based analysis. PCA-based analysis represents early research in this field and is used today as part of data preprocessing before major analysis is performed using more complex algorithms. Supervised learning describes analysis using datasets where the output class describing the fault condition is known. There have been problems historically obtaining data where the potential active faults are known, which can make developing supervised analysis difficult. Unsupervised learning only requires measured data from the system; the algorithm will derive the faults using the measured data. Unsupervised methods may also be less interpretable than their supervised counterparts because each output class must be defined after analysis.
Classification algorithms such as support vector machines or neural networks have found strength in supervised fault diagnostics, where datasets are generated using known fault states. Support vector machines are efficient on smaller datasets but are less effective on datasets with overlapping classes. Neural networks are very powerful learners but are black boxes with little interpretability. Clustering has been successful in unsupervised situations for fault detection and is often used in conjunction with other algorithms for fault diagnostics.
Regression algorithms have found success predicting system energy consumption and detecting faults from consumption anomalies. Rule-based analysis is established as the most popular current form of AFDD implementation in building systems [112] but is known to require precise configuration and is limited in scope.
A common conclusion from the reviewed research is that many algorithms grow stronger when used in combination with another. When chosen correctly the combination employs checks and balances on each algorithm, which produces a whole which is greater than the sum of its parts.
This review into the state of research into AFDD today reveals some areas in need of improvement before widespread adoption of these tools. These tools must be generalizable, easy to use, and interpretable [112]. Future work in this field should resolve the issues listed above. Models must be trained with data which defines the fault condition in the system, or algorithms must be used which can make use of fault-free data to produce predictions which are interpretable to the engineer. Hybrid approaches may define the fault condition through simulated data, which is generated to a known system state. Additional work remains to simplify data collection and processing, which may make use of the system’s governing equations if a hybrid approach is used.

Author Contributions

Investigation, W.N.; resources, W.N.; writing—original draft preparation, W.N.; writing—review and editing, C.C.; supervision, C.C.; project administration, C.C.; funding acquisition, C.C. All authors have read and agreed to the published version of the manuscript.

Funding

This research was funded by Texas A&M Engineering Experiment Station’s Energy Systems Lab.

Institutional Review Board Statement

Not applicable.

Informed Consent Statement

Not applicable.

Data Availability Statement

Not applicable.

Conflicts of Interest

The authors declare no conflict of interest. The funders had no role in the design of the study; in the collection, analyses, or interpretation of data; in the writing of the manuscript; or in the decision to publish the results.

Nomenclature

AFDDAutomated Fault Detection and Diagnostics
AHU Air Handling Unit
AI Artificial Intelligence
ANN Artificial Neural Network
APAR Air-Handling Unit Performance Assessment Rules
ARM Association Rule Mining
ARX Autoregressive Model with Exogenous Terms
ASHRAE American Society of Heating, Refrigerating, and Air-Conditioning Engineers
BNMI Best Network after Multiple Iterations
DBSCAN Density-Based Spatial Clustering of Applications
FDD Fault Detection and Diagnostics
GMM Gaussian Mixture Model
HVAC Heating, Ventilation, and Air Conditioning
IEA International Energy Agency
kNNk-Nearest Neighbor
LRN Layer Recurrent Neural Networks
MAE Mean Absolute Error
ML Machine Learning
MLP Multi-Layer Perceptron
MPC Model Predictive Control
PCA Principal Components Analysis
PMV Predicted Mean Vote
RBF Radial Basis Function
RMSE Root Meat Squared Error
SVM Support Vector Machines
SVR Support Vector Regression
TB Terminal Box
VAV Variable Air Volume

References

  1. Global Status Report towards a Zero-Emission, Efficient and Resilient Buildings and Construction Sector. Available online: https://www.iea.org/reports/2018-global-status-report (accessed on 19 April 2022).
  2. Yang, H.; Zhang, T.; Li, H.; Woradechjumroen, D.; Liu, X. HVAC Equipment, Unitary: Fault Detection and Diagnosis; CRC Press: Boca Raton, FL, USA, 2014; pp. 854–864. [Google Scholar] [CrossRef]
  3. Qin, J.; Wang, S. A fault detection and diagnosis strategy of VAV air-conditioning systems for improved energy and control performances. Energy Build. 2005, 37, 1035–1048. [Google Scholar] [CrossRef]
  4. Katipamula, S.; Brambley, M.R. Review Article: Methods for Fault Detection, Diagnostics, and Prognostics for Building Systems—A Review, Part I. HVACR Res. 2005, 11, 3–25. [Google Scholar] [CrossRef]
  5. Roth, K.W.; Detlef, W.; Patricia, L.; Michael, Y.; Feng, N.D. The Energy Impact of Faults in U.S. Commercial Buildings. In Proceedings of the 2004 International Refrigeration and Air Conditioning Conference, West Lafayette, Indiana, 12–15 July 2004. [Google Scholar]
  6. Seppänen, O.; Fisk, W.J.; Lei, Q.H. Effect of Temperature on Task Performance in Office Environment. 2006. Available online: https://indoor.lbl.gov/publications/effect-temperature-task-performance (accessed on 25 July 2022).
  7. Bendapudi, S.; Braun, J.E.; Groll, E.A. A Dynamic Model of a Vapor Compression Liquid Chiller. International. Available online: http://docs.lib.purdue.edu/iracc/568 (accessed on 1 April 2020).
  8. Bourdouxh, J.P.; Grodent, M.; Lebrun, J. HVAC1kit—A toolkit for primary HVAC system energy calculation. Energy 1999, 4, 694. [Google Scholar]
  9. Breuker, M.S.; Braun, J.E. Evaluating the Performance of a Fault Detection and Diagnostic System for Vapor Compression Equipment. HVACR Res. 1998, 4, 401–425. [Google Scholar] [CrossRef]
  10. Gertler, J.J. Fault Detection and Diagnosis in Engineering Systems; CRC Press: Boca Raton, FL, USA, 1998. [Google Scholar] [CrossRef]
  11. Wagner, J.; Shoureshi, R. Failure Detection Diagnostics for Thermofluid Systems. J. Dyn. Syst. Meas. Control 1992, 114, 699–706. [Google Scholar] [CrossRef]
  12. Haves, P.; Salsbury, T.I.; Wright, J.A. Condition monitoring in HVAC subsystems using first principles models. ASHRAE Trans. 1996, 102, 519–527. [Google Scholar]
  13. Salsbury, T.; Diamond, R. Fault detection in HVAC systems using model-based feedforward control. Energy Build. 2001, 33, 403–415. [Google Scholar] [CrossRef]
  14. Norford, L.K.; Wright, J.A.; Buswell, R.A.; Luo, D.; Klaassen, C.J.; Suby, A. Demonstration of fault detection and diagnosis methods for air-handling units (ASHRAE 1020-RP). HVAC R Res. 2002, 8, 41–71. [Google Scholar] [CrossRef]
  15. Castro, N. Performance Evaluation of a Reciprocating Chiller Using Experimental Data and Model Predictions for Fault Detection and Diagnosis. 2002. Available online: https://www.nist.gov/publications/performance-evaluation-reciprocating-chiller-using-experimental-data-and-model (accessed on 12 August 2019).
  16. PECI, B. Methods for Automated and Continuous Commissioning of Building Systems; Air-Conditioning and Refrigeration Technology Institute (US): Arlington, VA, USA, 2003; pp. 6–8. [Google Scholar] [CrossRef]
  17. Katipamula, S.; Pratt, R.G.; Chassin, D.P.; Taylor, Z.T.; Gowri, K.; Brambley, M.R. Automated fault detection and diagnostics for outdoor-air ventilation systems and economizers: Methodology and results from field testing. Trans. -Am. Soc. Heat. Refrig. Air Cond. Eng. 1999, 105, 555–567. [Google Scholar]
  18. House, J.M.; Vaezi-Nejad, H.; Whitcomb, J.M. An Expert Rule Set for Fault Detection in Air-Handling Units. Ashrae Trans. 2001, 107, 858. [Google Scholar]
  19. Zhao, Y.; Li, T.; Zhang, X.; Zhang, C. Artificial intelligence-based fault detection and diagnosis methods for building energy systems: Advantages, challenges and the future. Renew. Sustain. Energy Rev. 2019, 109, 85–101. [Google Scholar] [CrossRef]
  20. Chen, J.; Zhang, L.; Li, Y.; Shi, Y.; Gao, X.; Hu, Y. A review of computing-based automated fault detection and diagnosis of heating, ventilation and air conditioning systems. Renew. Sustain. Energy Rev. 2022, 161, 112395. [Google Scholar] [CrossRef]
  21. Mirnaghi, M.S.; Haghighat, F. Fault detection and diagnosis of large-scale HVAC systems in buildings using data-driven methods: A comprehensive review. Energy Build. 2020, 229, 110492. [Google Scholar] [CrossRef]
  22. Tidriri, K.; Chatti, N.; Verron, S.; Tiplica, T. Bridging data-driven and model-based approaches for process fault diagnosis and health monitoring: A review of researches and future challenges. Annu. Rev. Control 2016, 42, 63–81. [Google Scholar] [CrossRef]
  23. Maurya, M.R.; Rengaswamy, R.; Venkatasubramanian, V. A Signed Directed Graph and Qualitative Trend Analysis-Based Framework for Incipient Fault Diagnosis. Chem. Eng. Res. Des. 2007, 85, 1407–1422. [Google Scholar] [CrossRef]
  24. Siswantoro, J.; Prabuwono, A.S.; Abdullah, A.; Idrus, B. A linear model based on Kalman filter for improving neural network classification performance. Expert Syst. Appl. 2016, 49, 112–122. [Google Scholar] [CrossRef]
  25. Zhao, Y.; Wang, S.; Xiao, F. Pattern recognition-based chillers fault detection method using Support Vector Data Description (SVDD). Appl. Energy 2013, 112, 1041–1048. [Google Scholar] [CrossRef]
  26. Yan, K.; Zhong, C.; Ji, Z.; Huang, J. Semi-supervised learning for early detection and diagnosis of various air handling unit faults. Energy Build. 2018, 181, 75–83. [Google Scholar] [CrossRef]
  27. Chandrashekar, G.; Sahin, F. A survey on feature selection methods. Comput. Electr. Eng. 2014, 40, 16–28. [Google Scholar] [CrossRef]
  28. Yan, K.; Shen, W.; Mulumba, T.; Afshari, A. ARX model based fault detection and diagnosis for chillers using support vector machines. Energy Build. 2014, 81, 287–295. [Google Scholar] [CrossRef]
  29. Wang, S.; Cui, J. Sensor-fault detection, diagnosis and estimation for centrifugal chiller systems using principal-component analysis method. Appl. Energy 2005, 82, 197–213. [Google Scholar] [CrossRef]
  30. Li, S.; Wen, J. Application of pattern matching method for detecting faults in air handling unit system. Autom. Constr. 2014, 43, 49–58. [Google Scholar] [CrossRef]
  31. Du, Z.; Jin, X. Detection and diagnosis for sensor fault in HVAC systems. Energy Convers. Manag. 2007, 48, 693–702. [Google Scholar] [CrossRef]
  32. Hu, Y.; Li, G.; Chen, H.; Li, H.; Liu, J. Sensitivity analysis for PCA-based chiller sensor fault detection. Int. J. Refrig. 2016, 63, 133–143. [Google Scholar] [CrossRef]
  33. Zhao, Y.; Wang, S.; Xiao, F. A statistical fault detection and diagnosis method for centrifugal chillers based on exponentially-weighted moving average control charts and support vector regression. Appl. Therm. Eng. 2013, 51, 560–572. [Google Scholar] [CrossRef]
  34. Beghi, A.; Brignoli, R.; Cecchinato, L.; Menegazzo, G.; Rampazzo, M.; Simmini, F. Data-driven Fault Detection and Diagnosis for HVAC water chillers. Control Eng. Pract. 2016, 53, 79–91. [Google Scholar] [CrossRef]
  35. Mahadevan, S.; Shah, S.L. Fault detection and diagnosis in process data using one-class support vector machines. J. Process Control 2009, 19, 1627–1639. [Google Scholar] [CrossRef]
  36. Zhang, H.; Chen, H.; Guo, Y.; Wang, J.; Li, G.; Shen, L. Sensor fault detection and diagnosis for a water source heat pump air-conditioning system based on PCA and preprocessed by combined clustering. Appl. Therm. Eng. 2019, 160, 114098. [Google Scholar] [CrossRef]
  37. Xiao, F.; Wang, S.; Zhang, J. A diagnostic tool for online sensor health monitoring in air-conditioning systems. Autom. Constr. 2005, 15, 489–503. [Google Scholar] [CrossRef]
  38. Wang, S.; Xiao, F. Detection and diagnosis of AHU sensor faults using principal component analysis method. Energy Convers. Manag. 2004, 45, 2667–2686. [Google Scholar] [CrossRef]
  39. Wang, S.; Xiao, F. AHU sensor fault diagnosis using principal component analysis method. Energy Build. 2004, 36, 147–160. [Google Scholar] [CrossRef]
  40. Hu, Y.; Chen, H.; Xie, J.; Yang, X.; Zhou, C. Chiller sensor fault detection using a self-Adaptive Principal Component Analysis method. Energy Build. 2012, 54, 252–258. [Google Scholar] [CrossRef]
  41. Xu, X.; Xiao, F.; Wang, S. Enhanced chiller sensor fault detection, diagnosis and estimation using wavelet analysis and prin-cipal component analysis methods. Appl. Therm. Eng. 2008, 28, 226–237. [Google Scholar] [CrossRef]
  42. Yan, R.; Ma, Z.; Zhao, Y.; Kokogiannakis, G. A decision tree based data-driven diagnostic strategy for air handling units. Energy Build. 2016, 133, 37–45. [Google Scholar] [CrossRef]
  43. Dehestani, D.; Eftekhari, F.; Guo, Y.; Ling, S.; Su, S.; Nguyen, H. Online Support Vector Machine Applicationfor Model Based Fault Detection and Isolationof HVAC System. Int. J. Mach. Learn. Comput. 2011, 1, 66–72. [Google Scholar] [CrossRef] [Green Version]
  44. Han, H.; Gu, B.; Hong, Y.; Kang, J. Automated FDD of multiple-simultaneous faults (MSF) and the application to building chillers. Energy Build. 2011, 43, 2524–2532. [Google Scholar] [CrossRef]
  45. Kriegel, H.P.; Schubert, M.; Zimek, A. Angle-Based Outlier Detection in High-Dimensional Data; ACM: New York, NY, USA, 2008. [Google Scholar]
  46. Bode, G.; Thul, S.; Baranski, M.; Müller, D. Real-world application of machine-learning-based fault detection trained with experimental data. Energy 2020, 198, 117323. [Google Scholar] [CrossRef]
  47. Ebrahimifakhar, A.; Kabirikopaei, A.; Yuill, D. Data-driven fault detection and diagnosis for packaged rooftop units using statistical machine learning classification methods. Energy Build. 2020, 225, 110318. [Google Scholar] [CrossRef]
  48. Shohet, R.; Kandil, M.S.; Wang, Y.; McArthur, J. Fault detection for non-condensing boilers using simulated building automation system sensor data. Adv. Eng. Inform. 2020, 46, 101176. [Google Scholar] [CrossRef]
  49. Lee, D.; Lai, C.-W.; Liao, K.-K.; Chang, J.-W. Artificial intelligence assisted false alarm detection and diagnosis system development for reducing maintenance cost of chillers at the data centre. J. Build. Eng. 2020, 36, 102110. [Google Scholar] [CrossRef]
  50. Wang, H.; Chen, Y. A robust fault detection and diagnosis strategy for multiple faults of VAV air handling units. Energy Build. 2016, 127, 442–451. [Google Scholar] [CrossRef]
  51. Yu, Z.; Fung, B.C.; Haghighat, F.; Yoshino, H.; Morofsky, E. A systematic procedure to study the influence of occupant behavior on building energy consumption. Energy Build. 2011, 43, 1409–1417. [Google Scholar] [CrossRef] [Green Version]
  52. Liang, J.; Du, R. Model-based Fault Detection and Diagnosis of HVAC systems using Support Vector Machine method. Int. J. Refrig. 2007, 30, 1104–1114. [Google Scholar] [CrossRef]
  53. Suykens, J.A.K.; Vandewalle, J. Least Squares Support Vector Machine Classifiers. Neural Process. Lett. 1999, 9, 293–300. [Google Scholar] [CrossRef]
  54. Han, H.; Cui, X.; Fan, Y.; Qing, H. Least squares support vector machine (LS-SVM)-based chiller fault diagnosis using fault indicative features. Appl. Therm. Eng. 2019, 154, 540–547. [Google Scholar] [CrossRef]
  55. Van Every, P.M.; Rodriguez, M.; Jones, C.B.; Mammoli, A.A.; Martínez-Ramón, M. Advanced detection of HVAC faults using unsupervised SVM novelty detection and Gaussian process models. Energy Build. 2017, 149, 216–224. [Google Scholar] [CrossRef]
  56. Han, H.; Cao, Z.; Gu, B.; Ren, N. PCA-SVM-Based Automated Fault Detection and Diagnosis (AFDD) for Vapor-Compression Refrigeration Systems. HVACR Res. 2010, 16, 295–313. [Google Scholar] [CrossRef]
  57. Li, B.; Zhao, Y.-P. Simultaneous fault diagnosis for aircraft engine using multi-label learning. Proc. Inst. Mech. Eng. Part I J. Syst. Control. Eng. 2022, 09596518221085756. [Google Scholar] [CrossRef]
  58. Wu, B.; Cai, W.; Zhang, X. A fault detection model for air handling units based on the machine learning algorithms. In Proceedings of the IECON 2020 The 46th Annual Conference of the IEEE Industrial Electronics Society, Singapore, 18–21 October 2020; pp. 4789–4793. [Google Scholar] [CrossRef]
  59. Tran, D.A.T.; Chen, Y.; Jiang, C. Comparative investigations on reference models for fault detection and diagnosis in centrifugal chiller systems. Energy Build. 2016, 133, 246–256. [Google Scholar] [CrossRef]
  60. Jordan, M. The Kernel Trick. In CS281B: Advanced Topics in Learning & Decision Making; Class lecture; University of California: Berkeley, CA, USA, 2004. [Google Scholar]
  61. Yang, H.; Lee, K.; Choo, Y.; Kim, K. Underwater Acoustic Research Trends with Machine Learning: General Background. J. Ocean Eng. Technol. 2020, 34, 147–154. [Google Scholar] [CrossRef]
  62. Hou, Z.; Lian, Z.; Yao, Y.; Yuan, X. Data mining based sensor fault diagnosis and validation for building air conditioning system. Energy Convers. Manag. 2006, 47, 2479–2490. [Google Scholar] [CrossRef]
  63. Afram, A.; Janabi-Sharifi, F.; Fung, A.S.; Raahemifar, K. Artificial neural network (ANN) based model predictive control (MPC) and optimization of HVAC systems: A state of the art review and case study of a residential HVAC system. Energy Build. 2017, 141, 96–113. [Google Scholar] [CrossRef]
  64. Hornik, K.; Stinchcombe, M.; White, H. Multilayer feedforward networks are universal approximators. Neural Netw. 1989, 2, 359–366. [Google Scholar] [CrossRef]
  65. Taheri, S.; Ahmadi, A.; Mohammadi-Ivatloo, B.; Asadi, S. Fault detection diagnostic for HVAC systems via deep learning algorithms. Energy Build. 2021, 250, 111275. [Google Scholar] [CrossRef]
  66. Tang, F.; Kusiak, A.; Wei, X. Modeling and short-term prediction of HVAC system with a clustering algorithm. Energy Build. 2014, 82, 310–321. [Google Scholar] [CrossRef]
  67. Du, Z.; Fan, B.; Chi, J.; Jin, X. Sensor fault detection and its efficiency analysis in air handling unit using the combined neural networks. Energy Build. 2014, 72, 157–166. [Google Scholar] [CrossRef]
  68. Du, Z.; Fan, B.; Jin, X.; Chi, J. Fault detection and diagnosis for buildings and HVAC systems using combined neural net-works and subtractive clustering analysis. Build. Environ. 2014, 73, 1–11. [Google Scholar] [CrossRef]
  69. Fan, B.; Du, Z.; Jin, X.; Yang, X.; Guo, Y. A hybrid FDD strategy for local system of AHU based on artificial neural network and wavelet analysis. Build. Environ. 2010, 45, 2698–2708. [Google Scholar] [CrossRef]
  70. Guo, Y.; Li, G.; Chen, H.; Hu, Y.; Li, H.; Xing, L.; Hu, W. An enhanced PCA method with Savitzky-Golay method for VRF system sensor fault detection and diagnosis. Energy Build. 2017, 142, 167–178. [Google Scholar] [CrossRef]
  71. Magoulès, F.; Zhao, H.-X.; Elizondo, D. Development of an RDP neural network for building energy consumption fault detection and diagnosis. Energy Build. 2013, 62, 133–138. [Google Scholar] [CrossRef]
  72. Zhu, Y.; Jin, X.; Du, Z. Fault diagnosis for sensors in air handling unit based on neural network pre-processed by wavelet and fractal. Energy Build. 2012, 44, 7–16. [Google Scholar] [CrossRef]
  73. Yang, X.-B.; Jin, X.-Q.; Du, Z.; Zhu, Y.-H. A novel model-based fault detection method for temperature sensor using fractal correlation dimension. Build. Environ. 2011, 46, 970–979. [Google Scholar] [CrossRef]
  74. Fan, C.; Liu, X.; Xue, P.; Wang, J. Statistical characterization of semi-supervised neural networks for fault detection and diagnosis of air handling units. Energy Build. 2021, 234, 110733. [Google Scholar] [CrossRef]
  75. Fan, C.; Liu, Y.; Liu, X.; Sun, Y.; Wang, J. A study on semi-supervised learning in enhancing performance of AHU unseen fault detection with limited labeled data. Sustain. Cities Soc. 2021, 70, 102874. [Google Scholar] [CrossRef]
  76. Shahnazari, H.; Mhaskar, P.; House, J.M.; Salsbury, T.I. Modeling and fault diagnosis design for HVAC systems using recurrent neural networks. Comput. Chem. Eng. 2019, 126, 189–203. [Google Scholar] [CrossRef]
  77. Shahnazari, H.; Mhaskar, P. Distributed fault diagnosis for networked nonlinear uncertain systems. Comput. Chem. Eng. 2018, 115, 22–33. [Google Scholar] [CrossRef]
  78. Shahnazari, H.; Mhaskar, P.; House, J.M.; Salsbury, T.I. Heating, ventilation and air conditioning systems: Fault detection and isolation and safe parking. Comput. Chem. Eng. 2018, 108, 139–151. [Google Scholar] [CrossRef]
  79. Li, G.; Hu, Y. Improved sensor fault detection, diagnosis and estimation for screw chillers using density-based clustering and principal component analysis. Energy Build. 2018, 173, 502–515. [Google Scholar] [CrossRef]
  80. Ester, M.; Kriegel, H.P.; Sander, J.; Xu, X. A Density-Based Algorithm for Discovering Clusters in Large Spatial Databases with Noise. In Proceedings of the The Second International Conference on Knowledge Discovery and Data Mining (KDD-96), Portland, Oregon, 2–4 August 1996. [Google Scholar]
  81. Dey, M.; Rana, S.P.; Dudley, S. Smart building creation in large scale HVAC environments through automated fault detection and diagnosis. Futur. Gener. Comput. Syst. 2018, 108, 950–966. [Google Scholar] [CrossRef]
  82. Gaitani, N.; Lehmann, C.; Santamouris, M.; Mihalakakou, G.; Patargias, P. Using principal component and cluster analysis in the heating evaluation of the school building sector. Appl. Energy 2010, 87, 2079–2086. [Google Scholar] [CrossRef]
  83. Piech, C. K-Means. 2013. Available online: https://stanford.edu/~cpiech/cs221/handouts/kmeans.html (accessed on 29 July 2022).
  84. Luo, X.J.; Fong, K.F.; Sun, Y.J.; Leung, M.K.H. Development of clustering-based sensor fault detection and diagnosis strategy for chilled water system. Energy Build. 2019, 186, 17–36. [Google Scholar] [CrossRef]
  85. Yang, J.; Ning, C.; Deb, C.; Zhang, F.; Cheong, D.; Lee, S.E.; Sekhar, C.; Tham, K.W. k-Shape clustering algorithm for building energy usage patterns analysis and forecasting model accuracy improvement. Energy Build. 2017, 146, 27–37. [Google Scholar] [CrossRef]
  86. Hsu, D. Comparison of integrated clustering methods for accurate and stable prediction of building energy consumption data. Appl. Energy 2015, 160, 153–163. [Google Scholar] [CrossRef] [Green Version]
  87. Lavin, A.; Klabjan, D. Clustering time-series energy data from smart meters. Energy Effic. 2014, 8, 681–689. [Google Scholar] [CrossRef] [Green Version]
  88. Iglesias, F.; Kastner, W. Analysis of Similarity Measures in Times Series Clustering for the Discovery of Building Energy Patterns. Energies 2013, 6, 579–597. [Google Scholar] [CrossRef] [Green Version]
  89. Capozzoli, A.; Piscitelli, M.S.; Gorrino, A.; Ballarini, I.; Corrado, V. Data analytics for occupancy pattern learning to reduce the energy consumption of HVAC systems in office buildings. Sustain. Cities Soc. 2017, 35, 191–208. [Google Scholar] [CrossRef]
  90. D’Oca, S.; Hong, T. A data-mining approach to discover patterns of window opening and closing behavior in offices. Build. Environ. 2014, 82, 726–739. [Google Scholar] [CrossRef] [Green Version]
  91. Jakkula, V.; Cook, D. Outlier Detection in Smart Environment Structured Power Datasets. In Proceedings of the 2010 Sixth International Conference on Intelligent Environments, Kuala Lumpur, Malaysia, 19–21 July 2010; pp. 29–33. [Google Scholar] [CrossRef]
  92. Yuwono, M.; Guo, Y.; Wall, J.; Li, J.; West, S.; Platt, G.; Su, S.W. Unsupervised feature selection using swarm intelligence and consensus clustering for automatic fault detection and diagnosis in Heating Ventilation and Air Conditioning systems. Appl. Soft Comput. 2015, 34, 402–425. [Google Scholar] [CrossRef]
  93. Shao, H.; Marwah, M.; Ramakrishnan, N. A Temporal Motif Mining Approach to Unsupervised Energy Disaggregation: Applications to Residential and Commercial Buildings. Proc. Conf. AAAI Artif Intell 2013, 27, 1327–1333. [Google Scholar] [CrossRef]
  94. Guo, Y.; Chen, H. Fault diagnosis of VRF air-conditioning system based on improved Gaussian mixture model with PCA approach. Int. J. Refrig. 2020, 118, 1–11. [Google Scholar] [CrossRef]
  95. Karami, M.; Wang, L. Fault detection and diagnosis for nonlinear systems: A new adaptive Gaussian mixture modeling approach. Energy Build. 2018, 166, 477–488. [Google Scholar] [CrossRef]
  96. Cheng, Z.; Qi, L.; Cheng, Y.; Wu, Y.; Zhang, H. Interlacing Orchard Canopy Separation and Assessment using UAV images. Remote Sens. 2020, 12, 767. [Google Scholar] [CrossRef] [Green Version]
  97. Li, D.; Zhou, Y.; Hu, G.; Spanos, C.J. Fault detection and diagnosis for building cooling system with a tree-structured learning method. Energy Build. 2016, 127, 540–551. [Google Scholar] [CrossRef]
  98. Jones, C.B. Fault Detection and Diagnostics of an HVAC Sub-System Using Adaptive Resonance Theory Neural Networks; The University of New Mexico: Albuquerque, NM, USA, 2015. [Google Scholar]
  99. Lee, W.-Y.; House, J.M.; Kyong, N.-H. Subsystem level fault diagnosis of a building’s air-handling unit using general regression neural networks. Appl. Energy 2004, 77, 153–170. [Google Scholar] [CrossRef]
  100. Howard, P.; Reddy, T.A.; Runger, G.; Katipamula, S. Automated Data Mining Methods for Identifying Energy Efficiency Opportunities Using Whole-Building Electricity Data. ASHRAE Trans. 2016, 122, 422. [Google Scholar]
  101. Yang, X.-B.; Jin, X.-Q.; Du, Z.-M.; Zhu, Y.-H.; Guo, Y.-B. A hybrid model-based fault detection strategy for air handling unit sensors. Energy Build. 2013, 57, 132–143. [Google Scholar] [CrossRef]
  102. Yoshida, H.; Kumar, S.; Morita, Y. Online fault detection and diagnosis in VAV air handling unit by RARX modeling. Energy Build. 2001, 33, 391–401. [Google Scholar] [CrossRef]
  103. Yoshida, H.; Kumar, S. ARX and AFMM model-based on-line real-time data base diagnosis of sudden fault in AHU of VAV system. Energy Convers. Manag. 1999, 40, 1191–1206. [Google Scholar] [CrossRef]
  104. Kumar, S.; Sinha, S.; Kojima, T.; Yoshida, H. Development of parameter based fault detection and diagnosis technique for energy ecient building management system. Energy Convers. Manag. 2001, 42, 833–854. [Google Scholar] [CrossRef]
  105. Mulumba, T.; Afshari, A.; Yan, K.; Shen, W.; Norford, L.K. Robust model-based fault diagnosis for air handling units. Energy Build. 2015, 86, 698–707. [Google Scholar] [CrossRef]
  106. Schein, J.; Bushby, S.T. A Hierarchical Rule-Based Fault Detection and Diagnostic Method for HVAC Systems. HVACR Res. 2006, 12, 111–125. [Google Scholar] [CrossRef]
  107. Tran, D.A.T.; Chen, Y.; Chau, M.Q.; Ning, B. A robust online fault detection and diagnosis strategy of centrifugal chiller systems for building energy efficiency. Energy Build. 2015, 108, 441–453. [Google Scholar] [CrossRef]
  108. Claridge, D.E. Mingsheng Liu Use of Calibrated HVAC System Models to Optimize System Operation. 1998. Available online: https://asmedigitalcollection.asme.org/solarenergyengineering/article-pdf/120/2/131/5666077/131_1.pdf (accessed on 1 April 2020).
  109. Lin, G.; Claridge, D.E. A temperature-based approach to detect abnormal building energy consumption. Energy Build. 2015, 93, 110–118. [Google Scholar] [CrossRef]
  110. Yang, C.; Shen, W.; Gunay, B.; Shi, Z. Toward machine learning-based prognostics for heating ventilation and air- conditioning systems. ASHRAE 2019, 125, 106–115. [Google Scholar]
  111. Wen, J.; Li, S. ASHRAE RP-1312. ASHRAE 2012. Available online: https://www.techstreet.com/standards/rp-1312-tools-for-evaluating-fault-detection-and-diagnostic-methods-for-air-handling-units?product_id=1833299 (accessed on 13 April 2022).
  112. Granderson, J.; Lin, G.; Singla, R.; Mayhorn, E.; Ehrlich, P.; Vrabie, D.; Frank, S. Commercial Fault Detection and Diagnostics Tools: What They Offer, How They Differ, and What’s Still Needed. Available online: https://doi.org/10.20357/B7V88H (accessed on 18 February 2020).
  113. Hacker, A.; Gorthala, R.; Thompson, A. An Approach to Bringing Automated Fault Detection and Diagnosis (AFDD) Tools for HVAC&R into the Mainstream. 2019. Available online: http://asmedigitalcollection.asme.org/IMECE/proceedings-pdf/IMECE2019/59438/V006T06A050/6513234/v006t06a050-imece2019-11941.pdf (accessed on 25 April 2022).
  114. Bricks Schema. Available online: https://brickschema.org/ (accessed on 6 June 2022).
Figure 1. Tree of research.
Energies 15 05534 g001
Figure 2. Visual Representation of principal component analysis.
Energies 15 05534 g002
Figure 3. One-vs-all SVM classification procedure (simplified from [51]).
Energies 15 05534 g003
Figure 4. SVM Kernel Trick [60].
Energies 15 05534 g004
Figure 5. Multi-Layer Perceptron according to the Universal Approximation Theorem.
Energies 15 05534 g005
Figure 6. Visual representation of DBSCAN.
Energies 15 05534 g006
Figure 7. K-Means Iterations [83]. (a) Original dataset. (b) Random cluster initialization. (cf) Successive iterations of K-means updating cluster centroids.
Energies 15 05534 g007
Figure 8. Gaussian Mixture Models [96].
Energies 15 05534 g008
Publisher’s Note: MDPI stays neutral with regard to jurisdictional claims in published maps and institutional affiliations.

