1. Introduction
Energy systems as a whole are currently undergoing a period of transformation due to environmental challenges, data massification and opportunities offered by new technologies, such as Internet of Things (IoT) and Clouds. Consequently, the energy industries are rapidly evolving, driven by economic, governmental and environmental issues.
In this context, the different energy actors (producers, consumers, distributors, installers, refurbishers, energy performance providers…) are facing similar adaptation issues in relation to these new challenges. However, the specificity of each energy or system studied, especially the differences induced by human behavior, prevent a generalization of the methods to be implemented for such changes.
Energy systems, whether they are a nation wide electric grid or an office building, are often socio-technical complex systems (STCS). The theory of complex systems (CSs) emphasizes aspect of complexity that can be found in energy systems such as multiplicity of space and time scales and heterogeneity of the components. They are called socio-technical because they are subject to the interactive influences of both socio-organizational and technical factors [
1].
They cannot therefore be approached solely through analytical modeling that takes poorly into account socio-technical dysfunctions and non-linear interactions between sub-systems [
2] causing the failure of most classical methods in studying smart energy systems [
3].
This article presents a hybrid approach to model STCS with a systemic part allowing to take into account the complexity of the systems and an operational part historically favored by the energy systems.
This approach allows us to combine the benefits of the two methods. One, operational, consisting of abstracting the components identifiable thanks to the data. The other, systemic, highlighting the subsystems participating in the complexity of a Trusted Third Party for Energy Measurements and Performance (TTPEMP) projects. This approach offers the ability to analyze the energy systems in such a way that their needs can be clearly highlighted and defined such as a governance of their own systems.
In this article, governance of a system means being able to ensure the accuracy, reliability and fairness of the decisions taken by this system. In a complex and transforming environment, governance can be ensured by exploiting properties of CSs such as distributed intelligence, self-organisation and evolution to ensure resilience to internal and external constraints. A suitable socio-technical method endowing the energy actors with such properties is the DevOps (Development and Operations) approach.
This approach is in complete accordance with the properties of STCSs. It guarantees correctness and reliability using iterative design and evolution. It enables scalability and resilience through feedback loops and integration of all relevant actors.
In accordance with the DevOps methods, the case study of a TTPEMP is presented. The design of a Decision Support System (DSS) infrastructure assuring and exploiting state-of-the-art scalable tools for data management and machine learning factory is then described. These tools are:
MicroServices Architectures (MSAs), in accordance with DevOps principles, MSAs break down applications into small (micro) services, each of which embeds its own business logic and is deployed and maintained independently. MSAs facilitate scalability, resilience and monitoring of IT systems (See
Section 5.3). Microservices are the subject of an increasing number of papers over the years, generating interest in industry and research [
4].
Data Lakes: allowing to deal with the variety, velocity, and volume of incoming data. (See
Section 6.2).
Data Marts: allowing to deal with the heterogeneity both of the data and of the algorithmic solutions required by the energy actors (See
Section 6.3).
Machine Learning Factories and
model selection methods: allowing the systems to adapt seamlessly to the variety of needs and methods needed to answer complex issues as well as to the evolution of the state-of-the-art in algorithmic solutions. (See
Section 6.4.4 and
Section 6.5).
In
Section 2, we introduce the notion of CS, STCS and how these theoretical frameworks are applied to the electric grid, and more especially to the problem of the energy uses and energy efficiency in building.
Section 3 then introduces related work in the field of smart energy system modeling, design, architecture and monitoring.
Section 4 shows the new hybrid framework and its application to TTPEMP projects.
Section 5 presents the methods and tools for governance in a decision system.
Section 6 exposes the architecture of this DSSs. Results are then displayed and discussed. We conclude in
Section 8.
2. Context
In this section we demonstrate that energy systems are CSs and more specifically STCSs. We then present the specificities of energy systems making their modeling difficult. This justifies the need for for adapted modeling tools introduced in this section and presented in more details in
Section 4 The case study of the TTPEMP is then presented as an STCS.
2.1. Definition of Complex Systems
According to Johnson et al. Complexity Science can be seen as the study of the phenomena which emerge from a collection of interacting objects [
5].
However, there is no simple definition of a CS on which all scientists agree, as it varies from one domain to another and arriving at a definition of complexity through necessary and sufficient conditions seems difficult if not impossible. Therefore in this section, without giving a final definition, we will present several properties which are associated to complexity in the literature.
First we can briefly differentiate complex and complicated. A complicated system can be subdivided into simpler problems using traditional analytical methods. On the contrary, the simplification of a complex problem is often considered as a source of more complexity because it reduces the intelligibility of the system [
2]. Most of CSs are defined as follows in the literature:
Definition 1. A Complex System is a system with three complexity factors:
Multiplicity of space and time scales;
Heterogeneity of the components;
Emergence properties observed during sudden and unpredictable phase transitions.
From these factors, Ladyma et al. [
6] identify that CSs are associated to the following concepts:
Definition 2. A Complex System is a system with the following properties: Irreductibility, non-linearity, feedback, self-organisation, emergence, distributed control, hierarchical organisation and numerosity.
To better understand the concept of CS, let us introduce its properties.
Irreductible: To give an overview of the subject, we note that the study of systems has led scientists to extract common characteristics of systems described as complex [
6]. They are non-deterministic and sensitive to initial conditions, are often of large scales and reduced scale analysis does not take into account all the aspects of these systems. They are therefore irreducible.
Nonlinearity: CS do not necessarily respond to stimuli in a linear way. However, some CSs such as social networks are based on differential equation or game-theoretic, which are linear.
Feedback: In a flock of birds, the behavior of each member depends on the position and heading of its neighbours. Each bird changes its flight in response to these parameters. The neighboring birds then adapt their behavior to this change, creating a constant feedback loop.
Self-organization and emergence: Emergence is the way in which complex structures and behaviors are born from simple physical laws and simple physical elements. The system may converge to different organizations with the emergence of various pattern and behaviors. In the example of the flock of birds, its size and dynamics depend of the intrinsic specificities of the studied species.
Distributed control: Considering again the flock of birds, the decision of each bird is independent and without a centralized control. The global behavior of the flock is stable despite the individual and erratic behaviors of each member.
Hierarchical organisation: Human-related structure as our society are hierarchical. This statement can be generalized to most of wildlife. However, hierarchical structures are not limited to living examples. The cosmos itself is hierarchic, from superclusters to atoms. CSs are mostly hierarchical organisations, without this organisations being necessarily clear-cut.
Numerosity: A high number of individual elements need to interact in order to generate CSs. Indeed a CS cannot emerge from a group of ten ants or the interaction between three neurons. CS include heterogeneous elements in a very large quantity. There is no clear-cut threshold for this property.
The great variety of CS observed legitimizes the abstraction and an interdisciplinary approach [
7]. This approach seeks to describe the characteristics of a system while accounting for the intertwining and entanglement between the elements. The systemic analysis consists in describing the different parts of the system as subsystems and describing the interaction of these subsystems with other subsystem at different time and space scales. These interactions are often feedback loops.
2.2. Modeling of Complex Systems
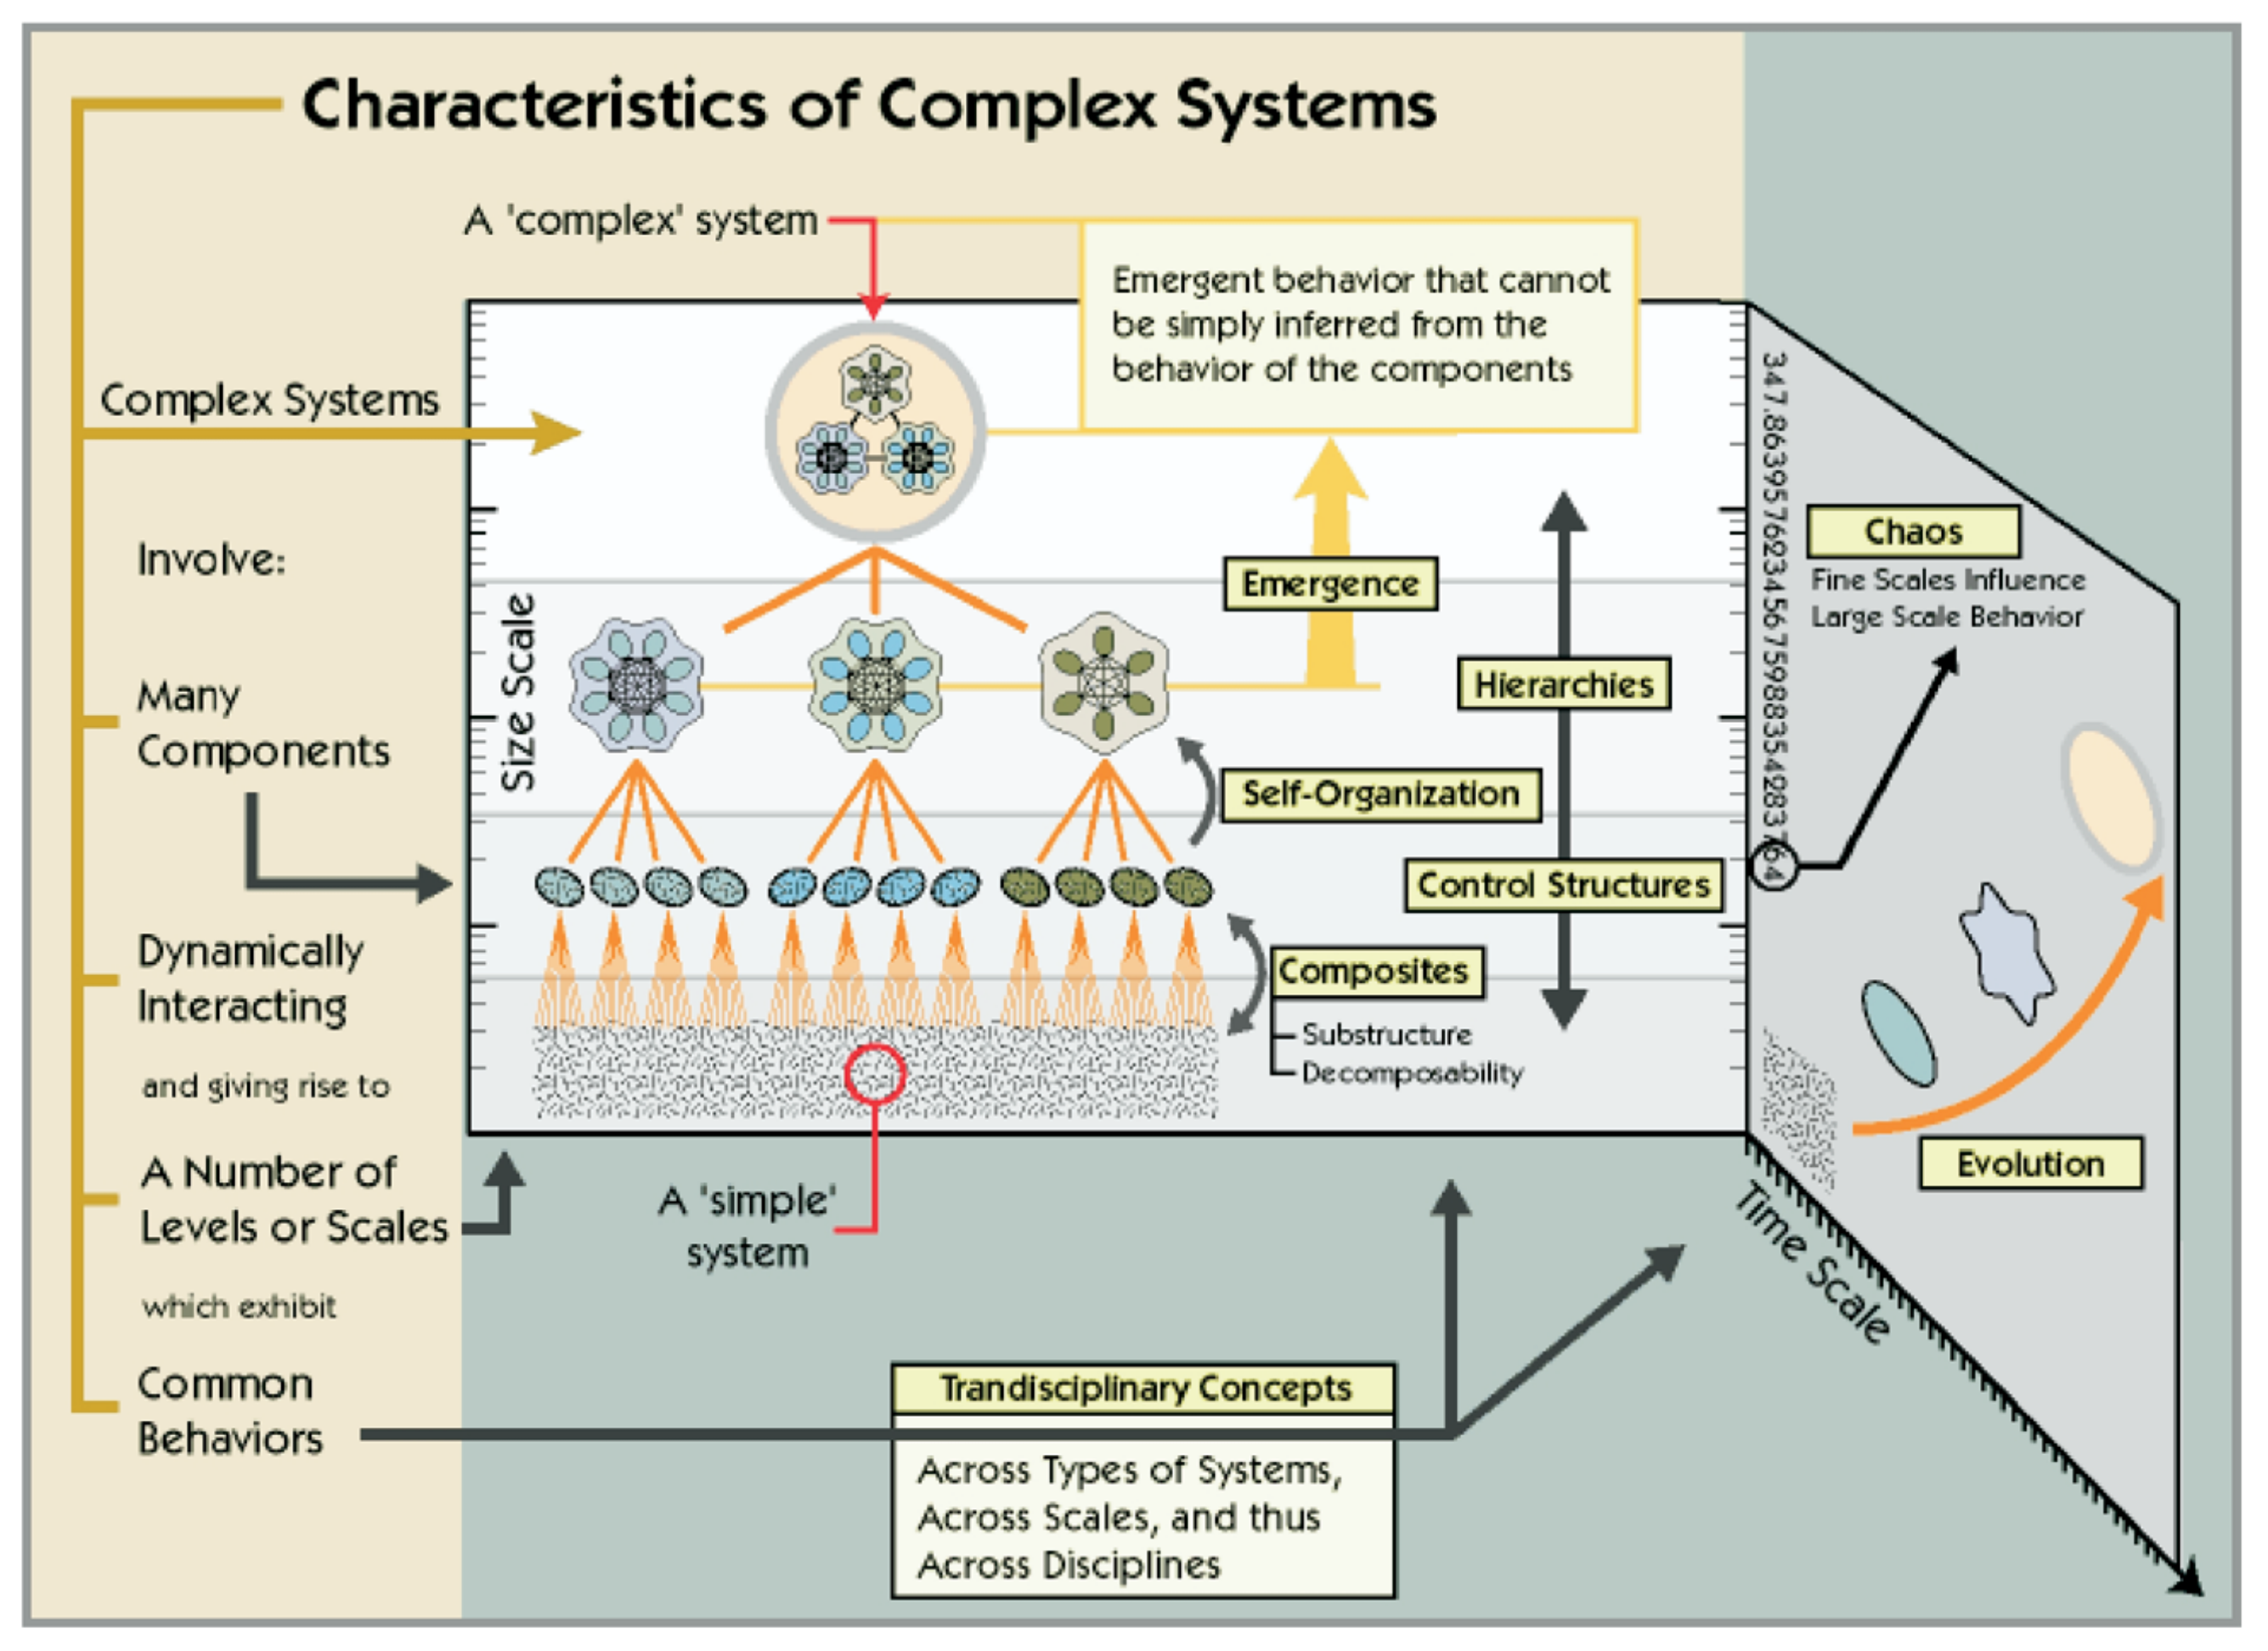
To describe the systemic analysis, we must go into greater detail on the structure in space and the evolution in time of CSs. We will refer to the diagram of the
Figure 1 from Marshall Clemens’ works [
8].
The systemic analysis allows us to highlight the various obstacles the system faces and to provide a modeling methodology. This methodology takes into account the three factors of a CS discussed in
Section 2.1: time and space, heterogeneity and emergence dynamics.
Distributed intelligence: A CS is composed of interacting entities whose feedback, behavior or evolution cannot be determined via a direct (immediate and macroscopic) calculation. It is crucial that the entities have a reactive or cognitive behavior of their own that allows them to adapt to their environment and to learn the impact of their actions on it.
Self-organization and evolution: The interacting entities have specific and common characteristics. The association of entities forms subsystems with their specific and common characteristics. Several subsystems can again form new subsystems until obtaining the system in its entirety. Entities and subsystems are subject to internal constraints due to the entities and external constraints from other entities or from the environment. The constraints and interactions trigger an evolution of the entities’ characteristics in time and space at any scale of the system.
Attractors: It is easy to imagine CSs as a living organism subject to internal and external constraints at different scales, and varying in time and space. It should be noted that these systems are subject to chaos theory, therefore they have stable states (attractors) and transition states in time and space. A CS tends to converge to a stable state if it is in a transition state.
A CS is characterized by the fact that the behavior of the system cannot be deduced from that of its components. Therefore, a CS must be modeled and simulated adequately in order to observe the emergence of behaviors. The simulations allow us to subsequently rectify the modeling.
Let us now define the concept of STCS and give an overview of some of the most important STCS in the energy ecosystem. STCSs were defined by researchers at the Tavistock Institute, England, in the early 1950s as follows:
Definition 3. Complex systems that are subject to the interactive influences of socio-organizational and technical factors are Socio-Technical Complex System.
They include the influences related to human activities and the ones related to their organization. We can mention the organizational structure of the workplace, the formal and informal relationships of command and control, or the number and types of functions of the employees [
9]. The technical tools and systems that support a work-related activity, as well as the processes and techniques used to perform the work, are called technical factors.
2.3. The TTPEMP as Socio-Technical Complex System
In this section we will present our case study, the TTPEMP, we will explain why and how it can benefit from the complex approach.
The TTPEMP acts as a link between large energy producers, typical consumer-producers, and providers of energy efficiency solutions.
Definition 4. The TTPEMP is an external actor that is considered trustworthy and has no interest in the sale of energy resources (or similar) or in the sale of retrofit or installation contracts (or similar). However, the TTPEMP acts as a social and economic actor in the evolution of the system.
This section introduces the specifics and needs of these TTPEMPs. It also introduces the TTPEMP that provided funding for this work, named
Energisme [
10].
Energisme is a company whose field of activity is historically the measurement of energy performance. It describes itself as new actor of the Internet of Energy (IoE) [
10].
TTPEMPs model buildings for several reasons:
Energy management, and energy performance policy;
Personnel management and activities policy;
Security policy;
Partnership with other organizations (subcontracting, etc.).
This article focuses on the first point. Addressing such challenges requires the implementation of an information technology system for modeling and simulating the system, known as a virtual platform. It ensures the collection and monitoring of data as well as the supervision of the simulation of the elements as follows:
The diversity of the types of sensors allows the measurement of all the energy consumptions of the buildings (electricity, water, gas, heating and cooling networks, etc.);
Energy billing data;
Meteorological data and other data whose sources are external to the buildings studied;
Meta-data of the buildings such as their location, the buildings materials, the plan of the buildings;
Buildings’ usage such as their usage category, peak and off-peak times or frequency, metadata provided by personnel management or Customer Relationship Management software;
Operations and maintenance that have been performed on the buildings;
Relationships maintained by the buildings installations. For example the relationship between the consumption of the air conditioning system and the sensors of room temperature, external temperature and human frequentation of the building.
The study of the energy performance of the buildings opens the possibility of extracting the common characteristics of groups of buildings. This notion of groups of buildings will be used for:
The study of building stocks over time and space;
The study of the similarities between buildings grouped by the same geographical location or by the same typologies of usage or energy consumption;
The establishment of a profile map allowing the extrapolation of new buildings without establishing a systemic modeling of these buildings. For example, it is possible for an entity to be managing only a part of a building, such as a story. In this case, it is necessary to estimate the missing parts using a similar known system to be able to estimate the evolution of the consumption and production of the whole building.
All these data describe the material reality of a building at a “human” scale. The TTPEMP uses these data to put intelligence into the studied system, abstracting level by level the different components of its environment to form the systemic modeling of the problem.
The TTPEMP has to face the complexity of developing a virtual platform for intelligent energy management supervision. The platform
e2-Diagnoser introduced by Ploennigs et al. [
11] is a good example of a possible architecture but does not sufficiently dive in the needs of the new IoE actor that is TTPEMP. The virtual platform must highlight the complex and socio-technical aspects of the studied system, taking into consideration the socio-technical factors to answer the issues related to the maintainability and scalability of the platform.
They must also take into account the TTPEMP actors who will maintain the information system. These are the developers, operators and managers who are in charge of development and production. In the context of our complex approach, it seems relevant to consider the interaction between these people and the supervision platform.
By broadening the context, it becomes clear that the supervision system produced for intelligent energy management is itself an STCS composed of the platform and the people working to maintain it. In this context, the solutions that would be applied to guarantee the robustness and stability of the supervision system should integrate the hazards resulting from human factors. These problems can be partly solved thanks to a theoretical approach and an adapted design presented in the
Section 5. In the next section, we presents related works on the modeling and monitoring of building and smart energy systems and on microservices systems.
3. Related Work
3.1. Modeling of Building
Since our problem is related to building energy efficiency and energy uses, let us briefly describe this field. For the rest of this subsection, we rely on surveys such as the recent one by Belussi et al. [
12].
We define as buildings any structure intended to provide shelter or insulation. Yoshino et al. identify six socio-technical factors that influence energy consumption in buildings [
13].
Definition 5. Factors influencing energy consumption in buildings are climate, building envelope and other physical characteristics, equipment, indoor environmental conditions, operations and maintenance, and user behavior.
User behaviors make the building an STCS. The way in which the inhabitants of a building respond to technology in the context of energy efficiency is particularly difficult to model and remains a scientific challenge. However certain characteristics of building users can allow us to better predict consumption. For example, household income has been determined to be correlated to energy use [
14].
The study of a building presents limits when generalizing to several buildings. More conventional mechanistic or heuristic approaches quickly reach their limits when generalizing or extending to a larger scale. More statistical approaches, such as Machine Learning (ML) techniques, are better suited to reveal typical behaviors on large sets of buildings. Either the models are in White Box or Black Box. A White Box Model’s inner logic is transparent. A Black Box’s inner logic is not [
15].
White-box modeling approaches use a detailed mathematical description of the studied system. These models use physics and mechanics’ equations to simulate building components to predict its behaviors such as energy consumption and indoor comfort. However, these models require a very detailed knowledge of the building which is very often not available. It also requires a lot of expert works and long computing time.
Black box models, on the other hand, are simple to build and demand less computation. They are therefore very relevant to issues regarding a large park of buildings. However, such models often require long training period and a large forecasting range for the model to encompass all the possible situations. The development of IoT makes this condition less and less constraining. In our case study, this is made possible by the TTPEMP [
15].
However, in many situations, we wish to extract understandable knowledge from our model rather that just predictions. Hence the need for what is called Gray Box models [
15]. Gray Box models are hybrid models. They use simplified mathematical description combined with data-driven description to describe a system. The mathematical model is enriched by the inference of the data into statistics and parameters. This way reduces the complexity of a model and reduces the computing time.
In order to model a building, it is necessary to build a Gray Box model. This modeling is built in order to bring answers or knowledge within the goals of the TTPEMP.
3.2. Modeling of Smart Energy Systems
We will now present some energy systems that are transformed by or born from the convergence of global environmental challenges, data massification, and innovation in energy and information technologies. Here, the notion of hierarchical organisation of CSs presented in
Section 2.1 is important. Indeed, these systems are of different scales and are in interaction with each other, some entirely encompassing others.
In order to determine the most relevant approach to model smart energy systems, we found in the currently published literature the following concepts:
The Smart Grid (SG) [
3]: an intelligent, robust and flexible energy grid which includes communication between each element of the grid;
The prediction and monitoring grid [
11]: an intelligent grid with tools to predict, forecast and control the elements of the grid to bring flexibility and resilience;
The Internet of Energy (IoE) [
16]: seen as a generalization of an SG, the IoE considers the energy management as a network packet management, similar to the internet process.
Bottom-up Building Stock Models [
17]: since buildings produce at least 10% of the total CO
2 emission, these models focus on how to increase efficiency of building and to keep flexibility in the network. This concepts are enhanced as Smart Buildings Models. They include the behavior of consumers and local management tools to manage the whole system [
18];
Multi-agent Based Energy Management Systems [
19]: as did the previous model, they focus on the bottom-up approach. It models either a building with inhabitants, many buildings as a Smart City or the whole SG. These models not only include the energy system but also many others systems as the use of electric vehicle, the health management, etc. These models are different from IoE since they also can manage future strategies of management, sizing of renewable energy or economic simulation. These systems are similar to a digital twin of the energy grid.
3.3. Monitoring of Smart Energy Systems
The monitoring of SG and microgrid can be a source of inspiration for our case study. However, the constrains in smart grids are not exactly the same as in the TTPEMP. Indeed the TTPEMP does not act directly onto the systems it studies and therefore there is no real time exchange with the building or the devices monitored, as opposed to a real-time management system.
Most monitoring systems include Internet of Things (IoT) and an analysis platform. Here are the main subjects of these subsystems:
Building energy management systems (BEMSs) are used to monitor and control a building’s energy requirements. They can lead to a net energy building also known as zero-energy building through the management of devices, local production and batteries [
20].
Microgrids are Demand-Response systems: a combination of sensors monitoring with forecasting and peer-to-peer exchange are used in real time to manage the production and consumption. Blockchain can be relevant in this situation [
21]. The goal of these system is to manage the demand in energy according to the production. They can add a dashboard where the customer may change their needs or behaviors and can be extended to multiple microgrids to enhance the flexibility of the grid. The tools used for the monitoring of microgrids are often cloud based tools used for IoT. As the open source data visualization software Grafana [
22,
23], or the cloud-based IoT analytics software
Thingspeak [
24]. These microgrids can be isolated from the grid such as NRLab [
25] or isolated smart houses such as Al Summarmad’s model [
24], or connected to the network [
23]. Microgrids are based on Wireless Sensor Networks [
26] which can be monitored using Binary Logistic Regression.
Some models act as digital twins of real systems. Public transport such as trains or a fleet of electric vehicles need to be monitored according to customers and the Demand-Response system. These systems are huge consumers but include various strategies to manage and smooth their impact to the grid. For example, Crotti et al. [
27] present a monitoring system with braking systems, reversible substations and on-board storage systems to limit the impact of a railway system. Khan and Wang propose a multi-agent simulation, as a digital double, to monitor and schedule a microgrid with electric vehicles aggregators [
28];
A SG Architecture Model (SGAM) is a conceptual framework for SG design and deployment. It was proposed by the European Committee for Electro-technical Standardization and the European Telecommunications Standards Institute to manage and pilot smart energy systems. They include the Demand-Response system and can simulate large scale energy networks such as a whole island in the H2020 MAESHA project [
29] or the InteGrid project [
30]. We refer to the following article for an in-depth review of the existing SGAMs [
31].
Our system refers to the BEMs. As services, our system aims to propose various strategies to enhance the use of energy in a building according to its specificity such as building renovation, devices organization, human-centered management, integration of artificial intelligence for Demand-Response, etc. Our model must include a feedback system to understand how a strategy impacts a building and how the strategy could impact another building as a prediction.
3.4. Microservices Architecture
Monitoring systems often deliver services to the customers. As a software, a monitoring system will guarantee a better management of the energy using incentives to reduce the cost of consumption or to sell the production at the best price. This kind of software uses microservices. A microservice is defined as follows:
The architectural style of microservices is an approach to developing a single application as a software suite integrating multiple services. These services are integrated around enterprise capabilities and can be deployed independently.
The basic concept of the microservice is an application which does only one thing but that does it in an optimal way. It is based on the concept of service oriented architecture (SOA) that views systems as loosely coupled components. It is easily replaceable to provide scalability to the application. It is deployed independently. Its development is independent. Although they are developed and deployable independently, each microservice does not have to exist alone. There are many microservices in such an architecture. For the solution or application to work, the microservices need to communicate and interact with each other.
The recent systematic mapping study by Waseem et al. [
32] provides an overview of the architecture in a DevOps context. The main challenge that remains unsolved is the need of a self-adaptive architecture. This challenge is addressed in this paper.
4. Hybrid Modeling Approach
In this section we present three different approaches for the modeling of intelligent energy systems. The analytical approach focuses on the elements that make up the system but faces issues regarding biases arising from the complexity of this system. The systemic approach consists in studying the system in a bottom-up way with appropriate theoretical tools. In our specific context, each actor pursues his own goal. The system must be seen as a list of associated projects and actors. The systemic approach identifies three generic subsystems from a regulated and identifiable active phenomenon: operating, information and decision subsystems.
We propose a hybrid approach with a systemic part allowing to account for the complexity of the system and an analytical part to process the data. This combines the benefits of the two methods: one operational, consisting in abstracting the components identifiable thanks to the data, the other systemic, arranged in the subsystems participating in the complexity of the TTPEMP projects.
4.1. Analytical Approach
The analytical approach is also referred to as data-driven in the literature [
33]. This approach focuses on functions and seeks to identify the most influential parameters. Thus, the input data of the system is seen as a source of values. It is based on a data processing pipeline that collects, cleans, formats and automatically or semi-automatically extracts significant characteristics. The latter are then exploited thanks to data mining techniques, ML methods, knowledge extractions and discovery methods. The intelligence obtained by this process must be associated to an adequate representation and visualization system to give meaning to the studied system.
The analytical approach is subject to biases that prevent us from considering it as the sole approach for the modeling of an STCS [
34,
35]:
It is very effective when the interactions are linear but it is less suitable for the study of systems that reach a certain level of complexity, uncertainty or emergent logic;
The causes of dysfunction are often wrongly attributed to human factors rather than the more diffuse influences of socio-technical factors;
It only favors the use of knowledge already available and thus limits the search for alternative solutions.
Before presenting the hybrid approach, let us examine the contributions of a systemic approach.
4.2. Systemic Approach
The systemic theory provides tools for modeling any CS. Indeed, contrary to the previous approach, each actor pursues its own goal. Therefore, the system cannot be summarized with a single purpose. It must be seen as a list of subsystems and associated actors.
For a CS, subsystems must be identified and articulated.ach subsystem is seen as a functional level of the system, i.e., a stable intermediate system that we call a project. Each of these projects is represented in a relatively autonomous way by its network and can be increasingly complex (via modeling). By iteration between projects and their representation, we seek to compose or aggregate these levels by taking into account possible feedback.
Based on this approach, the Operation-Information-Decision (OID) method [
2] establishes a very general representation of a CS.
Definition 6. The OID methods is composed of three generic subsystems as follows:
An operating subsystem which is in charge of the possible actions of the system;
A information/memorisation subsystem producing intelligence and knowledge. This subsystem is requested by the operating system;
A subsystem of autonomous decision which processes only information to exert a form of cognition for decision purposes. This subsystem, combined with the information system, builds a strategy for the operating system. Since the operating system validates the action, the process restarts for an upcoming action.
The decision system can be partitioned more finely to highlight its ability to coordinate the many decisions about actions, develop and evaluate new strategies, implement the chosen strategy through the operating system. When the subsystems of a CS are identified, we can articulate projects and actions in networks with possible levels as a graph, multi-graph or more generally a lattice. OID modeling is thus adapted to account for the complexity and feedback loops of the studied system. However, determining the subsystems is a complicated task that requires expertise in the CS and a modeling and simulation system to continuously improve the system in order to get closer to the reality of the CS.
In this paper, we propose a hybrid approach, which is easier to implement than an OID model and allows us to address the limitations of the data-driven approach.
4.3. Hybrid Approach
While maintaining an analytical approach, we propose to also adopt a systemic approach and to use the structure highlighted by the OID model to organize the application of data driven methods. In other words, our modeling allows us to find a compromise between two approaches, one highlighting the subsystems involved in the complexity of the considered projects, the other, more operational, consisting in abstracting the identifiable components using the data. The aim of the model is to be able to take into account emergent phenomena, interactions and non-productive modifications brought about in particular by human behavior.
In the context of building energy efficiency, the TTPEMP faces many constraints and objectives that coexist and cannot all be satisfied (competing multi-objectives). The model we build must therefore allow to sort and prioritize them to build a supervision policy with measurable effects.
Modeling these influencing factors and, more generally, the buildings supervised by the system, requires the exploitation of the data made available by the actors. Moreover, to identify leverage points, i.e., the places where the energy actor can intervene on the system, it is also necessary to rely on the data.
Our model is itself structured as an STCS, taking into account both the objectives of the model, but also the actors having to use the model. This hybrid analysis is applied to the energy performance of buildings, giving the Multi-Institution Building Energy System (MIBES) model.
4.4. Hybrid Approach Applied to TTPEMP
The first step consists of building an abstract model thanks to the systemic approach to make the proof of concept and to integrate all the actors. Then, the data-driven approach enables the analysis of the existing data structures and thus the validation and completion of the designed model. Each of the elements are structured in the form of a graph. It contains the relations between the subsystems or the relation to a data source operated by an actor. These two approaches enrich one another. This process of mutual enrichment constitutes a feedback loop allowing the models to converge towards a common and stable representation.
The systemic approach allows the modeling of new projects for the TTPEMP. It ensures the management of the new actors and the identification of the associated issues. It allows the design of the MIBES model and its evolution to take into account these new identified purposes. The operational approach updates the model based on new data. It highlights the data management needs and proposes a common repository for the use of the databases. Thus, it reveals the need for specialized databases and the numerous transformation pipelines required [
36].
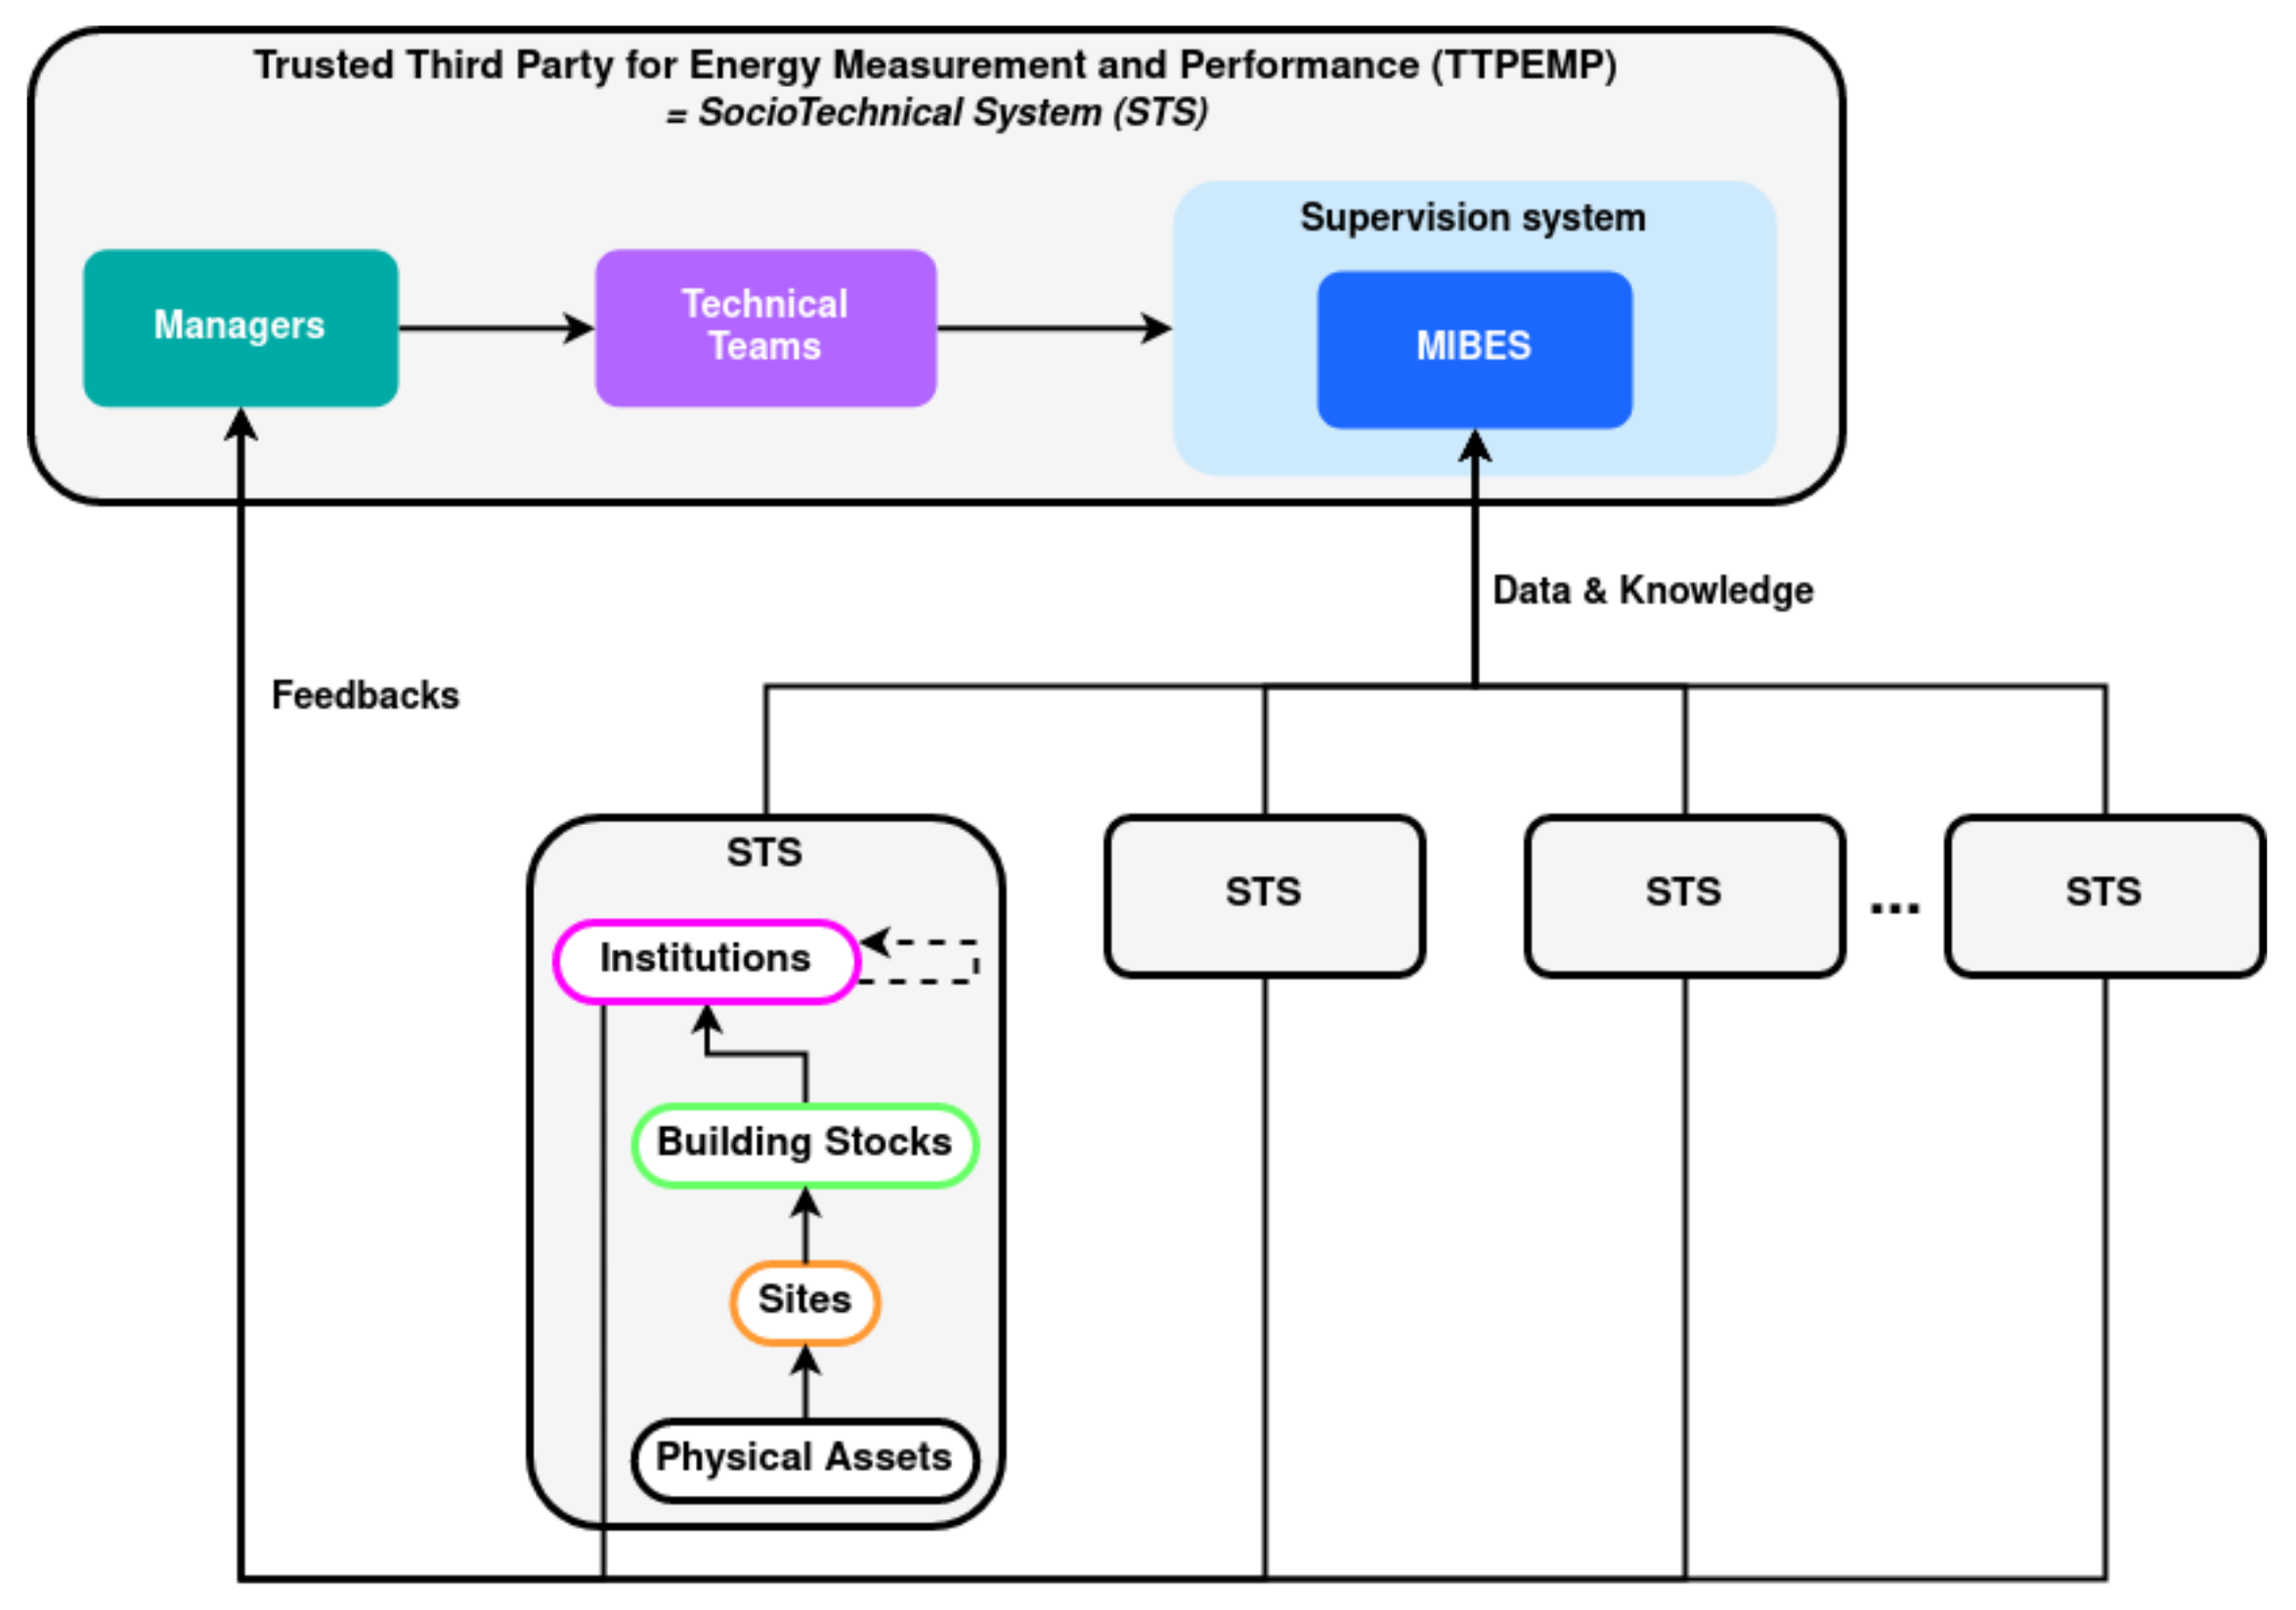
Let us start by explicitly defining the MIBES. The MIBES resulted from the modeling of the set of actors interacting with the TCMPE and their relationship to each other. Its first draft was presented in 2018 [
37].
Definition 7. The MIBES is modeled as a bidirectional acyclic graph M with hierarchical levels. We define the MIBES as follows:where V is the set of vertices composed of the different actors modeled and E is the set of edges describing the links and communications between the actors of V. Definition 8. The MIBES separates the elements of V into a set H of four hierarchical levels grouping actors according to four criteria:
By the same physical object, also referred to as an physical asset;
By the same spatial delimitation of a physical location, which we call a site;
By the same group of sites, also called building stock;
By the same owning institution.
Definition 9. We define S as the set listing the different possible types of actors in V. For each level of H, a corresponding element type is defined in S. An additional type of elements is added to manage the data feeding the different levels of H, called data source. Therefore, the set S is composed of the following five types: (1) data sources, (2) assets, (3) sites, (4) building stocks and (5) institutions.
We call the set of vertices in V of type . We thus specify that:
For each node , data are emitted but must be stored and made available to other actors in accordance with the data management policy desired by the concerned institution;
For each node , an aggregate describing the state of the element is made available to v’s parents or neighbors.
The modeling of the data model (in GraphQL) allows the mutual validation of the hybrid approach. The methods of DevOps help to set up iterative design and evolution. They also meet a strong need for scalability and contribute to the resilience of the platform. They will be presented in the
Section 5.2. The GraphQL model highlights the APIs required to meet the needs of data insertions or transformations and exchanges between agents or links with the outside world. Most of the time, a microservice will respond to an API.
The organization of the concurrent execution of these numerous services raises the question of the orchestration of services which arises for the distributed computing. It is taken into account by a MicroServices Architecture (MSA) for implementation. MSAs reduce the interdependence of services and thus facilitate the integration of new IT tools (new database technologies, infrastructure changes, etc.). The development of these new implementations then allows to meet three main categories of functionality:
The ones expressed by the TTPEMP (see
Section 2.3) which include, notably, business algorithms for the prediction of energy behaviors and IT tools for monitoring, alerting and personalization;
The ones raised by the modeling, to respond to the APIs and that are transcribed in microservices;
The ones born of the need for coherence and supervision of the IT platform itself, especially orchestration.
The hybrid modeling approach presented in this section highlighted an iterative method for the evolution of the supervisory system when facing new elements, making the platform resilient.
In addition, this approach allowed us to identify the methods and techniques to implement the development of the supervision system. They will be discussed in the following section.
5. Methods and Tool for the Governance of a Supervision System
This section presents the methods and tools needed for the governance of a supervision system. The need for these methods and tools was made apparent by the systemic and analytical modeling of an STCS of energy management.
5.1. Governance of Semi-Automated Decision Support Systems
The idea of governance is closely related to the concept of monitoring but also to the concept of automation. Crucial elements of our society are being automatized in areas such as health, justice and banking. Just as energy consumption management, these elements cannot be automatized without the need for an efficient and reliable governance so that the trust in these key institutions is maintained.
The first thing to note is that automation involving important decision making is rarely white-boxed. Many term are employed to fill this gray area such as semi-automation, quasi-automation, algorithm in the loop or human in the loop decision making. These terms will be used and defined below.
The system we are studying can be described as a decision support system (DSS). A DSS is an information system used by businesses or organizations to help them to make fast decisions in changing and complex environments. The output of this tool serves the management, operations and planning levels.
Algorithm in the loop decision making refers to decision making in which both algorithm and human are involved in the decision loop. A DSS involves both human and algorithm in the decision loop. Such system must satisfy the three following desiderata [
38]:
Desideratum 1 (Accuracy): Accuracy measures the quality and precision of the prediction.
Desideratum 2 (Reliability): The quality of the predictions should be well known and the final decisions should be made in accordance with the degree of certainty in the results provided by the algorithms and by humans.
Desideratum 3 (Fairness): The use of algorithm should be unbiased regarding race, gender, and other sensitive attributes.
Concepts of algorithm-in-the-loop or of human-in-the-loop remain a little vague. To remedy this, Wagner [
39] presents the concept of
quasi-automation, describing the inclusion of humans as a basic rubber-stamping mechanism in an otherwise completely automated decision-making system as recommended by the EU GDPR (Article 22 of the EU GDPR includes a prohibition on fully automated individual decision-making, including profiling that has a legal or similarly significant effect).
Wagner suggests several criteria to evaluate the level of automation in a system such as: the time spent by humans operators on the decision, the qualification of the human operator, the degree of liability of the human operator in case of failure. In the case of TTPEMP the consequences of a recommendation can be quite impactful as it can significantly affect the lives of the inhabitants of the building. For example the TTPEMP can have missions regarding the identification of households in energy poverty eligible to state subsides.
In this context, abiding to the recommendation described above is crucial. To do so, it is important to be able to monitor the system and to guaranty the accuracy and reliability of this STCS by applying DevOps methods. DevOps can also allow for the detection and correction of unwanted biases.
5.2. DevOps Method
The integration of feedback and the preservation of system consistency are addressed using DevOps methods. Let us begin by giving the definition of DevOps proposed by Leite et al. [
40], who themselves were inspired by the definition of Dyck et al. [
41]:
Definition 10 (Leite et al. [
40]).
DevOps is a collaborative and multidisciplinary effort within an organization to automate continuous delivery of new software versions, while guaranteeing their correctness and reliability.
We can understand that in this definition correctness can correspond both to the accuracy and to the fairness advocated by Green et al. As stated by Leite et al. [
40], the challenges of DevOps can be discussed from three perspectives, one for each of the different type of actors that are engineers, managers and researchers. They have different goals in adopting these methods. Engineers find that DevOps makes it easier to develop and maintain their computing chain. DevOps reduces the cost of a release and limits the number of manual interventions required on each environment. The managers hope to improve quality and optimize costs. Researchers are working to formalize the implementation of DevOps practices.
The technical aspect of DevOps consists of reducing the production costs of the complete software chain by adopting short development cycles to achieve seamlessness between development and operation. DevOps practices favor short feedback cycles and focus on small features, most often based on the adoption of microservices. In practice, Agile or Lean methods are used.
We will analyze how DevOps techniques can be applied to the organization of an STCS producing an information system. We will then study the case of TTPEMP as an STCS.
First of all, let us recall Conway’s law, which highlights the similarity between the structure of the information system designed and that of the organization that produces it.
Definition 11 (Burton et al. [
42]).
Organizations that design systems (in the broad sense used here) are constrained to producing designs which are copies of the communication structures of these organizations. As previously stated, the MIBES is made up of different organizations, heritages, sites, and assets. These organizations are STCS using the platform provided by TTPEMP. They contribute to the platform directly by sharing their data and indirectly by their feedback. The TTPEMP responds to the problem of supervision of this collected data by an information system modeled by the MIBES. The TTPEMP is therefore itself an STCS composed of this information system and of the teams in charge of its development. Conway’s law holds true, the TTPEMP is an STCS that replicates its organization to supervise the STCSs in its care. The system has a double feedback loop as shown in the
Figure 2.
This is why the TTPEMP organization must allow, in accordance with the DevOps approach:
The integration of feedback from customers and partners;
The adaptability of the information system, in particular to the rapid evolution of technologies;
The addition of new actors such as a new energy producer;
The addition of new functions such as the integration of new data, for example, a new type of energy.
These properties contribute to the resilience of the system, i.e. the ability to maintain a state of stability in the face of disturbances. It is also necessary to think about this organization over time. It will be necessary for it to adapt itself permanently. Indeed, it is not possible to foresee all the problems that will emerge. Nor is it possible to rely on a fixed organization.
The MIBES was designed to address the organizational issues of an STCS. The TTPEMP is part of this STCS and must evolve with it. Therefore, it seems promising to use DevOps techniques applied during the design of MIBES to keep the system flexible and resilient.
5.3. Distributed and Microservices Architecture
DevOps techniques are associated with a set of practices such as automation, containerization and microservices architectures (MSA) [
43].
Definition 12. The term MSA refers to a style of IT architecture that advocates breaking down applications into small (micro) services (MS), each of which embeds its own business logic and is deployed and maintained independently.
MSAs address the problem of competing and isolated deployments of multiple components using various technologies. This architecture also facilitates system control because the monitoring software are also defined as MS.
The development of cloud technologies and the concept of infrastructure as a service, or iaas, now allows applications to abstract themselves from the hardware layer.
Containerization consists of isolating applications in lightweight, independent and disposable operating systems. A container is an intermodal transport unit allowing the perception of an isolated environment by the applications running within it.
The iaas coupled with containerization technologies and the increase in computing capacity defines this new architectural style called MSA.
Microservices architectures are opposed to monolithic architectures in the way they are designed, deployed, executed and scaled. Microservices architectures are the result of feedback from the IT industry on Service-Oriented Architecture and, as such, they inherit many aspects of Service-Oriented Architecture.
The large number of MSs that an MSA has to deploy raises the issues of distributed computing, such as the need to orchestrate these MSs to achieve the desired behavior.
The global architecture integrates all the previous considerations. The infrastructure applied to the case study that is the TTPEMP can be seen in
Figure 3. The architecture is organized into six parts:
The management of data sources;
The databases for the shared objects;
An aggregator model of the data relative to the shared objects (in this case using the structure of the MIBES);
A set of MSs, for the implementation of the business logic consisting of:
- –
implementing statistical algorithms of automatic learning, for example for the treatment of time series;
- –
implementing business logic that are specific to the system, for example algorithms for energy performance;
MSs for network management and monitoring;
MSs for user interfaces.
The data sources feed the databases directly, possibly via MSs, even if it is still possible to use the common data model to perform these insertions. This possibility is represented in
Figure 3 by a dotted arrow.
5.3.1. Continuous Integration, Continuous Delivery, and Continuous Deployment
DevOps is strongly associated to Continuous Integration, delivery and deployment [
44]. We refer to the works of Shahin et al. [
45] for a complete review.
Continuous integration (CI) is the practice of integrating code changes of a project frequently from multiple developers. This practice is well established in the software development industry. CI allows software companies to increase the frequency of the release cycle, the quality of software, and the productivity of their teams. This practice includes automated software building and testing. Automated tools are used to build then assert the new code’s correctness before integration.
Continuous DElivery (CDE) Ensures that an application is ready to go into production environment after passing automated testing and quality control. CDE automatically delivers software into a production environment using IC and deployment automation. This practice offers reduced deployment risk, lower costs and faster user feedback.
Continuous Deployment (CD) is the automatic release of approved changes from a developer to production, where they are usable by customers. It addresses the problem of overloading operations teams with manual processes that slow down application delivery. It builds on the benefits of continuous delivery by automating the next step in the pipeline.
5.3.2. Continuous Practices in a MSA
Because each microservice can have different software dependences, the build/release machines need to be able to support each of them.
This support must be possible while keeping the build and release time and the infrastructure cost low. In order to do this, one must also be able to parallelize builds. In order to answer these issues the following options have proven to be effective [
46]:
For the handling of microsevices dependencies, the answer is to use custom images for build and release agents.
In order to keep build and release time low, describing the infrastructure as code can be performed to handle scaling.
To keep infrastructure cost low, one must introduce orchestration to manage resources.
Finally, to parallelize builds the answer is containerisation of build/release agents.
Technical choices on the CI/CD pipeline are presented in
Section 7.1.
5.4. Monitoring Platform
With the objective of continuous improvement of the monitoring platform, we seek to measure the performance of the deployed MSs. This allows us to parameterize the platform as finely as possible to the needs and to define the conditions for scalability. For example, when prototyping a business MS, a single instance of it will be deployed first in order to demonstrate the feasibility of the implemented functionality. However, when deploying on production environments, several instances of the same MS are launched in parallel. Performance monitoring allows to know how many instances are needed and what to do if the number of requests increases or decreases.
Some system performance metrics are presented in the form of dashboards accessible via a graphical interface by a visualization system. The study of these performances thus makes it possible to quantify the load of each microservice, expressed in an abstract way during the design.
For example, in the TTPEMP system, all users managing public pools can run an algorithm to optimize the water consumption of their pool. This does not account for the load represented by such a request because it depends on the number of users involved. Measuring the number of requests links the desired functionality to the settings that the operators will have to choose in order to respond to it. Once the functionality has been delivered and stabilized, the operators have enough measurements to define management rules allowing the automatic scaling of the microservice and to identify the critical points of the system.
We have developed an architecture providing a generic application base allowing the study of energy systems. In the following section, we exploit this architecture to design a DSS for energy performance.
6. Decision Support System
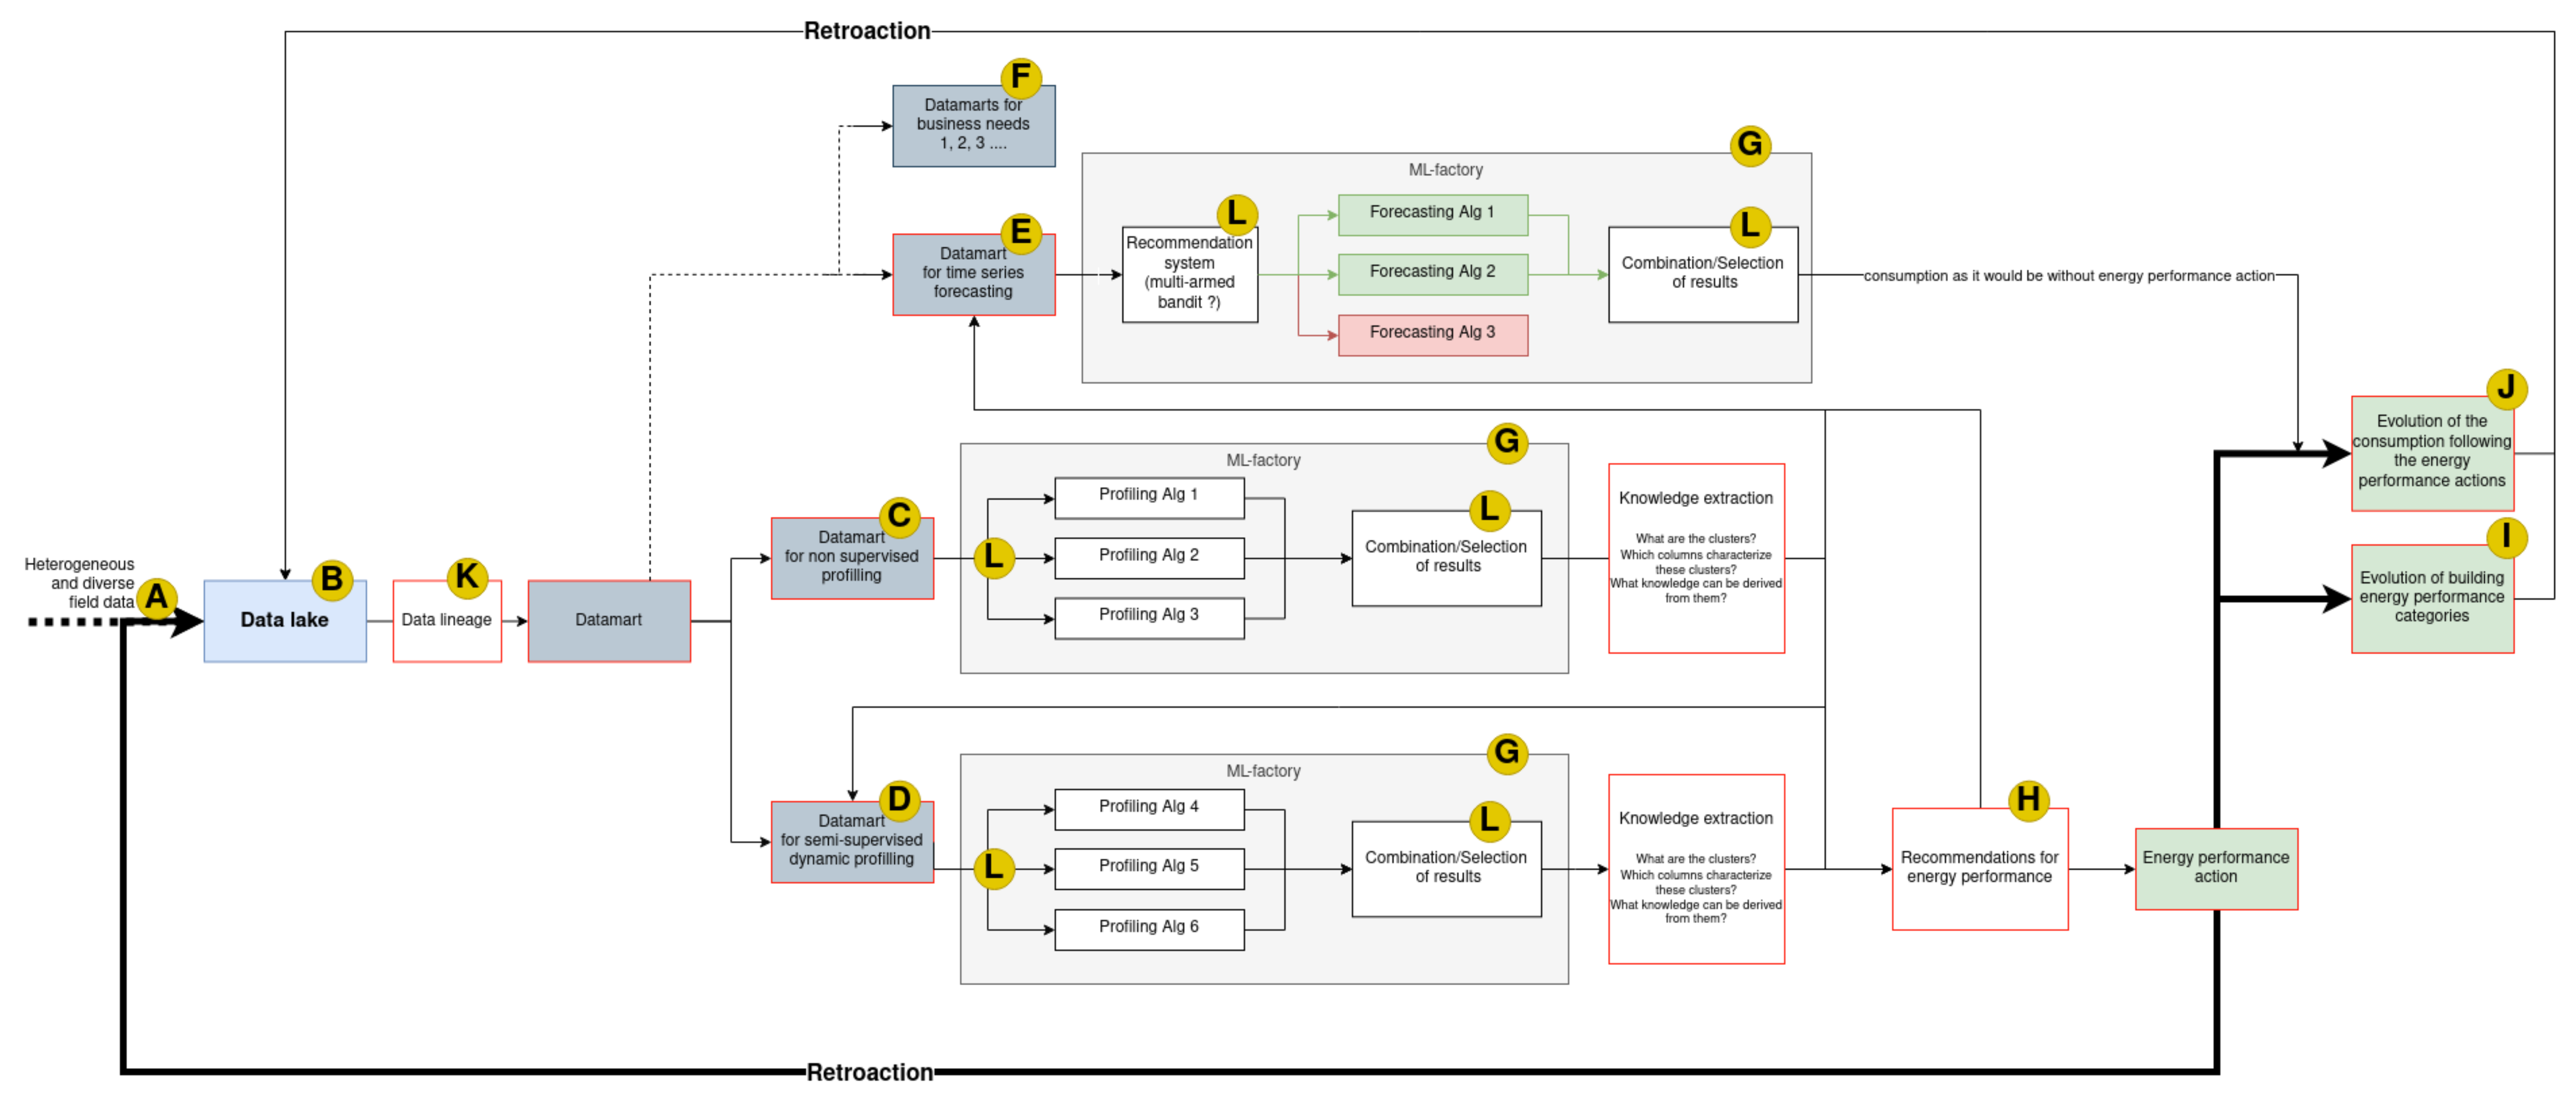
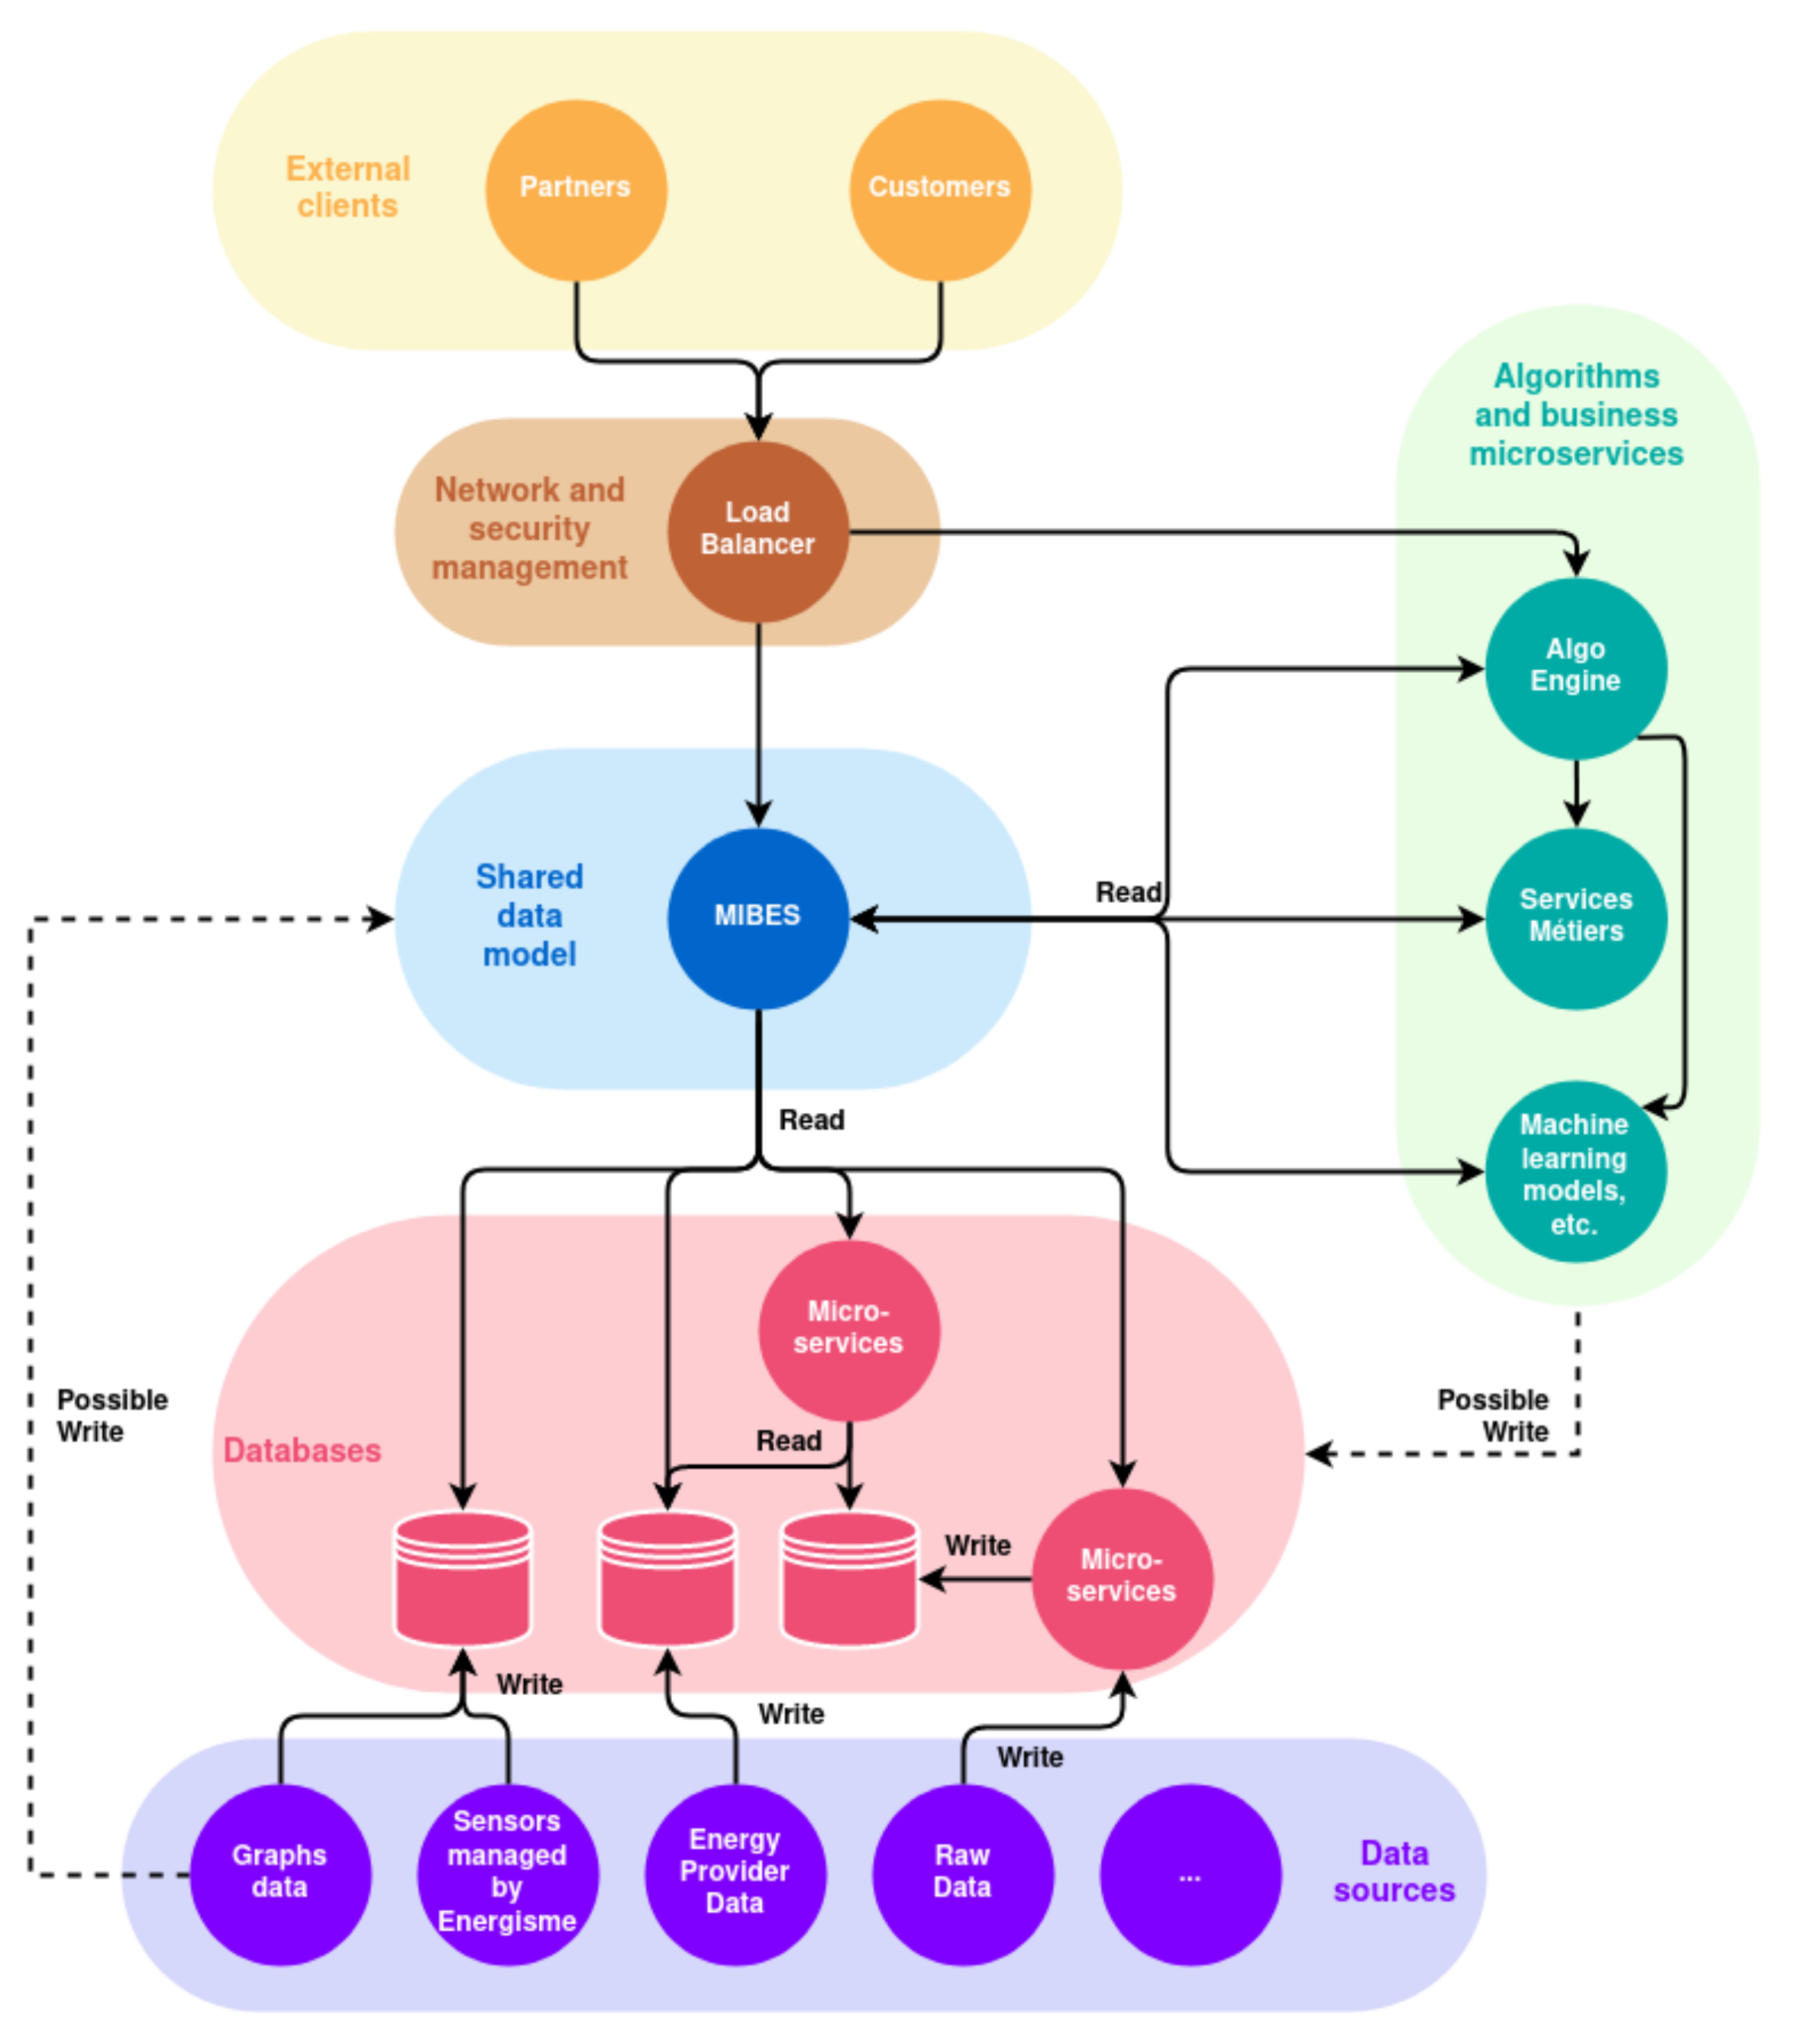
Energy performance of building requires DSSs because of the complexity of the energy systems, the overwhelming amount of information, and the plurality of solutions. Indeed, the energy performance issues require to be able to apply different clustering, classification and prediction methods on buildings, which requires the training and inference of several models. We will address them in the management of data using the data lake and the data mart, in the choice and training of ML algorithms using the machine-learning factory (ML-factory), and we will present a proposal for the global architecture of the DSS. The DSS for TTPEMP is presented in the
Figure 4. We will explain in the following subsection each part of the DSS.
6.1. Big Data Issues (See Figure 4: A)
In this part, we specify the solutions implemented in order to ensure the performances during the data processing. The energy data to be processed falls into the category of Big Data.
Definition 13. The 5 V’s of big data (velocity, volume, value, variety and veracity) are the five main and innate characteristics of big data.
A large amount of data must be processed (Volume). Indeed, it is necessary to process the power consumption history of several hundreds of thousands of buildings over several years with a time step often of the order of a minute.
Moreover, the consumption data are updated every day (Velocity). The energy data are also heterogeneous (Variety). Because of the multitude of sources, not all buildings have the same descriptive data or the same consumption data (electricity, gas, water…), but even when the same values are described there is heterogeneity of formats (unit, time step, file type, indexing…). Some building do not even have meter collecting energy data and the only information available is accessible through PDF files of energy invoice. In addition to consumption data and physical description of the system, external data such as the meteorological consumption are also relevant.
Some data describing for example the type of use of the building are entered by the customers and can present errors (Veracity). Of course, the data must also undergo numerous pre-processing operations in order to manage anomalies and to process outliers or missing values (Variability).
The architectural solutions proposed to deal with these issues are the Data Lake for the storage and integration of energy data, and the data mart for the processing and specific formatting of these data in order to respond to the different issues of energy actors.
6.2. Data Lake (See Figure 4: B)
Definition 14. The data lake is a massive storage of unstructured data from various sources. The data are not pre-processed (cleaning and formatting) nor prepared for analysis. That gives users more flexibility on data management, storage and usage.
However, the data stored in a data lake is not easily exploitable. And a data lake can easily turn into a
Garbage Dump: a one way data lake in which a massive amount of unstructured data are stored but never exploited [
47]. The data lake therefore needs to be used in conjunction with a more structured form of database called data mart.
6.3. Data Marts (See Figure 4: C, D, E, F)
A data mart is a unique vision of the data, centered on a single task such as sales, marketing, etc. It improves the response time of users thanks to the cataloging of specific data.
The energy management requires a variety of methods (clustering, classification, prediction). Spatio-temporal data can be structured in different ways according to the question being investigated, therefore the data marts
C,
D,
E and
F of the
Figure 4 will not extract the same data and will not format it in the same way [
48].
With its smaller, focused design, a data mart has several benefits to the end user. A data mart extracts, transforms and loads a fraction of the data into a single and consistent data store used for a unique task. Therefore, process is optimized in terms of computation time and storage space. Since the data access is simplified and the data mart contains a small subset of data, the implementation of methods, the access to insights and the data maintenance are significantly easier and faster than in a classic database.
Data marts include various methods of ML, data mining and knowledge extraction to produce information from the data lake. Let us explain the main concepts concerning the TTPEMP.
6.4. Machine Learning Methods
Increasing Energy Efficiency of a system correspond to making that system consume less energy to produce the same amount of services or useful output [
49]. Energy performance however is more difficult to define since energy performance indicators are multiple and complex and depend on a methodology which may vary on the national or even regional level [
50]. The energy performance indicators that can be considered are not the same depending on the building type, hence the need for accurate estimates and reliable benchmarks for each type of building [
51]. Therefore one of the first step in evaluating energy performances is to classify buildings based on their type. The type of a building corresponds to its main usage. Types of building can be identified by two approaches, supervised or unsupervised.
6.4.1. Unsupervised (Clustering/Profiling) (See Figure 4: C)
The first possibility is non supervised learning such as clustering methods.
Definition 15. Clustering is the task of grouping a set of objects in such a way that objects in the same group (called a cluster) are more similar to each other than to those in other groups.
In this process homogeneous groups of sites are identified based on their physical characteristics, their meteorological situation and their consumption.
The TTPEMP is bound to have a very high heterogeneity in the system it studies (is a hydraulic pump for public garden comparable to an office?) and the quality of the clustering made by its clients is never perfectly assured (see Veracity of Big data). Because of this, being able to cluster the entirety of the clients into similar groups presents both a challenge and an opportunity to gain insight into the profiles and groups that we are studying. This might allow us to discover profiles of buildings sharing similar characteristics but that have not been classified together before.
After having identified the profiles, a knowledge extraction step is necessary in order to identify the key indicators that define the groups. This step is necessary to give meaning to the classification, and therefore to determine the energy performance actions which are the most relevant to each building type.
6.4.2. Supervised and Semi-Supervised (See Figure 4: D, E)
Contrary to the non-supervised learning, the supervised learning uses a dataset in which the items have already been labeled. In semi-supervised learning, the whole dataset has not been labeled.
Definition 16. Through supervised learning, the objective is to classify sites into already established groups.
It can be building usage, which has been identified to be a key element in evaluating energy performance of buildings [
51], or it can be a site profile that has been identified using clustering methods.
6.4.3. Forecasting/Prediction (See Figure 4: E)
The prediction of consumption based on consumption history, building descriptive data, and building identified profile, can help evaluate energy performance evolution. Indeed, by comparing predicted energy consumption with measured energy consumption, one can detect improvement or deterioration of consumption of a building.
6.4.4. Model Selection in ML-Factories (See Figure 4: G, L)
Using the features extracted in the data marts, the system should be able to select one or several algorithms to apply to the dataset. For example in the case of forecasting, Feature-based FORecast Model Averaging (FFORMA) can outperform the simple averaging of forecasting methods. It also outperforms the selection of the best forecasting method [
52]. Similarly, several clustering methods can be combined to give a more relevant and robust clustering [
53]. Finally, this process also perfectly works on deep-learning forecasting methods [
29].
6.5. ML-Factory (See Figure 4: G)
We want to extend the application of automation methods recommended by DevOps to ML algorithms. ML models require special processing because they must be trained on previously defined and labeled data sets. An ML-factory is a model life cycle including MLs methods.
Definition 17. We identify three main stages in an ML-factory:
A prototyping phase during which the developer explores the data, defines the format of the expected dataset and compares several candidate models;
A model training phase that can last several days and that is carried out, usually, on a larger dataset;
An inference phase, making the model callable, preferably with the best possible performance.
In others words, an ML-factory, is an iterative process that covers iteratively: (1) the constitution of the training data; (2) the identification of the ML algorithms; (3) the training of the models and their hyper-parametrization; (4) the recording of the trained models in an adequate library; (5) the deployment on the chosen platform; (6) the supervision and monitoring of the model in production; (7) the iterative improvement of the models.
In the context of TTPEMP, it is preferable to rely on algorithms that will be trained from start to finish and to orchestrate the entire pipeline. Indeed, this control provides flexibility for each step and allows data scientists better introspection into the models they develop. A ML factory can include other tools such as a specialized database to allow data enrichment (features).
6.6. Recommendation, Feedback and Continuous Improvement (See Figure 4: H, I, J)
The goal of the ML-factory is to determine profiles of consumers to determine which strategies can be used to improve their Energy Efficiency. Those strategies are not discussed in this paper since they are the business plan of the TTPEMP Energisme.
By applying the DevOps principle described in
Section 5.2, the DSS must be able to identify critical points in the system. These points require human intervention to make sense of the algorithmic results and prevent aberrant responses. In addition to ensuring the quality of the recommendations, it is necessary to ensure the system’s ability to adapt to changes in data and data sources, but also to integrate new methods of processing information in a fluid manner. Thus, the system will be resilient to the transformations of the studied building stock as well as to the integration of new methods of data processing. This requires integrating the DevOps methods described in
Section 5.2 in the design, maintenance and operation of our system as follows:
Take into account the feedback of its clients and partners: by evaluating the energy saving that have been made and improving the DSS accordingly (scoring algorithm based on the energy savings, using ML to improve the quality of the recommendation…);
Thanks to the MSA, adaptation of the information system to new technology can be smooth and easy.
Already present in
Figure 2, the feedback loop which is so essential for governance and resilience can be found in
Figure 4 representing the DSS global architecture.
7. Results and Discussions
7.1. Continuous Integration and Deployment of the MSA Architecture and Its Monitoring
7.1.1. Technical Choices for the MSA and Its Monitoring
In an MSA, each service is running in a container.
The deployment and execution of microservices is managed by a container orchestrator. To date, there are several known container orchestrators, but one has clearly overtaken the others to become an open source standard:
Kubernetes [
46,
54,
55]. A
Kubernetes cluster is a set of nodes that run containerized applications. A pod is a group of one or more containers that share network and/or storage. And a Kubernetes cluster is a set of node machines, used for running containerized applications.
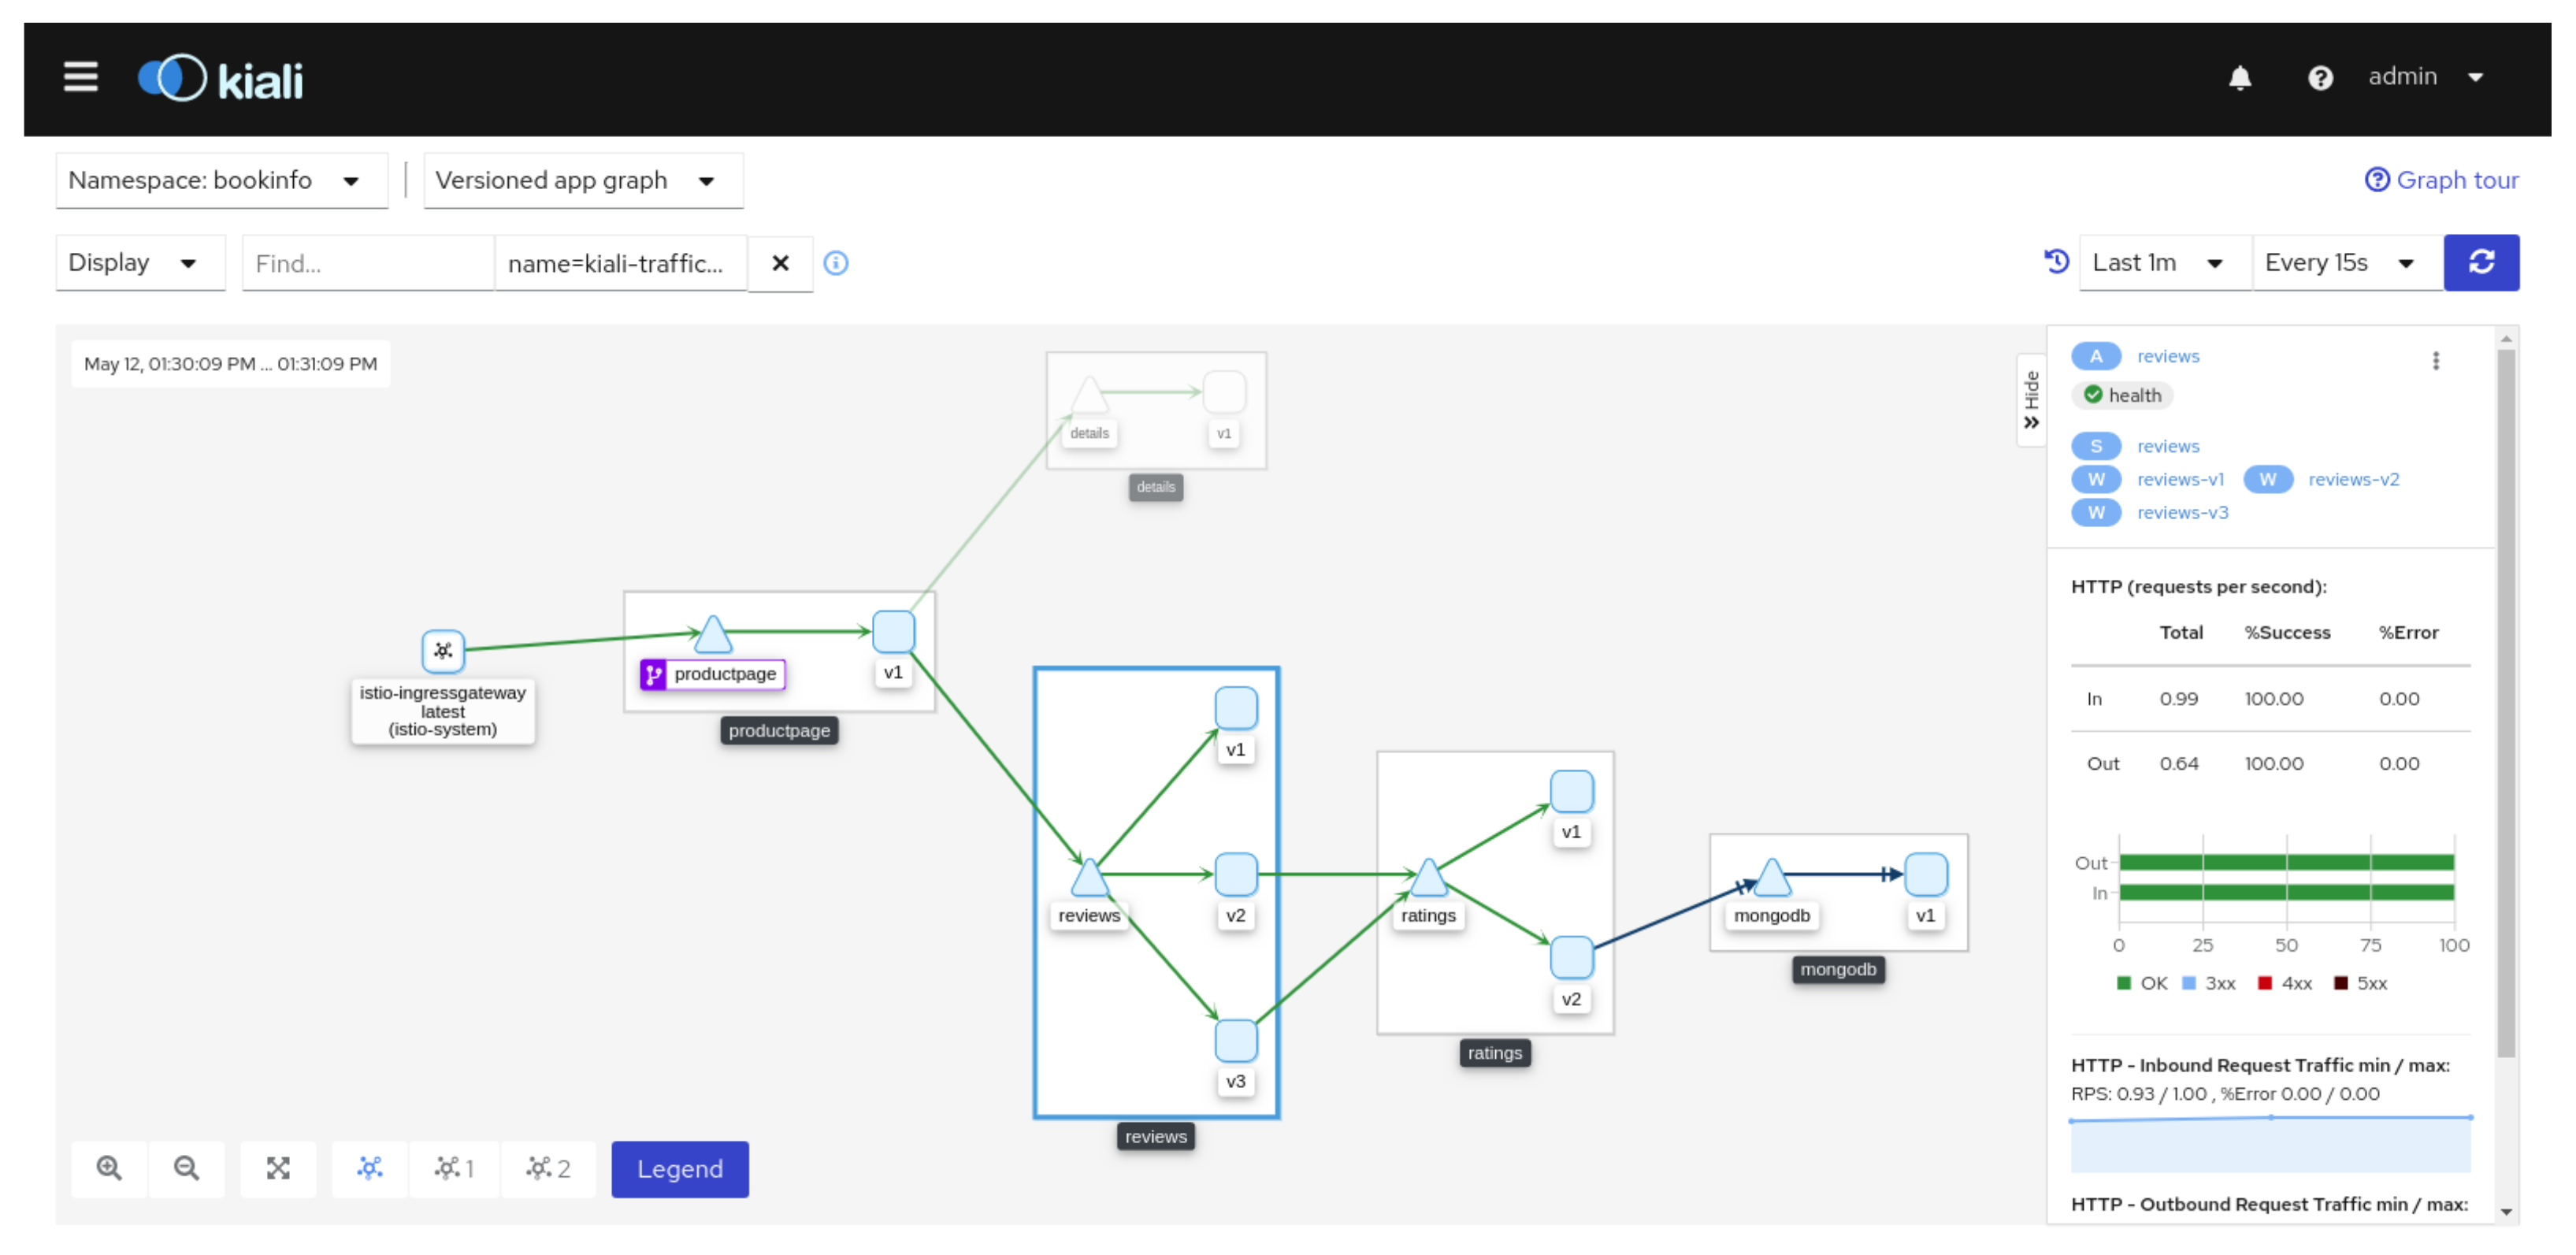
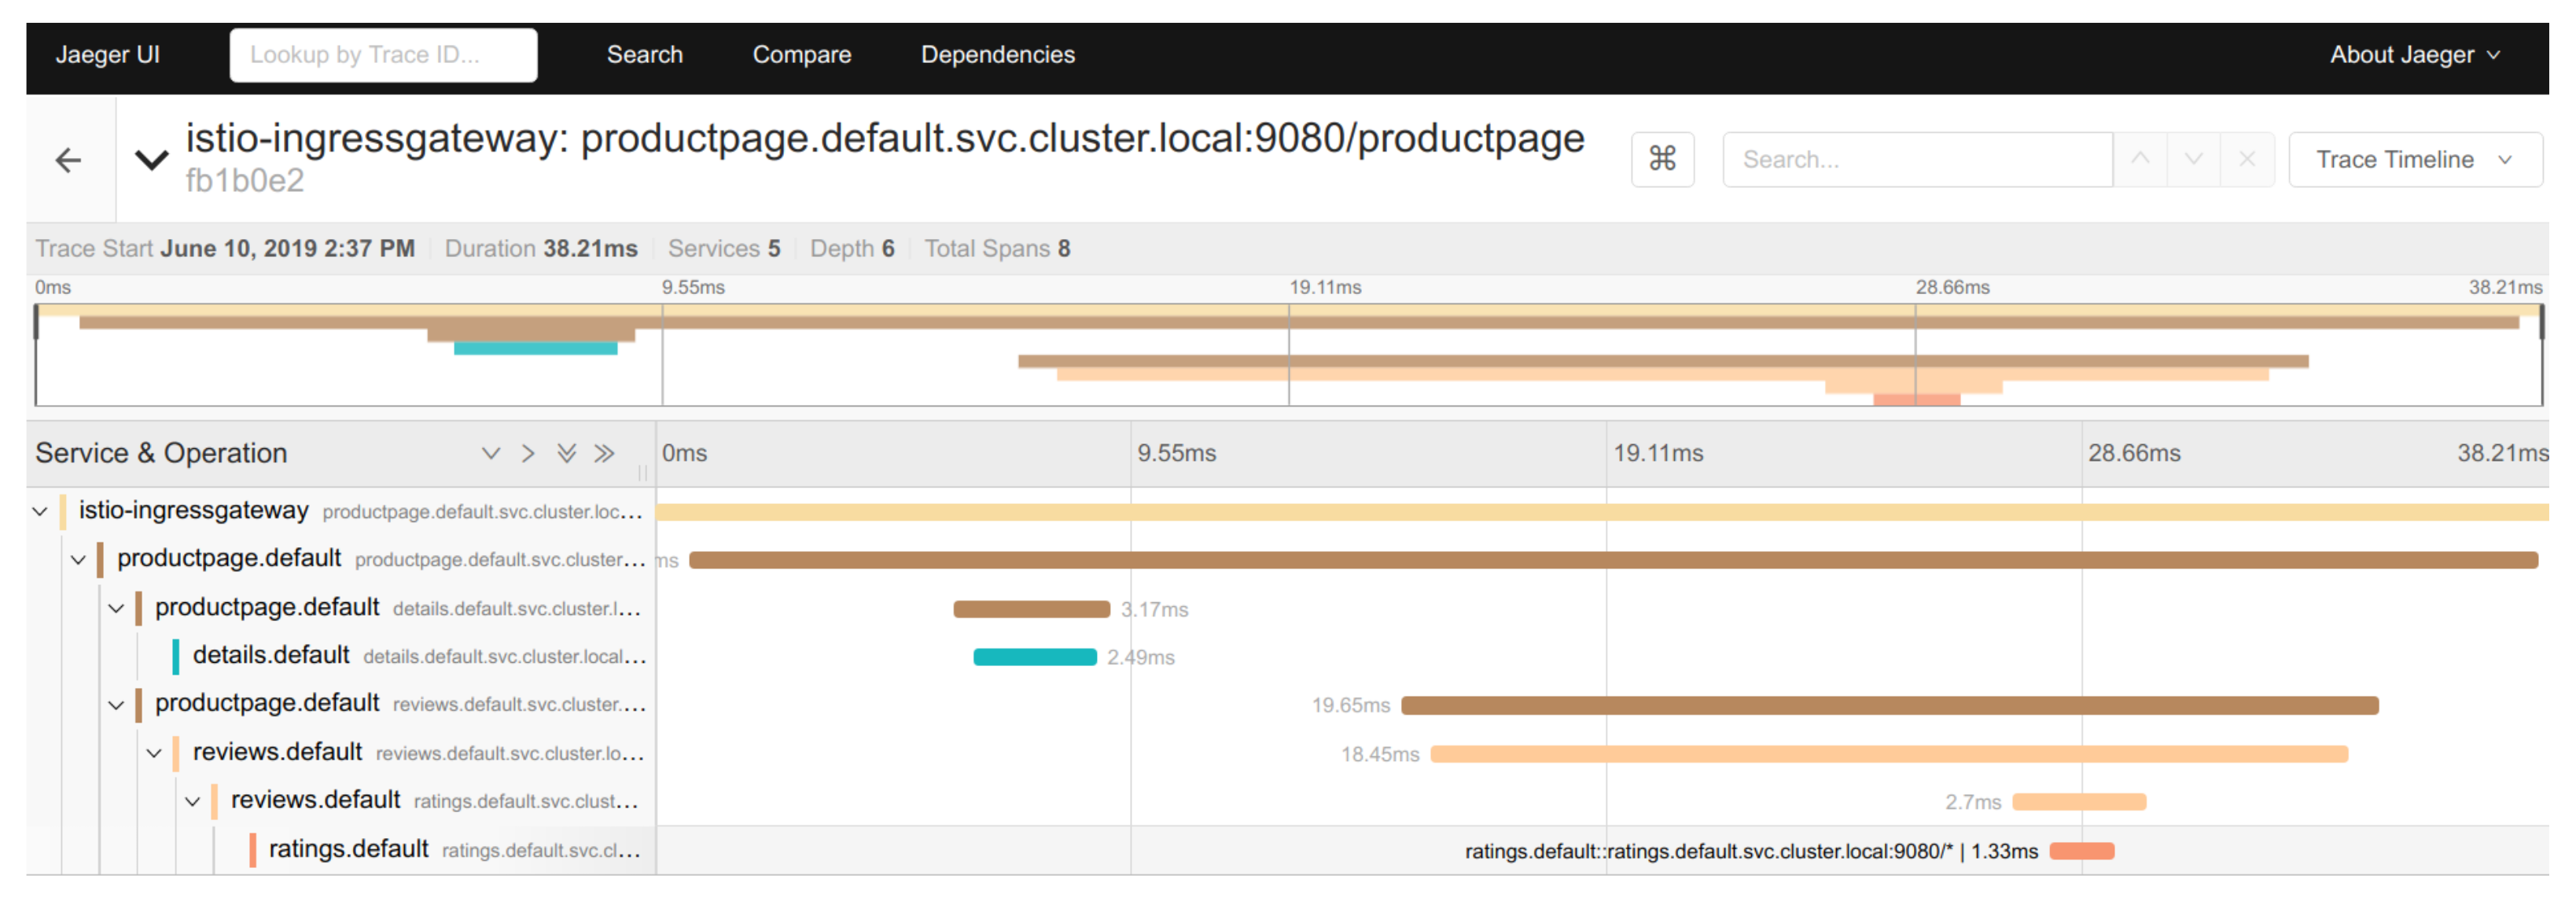
For pods, Kubernetes offers a sidecar service, which allows to set up a mesh service. This allows the tracking of incoming and outgoing requests formulated to the microservices, as well as the aggregation of the tracking metrics and their transmission to the microservice controlling the mesh service. Such tracking allows us to automatically draw a graph representing the path of a request through several microservices. Moreover the execution of the different steps of a request is timed as shown in the
Figure 5 and
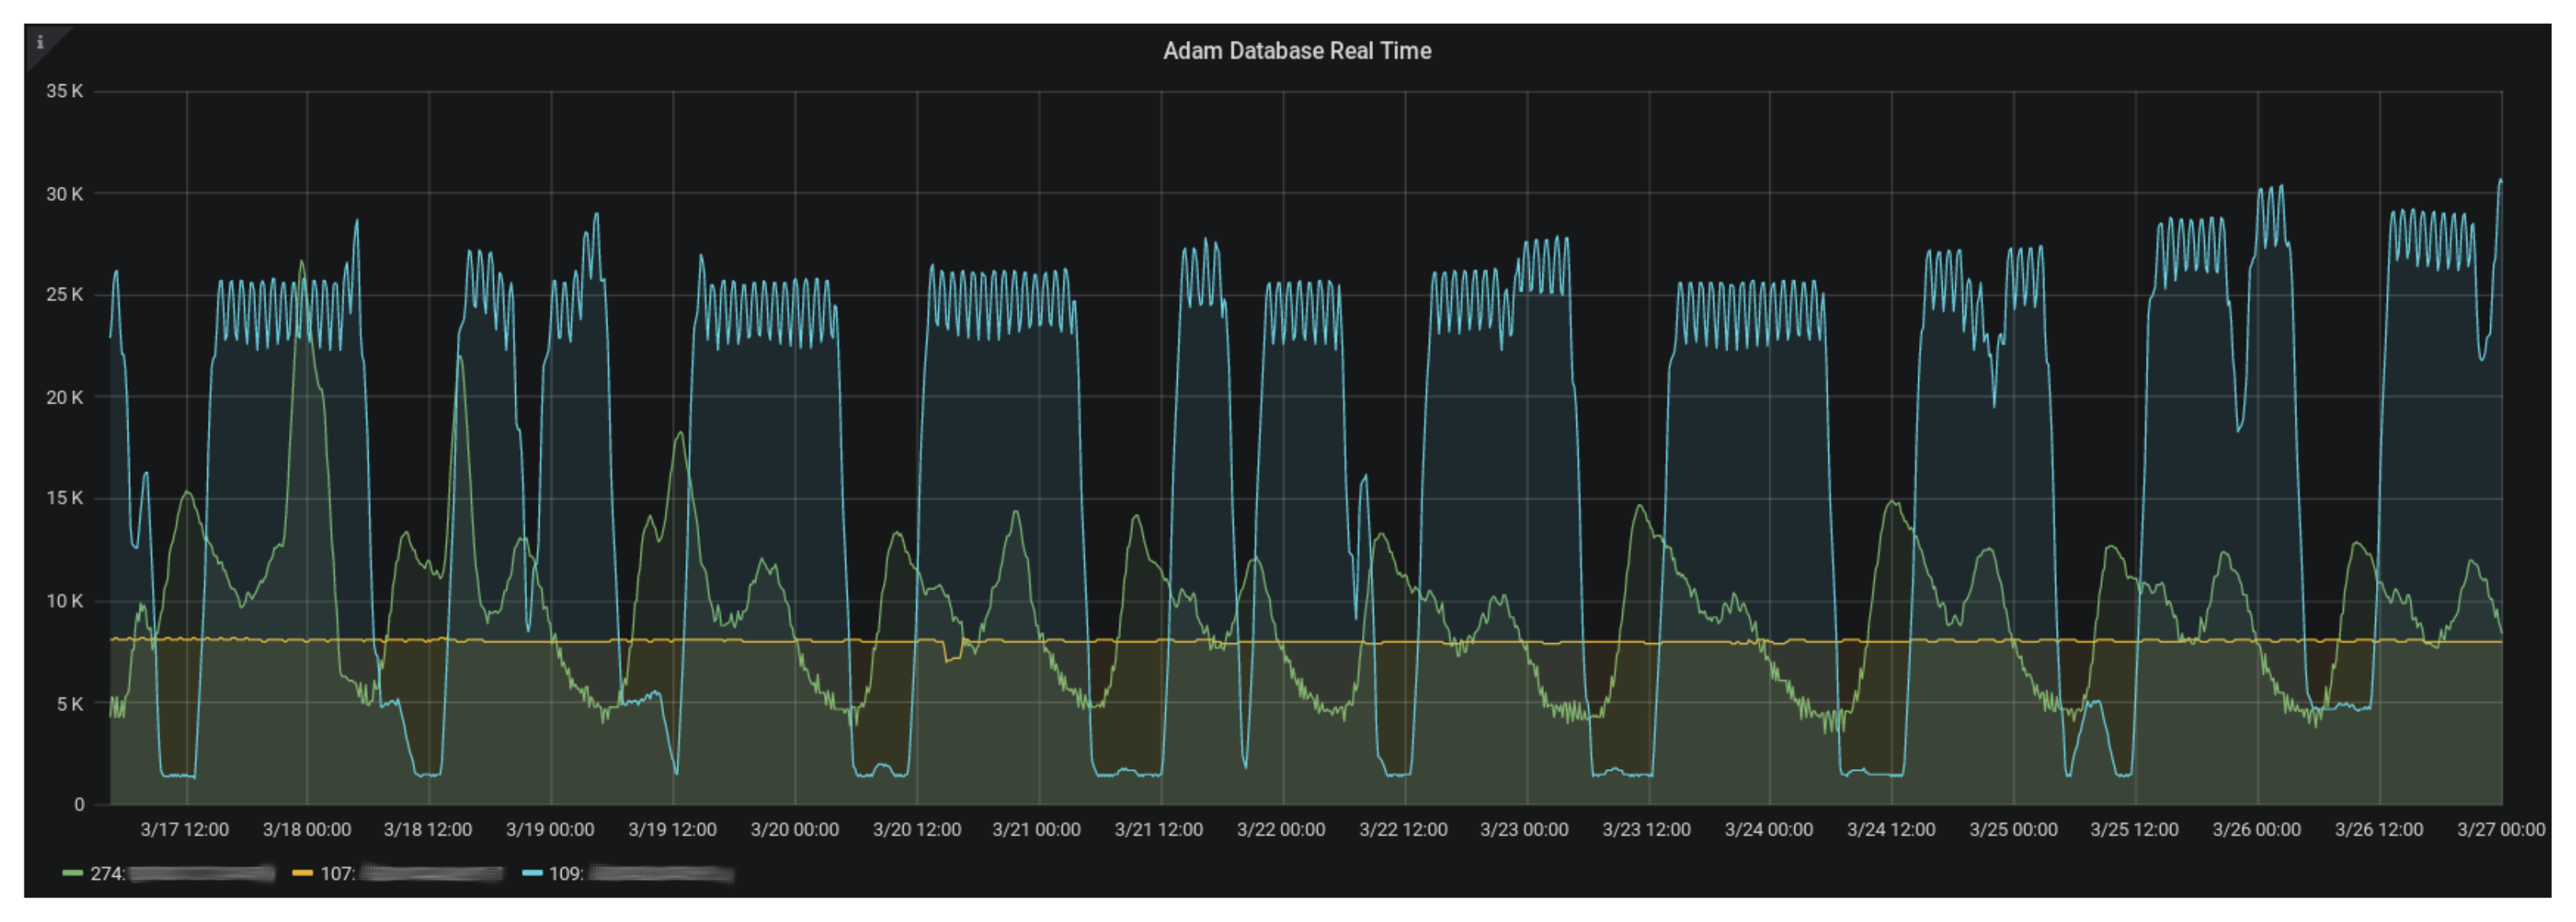
Figure 6. The dashboarding software Grafana was selected for the microservices monitoring (see
Figure 7).
The monitoring platform runs on a Kubernetes cluster deployed in the Azure Cloud. This solution was chosen because the Azure Cloud offers an Infrastructure as a Service (IaaS), called Azure Kubernetes Service (AKS), which facilitates the deployment and management of the cluster. It manages the cluster’s master node and the necessary storage and network components. It also exposes graphical and command-line interfaces for operations on the cluster, such as adding node groups.
The following tools have been deployed for monitoring:
Istio, for the meshing of services.
Grafana, dashboarding software for monitoring microservices.
Prometheus, for the collection of monitoring data.
Kiali, a graphical interface for monitoring microservices and reconstructing workflows from requests.
Jaeger, for monitoring and troubleshooting microservices.
7.1.2. Continuous Integration/Continuous Deployment
The AKS cluster is deployed through a CI/CD pipeline running on a server dedicated to infrastructure deployment. This CI/CD deploys a cluster whose nodes are distributed and labeled according to different uses that we have previously identified. We applied the following strategy:
One node dedicated to CI/CD microservices and network components requiring little performance, such as the microservice in charge of editing Transport Layer Security (TLS) or Secure Sockets Layer (SSL) certificates;
One to two nodes for the common data model (project named BMAD) and ML model inference;
Two to three nodes for the ML factory microservices (Kubeflow);
One to two nodes with greater capacities than the others for training ML models;
One to two nodes for monitoring microservices (Prometheus, Grafana, Jaeger) and service meshing (Istio, Kiali);
One to two nodes for the Apache Kafka queue manager.
To simplify the development and operation of these advanced features, we have developed templates in several computer languages as well as standard integration and continuous deployment pipelines. These can be easily overwritten to meet specific project needs. These templates have accelerated the development of the sixty projects elaborated during this work.
7.1.3. Results on Data
The data used for the training and testing phases come from
Energisme data or from public datasets such as the Data Genome Project [
56] or ASHRAE - Great Energy Predictor III [
57]. The second part of this chapter describes the results obtained during the testing.
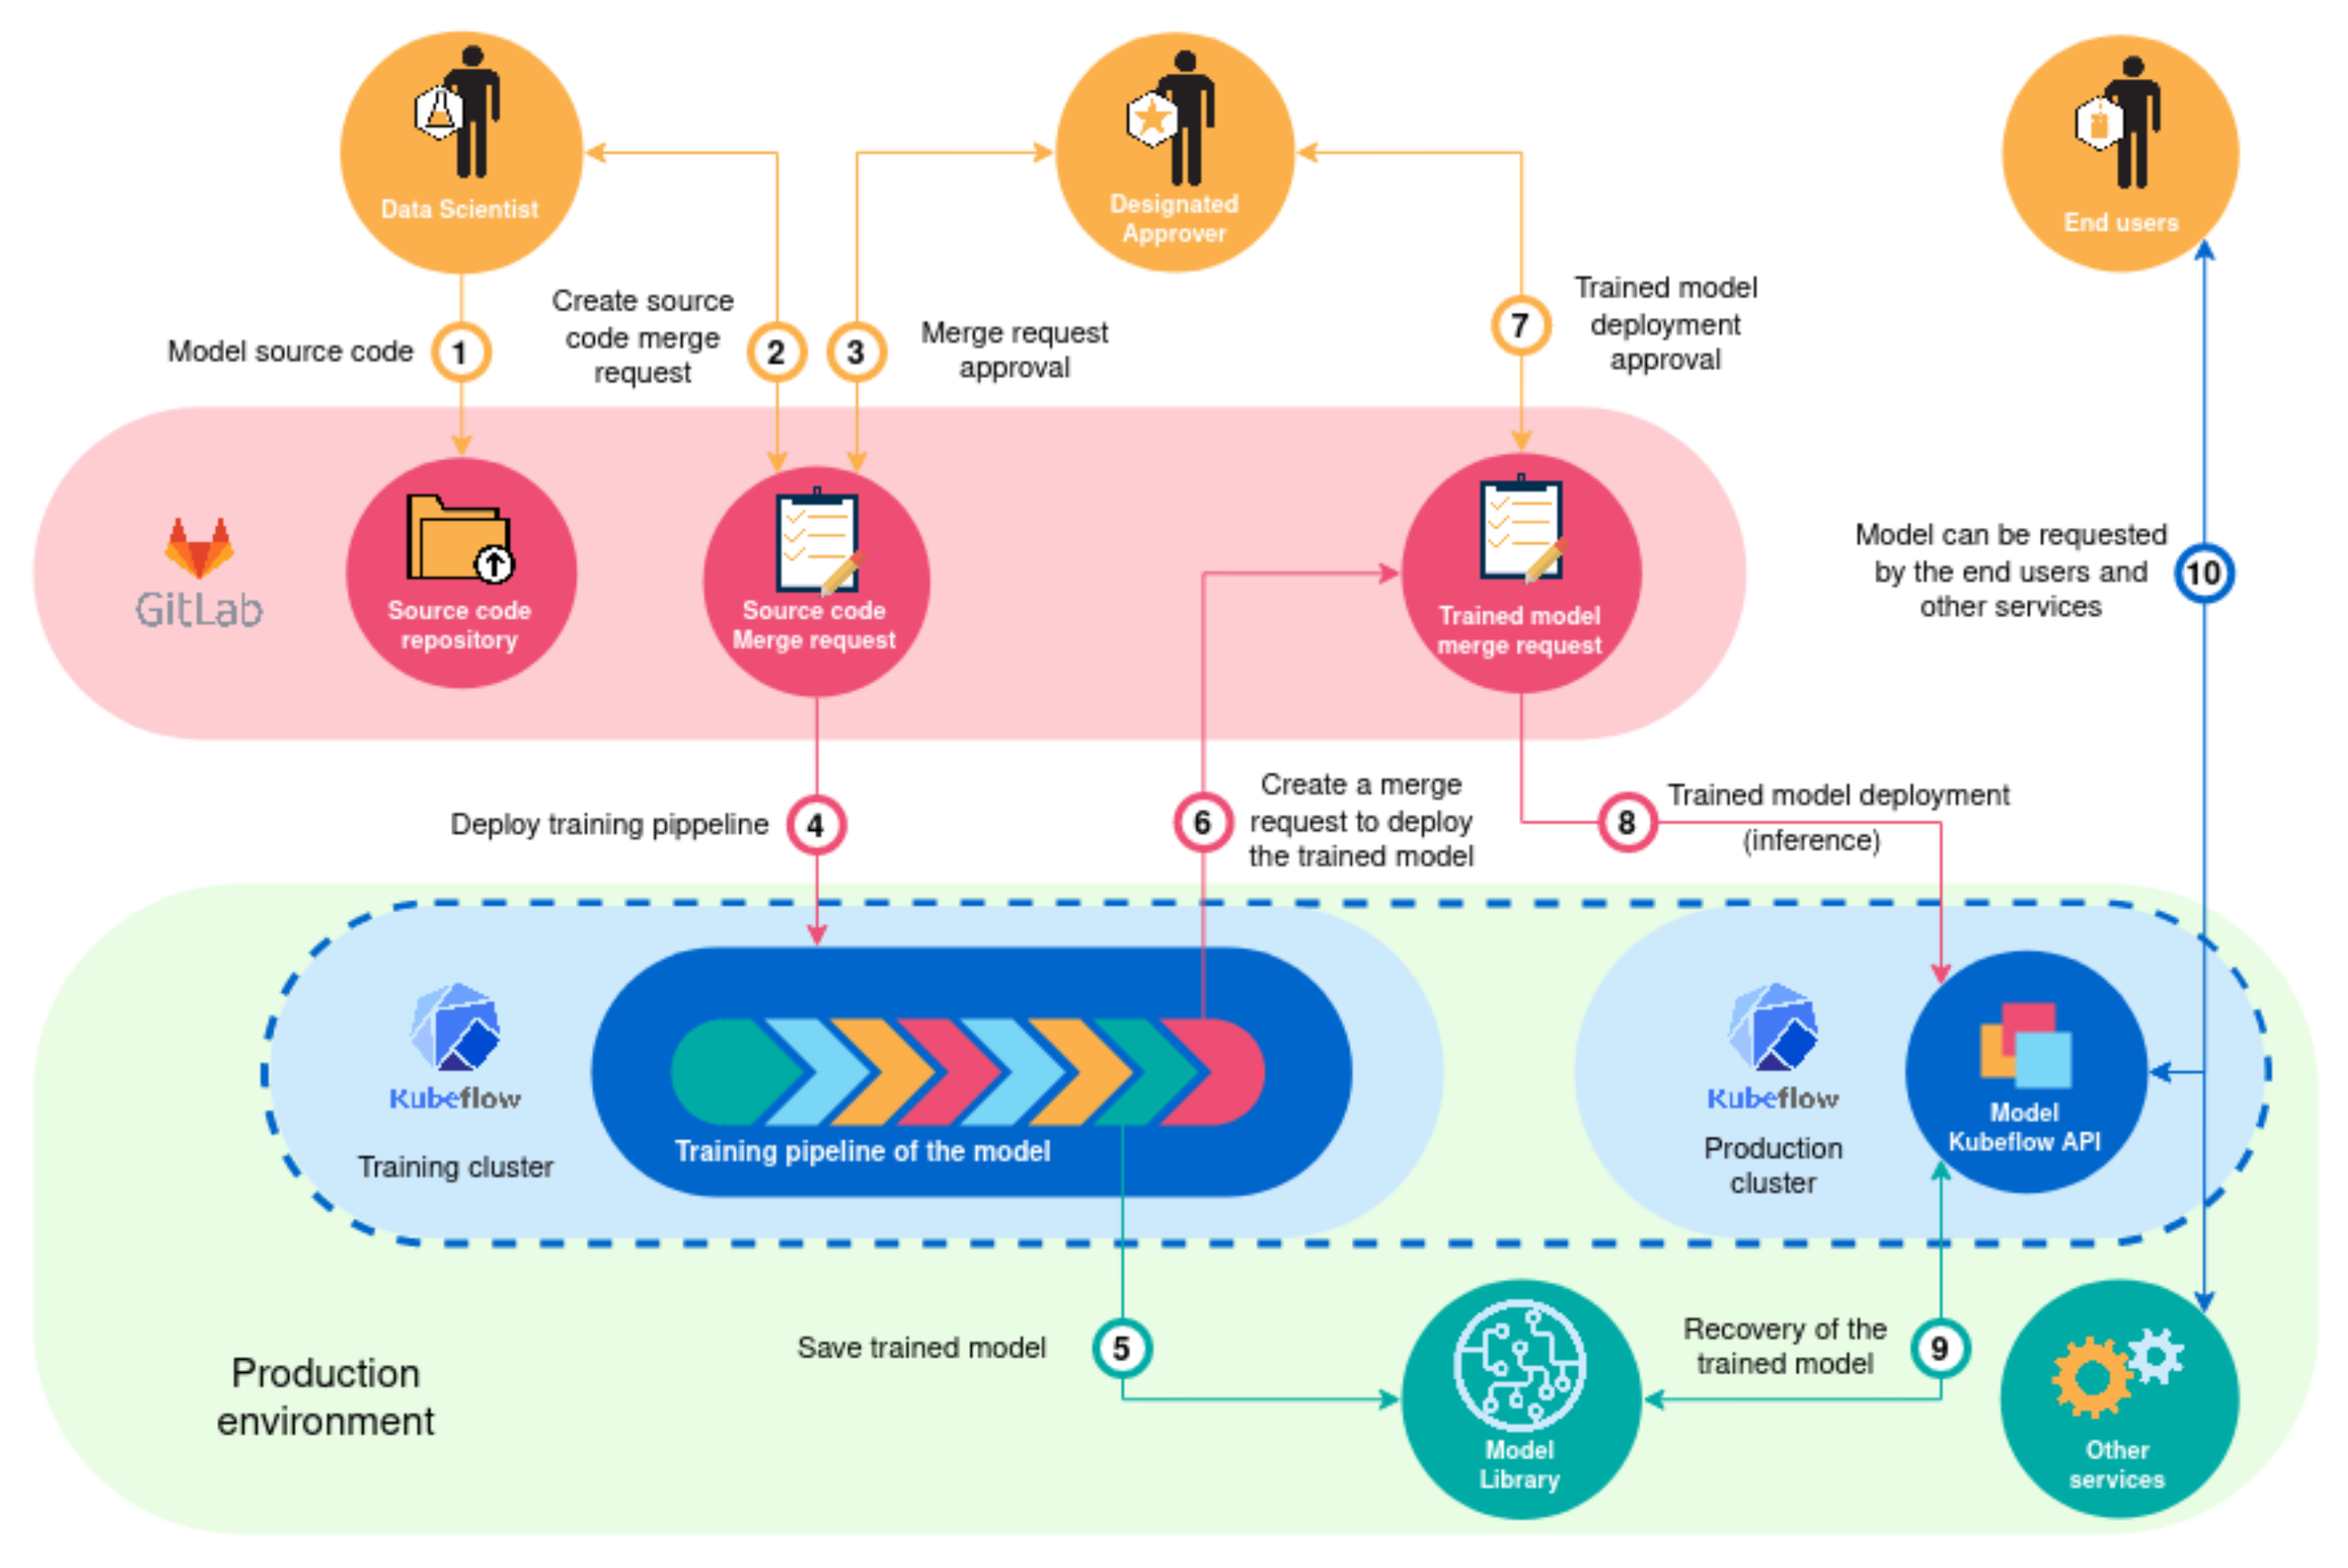
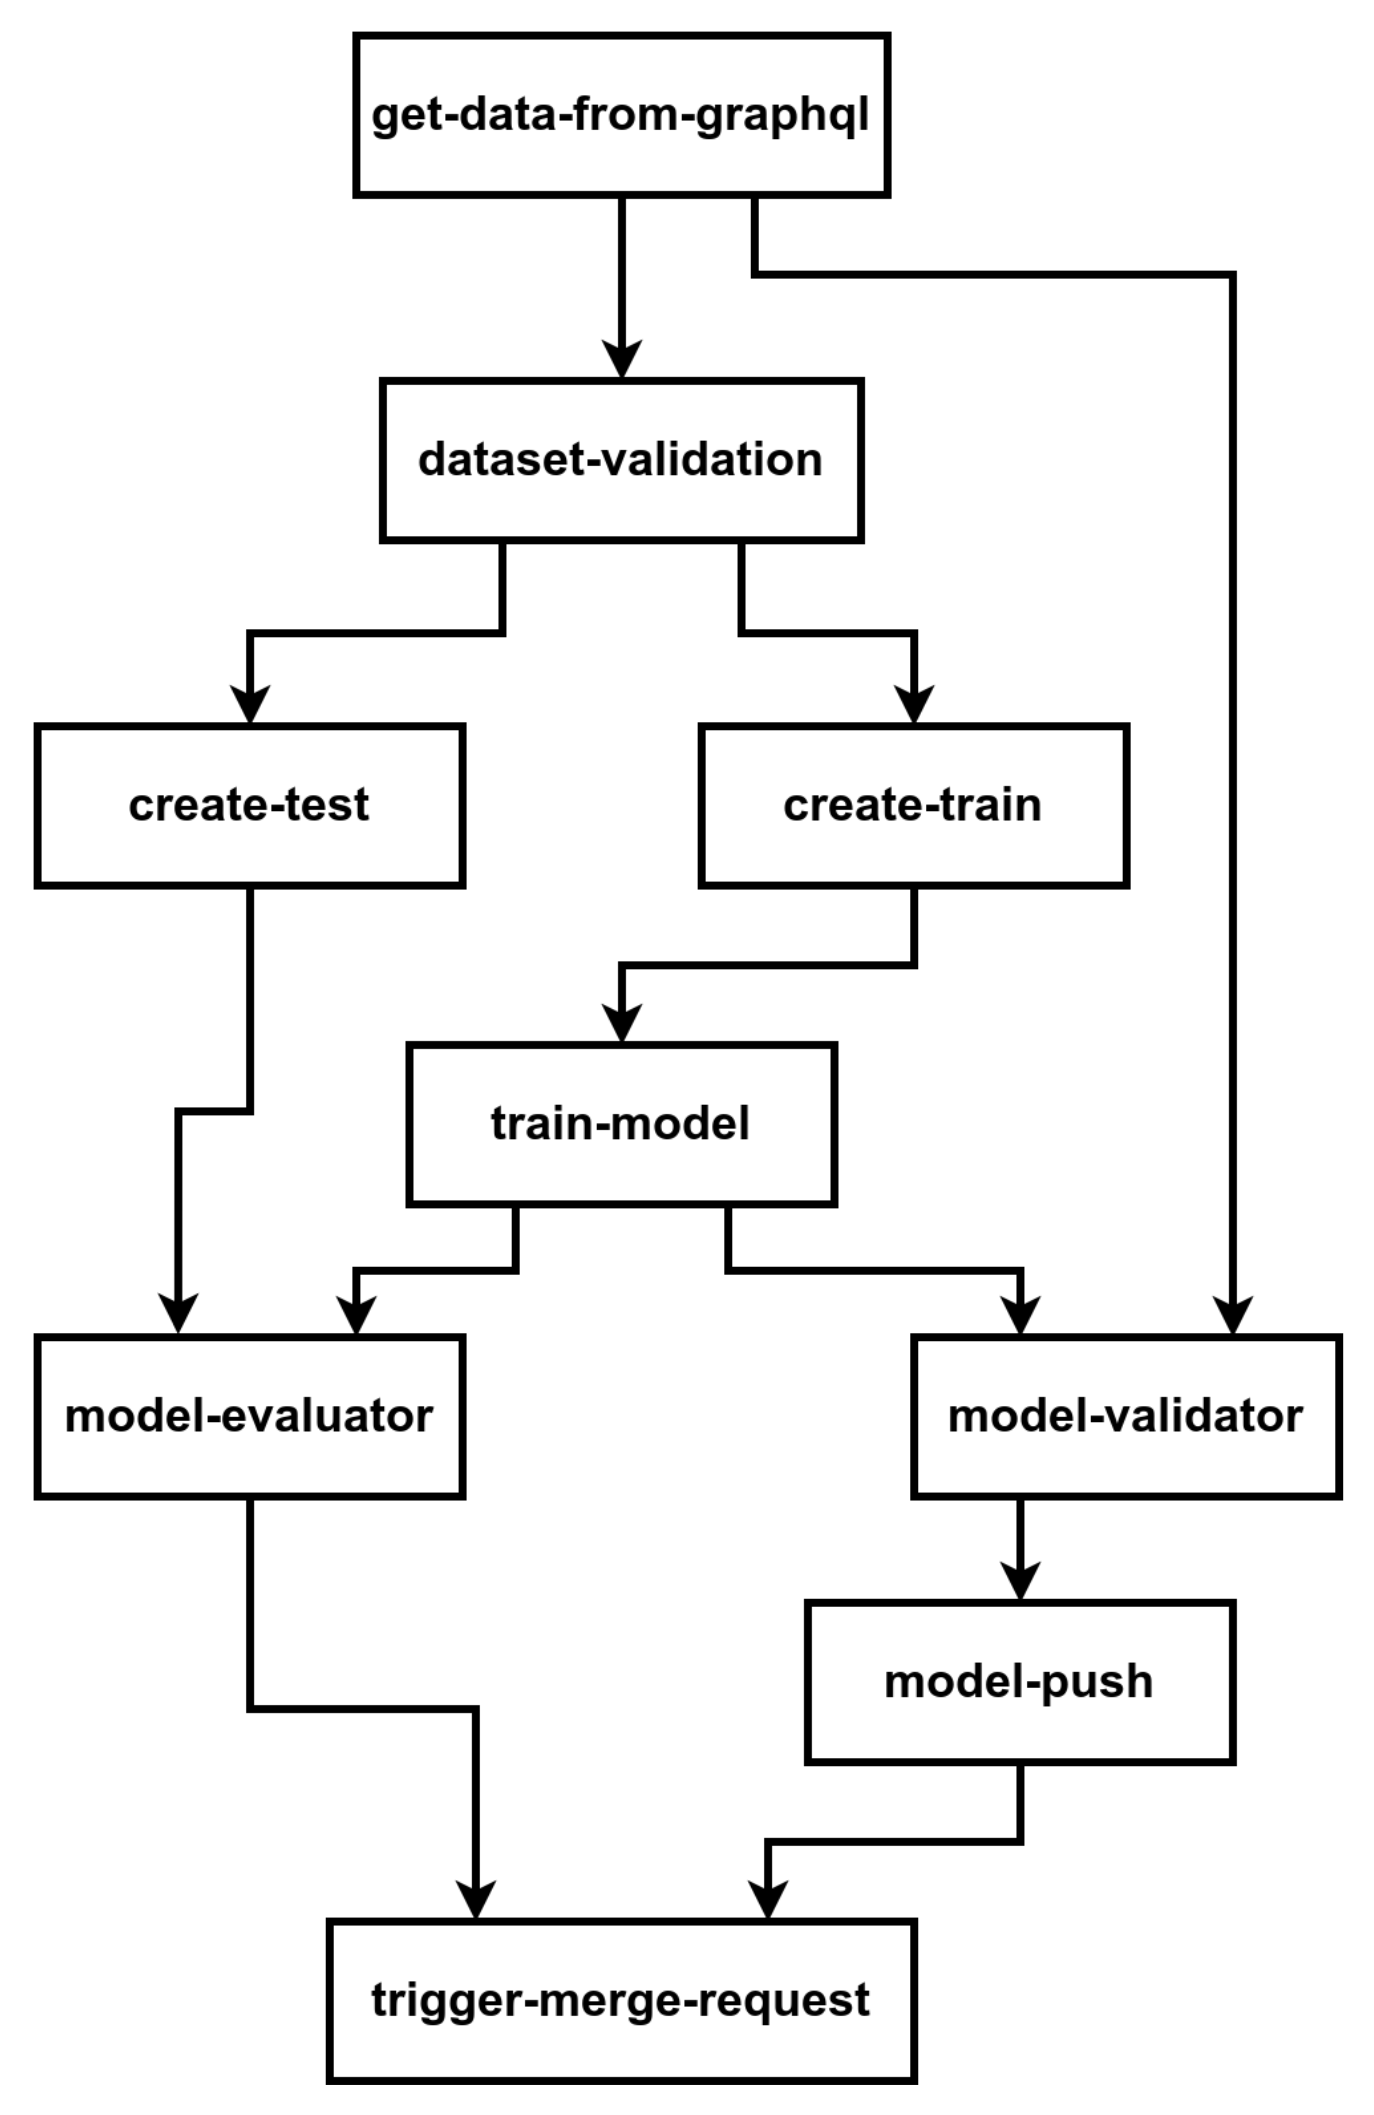
We designed a workflow to train the models which is presented in
Figure 8 [
36]. In this workflow the model source code is pushed by a data scientist in a git repository (1). Once the source code as been approved (2,3), a training pipeline is automatically deployed in Kubeflow (4). An example of training pipeline is presented in
Figure 9. One of the step of this pipeline can be to save the trained model in a Model Library. The trained model then needs to be approved (6,7) before it is deployed in the Kubeflow production cluster (8) by being recovered from the model library (9). The model can then be requested by the end user through the Model Kubeflow API (10).
The training and inference pipeline (see
Figure 8) is used to train and infer the different algorithms. Keeping in the DevOps methodology, thanks to the ease and speed of training and deployment of algorithm, the TTPEMP can experiment, innovate and keep up with the state-of-the-art by training new algorithms and evaluating the best algorithms to use for each specific context.
7.2. Discussion on Design Formalism
We selected the formal language ORC which is a semi-formal process algebra. The reason for this choice is that a fully formal language can be very restrictive and not allow to describe in a practical way all the elements. The choice of ORC is therefore a compromise between rigor and ease of use. Thus in Bosoms thesis the design of the system is validated using ORC. The description of the ORC language and the presentation of the formulas can be found in Bosom’s thesis [
36].
Learning such a language requires a lot of work. The adoption of this language by the development and operation teams is therefore unlikely. Therefore once the system has been validated by orc the formula are probably not going to be exploited any further.
A design pattern could be an alternative to the use of a process algebra. UML is a design pattern allowing to describe in a very explicit way the design of a system. It is also widely used by the professional community as well as by researchers. For this reason it is often updated and therefore allows to describe newly adopted technologies such as blockchain based IT systems [
58]. For these reasons the choice of the UML makes sense regarding the ambition both to obtain a theoretical validation with the help of this design pattern but also to make sure that these models are exploited by the developer community. UML also allows for The Model-to-Code Transformation, which is in line with DevOps and continuous practices [
55]. The decision system described in
Section 6 will therefore by modeled in UML in an upcoming paper.
7.3. Limits of the DSS Architecture Automatisation
The DSS has several limitations on its entire chain of information. Each paragraph is focused on a limit.
Datalake: The selection of the relevant data in the datalake must be performed with extreme seriousness and irrelevant data sources must be dealt with promptly. Otherwise the datalake will become a “garbage dump”. This process must be conducted continuously as the data sources are always evolving. This process is not automatable as it requires understanding of the clients and company needs.
Datamarts: Similarly, the preprocessing of the data must be adapted to the evolution of data being sent as well as to the evolution of the clients needs. Monitoring changes and adapting the entire data chain is the role of data lineage.
The automated selection of algorithms based on certain performance criteria is accomplished through tools such as multi-armed bandit. However, identifying the relevant criteria for the selection of algorithms requires understanding of the clients’ needs. They may want explainable models (white box models) or simply want efficient models (more likely black box models).
Knowledge extraction of building clustering is bound to be to be one of the most challenging aspect for the DSS.
Clustering being a non-supervised method, there is no certainty of obtaining an interpretive result and the interpretation requires a profound understand of building consumptions types. Even with algorithms displaying the importance of each feature in the clustering process, human expertise is still required.
Setting up the recommendations for energy performance based on building profile can only be performed either by ML, or by human input and with the knowledge of the existing and experimented recommendations. To calibrate the recommendation system through ML, one would need a database of building energy performance actions and their effects on building consumption. Using this, one would correlate building type with successful building performance actions. The other option is to analyse the clusters through human expertise and to calibrate the recommendations of the system based on that human expertise.
Retroaction based on the effect of the energy performance recommendations will be difficult because of the time factor in most energy performance actions, the time between energy performance action and analysable result might be long and therefore the system will learn slowly.
8. Conclusions
In this paper, we have shown that energy networks and their actors are complex systems facing the issues of big data, governance, distributed architectures and resilience, due to the transformation that the sector is undergoing. Although their problems are common, the socio-technical specificities of each system and the need to deal with the existing infrastructures make it very difficult to generalize the implemented solutions.
To deal with these issues, we have presented a hybrid method aiming at integrating the existing problems and the theoretical contributions brought by the systemic modeling of the studied systems. To demonstrate the interest of this method, we have taken as a use case a new actor in the energy domain: the Trusted Third Party for Energy Measurement and Performance. This use case allowed us to highlight that the natural evolution of the challenges facing actors in the energy domain poses governance issues. Some of these issues could be solved by greater governance through DevOps methods associated with a MicroServices Architecture. With these solutions, we proposed a scalable and resilient decision support system using different state-of-the-art tools for data management and for the automation of ML models training adapted to Big Data. Future work includes UML models of the DSS as well as results of the Decision Support system on building datasets.


 ,
, 