Article

Dry Anaerobic Digestion of the Organic Fraction of Municipal Solid Waste: Biogas Production Optimization by Reducing Ammonia Inhibition

1
Department of Energy, Systems Territory and Construction Engineering, University of Pisa, Via C.F. Gabba 22, 56122 Pisa, Italy
2
Department of Industrial Engineering, University of Florence, Via di Santa Marta 3, 50139 Florence, Italy
*
Author to whom correspondence should be addressed.
Energies 2022, 15(15), 5515; https://doi.org/10.3390/en15155515
Submission received: 22 June 2022 / Revised: 21 July 2022 / Accepted: 26 July 2022 / Published: 29 July 2022

Abstract

:
The aim of this work is to optimize biogas production from thermophilic dry anaerobic digestion (AD) of the organic fraction of municipal solid waste (OFMSW) by comparing various operational strategies to reduce ammonia inhibition. A pilot-scale plug flow reactor (PFR) operated semi-continuously for 170 days. Three scenarios with different feedstock, namely solely OFMSW, OFMSW supplemented with structural material, and OFMSW altered to have an optimal carbon-to-nitrogen (C/N) ratio, were tested. Specific biogas production (SGP), specific methane production (SMP), the biogas production rate (GPR), and bioenergy recovery were evaluated to assess the process performance. In addition, process stability was monitored to highlight process problems, and digestate was characterized for utilization as fertilizer. The OFMSW and the structural material revealed an unbalanced content of C and N. The ammonia concentration decreased when the optimal C/N ratio was tested and was reduced by 72% if compared with feeding solely OFMSW. In such conditions, optimal biogas production was obtained, operating with an organic loading rate (OLR) equal to 12.7 gVS/(L d). In particular, the SGP result was 361.27 ± 30.52 NLbiogas/kgVS, the GPR was 5.11 NLbiogas/(Lr d), and the potential energy recovery was 8.21 ± 0.9 MJ/kgVS. Nevertheless, the digestate showed an accumulation of heavy metals and low aerobic stability.

Graphical Abstract

1. Introduction

In the frame of the New Green Deal, the European Union (EU) aims at achieving carbon neutrality by 2050 [1]. Bioenergy production is a pillar of EU climate strategy, as it accounts for 70% of the overall renewable energy supply [2]. Anaerobic digestion (AD) processing of organic wastes may play a central role in achieving the key target of at least 32% for renewable energy by 2030 [3].
Among organic wastes, biowaste production reached 86 million tonnes within the EU member states [4]. The source’s sorted fraction of biowaste, which is also called the organic fraction of municipal solid waste (OFMSW), accounts for 42.3% of the total production, but it is going to increase, since separate collection will be mandatory by the end of 2023 [4,5]. The OFMSW has suitable physical-chemical, elemental, and bromatological characteristics for the AD process [6], but its composition has great seasonal [7] and geographical [8] variability, as it is also influenced by the collection system [9]. The characterization of the Tuscan OFMSW revealed a dry matter content (42%) which was ideal for dry AD processes (i.e., total solid (TS) content = 20–40%) [10]. In 2014, dry AD plants accounted for a cumulative market share of approximately 62% of the total European installed capacity [11,12]. This proportion is continuously increasing because dry AD requires a lower working volume than wet AD to handle high organic loading rates (OLRs). Digested sludges can be easily managed by reducing dewatering costs because of the high TS content (i.e., >20%) [10], and they are rich in nutrients [13], being suitable to produce fertilizers with a high agronomic value [14] in accordance with the European Regulation on Fertilizers 1009/2019 [15]. The main drawbacks are the low bioenergy recovery, the low volatile solid removal efficiency (REvs), and the accumulation of inhibitors or toxic compounds [13,16].
The state of the art reports that biogas recovery can be maximized with OLRs higher than 6  kgVS/(m3 d) [17,18] and long hydraulic retention times (HRTs) [10,13]. Ammonia and volatile fatty acids (VFAs) are the main process inhibitors [10,16]. Total ammonia nitrogen (TAN) is released during protein hydrolysis [16,19,20], and amino acids deaminate through the Stickland reaction [21]. TAN reduces the overall biogas production by causing proton imbalances and interfering with metabolic enzymes [22]. TAN is toxic for methanogenic flora at 1500–3000 mg/L, but the unionized form, free ammonia (FA), is toxic at an even lower concentration, namely 300–800 mg/L [10,23]. A high temperature and pH displace the equilibrium to FA production by increasing the conversion rate of ionized ammonium to FA [10,16,23]. Acclimatation of the bacterial population [5], pH, and temperature control [23], as well as altering the C/N ratio of the feedstock by co-digestion of proteinaceous substrates with carbon-rich feedstocks such as paper waste [24] or rice husks [25], have been reported as the most common strategies to reduce ammonia toxicity [23,26]. Other promising options seem to be bioaugmentation [26], anaerobic ammonia oxidation (Anammox) [10,26], the addition of trace elements [23], or struvite precipitation [26]. Table 1 reports the findings of recent experimental tests: the addition of zerovalent iron (ZVI) and activated carbon (AC) reduces the FA concentration and increases the specific methane production (SMP) [27], while ammonia stripping of digestate reduces the TAN concentration [28,29] as well as substrate dilution [30].
These studies rely on results achieved at the lab-scale level, lacking information toward a full-scale application of the techniques. For instance, dilution could be economically unattractive, increasing dewatering costs and the reactor working volume [17], and ammonia stripping from digestate still needs to be optimized [28,29]. Co-digestion with carbon-rich substrate, aiming at altering the C/N ratio of the feedstock, seems to be a promising technique [26], but little information is available for thermophilic dry AD treatment of OFMSW at the pilot-scale level. A study has investigated this aspect in the past but while using synthetic mixtures of OFMSW [32].
The novelty of this work relies on tackling ammonia inhibition in thermophilic dry AD of the OFMSW, comparing different operational strategies for the optimization of bioenergy recovery. To achieve this goal, a semi-continuous experimental test was conducted in a pilot-scale plug flow reactor (PFR), where source-segregated OFMSW and garden waste (GW) were used as feedstocks. Three scenarios with different feeding conditions were compared in terms of process stability, biogas yield, energy recovery, and digestate characteristics.

2. Materials and Methods

2.1. Substrate and Inoculum

The feedstocks used in the experimental tests were OFMSW and garden waste (GW). The OFMSW was a sample of approximately 250 kg collected from a Tuscan municipality which operates a door-to-door collection system. In turn, GW came from a composting pile after a curing period of 1 month. The Italian standards proposed by ANPA [33] were applied to ensure the representativeness of the OFMSW during sampling activities. The feedstocks were store in plastic tanks at −19 °C to prevent biodegradation before usage [34].
To inoculate the digester, anaerobic seed sludges from a thermophilic Italian full-scale AD treating OFMSW and GW were used. Plastics, small twigs, or inert materials were removed by filtering the inoculum with a sieve having an opening size of 10 mm. The inoculum was pre-incubated for 10 days into the pilot-scale digester to remove any residual biodegradable organic matter [35].

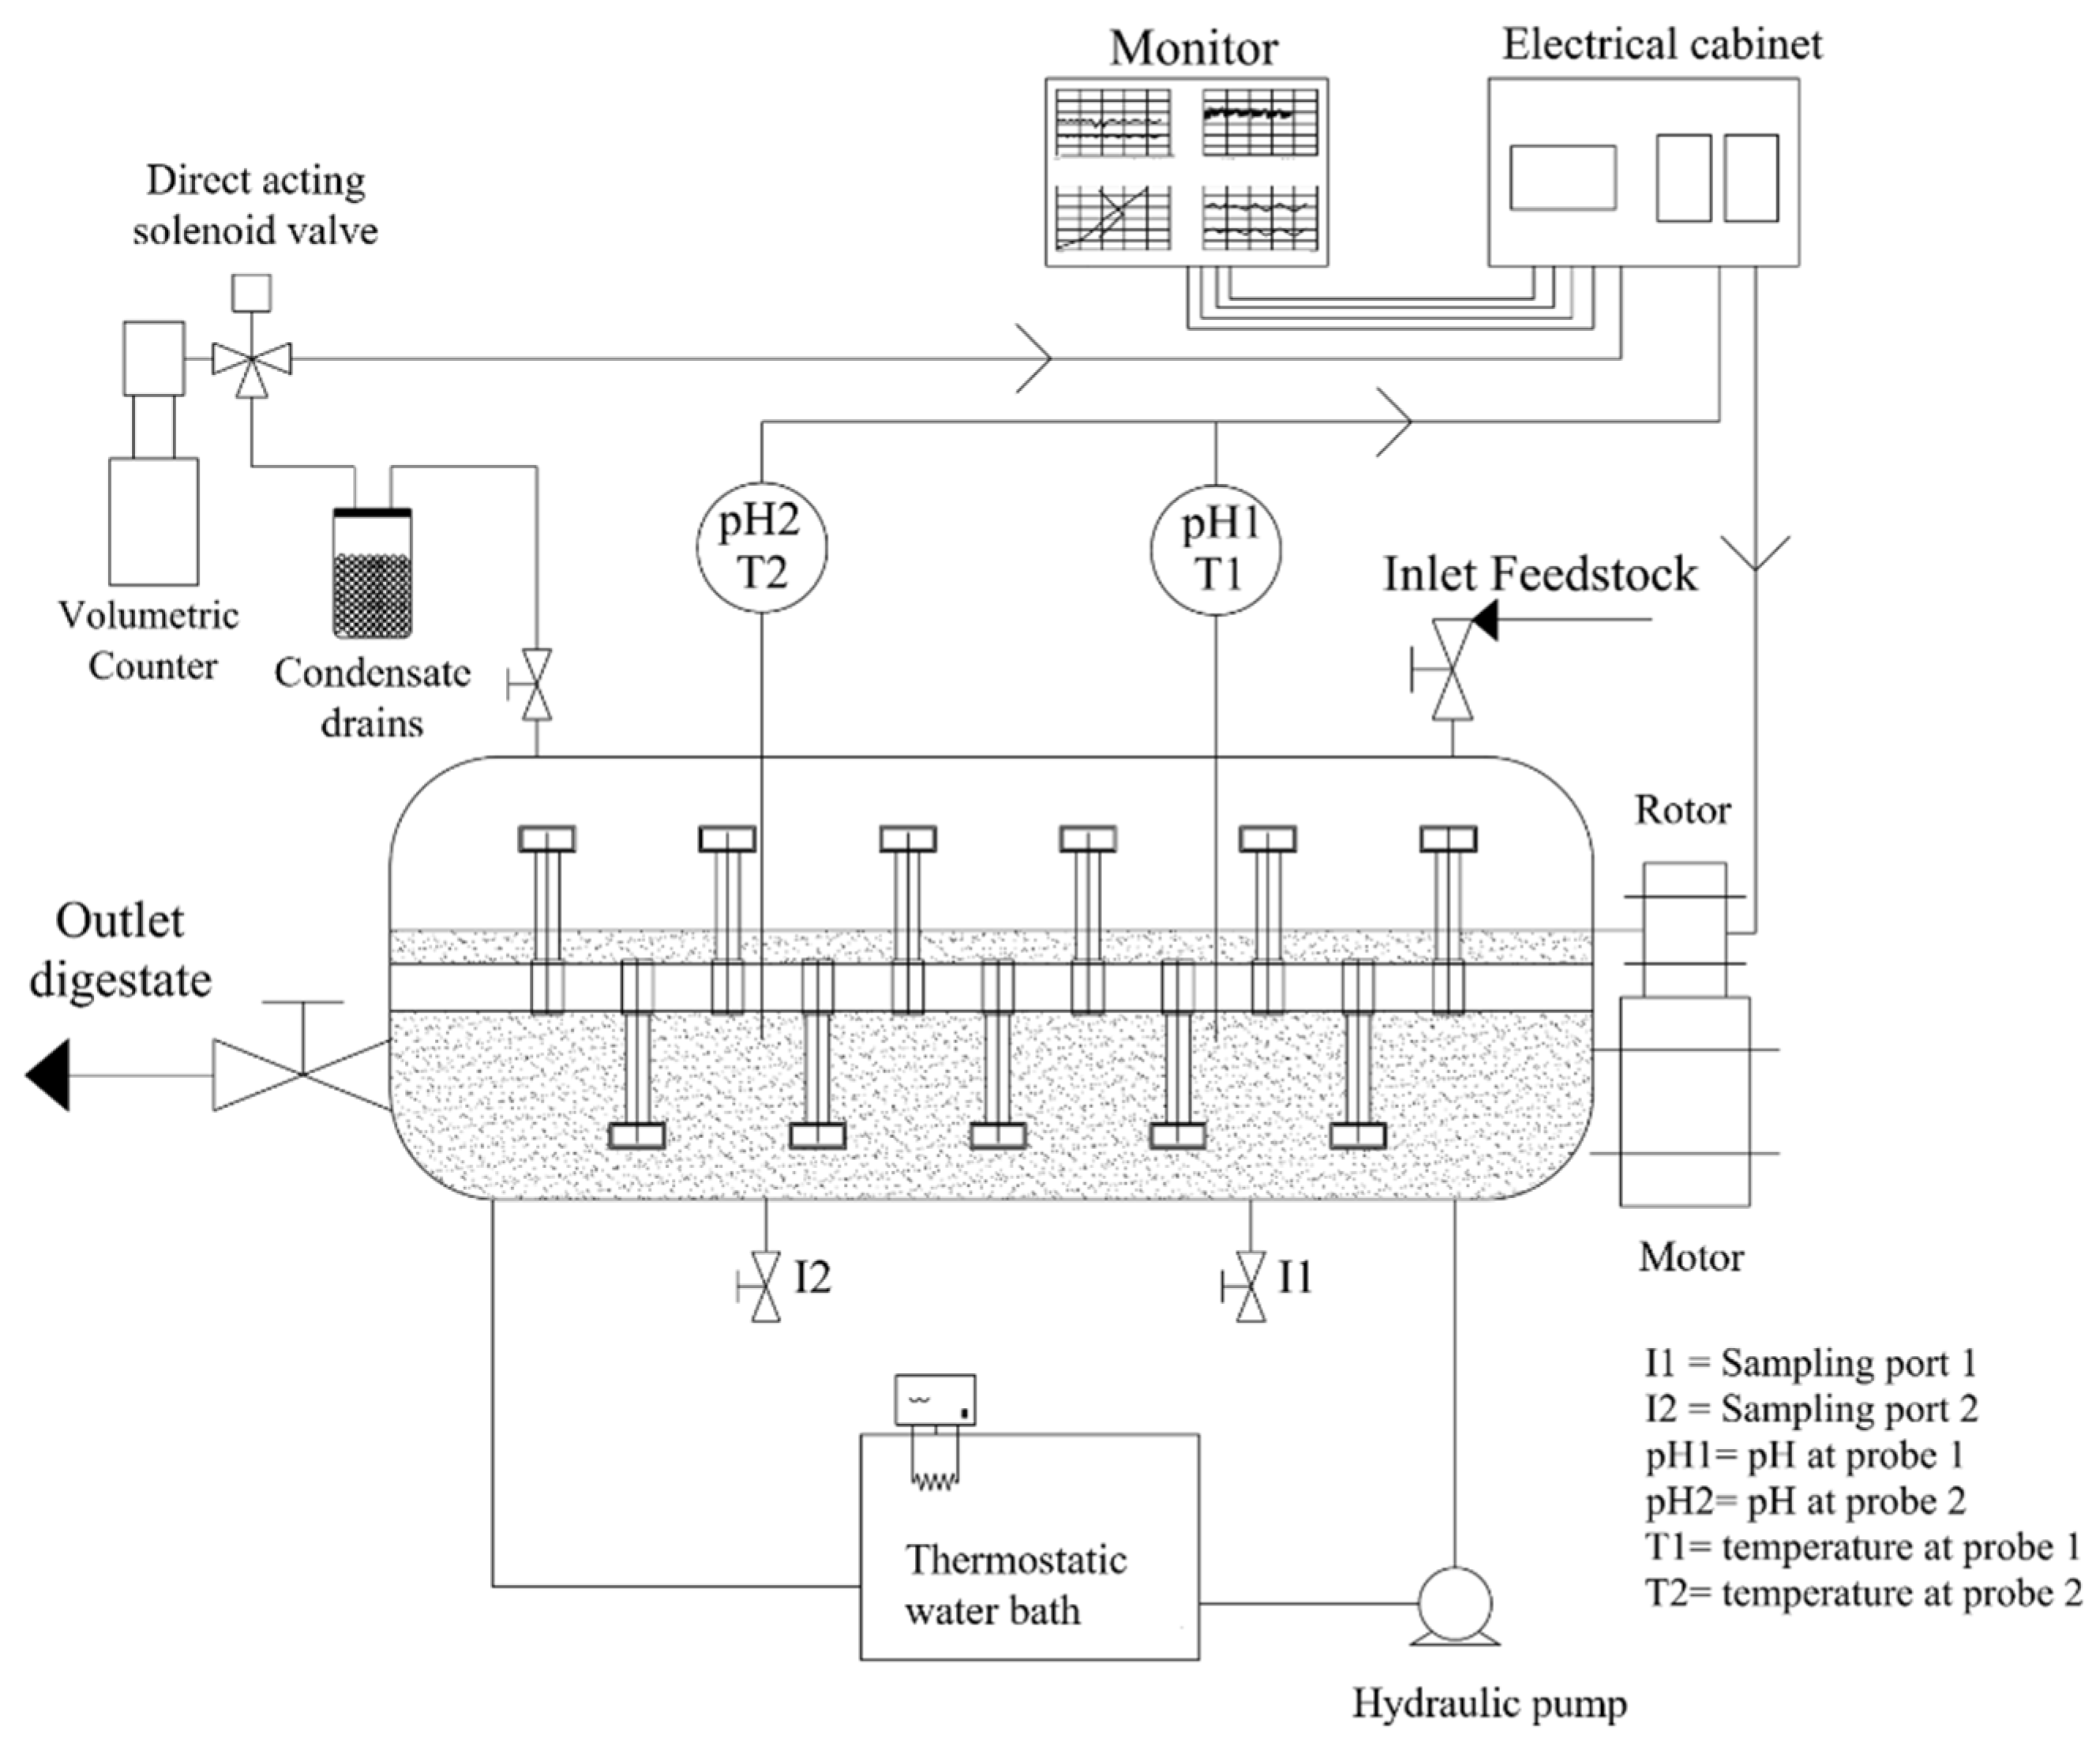
2.2. Reactor Configuration

The experimental system included a stainless steel, pilot-scale PFR with a total volume of 37 L, a biogas measurement system, an electrical cabinet, a data acquisition system, and two probes for the measurements of pH and temperature (InPro 4281i, Mettler-Toledo Spa, Milano (MI), Italy) (Figure 1). A comprehensive description of the experimental set-up was reported by Rossi et al. [34,36]. The mixing system of the PFR was composed of blades assembled on a horizontal shaft. This ensured a continuous contact between the biomass and the feedstock and favored the biogas released. An external water jacket maintained the thermophilic conditions (i.e., 53 ± 2 °C). A cylindrical tube and a piston designed for that purpose were used for manual feeding operations. The substrate was placed in the tube, which was a gas thigh with a lock nut and a sealing ring, and it was pushed inside the reactor operating the piston. The volumetric flow rate was continuously measured by a gasometer, which was coupled with the PFR through a 3/2-way direct-acting solenoid valve (type 6014, Burkert Spa, Cassina de’ Pecchi (MI), Italy) [37]. The concentrations of methane (CH4) and carbon dioxide (CO2) were measured continually by infrared sensors (Gascard NG, Edinburgh Sensors, Livingston, UK). The ambient temperature (THERMASGARD® ATM 2, S+S Regeltechnik GmbH, Nürnberg, Germany) and atmospheric pressure (PREMASGARD®ALD, S+S Regeltechnik GmbH, Nürnberg, Germany) were monitored to convert the biogas volume from ambient to normal conditions [36]. The data from the sensors were collected by specific hardware (National Instruments, Italy Srl). A cRIO 9030 controller coupled with Labview® software (National Instrument, Austin, TX, USA) was installed to continuously monitor and automatically control the process.

2.3. Operating Conditions

The experimental test comprised three scenarios in which ammonia inhibition was addressed by changing the inlet feedstock. The first scenario (S1) operated using solely OFMSW. In the second scenario (S2), the OFMSW was co-digested with GW at a share of 17%, and the third scenario (S3) operated by adding sucrose to simulate a feedstock with a high C/N ratio. Dry AD technologies that are conventionally applied to treat food waste operate with an HRT ranging from 22 to 16 [10]. The HRT is more than 30 days for agri-livestock wastes [38,39], while the HRT is lower than 30 days for food waste and OFMSW [32,40]. Therefore, the HRT was set equal to 22, 19, and 16 days in S1, S2, and S3, respectively. The data used for comparison were those of the last HRT of each scenario (e.g., days 41–63 for S1, days 93–112 for S2, and days 153–169 for S3). As reported in a previous study, this period was chosen because after two HRTs, we could assume the transient state to be ended [37].
Every working day the reactor was fed, and the equal weight of digestate was discharged to achieve a stationary state. A share of approximately 45% was mixed with the inlet feedstock and recirculated. The literature reports that for recirculation ratios higher than 60%, biogas production is optimal [41]. In this study, we decided to reduce the recirculating rate to 0.45 because the aim was to retain an active microbial population inside the reactor without optimizing biogas production.
Equations used to calculate the inlet volumetric flow rate were given in a previous study [34]. The resulting OLR was 6, 8, and 13 gVS/(L d), while the load of total N was 0.19, 0.24, and 0.26 gN/(m3 d) for S1, S2, and S3, respectively. The PFR operated with an average TS and VS content were 34.04 ± 5.36% and 77.42 ± 5.59% (n = 170), respectively.

2.4. Analytical Measurements

The feedstocks were comprehensively characterized in terms of their physical-chemical properties and bromatological composition (e.g., lignin, cellulose, carbohydrates, proteins, fats, oil, and grease). The methods were described in Pecorini et al. [9] and, for this reason, are not reported here. The same properties were measured on the digestate.
Physical-chemical characterization of feedstocks and digestate included daily measurement of the moisture, TS, volatile solids (VS) content, and pH based on standard methods [42].
Biochemical methane potential (BMP) tests were performed to preliminarily assess the methane production of OFMSW mixed with GW. BMP tests were performed by applying the method developed by Angelidaki et al. [35] and adapted by Pecorini et al. [34,43,44].
The TAN, FA, and alkalinity were measured weekly on the digestate after centrifugation at 13,500 rpm for 20 min and filtration at 0.45 µm. The supernatant was diluted 500 times, and the concentration of TAN was measured by an ammonia assay kit (HI93715-03, Hanna Instrument, Woonsocket, RI, USA) and a photometer (HI 83099, Hanna Instrument, Woonsocket, RI, USA). The FA concentration was calculated from the TAN concentration, pH, and temperature of the digestate using the equation reported by Rajagopal et al. [23]. Alkalinity was measured on an undiluted supernatant by applying a two-endpoints titration method (i.e., pH = 5.75 for partial alkalinity (PA), pH = 4.3 for total alkalinity (TA)) and a dosage of 1 M hydrochloric acid (HCl) [45]. The difference between the TA and PA is the intermediate alkalinity (IA), referring to the organic acids within the digestate. The VFA concentration was measured daily on the digestate by gas chromatography (7890B, Agilent Technology, Santa Clara, CA, USA) [37]. The specific VFAs detected were acetic, propionic, butyric, iso-butyric, valeric, isovaleric, and caproic acids. The gas carrier was hydrogen, and the instrument was equipped with a CPFFAP column (0.25 mm/0.5 mm/30 m) and a flame ionization detector (250 °C). The temperature started from 60 °C and reached 250 °C at a rate of 20 °C/min, and 500 mL of filtrate was blended with isoamyl alcohol (1.00179, Merck KGaA, Darmstadt, Germany) at a volumetric ratio of 1:1, followed by 200 mL of phosphate buffer solution (pH 2.1), sodium chloride, and 10 mL of hexanoic-D11 acid solution (10,000 ppm), which was used as the internal standard. A Mortexer™ MultiHead vortexer (Z755613-1 EA, Merck KGaA, Darmstadt, Germany) was used for 10 min, and an auto-sampler inserted the liquid suspension in the gas chromatograph.
The aerobic and anaerobic biological stability of the digestate were evaluated in accordance with European Fertilizer Regulation 1009/2019 [15]. The oxygen uptake rate (OUR) was used as an aerobic stability index, and the residual biogas potential (RBP) was applied to assess the anaerobic stability. The OUR assessed the oxygen required to oxidize the residual organic matter within the sample, and Oxitop®-IDS instrumentation (Xylem Analytics Germany Sales GmbH & Co., Oberbayern, Germania) was used to perform the analysis in accordance with UNI EN 16087-1:2020 [46]. The RBP estimated the residual biogas production of an organic substrate in accordance with UNI/TS 11703:2018 [47].

2.5. Peformance Evaluation

The stability parameters, biogas productivity, and VS reduction efficiency (REVS) were used to assess the process performance.
The stability parameters included the pH, TA, IA, IA/PA ratio, total VFA concentration, total VFA/TA ratio, and biogas composition (e.g., CH4 and CO2 as an average on a daily basis). The biogas composition was periodically tested by gas chromatography (3000 Micro GC, INFICON, Bad Ragaz, Switzerland) [48].
Biogas productivity included the SGP, which was measured in NLbiogas/kgVS and was calculated as the daily biogas production divided by the daily mass of VS fed to the PFR, the SMP, which was measured in NLCH4/kgVS and was the SGP multiplied by the CH4 concentration, and the biogas production rate (GPR), namely the ratio between the daily biogas production and the reactor working volume, measured in NLbiogas/(Lr d).
A preliminary assessment of bioenergy recovery was performed. Pretreatments, pumping for feeding and recirculation, heating to maintain the thermophilic conditions, and mixing were not included. This study evaluated the specific bioenergy recovery (i.e., ER) and potential bioenergy generation (i.e., EG). ER was evaluated in terms of MJ/kgVS by multiplying the SMP and the lower heating value of CH4 (LHVCH4) as reported in the equation below:
ER = SMP × LHVCH4
The LHVCH4 was assumed to be 35.8 MJ/m3. EG was evaluated in terms of kWh/tOFMSW in accordance with Cesaro and Belgiorno [49].
REVS (%) was calculated with Equation (2):
REVS = (VSin − VSout)/VSin
where VSin is the mass on a wet basis of VS fed daily to the reactor and VSout is the mass on a wet basis of the volatile solid withdrawn daily from the digester.

2.6. Statistical Analysis

The Welch t-test was used to evaluate if changing the operating conditions with the scope of optimizing biogas production by reducing ammonia inhibition produced statistically different results. The Welch t-test compared the results achieved in terms of the process performance indicators (i.e., SGP, SMP, GPR, REVS, and ER) and stability parameters (pHout, pH1, pH2, T1, T2, total VFAs, TAN, and FA) by means of SPSS software (IBM, Armonk, New York, NY, USA). If the p-value results were lower than 0.05, then the outcomes were considered statistically different.

3. Results

3.1. Substrate and Inoculum

The inoculum and feedstock characteristics are reported in Table 2.
Regarding the OFMSW, the pH results were 4.4 ± 0.24, which is in line with the results of Pecorini et al. [9] but slightly lower than the 5.2 ± 0.95 and 5.1 ± 0.7 results reported by Campuzano and González-Martínez [6] and Fisgativa et al., respectively [50]. The nitrogen content (N) on a dry basis was 2.34 ± 0.1%, which is in the range of those typically found for OFMSW (e.g., 3.8–1.5%) [9,50,51]. The carbon content (C) on a dry basis was 41.85 ± 4.01%, which is in the low range commonly reported for food waste (51.3–37.6%) [51]. The GW had a pH equal to 6.37 ± 0.3, a C/N equal to 20.83 ± 1.53, and a high metal content.
The OFMSW and GW were poor in carbohydrates, which are an index of high biogas yields and rich in proteins which are the major source of N [10], and lignin, which is an indicator of low biogas production since lignin is a recalcitrant compound for anaerobic flora [52]. Indeed, the BMP results were 215.7 ± 5.41 NLCH4/kgVS, which is far lower than the average value of 415 ± 137.37 NLCH4/kgVS found for OFMSW [6]. As was just mentioned, this outcome reflects the unbalanced content of macromolecules and the low C/N ratio. The lignin content was 1.7 times higher than that in a previous study reporting on the characteristics of OFMSW on a global scale (e.g., 9.7 ± 5.3% on a volatile basis) [6].
The seed sludges had a physical-chemical composition in line with the values reported in previous studies, but the TAN was 4070 ± 610 mg/kg, a result above the inhibition limit of 3000 mg/L for the AD process [10]. At the same time, the concentration of calcium (Ca) also exceeded the inhibition limit for dry AD, which was reported to be 8000 mg/L [10,22].

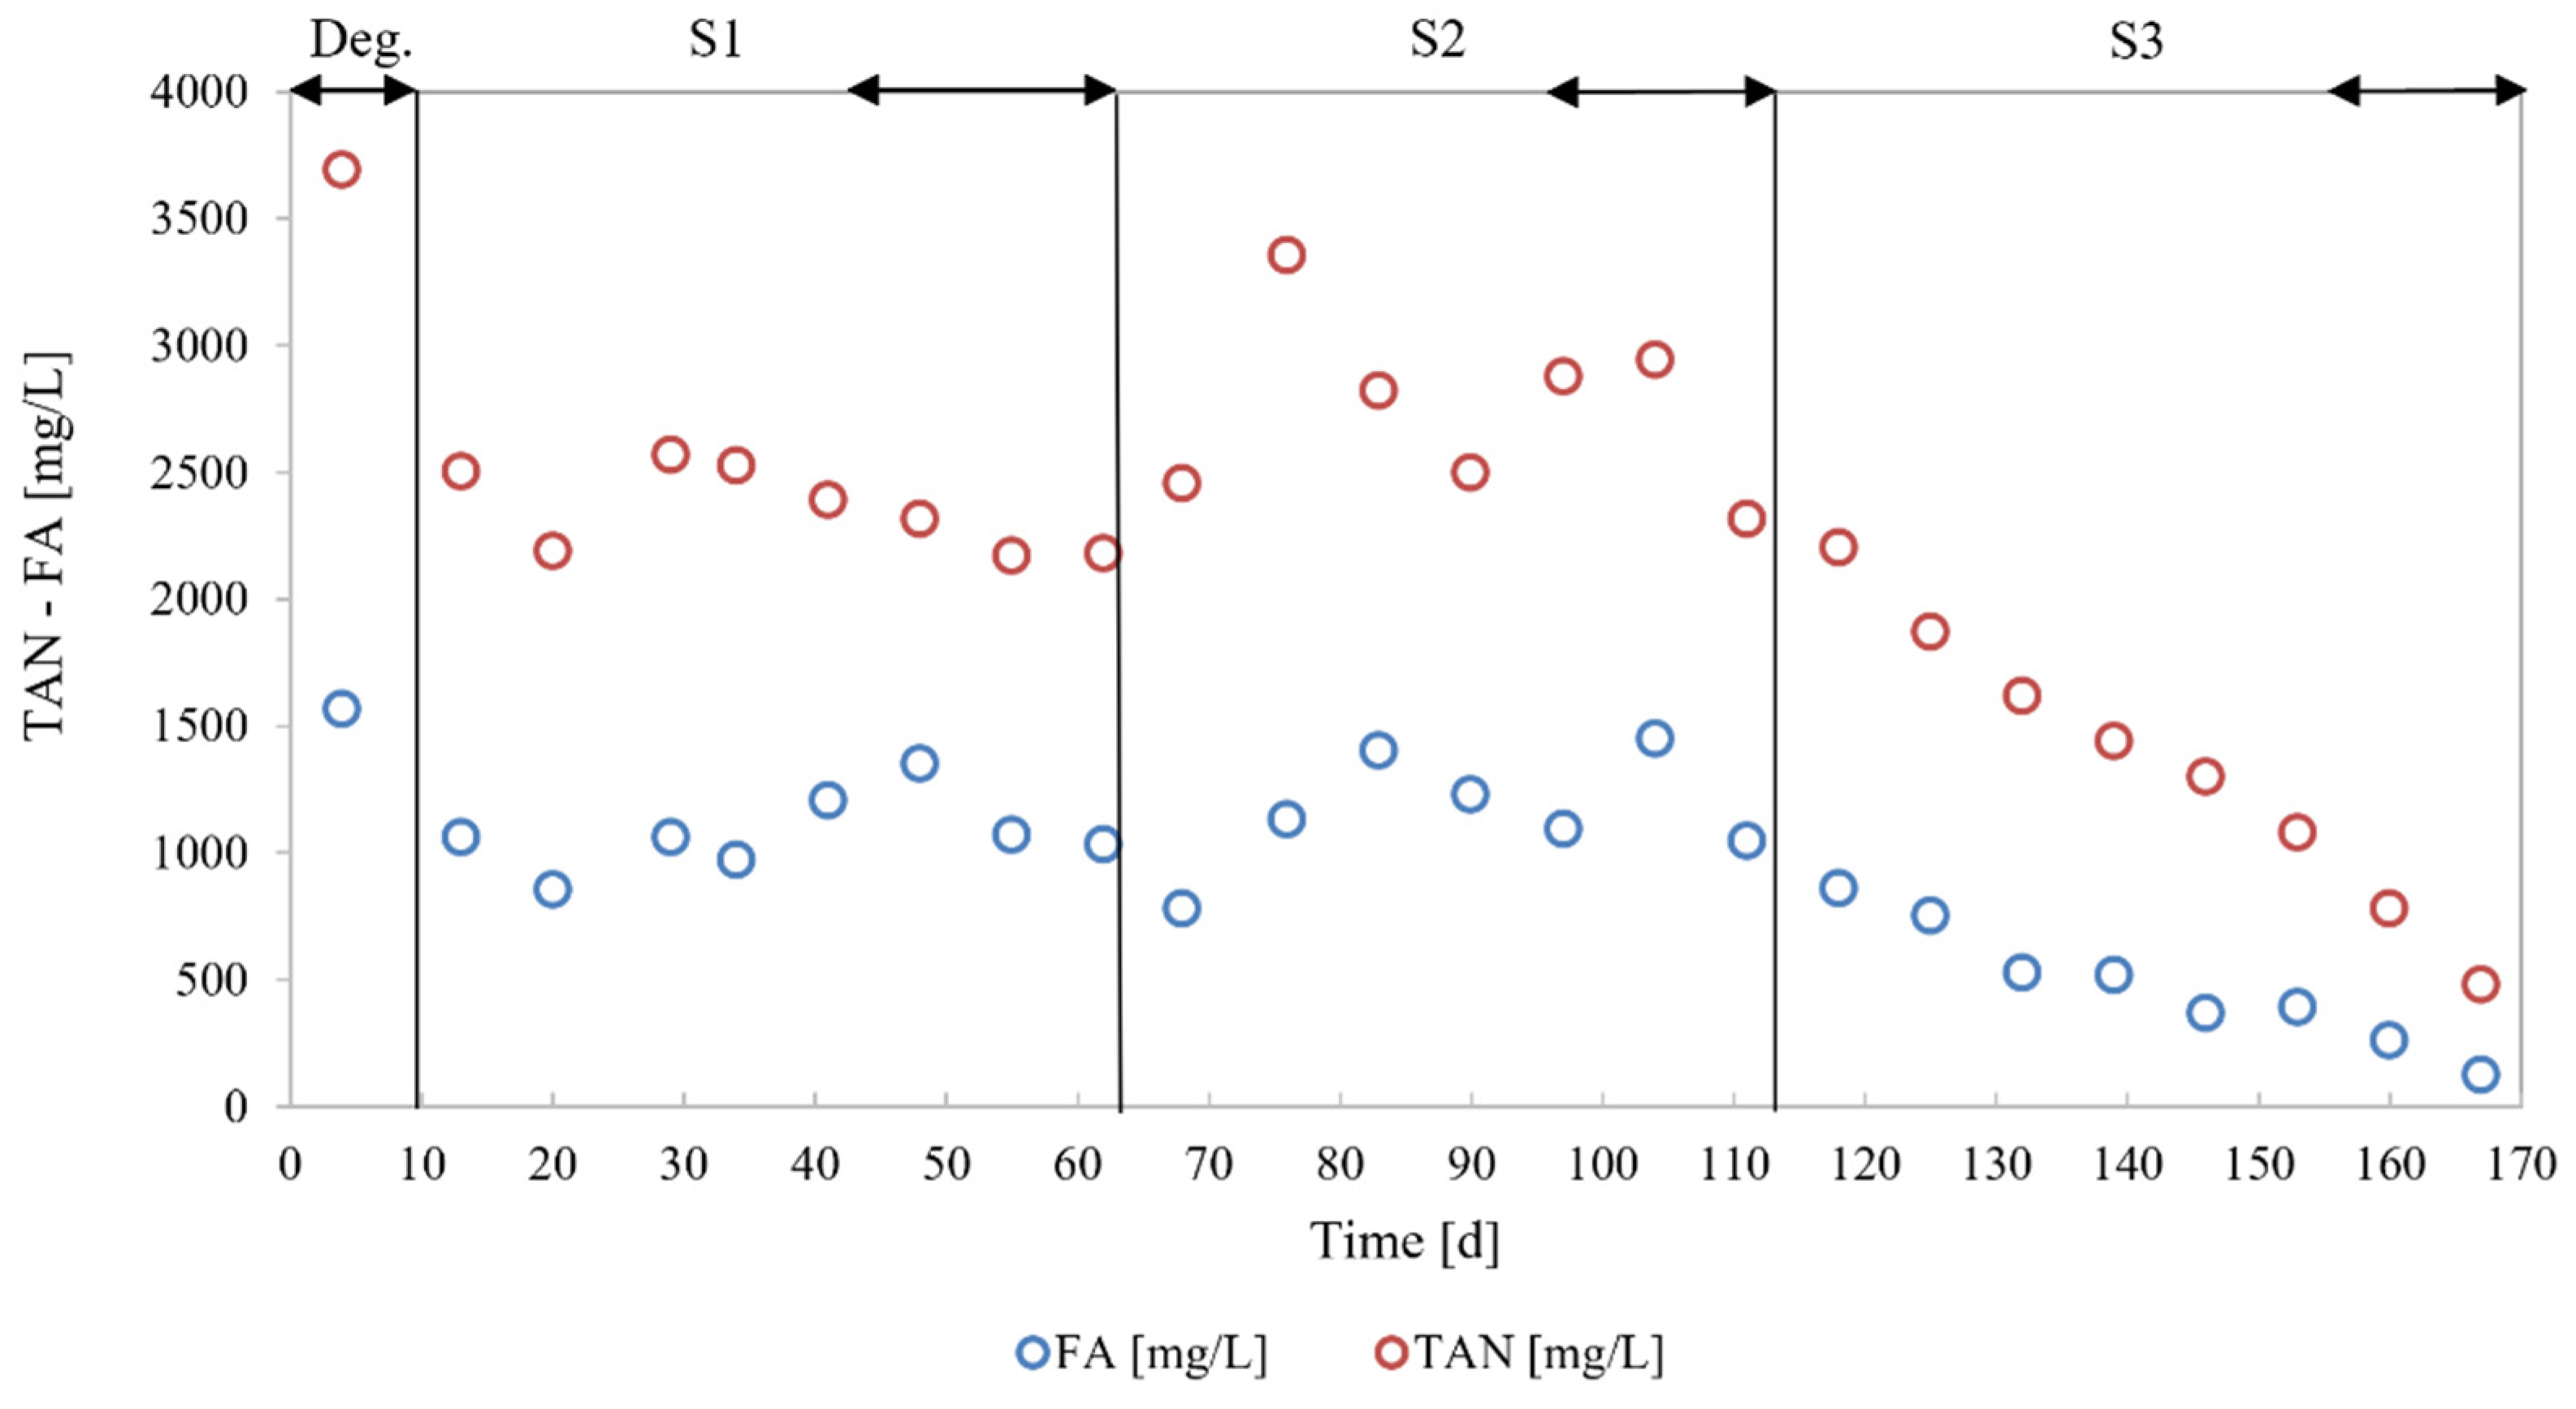
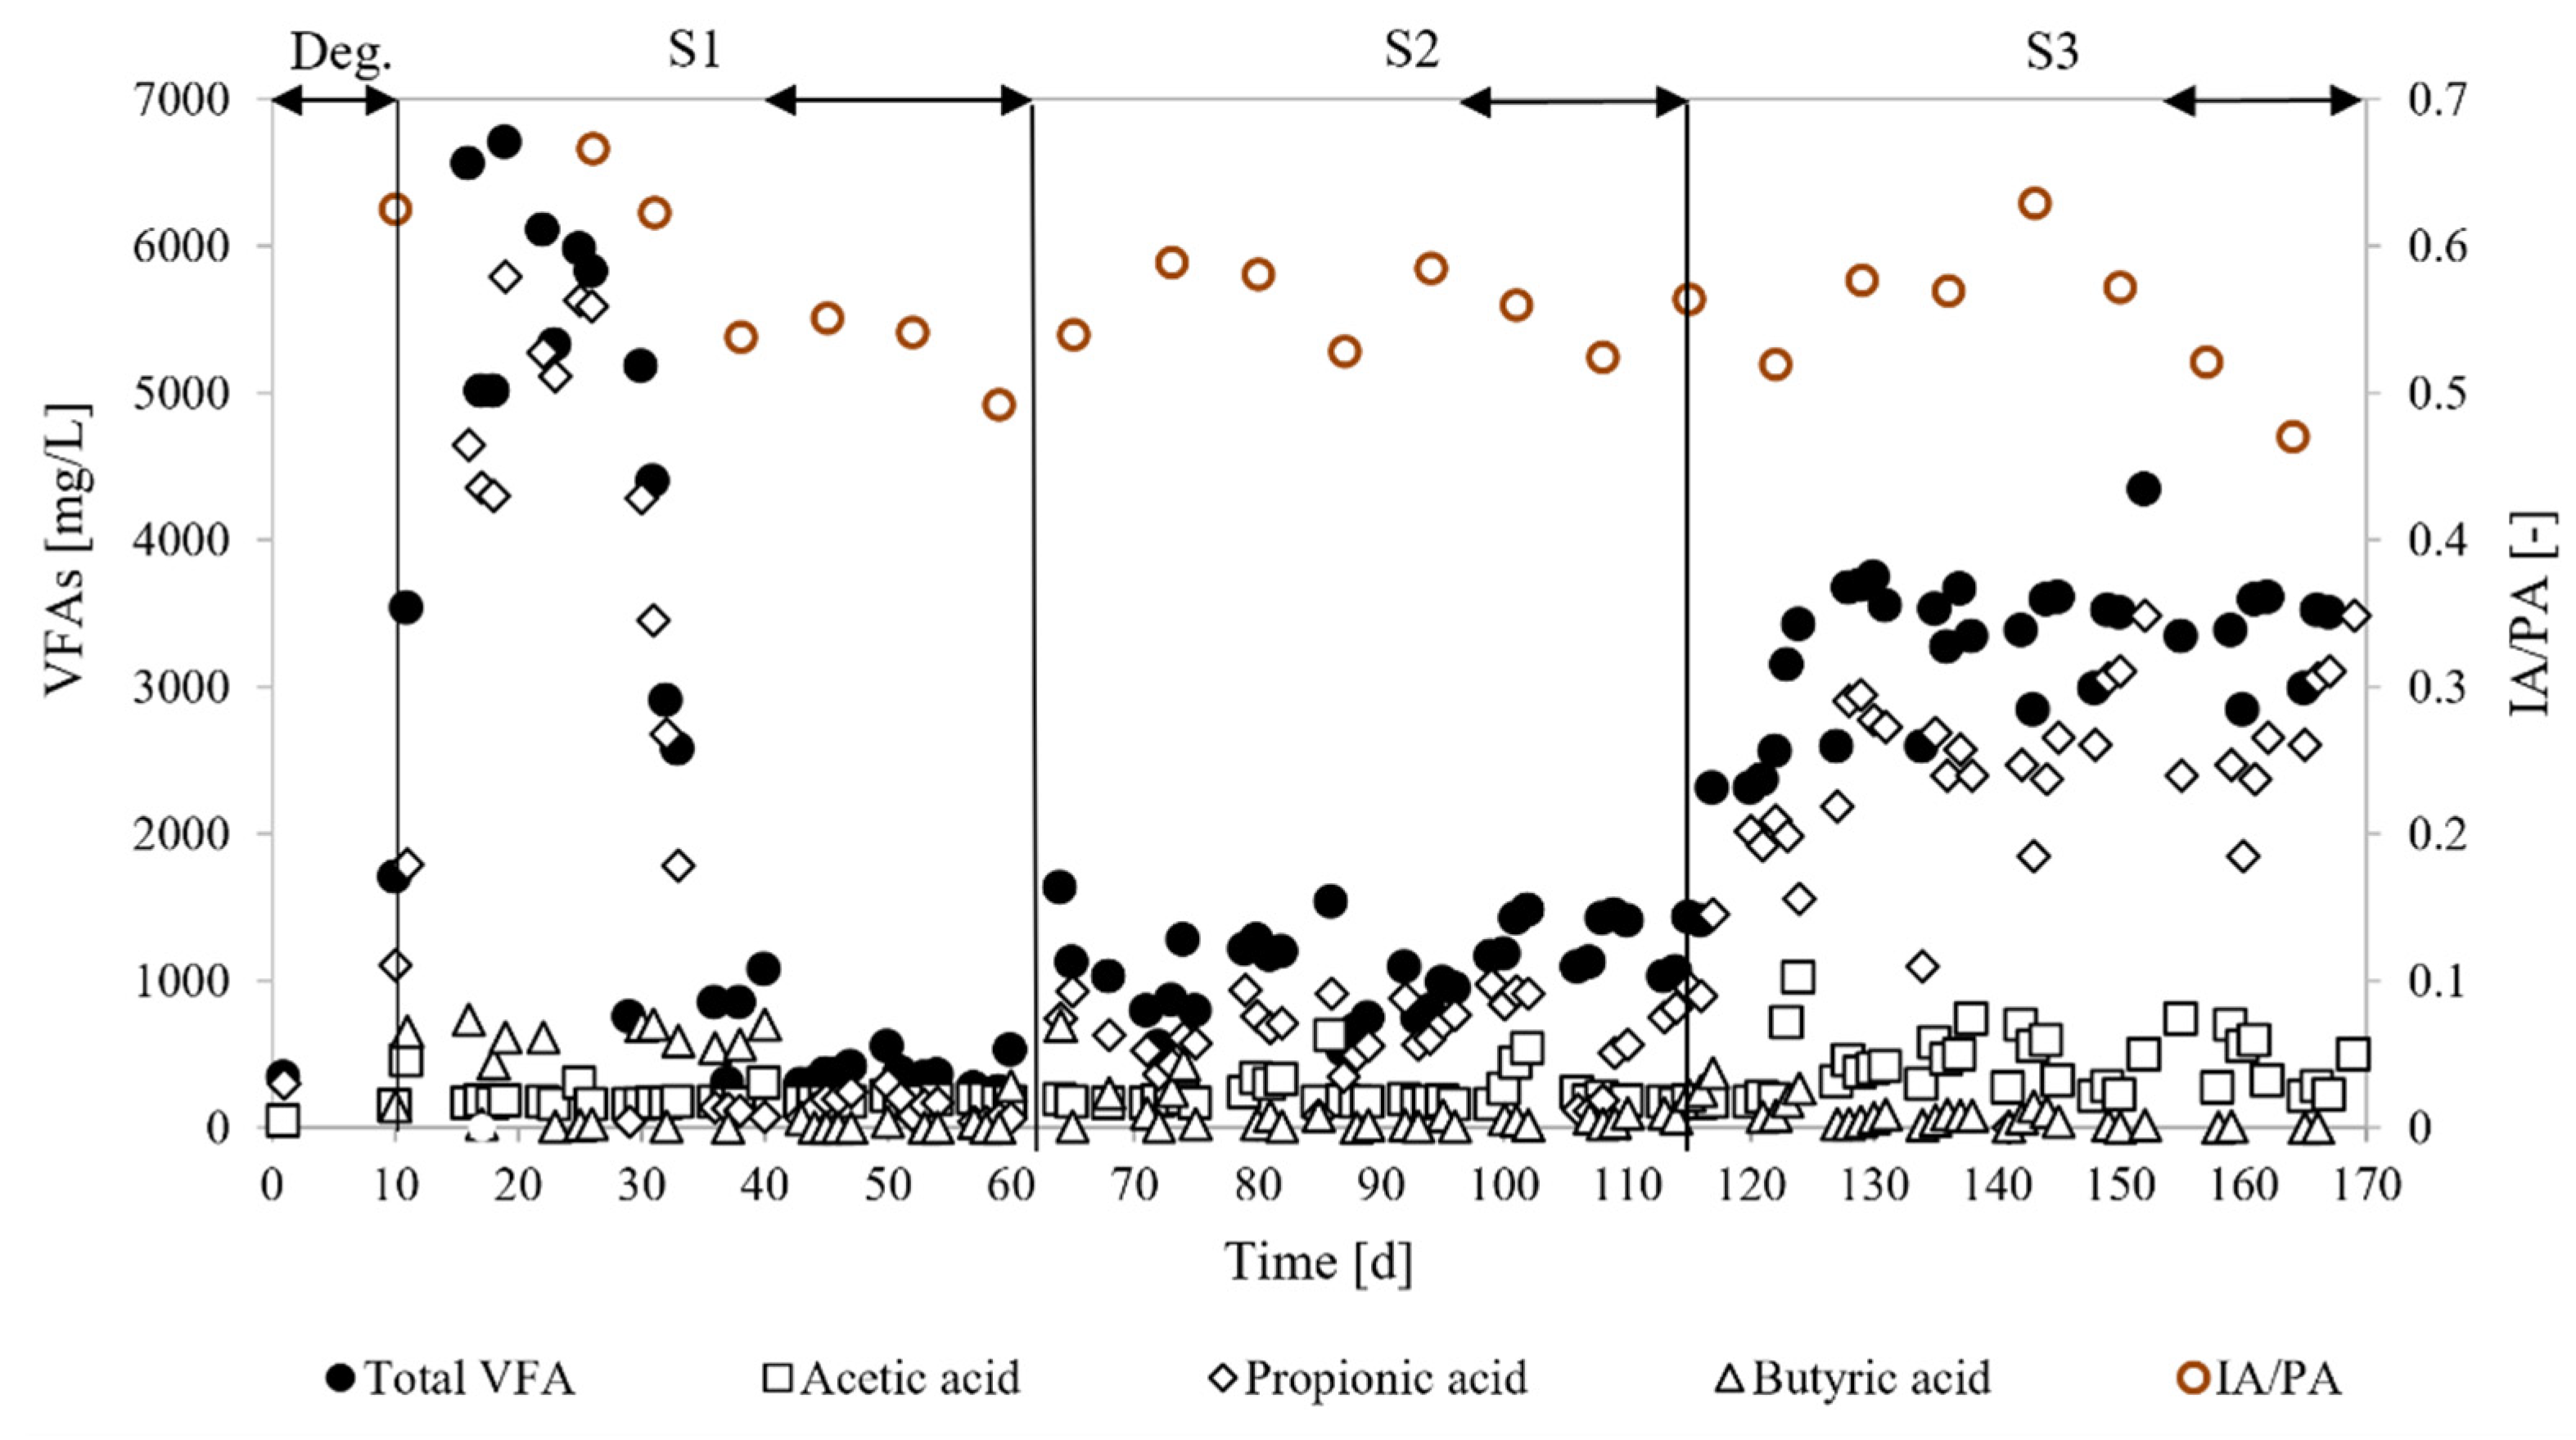
3.2. Process Stability

The process’s stability was monitored in terms of pH, TA, IA, IA/PA ratio, VFA concentration, and biogas composition (e.g., CH4 and CO2). Table 3 shows the results as averages and standard deviations calculated on the last HRT of each scenario. The pH at the outlet section (pHout) oscillated between 7.91 and 8.56, results above the optimal values of 7.5–8 for dry AD. This value is commonly found when ammonia inhibition occurs [10]. Comparable values were found at sampling port 1 (pH1) and sampling port 2 (pH2). S2 showed the highest pH1 and pH2 among the other scenarios. This seemed to be principally associated with the addition of GW as structural material, which had a pH 1.45 times higher than solely OFMSW. On the other hand, pHout significantly decreased (p < 0.05) during S3.
Figure 2 reports the weekly trend of the TAN and FA concentrations. When operating with solely OFMSW (S1) and adding GW as a structural material (S2), the concentration of TAN was from 1.5 to 1.8 times higher than the inhibition threshold (i.e., 1500–3000 mg/L). During S3, the TAN concentration decreased on average by 72% and 77% with respect to S1 and S2, respectively. S2 attained the highest TAN concentration, being equal to 3356 mg/L. Concerning FA, the concentration was above 800 mg/L in S1 and S2, and during S3, it decreased by 83% and 84% with respect to S1 and S2, respectively.
The system showed an optimal buffer capacity. The TA oscillated from 24,618 to 14,743 mgCaCO3/L, the PA ranged between 15,487 and 9258 mgCaCO3/L, and the IA ranged between 9130 and 5351 mgCaCO3/L. The TA was able to counteract the increment of the VFA concentration similarly to a previous study on the dry AD of food waste and rice husks [25]. S2 showed the highest TA values, as it increased by 5% and 24% when compared with S1 and S3, respectively. Again, this result seems to be related to the addition of structural material. In fact, the GW showed a slightly higher TA (+7.2%) than OFMSW.
Figure 3 illustrates the weekly evaluation of IA/PA together with the daily concentration of total VFAs and acetic, propionic, and butyric acid.
The IA/PA ratio varied between 0.67 and 0.49, a result higher than the optimum value of 0.3–0.4 recommended for reactor success, but it was lower than 0.8, which may lead to reactor failure [10,53,54]. The comparison of the scenarios did not show a clear trend for this parameter. The maximum IA/AP value (e.g., 0.67) corresponded to the highest VFA concentration at the beginning of S1.
The total VFA concentration exhibited the highest values during the transient state of S1 and then decreased under 1000 mg/L because of degradation. During S2 and S3, the total and specific VFA concentrations increased by 2.9 and 8.5 times, respectively, with respect to S1. Among the specific VFAs, propionic acid prevailed, followed by acetic and butyric acids in all scenarios except for S1. The propionate ranged between 34.2% (S1) and 79.7% (S3). Isobutyric and isovaleric acids were detected, but the concentrations never exceeded 553 and 851 mg/L, respectively.
Figure 4 illustrates the daily concentrations of CH4 and CO2. CH4 increased by 1% and 4% from S2 to S3 and from S1 to S2, respectively. This highlights the positive effect of reducing ammonia inhibition by changing the inlet feedstock.

3.3. Process Performance

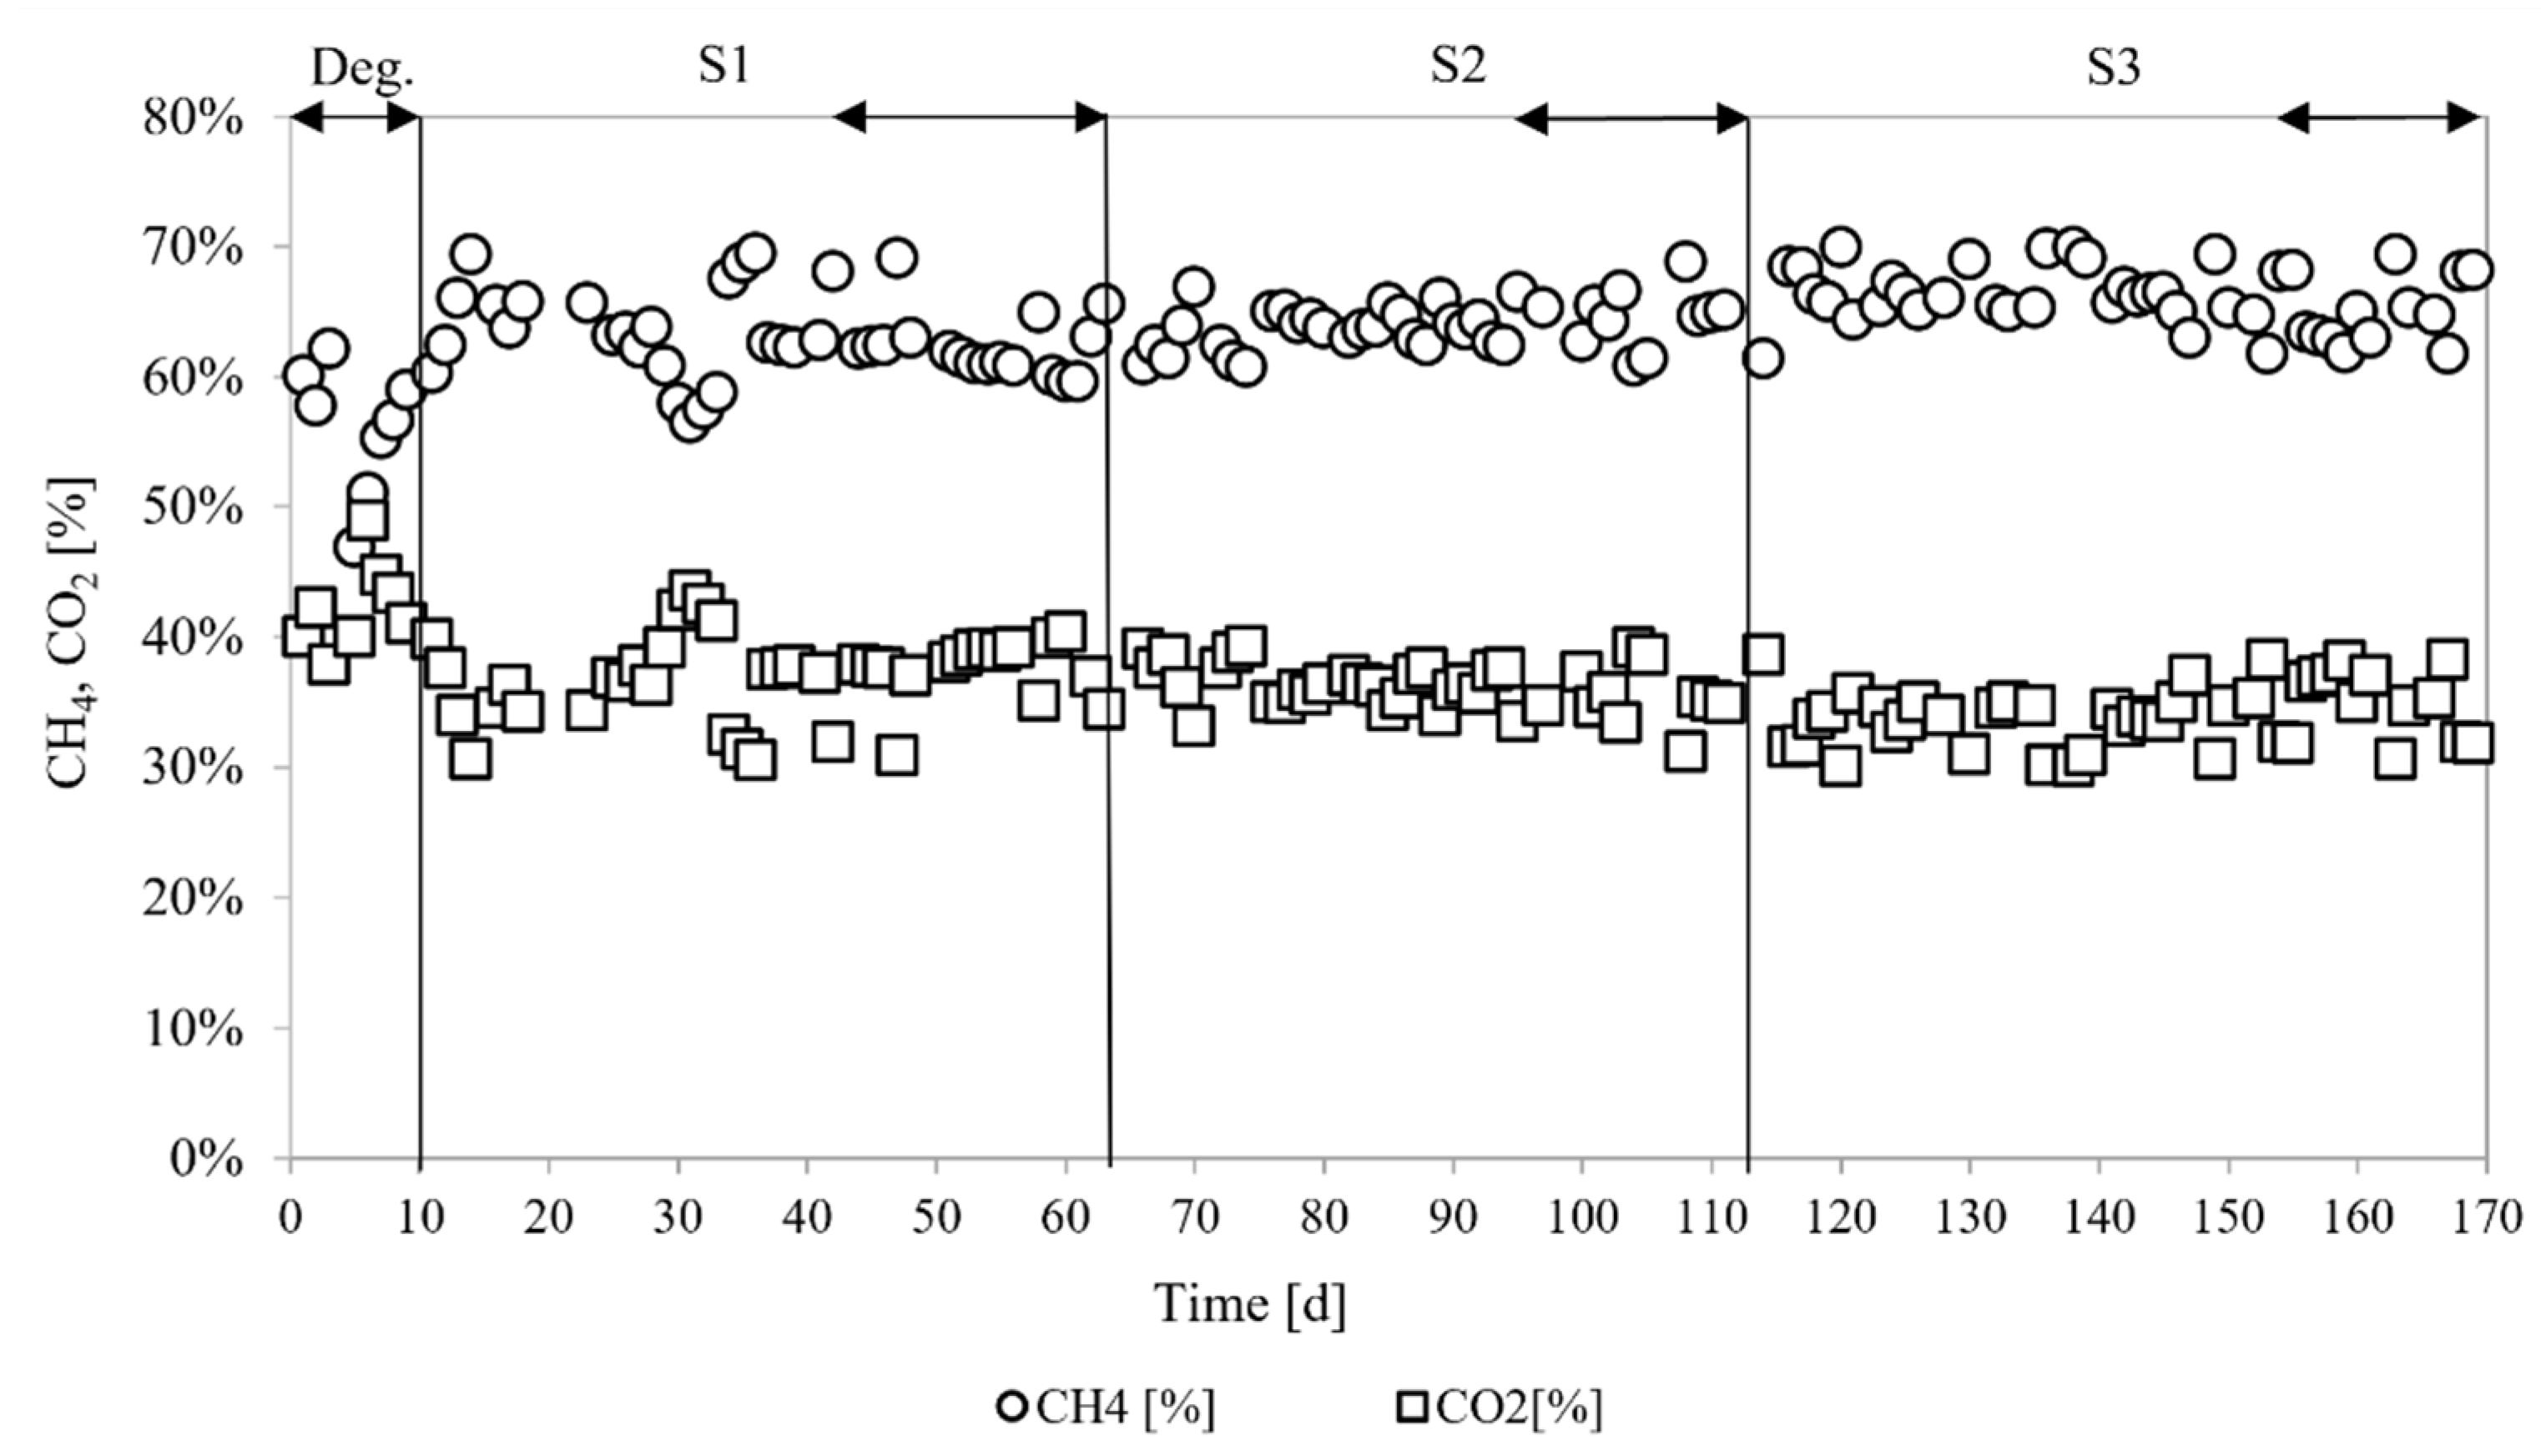
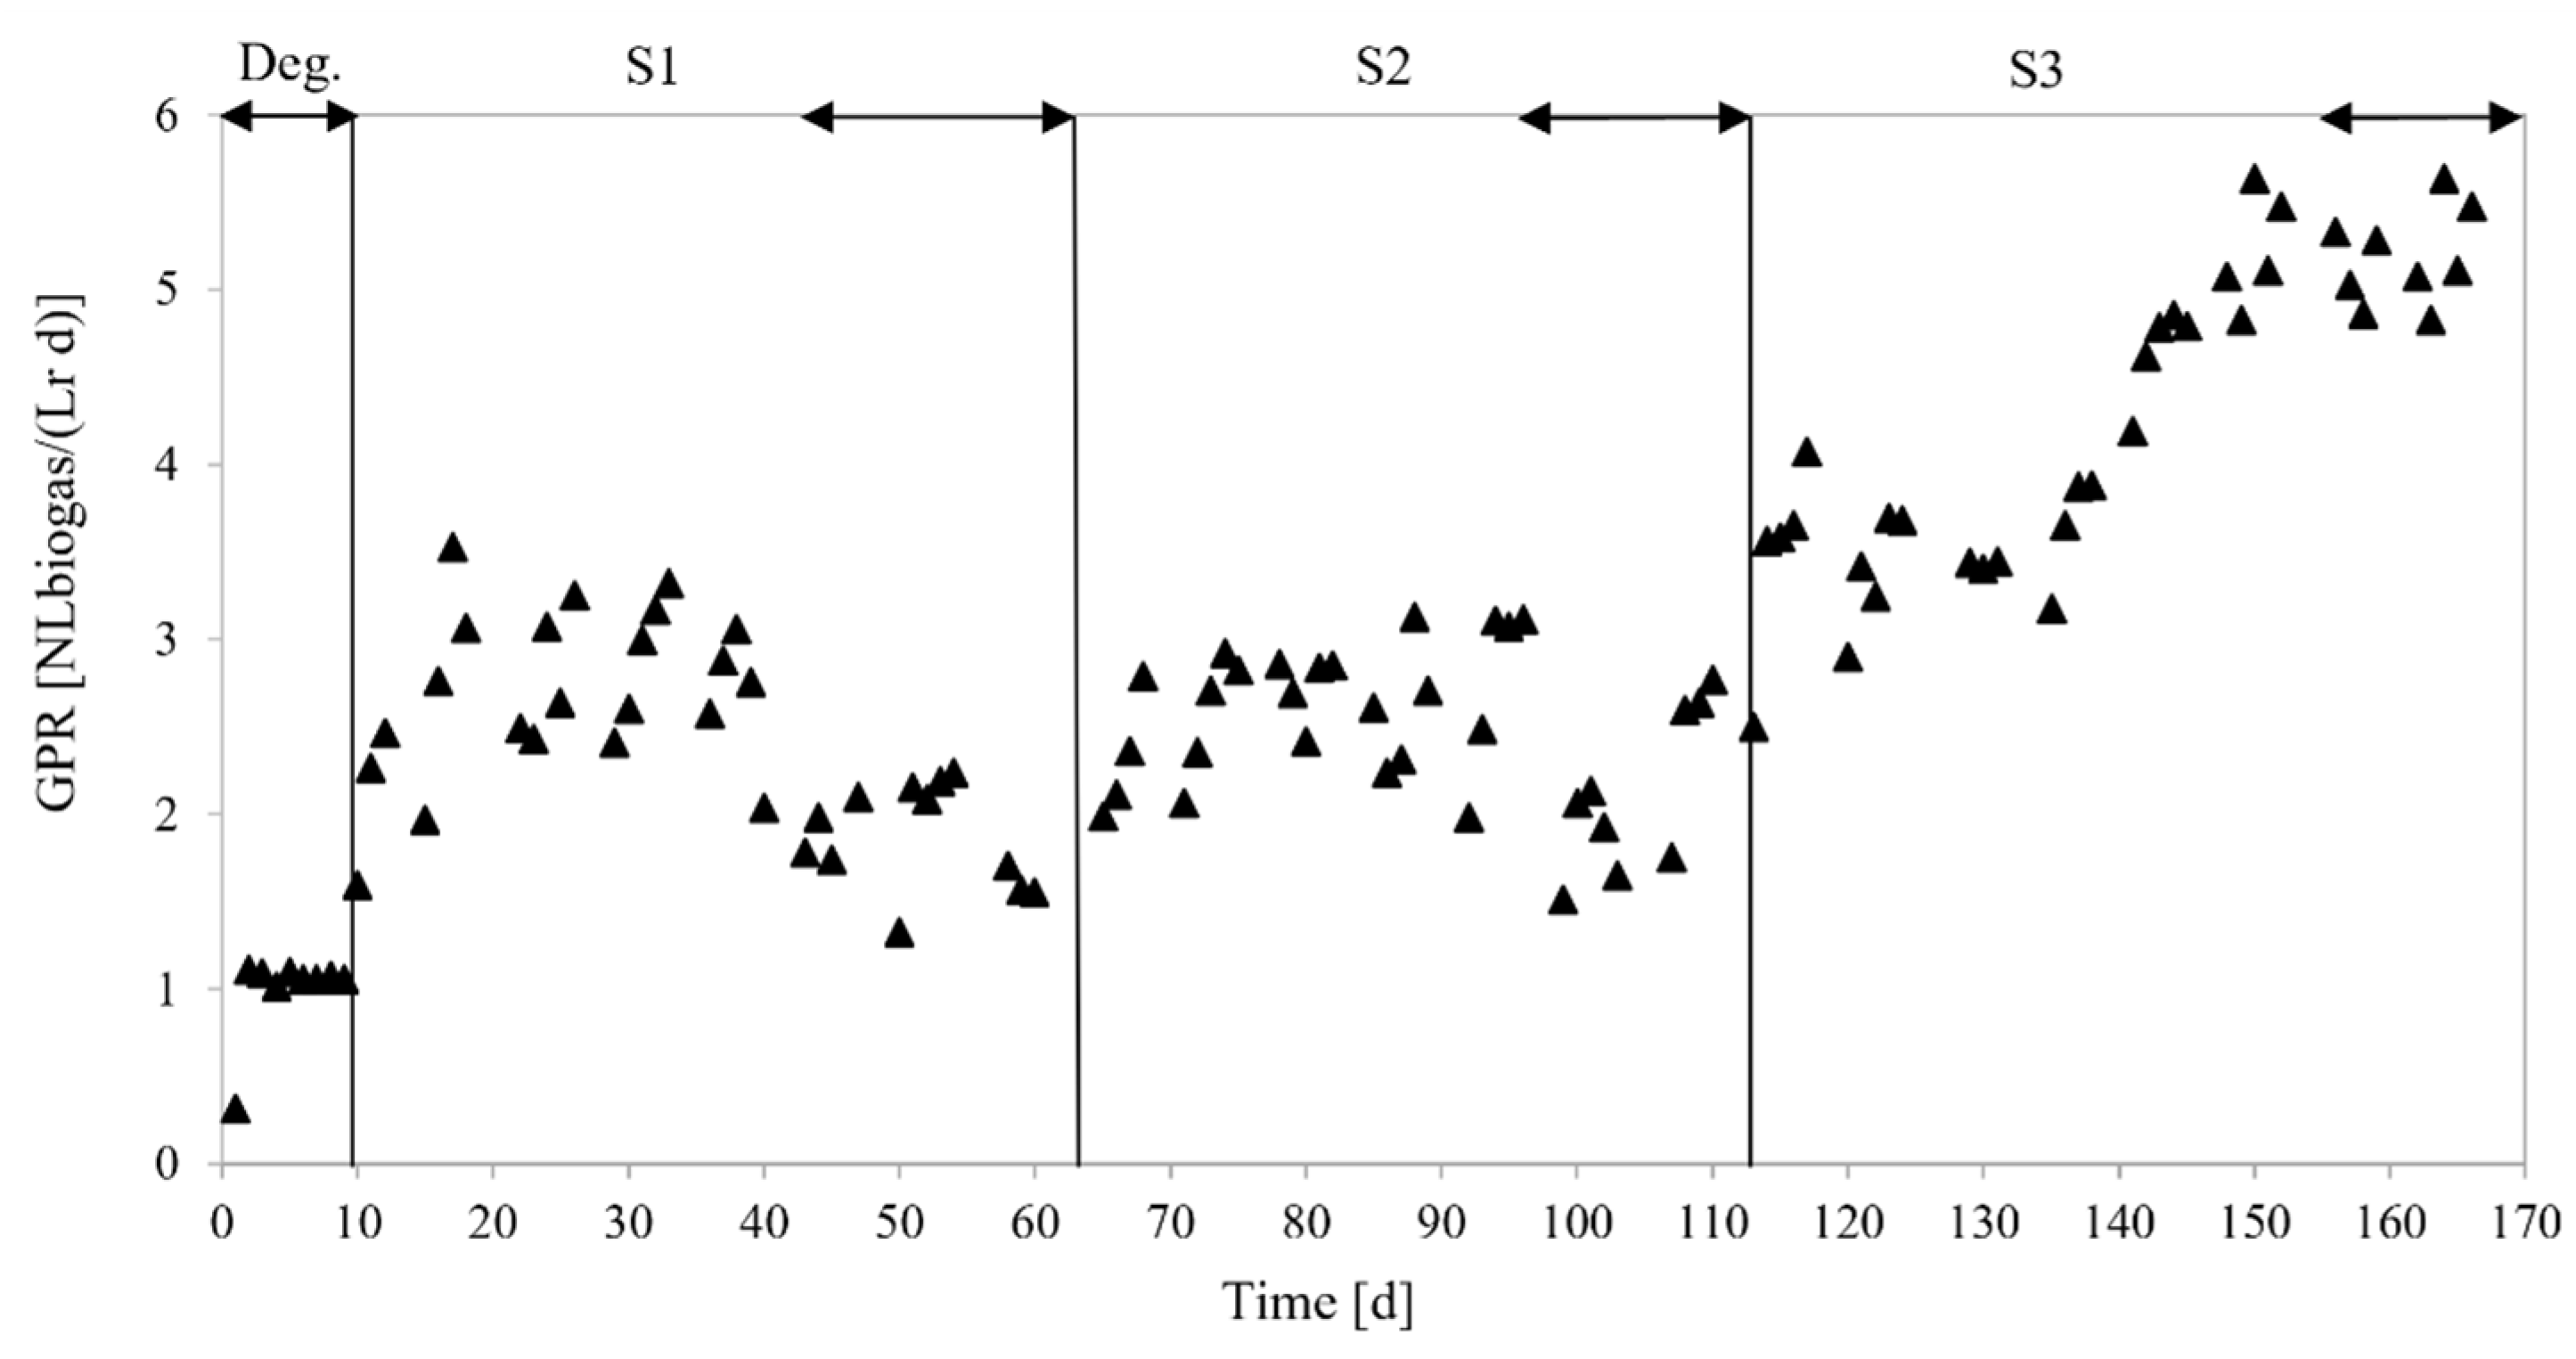
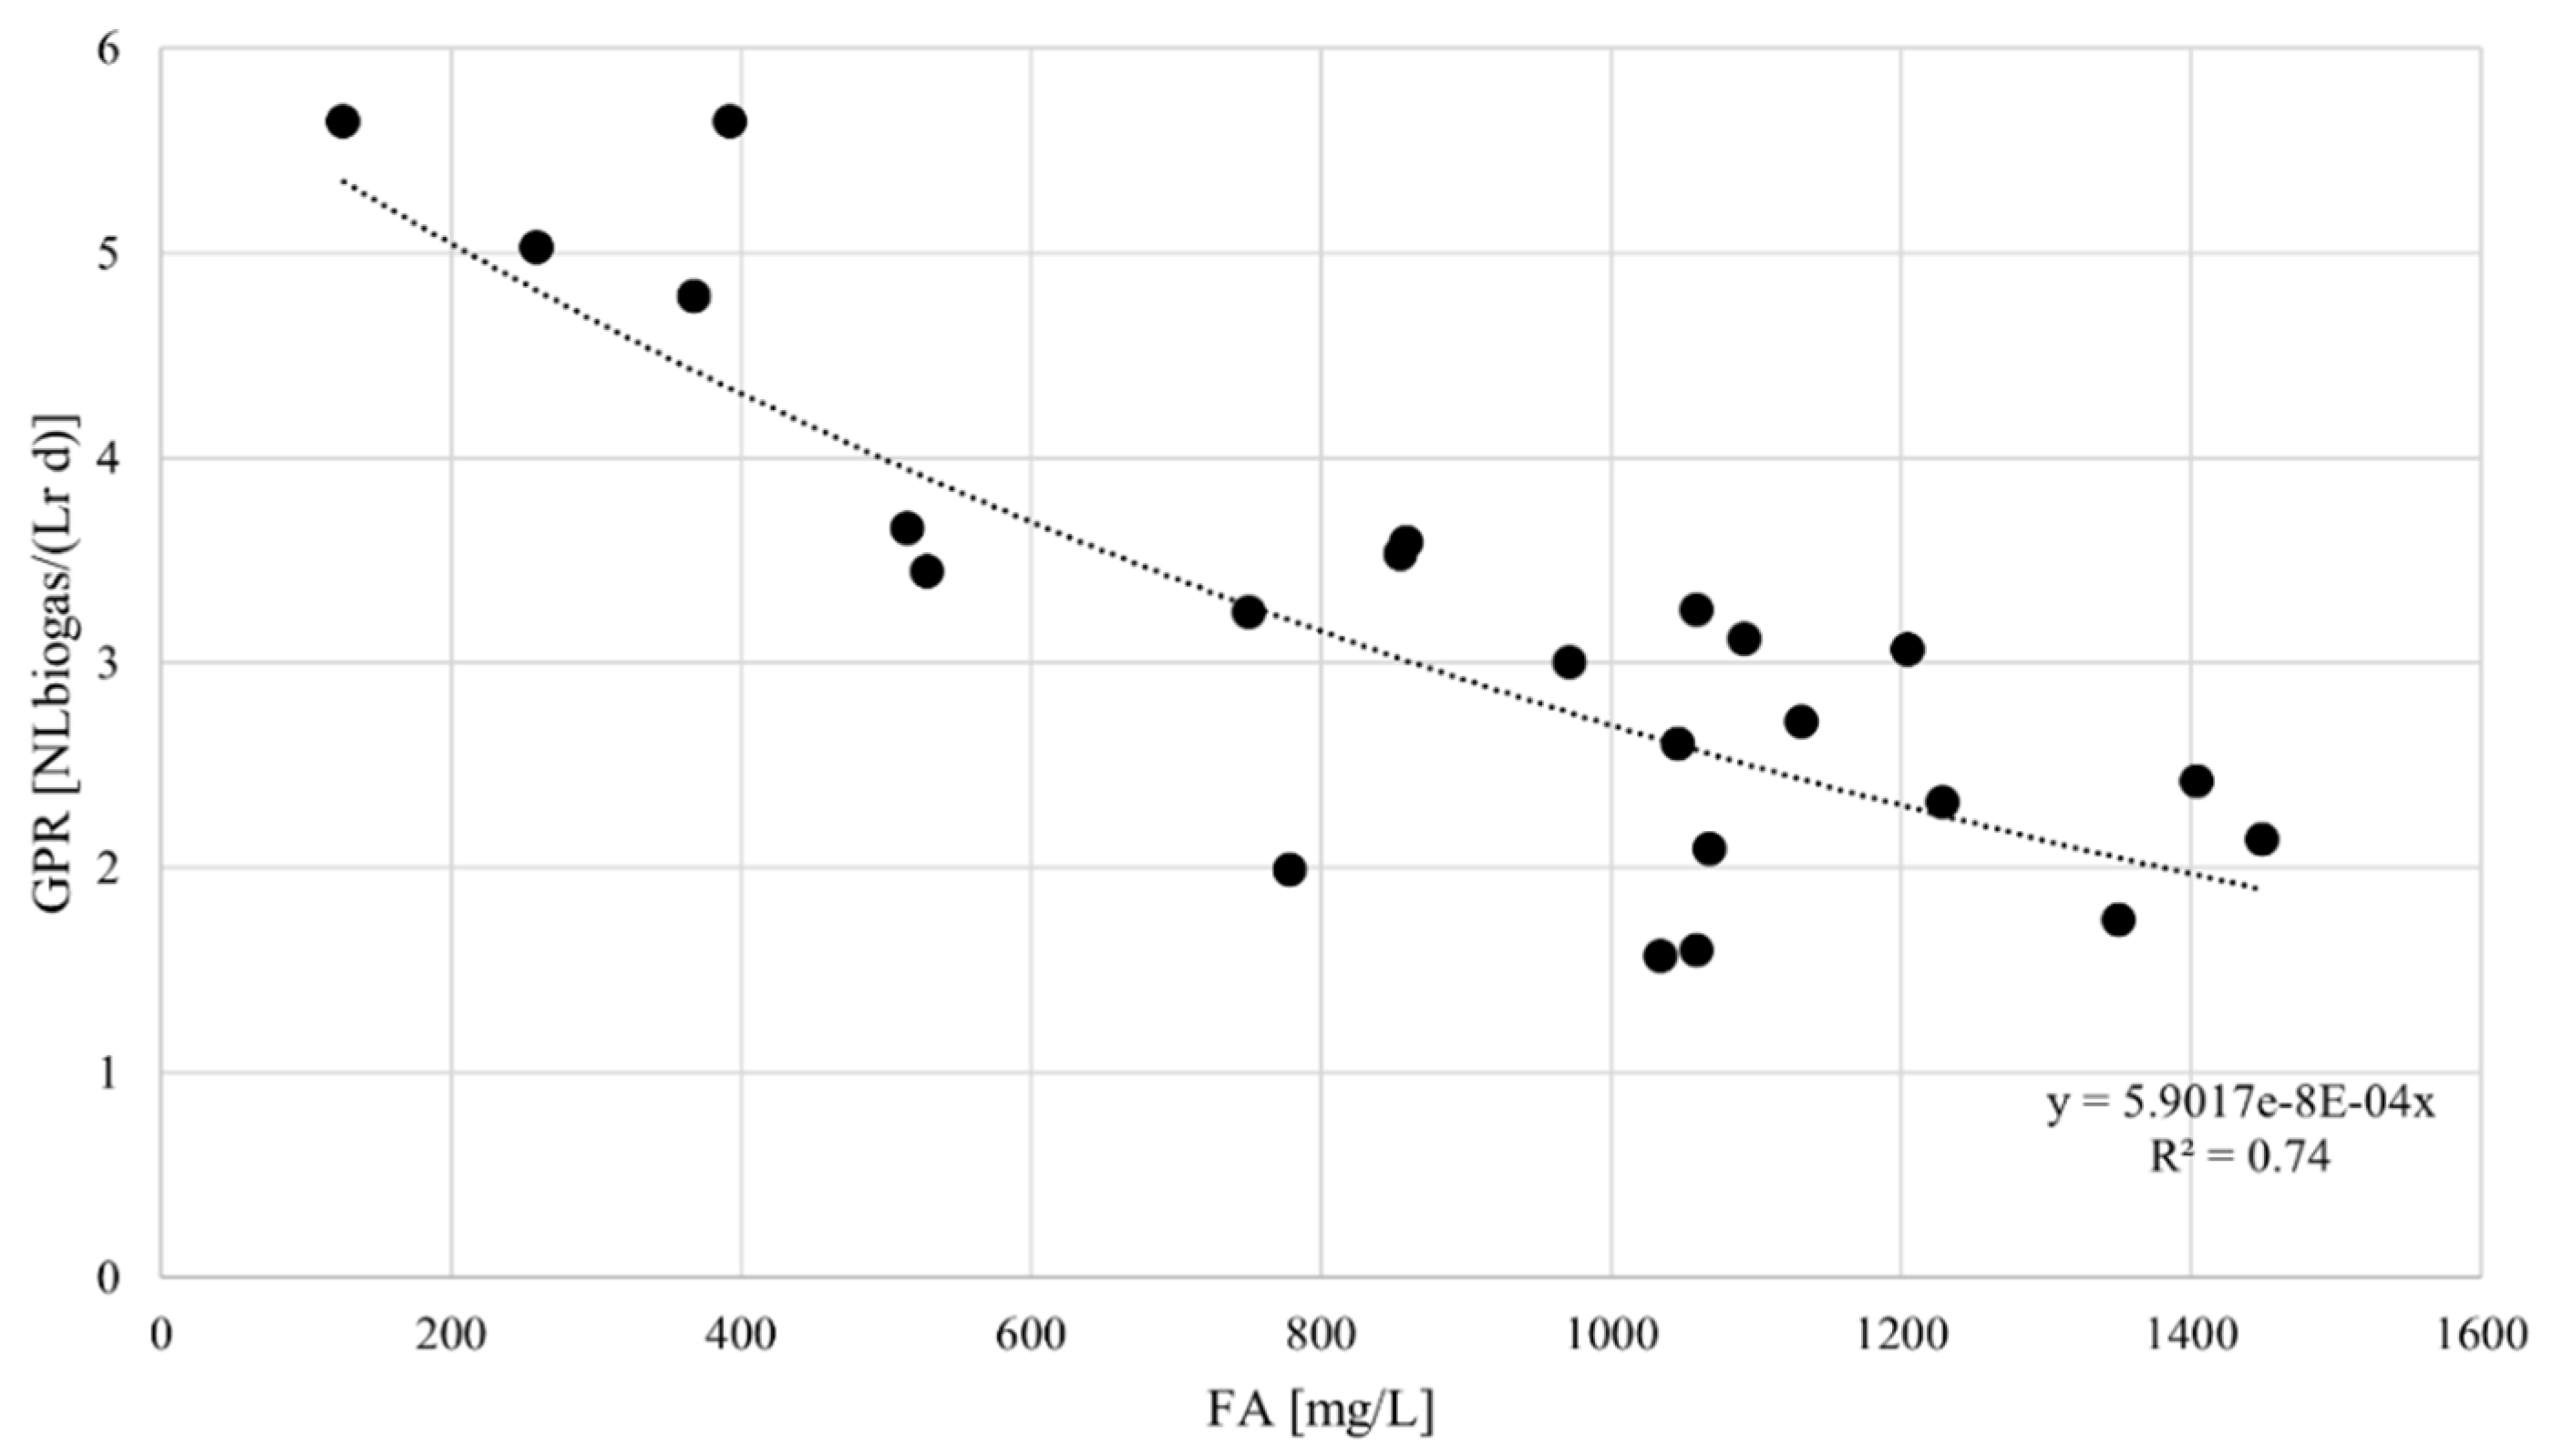
3.3.1. Biogas Yields

Process performances were assessed by evaluating the SGP, SMP, GPR, and REVS.
The SGP results on average were 251.06 ± 66.96, 322.67 ± 64.78, and 361.27 ± 30.52 NLbiogas/kgVS for S1, S2, and S3, respectively, while the SMP was equal to 151.15 ± 47.97, 202.65 ± 37.46, and 229.51 ± 25.37 for S1, S2, and S3, respectively. Despite the SGP and the SMP increasing from S1 to S3, the Welch t-test revealed that this result was not statistically significant. However, the SGP and SMP increased by 44% and 52%, respectively, from S3 to S1. This result reflects the positive effect of adding sucrose, which increased the C/N ratio of the inlet substrate and is also a more readily biodegradable substrate than OFMSW and GW. A more remarkable result of such a change was found for the GPR, whose daily trend is illustrated in Figure 5. The GPR was, on average, 1.88 ± 0.28 NLbiogas/(L d) during S1, increasing to 2.34 ± 0.55 during S2 and reaching the highest value of 5.11 ± 0.27 NLbiogas/(L d) during S3, results that were statistically different from S1 and S2 (e.g., increasing by 117% and 172%, respectively).
Figure 6 illustrates the relationship between GPR and FA that was found by analyzing the experimental results. The parameters show an exponential relationship with a determination coefficient R2 of 0.74.
Figure 7 illustrates the daily trend of REVS. In more detail, the results, on average, were 36.84 ± 2.46%, 39.77 ± 4.63%, and 54.07 ± 3.28% for S1, S2, and S3, respectively. REvs significantly (p < 0.05) increased by 26% and 44% in S3 compared with S2 and S1, respectively.

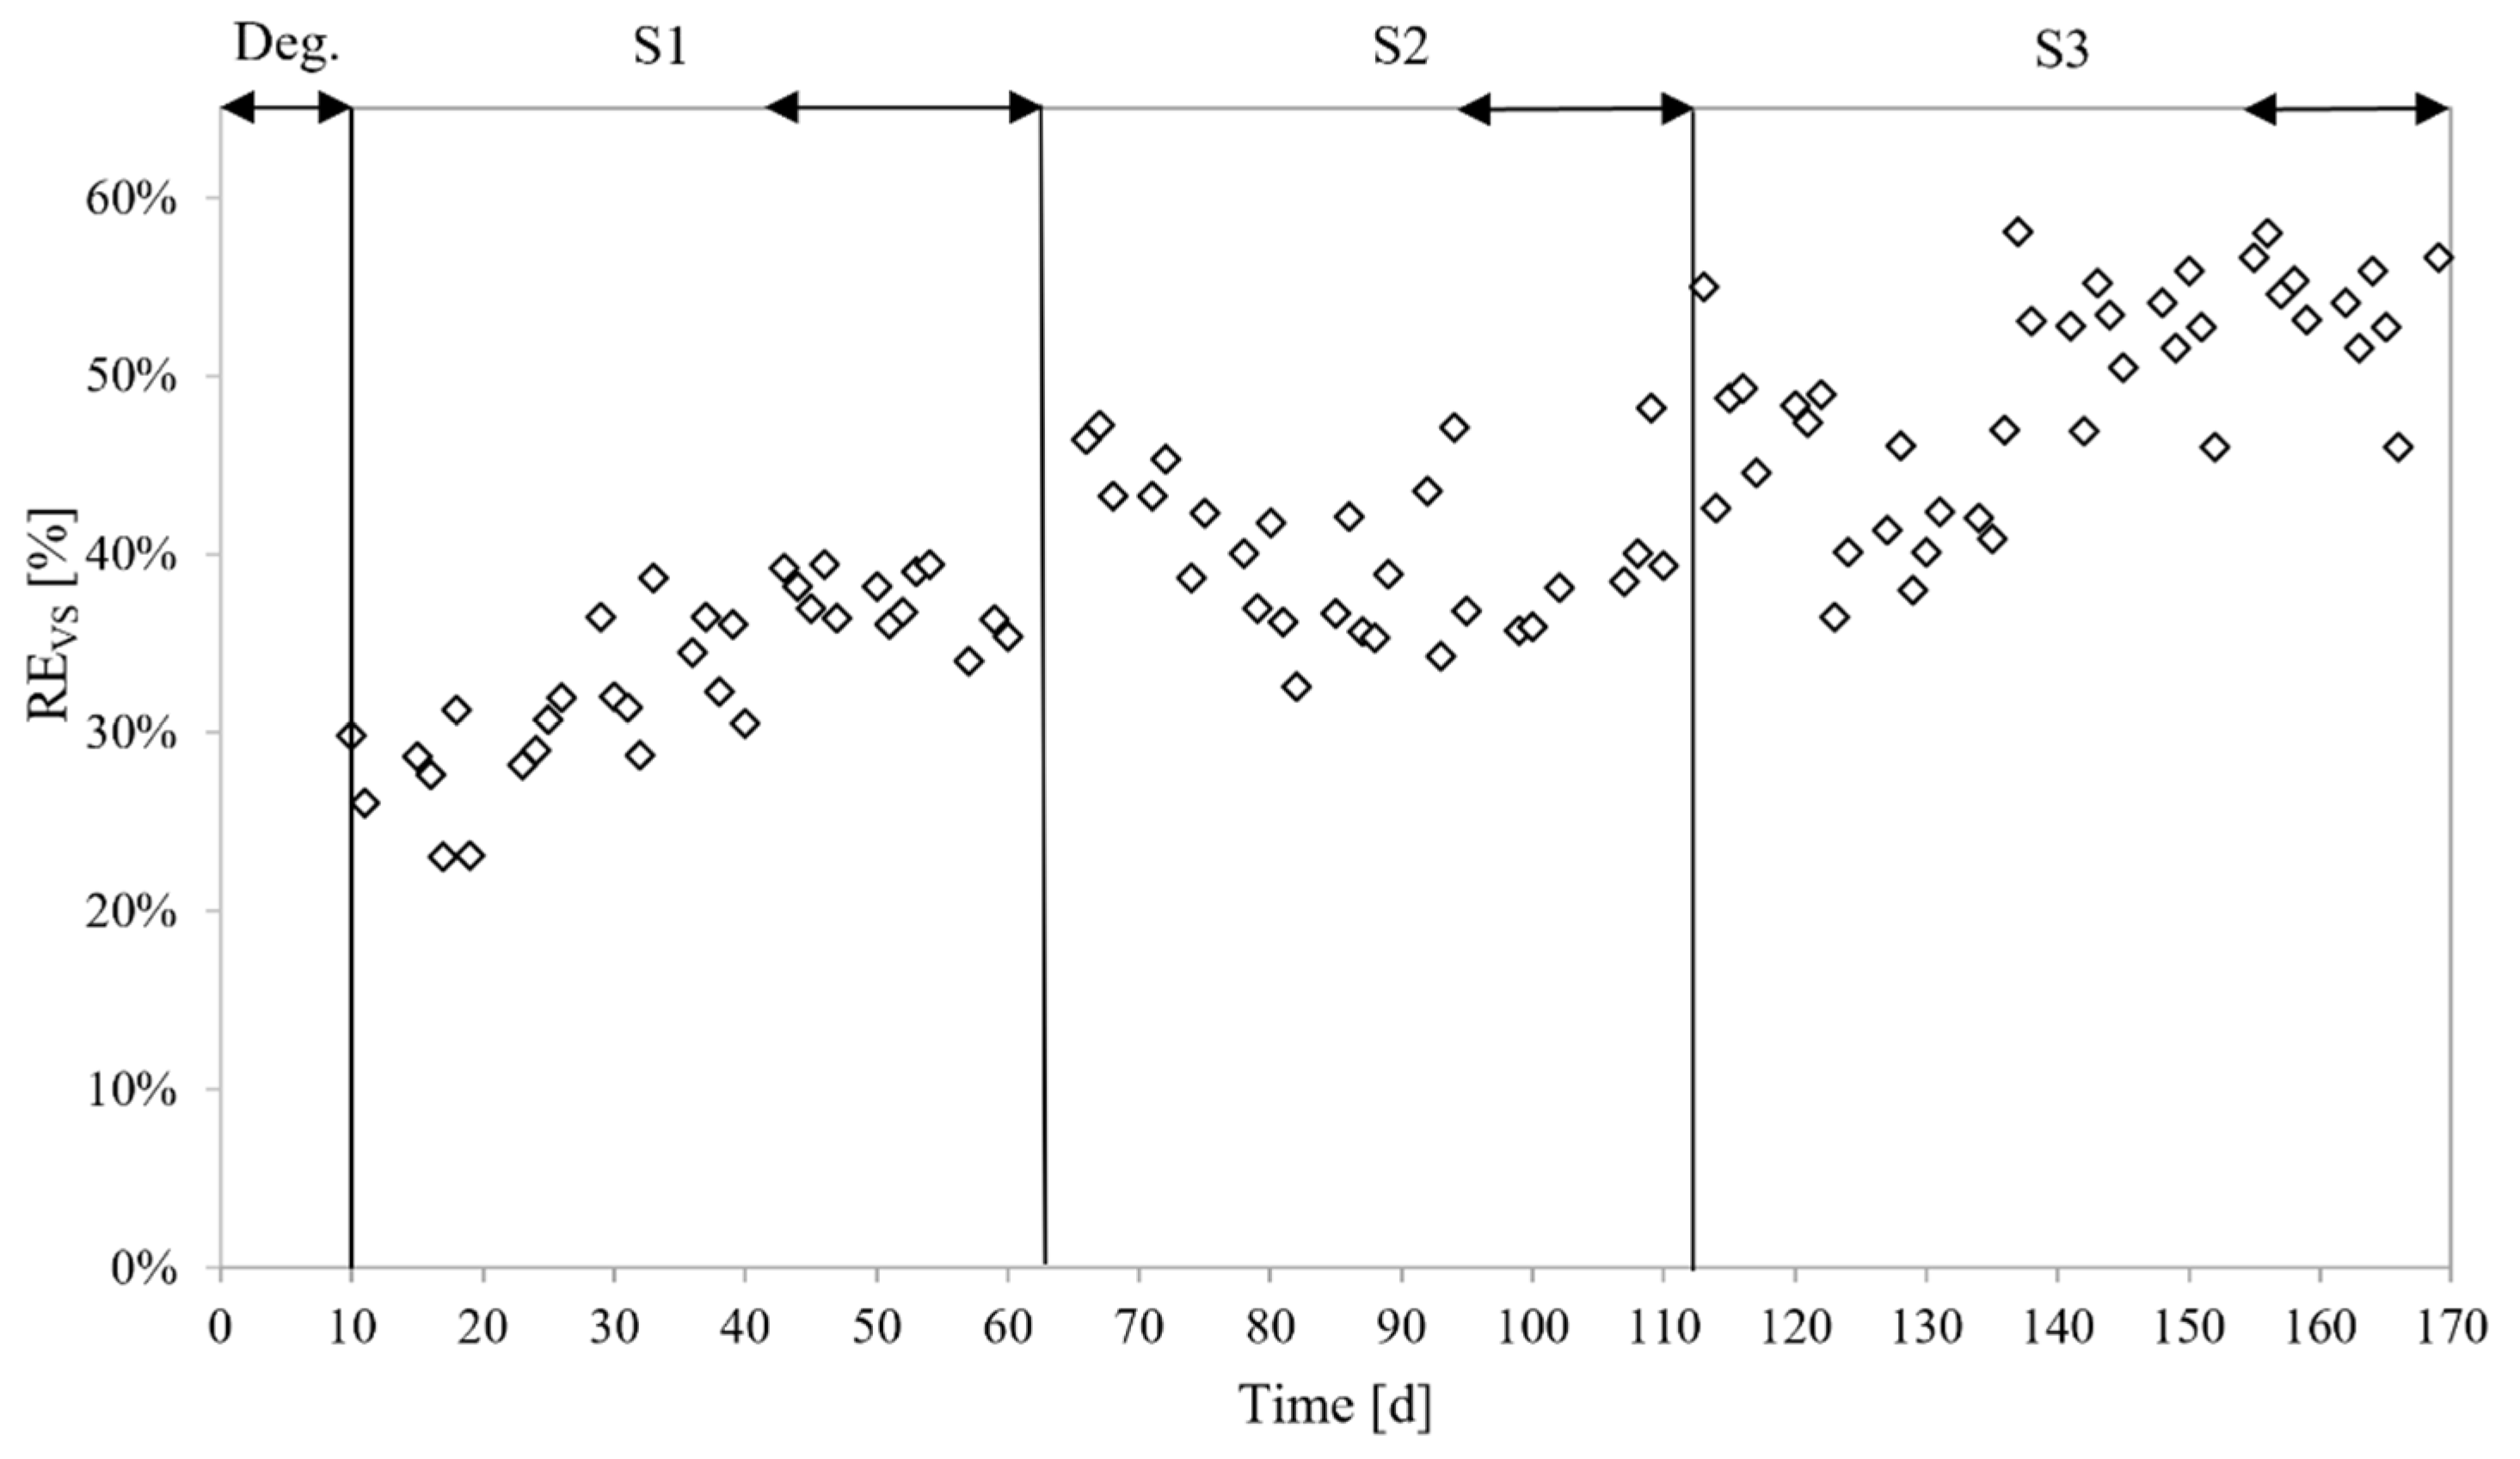
3.3.2. Bioenergy Recovery

The preliminary assessment reported that ER was, on average, equal to 5.41 ± 1.71, 7.25 ± 1.34, and 8.21 ± 0.9 MJ/kgVS for S1, S2, and S3, respectively. EG was, on average, 76.1 ± 24.1, 128.1 ± 26.8, and 186.9 ± 15.2 kWh/tOFMSW. In S3, ER increased by 13.1% compared with S2 and by 52% compared with S1. EG increased by 146% from S1 to S3. This was probably the result of two main effects: the increase in GPR with the decrease in HRT and the decrease in the ammonia concentration thanks to the high C/N ratio of the inlet feedstock and the greater biodegradability of sucrose over OFMSW. Concerning the daily trend (results not shown), ER reached a maximum value of 10.9 MJ/kgVS during S1 and then reached a minimum of 3.16 MJ/kgVS at the beginning of S2 before a final slight increase until the end of the trials. EG was around the average values in each scenario except for S1, in which it rapidly decreased when the concentrations of the TAN and FA increased.

3.4. Digestate Characterization

Table A1 in Appendix A reports the results of digestate characterization.
Metal ions both heavy and light, namely Al, Cr, and Ni, showed a positive trend during the experimental activities, suggesting an accumulation inside the digester. The maximum percentage increase was achieved in S1 and S2 (+92%, +15%, and +12% for Al, Cr, and Ni, respectively). The concentrations of Cu, Zn, K, and Na decreased over time. Cr and Ni exceeded the inhibition thresholds for dry AD of 3 and 2 mg/L, respectively [10]. The Ca concentration was higher than the inhibitory limit in the dry AD process (8000 mg/L) [10], but along with and Mg and Mn, it did not show any specific trend.
The aerobic stability index, namely OUR, was higher than the limit of 25 mmolO2/(kgVS h) required by the EU fertilizer regulation. On the contrary, the anaerobic index, namely RBP, was always below the threshold of 0.25 NLbiogas/gVS. By comparison, the OUR and the RBP decreased by 5% and 12%, respectively, when GW was added. This probably was caused by the high content of lignocellulosic compounds within the GW, which is recalcitrant to aerobic and anaerobic processes. In fact, the lignin content was at its maximum (39.6% on a VS basis) in S2, increasing by 21% from S1 to S2 and decreasing by 8% from S2 to S3. On the contrary, cellulose was degraded across the scenarios and decreased by 17% from S1 to S2. The carbohydrates in the inlet feedstock (36.04 ± 2.49 %VS for OFMSW) were consumed by the bacterial population. However, the results showed a positive tendency across the scenarios despite being the easiest macromolecules to convert into glucose [20]. The share of proteins slightly increased, fluctuating around 15.32–16.94 %VS. In S1, only 11.8% of the original protein content within the OFMSW (17.38 ± 2.05 %VS) was degraded. Lipids were consumed during the process, and the reduction from the initial OFMSW reached a maximum of 81.72% in S3.

4. Discussion

4.1. Process Stability

The characteristics of the feedstocks and the seed sludges were probably the main contributors to the ammonia inhibition encountered during the process. The content of Norg and proteins in the OFMSW and GW were higher than those typically reported for such substrates [51]. The addition of GW as a structural material was not beneficial to reducing the ammonia inhibition. The lignocellulosic biomasses had a high C/N ratio, being 38.5 for rice husks [25], fluctuating between 35 and 45 for corn silage [55], and varying from 11.6 to 22.7 for vegetable crop residues [56]. In this study, GW underwent a curing phase before usage that may have reduced the C content. Therefore, it was not able to increase the C/N ratio of the OFMSW. Instead, the addition of a carbon-rich substrate (i.e., sucrose) in S3 increased the C/N ratio of the OFMSW up to 32, resulting in a reduction in the ammonia concentration in terms of both TAN and FA. Furthermore, the GW showed a pH higher than the OFMSW, and the ammonia equilibrium was displaced to FA production, as reported in the literature [10].
The state of the art reports that the IA/PA ratio is an important indicator of AD stability but is unreliable when the ammonia concentration in the digester is high [10,54,57]. Ammonia acts as a buffer agent, reducing the acidification effect of VFA accumulation, but it leads the process to an unstable equilibrium. The process seems to be running in a stable state, but slight perturbations may lead to process failure [54]. To the best of the authors’ knowledge, previous studies reported contradictory results about VFA accumulation in pilot-scale PFRs. Patinvoh et al. [38] reached process instability for an OLR equal to 6 gVS/L d. Conversely, Arias et al. [58] found no accumulation of VFAs at similar OLRs. Chinellato et al. [40] obtained similar results but could not identify a proper trend in the VFA concentration. Jabeen et al. [25] identified process instability at an OLR of 9 gVS/L d, reaching a concentration of total VFAs of 8344 ± 1511 mg/L [25]. On the other hand, our study never exhibited acidification, even for the highest OLR tested (i.e., 12.4 gVS/(L d)).
The high share of propionic acid seemed to be principally related to the high concentration of FA. Capson-Tojo et al. [19] found that a concentration of FA higher than 800 mg/L inhibits acetoclastic methanogenesis, favoring hydrogenotrophic methanogenesis and syntrophic acetate oxidation [19]. Because the latter reaction is thermodynamically unfavored, propionic acid accumulated in the digester. Franke-Whittle et al. [59] found that the thermophilic co-digestion of cow manure and food waste incurred ammonia inhibition with an accumulation of propionic acid.

4.2. Biogas Yields

Changing the C/N of the feedstock and increasing the OLR led to the optimal results in terms of biogas production. The previous section highlighted that the ammonia concentration decreased by adding sucrose, which increased the C/N of the feedstock up to 32. At the same time, the supplementation of an easier biodegradable substrate than OFMSW and GW increased the GPR, which resulted in the maximum value during S3 (5.11 NLbiogas/(L d)). However, S2 showed the highest concentration of TAN and FA with the lowest SGP, SMP, and GPR. The system did not fail, but it achieved a so-called “inhibited steady state”, which was characterized by a stable but high pH, low biogas production, and no accumulation of VFAs [10,32].
The comparison with previous studies reported within the literature revealed that PFRs are applied to treat several feedstocks including OFMSW, cow manure, and straw in thermophilic and mesophilic conditions, and different performances were achieved. In thermophilic conditions and with treated OFMSW, the SMP was 203 NLCH4/kgVS when the OLR ranged between 7.3 and 7.7 kgVS/(m3 d) [32], which is comparable to the 190 NLCH4/kgVS obtained in this work. Instead, Chaudary 2008 [60] obtained an SGP ranging from 146 to 278 NLbiogas/kgVS for an OLR ranging between 3.9 and 2.5 gVS/L d, which was far below the biogas yield of 331 NLbiogas/kgVS reached in this study while operating the reactor with an OLR of 12.5 gVS/(L d). In addition, both studies evidenced high ammonia concentrations. Mesophilic dry AD was found to be less prone to ammonia inhibition, showing high SGP (i.e., 674 NLbiogas/kgVS) when the ammonia concentration was 2400 mg/L [40]. Moving to other substrates, SMP achieved a maximum of 163 NLCH4/gVS [38] when manure and straw were co-digested (i.e., C/N = 17), and the reactor operated with an HRT of 40 days. Veluchamy et al. 2019 [55], using corn silage as feedstock (i.e, C/N = 35–45), found the highest SMP of 410 NLCH4/gVS with an HRT of 17 days, indicating the importance of operating with a high C/N to achieve the maximum biogas production.
In this work, despite the high solid content of the feedstock, no mixing issues were found during the trials. Instead, the previous studies highlighted had criticalities related to crust formation and the viscosity of the digestate due to the high solid content [38,58].

4.3. Bioenergy Recovery

Within the literature, ER showed a great variability, mainly depending on the scale of the experimental test. Regarding lab-scale tests, a specific energy recovery of 540 KJ/kgVS was found during batch tests of microwaved OFMWS, which was rich in carbohydrates, lipids, and proteins [43]. Kuglarz et al. [61] found that microwaved irradiation at 900 W and a temperature higher than 70 °C maximized the specific energy recovery (3601 ± 287 KJ/kgVS). In pilot-scale tests, the specific energy recovery ranged from 11.5 to 30.6 MJ/kgVS during the thermophilic dry AD of OFMSW [32].
Concerning the EG, the results were in line with those reported in recent studies [49,62]. Cesaro et al. (2021) [49] investigated the influence of the storage time of the OFMSW on the energetic potential [49]. The maximum EG of that study was 163.2 ± 17.0 kWh/tOFMSW, slightly lower than the 184.35 ± 18.62 kWh/tOFMSW found here during S3, in which the C/N ratio of the feedstock was increased to 32 as a strategy to reduce ammonia inhibition and thus increase biogas production. On the other hand, Fei et al. [62] compared five different scenarios of waste management and found a specific energy production of 256 kWh/tOFMSW.
If a net energy balance is considered while maintaining thermophilic conditions, digestate recirculation pretreatments and mixing would account for the main energy consuming processes [32,63]. Previous studies highlighted the importance of the energy balance to justify the pretreatments of OFMSW [43,64]. Nevertheless, Zeshan et al. (2012) [32] obtained a net energy gain in the range of 50–73% for the pilot-scale PFR, indicating the possibility of implementing the technology as a decentralized plant. Regarding the mixing system, Zhang et al. (2019) [63] highlighted that semi-continuous mixing permits to have a higher electrical energy generation than a continuously mixed digester. In light of these preliminary results, further investigations on the energy balance, including pretreatments, pumping for feeding and recirculation, heating for maintaining thermophilic conditions, and mixing, should be performed.

4.4. Digestate Characterization

Digestate management is an important issue related to dry AD, and comprehensive characterization is fundamental to identifying whether toxic or inhibitory compounds accumulate inside the digester to monitor process stability and evaluate the subsequent application, such as final disposal [10] or exploitation in a circular economy application [14].
It is common knowledge that dry AD generally accumulates metal ions or toxic compounds because of the high solid content at which the reactor operates [16]. However, it is less sensitive to their negative effects because of the low mixing and bioavailability [13]. In this study, metal ions both heavy and light, namely Al, Cr, and Ni, accumulated in the digester, probably because of the high concentration of metal ions in the GW. The concentrations of Cu, Zn, K, and Na decreased, probably because of the low nutrient content of GW. The concentration of Ca was high mainly because of the high values in the seed sludges and in the GW. The other metal ions (i.e., Zn, Cd, Ni, Pb, Cu, and Hg) were within the limit of EU Fertilizer Regulation 1009/2019 [15], while the OUR was above the EU limit.

5. Conclusions

The experimental tests were performed with the aim of optimizing biogas production by addressing ammonia inhibition in thermophilic dry AD. To this aim, three operational strategies were compared by operating the reactor with solely OFMSW, by adding structural material, and by altering the C/N ratio of the inlet feedstock.
Among the operational strategies to optimize biogas production, altering the C/N attained the greatest results. Indeed, the total ammonia concentration decreased by 72% and 77% compared with the scenarios in which solely OFMSW and co-digestion with structural material were tested, respectively. The highest GPR of 5.11 NLbiogas/(Lr d) and potential energy recovery (e.g., 8.21 ± 0.9 MJ/kgVS) were achieved in such operating conditions. Digestate characterization showed an accumulation of heavy metals mainly caused by the high concentration found within the structural material and digestate, which resulted anaerobically, but it was not aerobically stable.

Author Contributions

Conceptualization, E.R. and I.P.; methodology, I.P.; software, E.R.; validation, E.R. and I.P.; formal analysis, E.R.; investigation, E.R.; resources, I.P.; data curation, E.R.; writing—original draft preparation, E.R.; writing—review and editing, E.R. and I.P.; visualization, E.R.; supervision, I.P., R.I. and G.F.; project administration, I.P.; funding acquisition, I.P. All authors have read and agreed to the published version of the manuscript.

Funding

This research received S-SUPER “SMART AND SUSTAINABLE USE PHASE OF EXISTING ROADS” PRA 2020–21 funding.

Data Availability Statement

The data that support the findings of this study are available from the corresponding author, I.P., upon reasonable request.

Acknowledgments

The authors gratefully acknowledge Alia Servizi Ambientali Spa and Belvedere Spa for technical and economic support provided during the experimental campaigns. The authors would like to thank Lorenzo Bosi and Alberto Baroni for the kind help in setting up the reactor.

Conflicts of Interest

The authors declare no conflict of interest.

Appendix A

Table A1. Physical-chemical, elemental, and bromatological characteristics of digestate as means and standard deviation for each scenario.
Unit of MeasurementS1 °S2 °S3 *
pH-7.96 ± 0.47.99 ± 0.47.62 ± 0.22
TOC%7 ± 1.18.2 ± 1.28.7 ± 0.79
Organic nitrogen%0.33 ± 0.050.15 ± 0.020.45 ± 0.06
TANmg/kg3420 ± 5103490 ± 5202366 ± 823
Total alkalinitymgCaCO3/kg14,500 ± 170014,100 ± 170011,533 ± 288
TS%19 ± 1.323.9 ± 1.726.63 ± 3.82
VS%13.7 ± 1.315.4 ± 1.717.76 ± 3.75
Ash%5.3 ± 0.378.5 ± 0.68.86 ± 0.45
C% °°37.05 ± 4.4234.3 ± 4.132.81 ± 1.61
H% °°4.52 ± 0.453.97 ± 0.393.87 ± 0.2
N **% °°3.15 ± 0.371.79 ± 0.212.43 ± 0.4
S% °°0.13 ± 0.020.26 ± 0.040.24 ± 0.1
C/N-11.73 ± 019.06 ± 7.9413.63 ± 1.71
Lignin% VS32.84 ± 2.3339.61 ± 2.7936.44 ± 3.86
Cellulose% VS22.62 ± 1.8221.42 ± 1.6818.82 ± 1.87
Carbohydrates 1% VS18.24 ± 2.1819.48 ± 2.3322.99 ± 3.24
Proteins% VS15.32 ± 2.7716.88 ± 3.0516.94 ± 1.81
Fats, oil and grease% VS0.71 ± 0.040.64 ± 0.040.38 ± 0
Aluminummg/kg480 ± 140920 ± 260946.66 ± 77.67
Calciummg/kg8000 ± 13008800 ± 14009633.33 ± 550.75
Magnesiummg/kg760 ± 2301060 ± 3101110 ± 43.58
Manganesemg/kg48 ± 1655 ± 1868 ± 10
Potassiummg/kg2640 ± 4002560 ± 3802670 ± 120
Sodiummg/kg1210 ± 3901120 ± 3701053 ± 55
Arsenicmg/kg °°<RL4.18 ± 0.62<RL
Cadmiummg/kg °°<RL<RL<RL
Chromemg/kg °°152.63 ± 23.15175.73 ± 26.35189.52 ± 18.87
Mercurymg/kg °°<RL<RL<RL
Nickelmg/kg °°89.47 ± 13.68100.41 ± 15.06107.56 ± 12.41
Coppermg/kg °°73.68 ± 11.0566.94 ± 10.0465.86 ± 12.86
Zincmg/kg °°163.15 ± 24.73150.62 ± 22.59152.94 ± 16.15
OUR(mmolO2/(kgVS h))42.53 ± 2.8540.25 ± 6.5729.46 ± 12.26
RBP(NLbiogas/gVS)0.11 ± 00.1 ± 00.11 ± 0
° n = 2 for S1 and S2. * n = 3 for S3. ** As TKN. °° On dry basis. 1 Simple sugars and starch.

References

  1. EUR-Lex—52019DC0640—EN—EUR-Lex. Available online: https://eur-lex.europa.eu/legal-content/EN/TXT/?uri=CELEX%3A52019DC0640 (accessed on 24 June 2021).
  2. IRENA. Global Renewables Outlook: Energy Transformation 2050. Available online: https://irena.org/publications/2020/Apr/Global-Renewables-Outlook-2020 (accessed on 9 July 2021).
  3. Peters, D.; van der Leun, K.; van Tiliburg, J.; Berg, T.; Schimmel, M.; van der Hoorn, I.; Buseman, M.; Staats, M.; Schenkel, M.; Ur Rehaman Mir, G. Gas Decarbonisation Pathways 2020–2050: Gas for Climate; Guidehouse: Utrecht, The Netherlands, 2020. [Google Scholar]
  4. European Environment Agency. Bio-Waste in Europe: Turning Challenges into Opportunities; Publications Office: Luxembourg, 2020. [Google Scholar]
  5. Directive 2008/98/EC of the European Parliament and of The Council of 19 November 2008 on Waste and Repealing Certain Directives; Publications Office of the European Union: Luxembourg, 2008; pp. 3–30.
  6. Campuzano, R.; González-Martínez, S. Characteristics of the organic fraction of municipal solid waste and methane production: A review. Waste Manag. 2016, 54, 3–12. [Google Scholar] [CrossRef] [PubMed]
  7. Alibardi, L.; Cossu, R. Composition variability of the organic fraction of municipal solid waste and effects on hydrogen and methane production potentials. Waste Manag. 2015, 36, 147–155. [Google Scholar] [CrossRef] [PubMed]
  8. Sailer, G.; Eichermüller, J.; Poetsch, J.; Paczkowski, S.; Pelz, S.; Oechsner, H.; Müller, J. Characterization of the separately collected organic fraction of municipal solid waste (OFMSW) from rural and urban districts for a one-year period in Germany. Waste Manag. 2021, 131, 471–482. [Google Scholar] [CrossRef] [PubMed]
  9. Pecorini, I.; Rossi, E.; Iannelli, R. Bromatological, Proximate and Ultimate Analysis of OFMSW for Different Seasons and Collection Systems. Sustainability 2020, 12, 2639. [Google Scholar] [CrossRef] [Green Version]
  10. Karthikeyan, O.P.; Visvanathan, C. Bio-energy recovery from high-solid organic substrates by dry anaerobic bio-conversion processes: A review. Rev. Environ. Sci. Biotechnol. 2013, 12, 257–284. [Google Scholar] [CrossRef]
  11. Baere, L.D.; Mattheeuws, B. Anaerobic Digestion of the Organic Fraction of Municipal Solid Waste in Europe. Waste Manag. 2012, 3, 517–526. [Google Scholar]
  12. Rosenheim, H.; De, I.; Hyvedemm, S. Anaerobic Digestion—Factsheet; European Bioplastics e.V.: Berlin, Germany, 2015; 8p. [Google Scholar]
  13. Fagbohungbe, M.O.; Dodd, I.C.; Herbert, B.M.J.; Li, H.; Ricketts, L.; Semple, K.T. High solid anaerobic digestion: Operational challenges and possibilities. Environ. Technol. Innov. 2015, 4, 268–284. [Google Scholar] [CrossRef]
  14. Pecorini, I.; Peruzzi, E.; Albini, E.; Doni, S.; Macci, C.; Masciandaro, G.; Iannelli, R. Evaluation of MSW Compost and Digestate Mixtures for a Circular Economy Application. Sustainability 2020, 12, 3042. [Google Scholar] [CrossRef] [Green Version]
  15. EU Regulation (EU) 2019/1009 of the European Parliament and of the Council of 5 June 2019 Laying down Rules on the Making Available on the Market of EU Fertilising Products and Amending Regulations (EC) No 1069/2009 and (EC) No 1107/2009 and repealing Regulation (EC) No 2003/2003. Available online: https://eur-lex.europa.eu/eli/reg/2019/1009/oj (accessed on 27 April 2020).
  16. Rocamora, I.; Wagland, S.T.; Villa, R.; Simpson, E.W.; Fernández, O.; Bajón-Fernández, Y. Dry anaerobic digestion of organic waste: A review of operational parameters and their impact on process performance. Bioresour. Technol. 2020, 299, 122681. [Google Scholar] [CrossRef]
  17. Kothari, R.; Pandey, A.K.; Kumar, S.; Tyagi, V.V.; Tyagi, S.K. Different aspects of dry anaerobic digestion for bio-energy: An overview. Renew. Sustain. Energy Rev. 2014, 39, 174–195. [Google Scholar] [CrossRef]
  18. Hartmann, H.; Ahring, B.K. Strategies for the anaerobic digestion of the organic fraction of municipal solid waste: An overview. Water Sci. Technol. 2006, 53, 7–22. [Google Scholar] [CrossRef] [PubMed]
  19. Capson-Tojo, G.; Ruiz, D.; Rouez, M.; Crest, M.; Steyer, J.-P.; Bernet, N.; Delgenès, J.-P.; Escudié, R. Accumulation of propionic acid during consecutive batch anaerobic digestion of commercial food waste. Bioresour. Technol. 2017, 245, 724–733. [Google Scholar] [CrossRef]
  20. Strazzera, G.; Battista, F.; Garcia, N.H.; Frison, N.; Bolzonella, D. Volatile fatty acids production from food wastes for biorefinery platforms: A review. J. Environ. Manag. 2018, 226, 278–288. [Google Scholar] [CrossRef] [PubMed]
  21. Nisman, B. The Stickland Reaction. Bacteriol. Rev. 1954, 18, 16–42. [Google Scholar] [CrossRef] [PubMed]
  22. Chen, Y.; Cheng, J.J.; Creamer, K.S. Inhibition of anaerobic digestion process: A review. Bioresour. Technol. 2008, 99, 4044–4064. [Google Scholar] [CrossRef]
  23. Rajagopal, R.; Massé, D.I.; Singh, G. A critical review on inhibition of anaerobic digestion process by excess ammonia. Bioresour. Technol. 2013, 143, 632–641. [Google Scholar] [CrossRef]
  24. Li, L.; Qin, Y.; Kong, Z.; Wu, J.; Kubota, K.; Li, Y.-Y. Characterization of microbial community and main functional groups of prokaryotes in thermophilic anaerobic co-digestion of food waste and paper waste. Sci. Total. Environ. 2019, 652, 709–717. [Google Scholar] [CrossRef] [PubMed]
  25. Jabeen, M.; Zeshan; Yousaf, S.; Haider, M.R.; Malik, R.N. High-solids anaerobic co-digestion of food waste and rice husk at different organic loading rates. Int. Biodeterior. Biodegrad. 2015, 102, 149–153. [Google Scholar] [CrossRef]
  26. Krakat, N.; Demirel, B.; Anjum, R.; Dietz, D. Methods of ammonia removal in anaerobic digestion: A review. Water Sci. Technol. 2017, 76, 1925–1938. [Google Scholar] [CrossRef]
  27. Zhang, S.; Ma, X.; Xie, D.; Guan, W.; Yang, M.; Zhao, P.; Gao, M.; Wang, Q.; Wu, C. Adding activated carbon to the system with added zero-valent iron further improves anaerobic digestion performance by alleviating ammonia inhibition and promoting DIET. J. Environ. Chem. Eng. 2021, 9, 106616. [Google Scholar] [CrossRef]
  28. Takashima, M.; Yaguchi, J. High-solids thermophilic anaerobic digestion of sewage sludge: Effect of ammonia concentration. J. Mater. Cycles Waste Manag. 2021, 23, 205–213. [Google Scholar] [CrossRef]
  29. Zhang, W.; Heaven, S.; Banks, C.J. Continuous operation of thermophilic food waste digestion with side-stream ammonia stripping. Bioresour. Technol. 2017, 244, 611–620. [Google Scholar] [CrossRef] [PubMed]
  30. Zhang, W.; Heaven, S.; Banks, C.J. Thermophilic Digestion of Food Waste by Dilution: Ammonia Limit Values and Energy Considerations. Energy Fuels 2017, 31, 10890–10900. [Google Scholar] [CrossRef]
  31. Yirong, C.; Zhang, W.; Heaven, S.; Banks, C.J. Influence of ammonia in the anaerobic digestion of food waste. J. Environ. Chem. Eng. 2017, 5, 5131–5142. [Google Scholar] [CrossRef] [Green Version]
  32. Zeshan; Karthikeyan, O.P.; Visvanathan, C. Effect of C/N ratio and ammonia-N accumulation in a pilot-scale thermophilic dry anaerobic digester. Bioresour. Technol. 2012, 113, 294–302. [Google Scholar] [CrossRef] [PubMed]
  33. Nappi, P.; Valenzano, F.; Consiglio, M. Analisi Merceologica dei Rifiuti Urbani Rassegna di Metodologie e Definizione di una Metodica di Riferimento; Agenzia Nazionale per la Protezione dell’Ambiente: Rome, Italy, 2000. [Google Scholar]
  34. Rossi, E.; Becarelli, S.; Pecorini, I.; Di Gregorio, S.; Iannelli, R. Anaerobic Digestion of the Organic Fraction of Municipal Solid Waste in Plug-Flow Reactors: Focus on Bacterial Community Metabolic Pathways. Water 2022, 14, 195. [Google Scholar] [CrossRef]
  35. Angelidaki, I.; Alves, M.; Bolzonella, D.; Borzacconi, L.; Campos, J.L.; Guwy, A.J.; Kalyuzhnyi, S.; Jenicek, P.; van Lier, J.B. Defining the biomethane potential (BMP) of solid organic wastes and energy crops: A proposed protocol for batch assays. Water Sci. Technol. 2009, 59, 927–934. [Google Scholar] [CrossRef] [PubMed] [Green Version]
  36. Rossi, E.; Pecorini, I.; Paoli, P.; Iannelli, R. Plug-flow reactor for volatile fatty acid production from the organic fraction of municipal solid waste: Influence of organic loading rate. J. Environ. Chem. Eng. 2022, 10, 106963. [Google Scholar] [CrossRef]
  37. Baldi, F.; Pecorini, I.; Iannelli, R. Comparison of single-stage and two-stage anaerobic co-digestion of food waste and activated sludge for hydrogen and methane production. Renew. Energy 2019, 143, 1755–1765. [Google Scholar] [CrossRef]
  38. Patinvoh, R.J.; Kalantar Mehrjerdi, A.; Sárvári Horváth, I.; Taherzadeh, M.J. Dry fermentation of manure with straw in continuous plug flow reactor: Reactor development and process stability at different loading rates. Bioresour. Technol. 2017, 224, 197–205. [Google Scholar] [CrossRef] [PubMed] [Green Version]
  39. Massé, D.I.; Gilbert, Y.; Saady, N.M.C.; Liu, C. Low-temperature anaerobic digestion of swine manure in a plug-flow reactor. Environ. Technol. 2013, 34, 2617–2624. [Google Scholar] [CrossRef] [PubMed]
  40. Chinellato, G.; Battista, F.; Bolzonella, D.; Cavinato, C. Single-phase anaerobic digestion of the organic fraction of municipal solid waste without dilution: Reactor stability and process performance of small, decentralised plants. Waste Manag. 2021, 125, 103–111. [Google Scholar] [CrossRef] [PubMed]
  41. Chen, R.; Li, Z.; Feng, J.; Zhao, L.; Yu, J. Effects of digestate recirculation ratios on biogas production and methane yield of continuous dry anaerobic digestion. Bioresour. Technol. 2020, 316, 123963. [Google Scholar] [CrossRef] [PubMed]
  42. Agenzia Nazionale per Protezione dell’Ambiente. Metodi di Analisi del Compost—Manuale; ANPA: Rome, Italy, 2001. [Google Scholar]
  43. Pecorini, I.; Baldi, F.; Carnevale, E.A.; Corti, A. Biochemical methane potential tests of different autoclaved and microwaved lignocellulosic organic fractions of municipal solid waste. Waste Manag. 2016, 56, 143–150. [Google Scholar] [CrossRef] [PubMed]
  44. Pecorini, I.; Iannelli, R. Characterization of Excavated Waste of Different Ages in View of Multiple Resource Recovery in Landfill Mining. Sustainability 2020, 12, 1780. [Google Scholar] [CrossRef] [Green Version]
  45. Ripley, L.E.; Boyle, W.C.; Converse, J.C. Improved Alkalimetric Monitoring for Anaerobic Digestion of High-Strength Wastes. J. (Water Pollut. Control. Fed.) 1986, 58, 406–411. [Google Scholar]
  46. Ente Nazionale Italiano di Unificazione. Ammendanti e Substrati di Coltivazione—Determinazione Dell’attività Biologica Aerobica—Parte 1: Tasso di Assorbimento Dell’ossigeno (OUR); Ente Nazionale Italiano di Unificazione: Rome, Italy, 2020. [Google Scholar]
  47. Ente Nazionale Italiano di Unificazione. Metodo per la Misura della Produzione Potenziale di Metano da Digestione Anaerobica ad Umido-Matrici in Alimentazione; Ente Nazionale Italiano di Unificazione: Rome, Italy, 2018. [Google Scholar]
  48. Baldi, F.; Iannelli, R.; Pecorini, I.; Polettini, A.; Pomi, R.; Rossi, A. Influence of the pH control strategy and reactor volume on batch fermentative hydrogen production from the organic fraction of municipal solid waste. Waste Manag. Res. 2019, 37, 478–485. [Google Scholar] [CrossRef] [Green Version]
  49. Cesaro, A.; Belgiorno, V. Anaerobic digestion of mechanically sorted organic waste: The influence of storage time on the energetic potential. Sustain. Chem. Pharm. 2021, 20, 100373. [Google Scholar] [CrossRef]
  50. Fisgativa, H.; Tremier, A.; Dabert, P. Characterizing the variability of food waste quality: A need for efficient valorisation through anaerobic digestion. Waste Manag. 2016, 50, 264–274. [Google Scholar] [CrossRef] [PubMed]
  51. Campuzano, R.; González-Martínez, S. Influence of process parameters on the extraction of soluble substances from OFMSW and methane production. Waste Manag. 2017, 62, 61–68. [Google Scholar] [CrossRef] [PubMed]
  52. Yoo, C.G.; Meng, X.; Pu, Y.; Ragauskas, A.J. The critical role of lignin in lignocellulosic biomass conversion and recent pretreatment strategies: A comprehensive review. Bioresour. Technol. 2020, 301, 122784. [Google Scholar] [CrossRef] [PubMed]
  53. Anaerobic Biotechnology for Bioenergy Production: Principles and Applications; Khanal, S.K. (Ed.) Wiley-Blackwell: Ames, IA, USA, 2008; ISBN 978-0-8138-2346-1. [Google Scholar]
  54. Drosg, B. Process Monitoring in Biogas Plants; IEA bioenergy: Paris, France, 2013; pp. 1–38. [Google Scholar]
  55. Veluchamy, C.; Gilroyed, B.H.; Kalamdhad, A.S. Process performance and biogas production optimizing of mesophilic plug flow anaerobic digestion of corn silage. Fuel 2019, 253, 1097–1103. [Google Scholar] [CrossRef]
  56. Li, P.; Li, W.; Sun, M.; Xu, X.; Zhang, B.; Sun, Y. Evaluation of Biochemical Methane Potential and Kinetics on the Anaerobic Digestion of Vegetable Crop Residues. Energies 2018, 12, 26. [Google Scholar] [CrossRef] [Green Version]
  57. Lossie, U.; Pütz, P. Targeted Control of Biogas Plants with the Help of FOS/TAC; Practice Report; Hach-Lange: Loveland, CO, USA, 2008. [Google Scholar]
  58. Arias, D.E.; Veluchamy, C.; Habash, M.B.; Gilroyed, B.H. Biogas production, waste stabilization efficiency, and hygienization potential of a mesophilic anaerobic plug flow reactor processing swine manure and corn stover. J. Environ. Manag. 2021, 284, 112027. [Google Scholar] [CrossRef]
  59. Franke-Whittle, I.H.; Walter, A.; Ebner, C.; Insam, H. Investigation into the effect of high concentrations of volatile fatty acids in anaerobic digestion on methanogenic communities. Waste Manag. 2014, 34, 2080–2089. [Google Scholar] [CrossRef] [Green Version]
  60. Chaudhary, B.K. Dry Continuous Anaerobic Digestion of Municipal Solid Waste in Thermophilic Conditions. Master’s Thesis, Asian Institute of Technology, School of Environment, Resources and Development, Khlong Nueng, Thailand, 2008. [Google Scholar]
  61. Kuglarz, M.; Karakashev, D.; Angelidaki, I. Microwave and thermal pretreatment as methods for increasing the biogas potential of secondary sludge from municipal wastewater treatment plants. Bioresour. Technol. 2013, 134, 290–297. [Google Scholar] [CrossRef] [PubMed]
  62. Fei, F.; Wen, Z.; Huang, S.; De Clercq, D. Mechanical biological treatment of municipal solid waste: Energy efficiency, environmental impact and economic feasibility analysis. J. Clean. Prod. 2018, 178, 731–739. [Google Scholar] [CrossRef]
  63. Zhang, J.; Mao, L.; Nithya, K.; Loh, K.-C.; Dai, Y.; He, Y.; Wah Tong, Y. Optimizing mixing strategy to improve the performance of an anaerobic digestion waste-to-energy system for energy recovery from food waste. Appl. Energy 2019, 249, 28–36. [Google Scholar] [CrossRef]
  64. Ariunbaatar, J.; Panico, A.; Esposito, G.; Pirozzi, F.; Lens, P.N.L. Pretreatment methods to enhance anaerobic digestion of organic solid waste. Appl. Energy 2014, 123, 143–156. [Google Scholar] [CrossRef]
Figure 1. Schematic view of the experimental system.
Energies 15 05515 g001
Figure 2. Concentration of TAN and FA on weekly basis measured in the digestate at the outlet section. Double arrows indicate degassing phase and last HRT of each scenario.
Energies 15 05515 g002
Figure 3. Daily concentration of organic acids. IA/PA ratio is also represented. Double arrows indicate degassing phase and last HRT of each scenario.
Energies 15 05515 g003
Figure 4. Composition of biogas. Daily concentrations of CH4 and CO2 in the biogas. Double arrows indicate degassing phase and last HRT of each scenario.
Energies 15 05515 g004
Figure 5. Daily gas product rate (GPR) production. Double arrows indicate degassing phase and last HRT of each scenario.
Energies 15 05515 g005
Figure 6. Relationship between GPR and FA.
Energies 15 05515 g006
Figure 7. Daily values of volatile solid reduction efficiency (REVS). Double arrows indicate degassing phase and last HRT of each scenario.
Energies 15 05515 g007
Table 1. Literature review of recent experimental tests to reduce ammonia inhibition in thermophilic dry AD.
Reactor Type (Wv)Substrate (C/N)TS [%]HRT (d)T (°C)FA (mg/L)TAN
(mg/L)
SMP
(NLCH4/gVS)
Strategy to Reduce
Ammonia Inhibition
Ref.
CSTR
(4 L)
Source segregated domestic waste (C/N = 16.5)23.9n.n55700–11002500Digester failure- °°[31]
Vegetables, fruits, meat, dairy products, and bread (C/N = 46.6)22.555700–10001000–20000.39
CSTR
(4 L)
Source segregated domestic wasten.a7555n.a.50000.39Dilution W/S = 0:1[30]
31000.44Dilution W/S = 0.5:1
251500Dilution W/S = 2:1
5002300n.a.Dilution W/S = 1:1
CSTR
(2 L)
Sewage sludge7–8205531021700.33-[28]
9–10350>2500Digester failure
2201720n.a.Ammonia stripping of digestate
CSTR
(35 L)
Food waste (C/N = 13.6)23.8n.a.55n.a.<25000.5Ammonia stripping of digestate = 2.1 kg of digestate twice a week[29]
1000–2000Ammonia stripping of digestate = 2.5 kg of digestate twice a week
1500Ammonia stripping of digestate = 5 kg of digestate twice a week
Wv = working volume, CSTR = continuously stirred tank reactor, n.a = datum not available, TS = total solid, HRT = hydraulic retention time, C/N = carbon-to-nitrogen ratio, FA = free ammonia, TAN = total ammonia nitrogen, SMP = specific methane production, and W/S = water-to-substrate ratio. °° Any ammonia recovery strategy was performed.
Table 2. Physical-chemical, elemental, and bromatological characteristics of the inoculum and substrates, namely OFMSW and garden waste (GW).
Unit of MeasurementInoculum *OFMSW *GW *
pH-7.26 ± 0.364.4 ± 0.246.37 ± 0.3
TOC%8.9 ± 1.311.05 ± 1.0622.56 ± 2.96
Organic nitrogen%0.37 ± 0.050.55 ± 01.15 ± 0.17
TAN (N-NH4+)mg/kg3690 ± 550390 ± 395266.67 ± 81.54
Total alkalinitymgCaCO3/kg15,800 ± 19003515 ± 213769 ± 454
Solid content (TS)%22.8 ± 1.626.4 ± 2.2669.83 ± 4.5
Volatile solid (VS)%17.12 ± 0.420.71 ± 2.151.03 ± 3.16
Ash%5.68 ± 0.45.68 ± 0.1623.19 ± 1.37
C% °°39.03 ± 1.141.85 ± 4.0133.05 ± 8.89
H% °°4.91 ± 0.115.66 ± 0.084.37 ± 0.4
N **% °°2.91 ± 0.12.34 ± 0.11.66 ± 0.2
S% °°0.19 ± 0.080.21 ± 0.040.68 ± 0.12
C/N-13.38 ± 1.318.1 ± 2.6820.83 ± 1.53
Lignin% VS40.3 ± 2.816.65 ± 2.3834.51 ± 3.04
Cellulose% VS22.78 ± 1.8122.2 ± 2.7326.31 ± 2.03
Carbohydrates °% VS22.19 ± 2.6836.03 ± 2.4927.32 ± 2.46
Proteins% VS10.51 ± 1.8617.37 ± 2.0414.08 ± 2.35
Fats, oil, and grease% VS0.81 ± 0.052.09 ± 0.230.69 ± 0.11
Aluminummg/kg550 ± 160610 ± 226550 ± 432
Calciummg/kg12,100 ± 15006600 ± 1415962 ± 3605
Magnesiummg/kg940 ± 280785 ± 190528 ± 633
Manganesemg/kg58 ± 1932 ± 7.0743 ± 66
Potassiummg/kg2990 ± 4502425 ± 71563 ± 1026
Sodiummg/kg1380 ± 4501045 ± 77268 ± 170
Arsenicmg/kg °°<RL<RL ± <RL0.17 ± 1.31
Cadmiummg/kg °°4.38 ± <RL<RL ± <RL-
Chromemg/kg °°131.57 ± 19.7322.72 ± 5.3540.05 ± 53.93
Mercurymg/kg °°<RL ± <RL<RL ± <RL-
Nickelmg/kg °°83.33 ± 12.717.57 ± <RL8.81 ± 14.39
Coppermg/kg °°65.78 ± 10.0828.4 ± 8.0328.05 ± 52.33
Zincmg/kg °°122.8 ± 18.42115.53 ± 13.3938.46 ± 108.3
Ironmg/kg °°4666 ± 4253308 ± 2542198.39 ± 4642.36
* n = 2. ** As total Kjieldahl nitrogen (TKN). ° Simple sugars and starch. °° On a dry basis.
Table 3. Process stability parameters. The results are reported as averages and standard deviations on the last HRT of each scenario. The same letter indicates that results are not statistically different (Welch t-test).
S1S2S3
pHout (-)8.41 ± 0.12a8.32 ± 0.1b8.11 ± 0.08c
pH1 (-)8.41 ± 0.03a8.63 ± 0.05b8.35 ± 0.09a
pH2 (-)8.51 ± 0.03a8.74 ± 0.07b8.44 ± 0.12a
T1 (°C)53.56 ± 0.31a53.08 ± 3.78b52.75 ± 0.36a
T2 (°C)53.36 ± 0.28a52.82 ± 3.72b52.47 ± 0.34a
TA (mgCaCO3/L)20,037 ± 66021,130 ± 40616,011 ± 50
IA (mgCaCO3/L)6922 ± 3247555 ± 3915320 ± 220
IA/PA (-)0.52 ± 0.030.55 ± 0.030.49 ± 0.03
Total VFAs (mg/L)394 ± 210a1162 ± 244b3345 ± 81c
TAN (mg/L) 12220 ± 802711 ± 346631 ± 211
FA (mg/L)1151 ± 1731196 ± 220193 ± 94
CH4 (%)62.63 ± 2.61a64.34 ± 2.19a64.97 ± 2.73b
CO2 (%)37.2 ± 2.59a35.65 ± 2.19a35.02 ± 2.73b
1 As N-NH+4.
Publisher’s Note: MDPI stays neutral with regard to jurisdictional claims in published maps and institutional affiliations.

