Article

Operating Renewable Energy Communities to Reduce Power Peaks in the Distribution Grid: An Analysis on Grid-Friendliness, Different Shares of Participants, and Economic Benefits

1
Siemens AG, Technology, Günther-Scharowsky-Str. 1, 91058 Erlangen, Germany
2
Department of Electrical Engineering and Computer Science, Technical University of Darmstadt, Landgraf-Georg-Str. 4, 64283 Darmstadt, Germany
*
Author to whom correspondence should be addressed.
Energies 2022, 15(15), 5468; https://doi.org/10.3390/en15155468
Submission received: 30 June 2022 / Revised: 20 July 2022 / Accepted: 26 July 2022 / Published: 28 July 2022
(This article belongs to the Special Issue Renewable Energy Communities (REC))

Abstract

:
Improving the control of flexible assets in distribution grids, e.g., battery storages, electric vehicle charging points, and heat pumps, can balance power peaks caused by high renewable power generation or load to prevent overloading the grid infrastructure. Renewable energy communities, introduced as part of the recast of the Renewable Energy Directive, provide a regulatory framework for this. As a multi-site energy management method, they can tap flexibility potential. The present work quantifies stimulus for renewable energy communities to incentivize the grid-friendly operation of flexible assets, depending on the shares of participants in rural, suburban, and urban grid topologies. Results indicate that an operation of the community, driven by maximizing the economic benefits of its members, does not clearly reduce the annual peak load at the low-voltage substation, while the operation strategy of a grid-friendly renewable energy community achieves a peak power reduction of 23–55%. When there is not full participation, forecasts of the residual load of non-participants provided by the distribution system operator can be considered in the optimization of the renewable energy community. For all simulation cases, the economic benefit between the two operation strategies differs by less than one percent, resulting in a very low additional incentive required for grid-friendliness in terms of reduced peak power. Thus, grid-friendly renewable energy communities might be a cost-effective way to defer future grid reinforcements.

1. Introduction

Against the background of accelerating the transition to renewable sources across Europe, the European Union (EU) has set a variety of measures for renewable electricity generation and electrification of the heating and transport sectors to meet climate goals and to become climate neutral by 2050, according to the EU green deal [1]. Recently, this was complemented by the REPowerEU action for more affordable, secure, and sustainable energy in order to become less dependent on fossil energy imports [2]. This action plan aims to double the installation rate of heat pumps over the next five years to a total of 10 million units and to accelerate the expansion of rooftop photovoltaic (PV) systems in the short term. For all new residential buildings, the installation of rooftop solar energy will be compulsory by 2029 [3]. Several EU member states and automotive manufacturers have declared their intention to accelerate the transition to zero emission vehicles in leading markets by 2035. This will result in an expected increase in new electric vehicle registrations [4].
The transition to net zero greenhouse gas emissions poses new challenges to the operation and planning of electric distribution grids as distributed renewable generation replaces centralized conventional power plants and new types of demand, such as heat pumps and electric vehicles, are installed [5,6]. To defer grid reinforcement and avoid the overloading of low-voltage substations and cables, as well as voltage violations, the newly installed flexible loads might be used to provide flexibility [7,8,9]. This requires an energy management system that connects flexibility providers and the distribution system operator (DSO) to ensure a targeted deployment of flexibility. Community-organized prosumer groups are discussed as an opportunity to manage local energy needs, to generate revenue streams for community benefit, and to act as providers of various services to the grid [10].
The EU agreed on a legal framework for Renewable Energy Communities (RECs) as part of the recast of the Renewable Energy Directive (RED II), which entered into force in December 2018, that might serve as an interface for the purpose of providing flexibility [11]. RECs are a voluntary and open collective of citizens, SMEs, and local authorities that produce, store, and consume local renewable energy and share it among their participants. Their intent is to provide environmental, economic, or social benefits for their shareholders, members, or for the local area, rather than to achieve financial profits. The EU Member States were given until June 2021 to transpose the RED II Directive into national legislation. Examples of national implementations of RECs are the Austrian ‘Erneuerbaren-Ausbau-Gesetzespaket’ [12], the ‘Royal Decree 244/2019’ in Spain [13], the ‘Decreto-Lei No 162/2019′ in Portugal [14], and the Italian ‘Decreto-legge 30 dicembre 2019, n. 162’ [15]. As a multi-site energy management system, RECs can aggregate flexibilities of all participants to provide ancillary services for the DSO and coordinate the individual assets to meet flexibility requests in a way that increases community self-consumption and reduces cost [16].

1.1. Related Studies

The literature review distinguishes between the subjects: individual building operation and flexibility, energy sharing in communities to optimize collective self-consumption, and community interactions with the external grid or services provided to it.
Märzinger and Österreicher [17] develop a methodology to quantify flexibility of individual buildings that are not aggregated in an energy community in terms of the energy storage capacity and load shifting potential to derive a smart readiness indicator. This indicates whether the building’s operation is adaptable to the requirements of the occupants and the grid by using information and communication technologies and electronic systems. The flexibility of buildings through thermal energy storage regarding power, energy and retrievability is quantified by Stinner et al. [18]. Chen et al. [19] demonstrate a simulation model for the optimal operation of a building energy management system that uses flexibilities for peak shaving.
Martirano et al. [20] propose a power sharing model for energy communities in a Simulink environment to aggregate users and to increase their self-consumption to achieve economic profits. Additionally, in [21], the authors present a solution for consumers in RECs for optimizing self-consumption along with blockchain-based peer-to-peer trading. Nan et al. [22] present a demand response scheduling scheme in residential communities based on their loads and distributed generation to reduce electricity cost and decrease peak load. The article by di Silvestre et al. [23] complements the widely discussed approaches regarding maximizing self-consumption and fully exploiting renewable energies in RECs with an understanding of RECs as virtual aggregators providing services to the grid. This includes demand side management, avoiding grid failure, increasing system stability, reducing energy losses, improving voltage quality, and deferring reinforcements.
Related work from Weckesser et al. [24] describes that RECs with PV plants and battery storages can significantly reduce the low-voltage grid loading and peak power exchange. This requires an operation strategy that is only slightly different from the maximum profit strategy. The study does not consider heat pumps or electric vehicle charging as flexible loads that might further reduce peaks. The authors in [25] do not identify any additional strain on the grids caused by energy sharing. They further consider the inclusion of sector coupling with heat pumps and electric vehicles and show that the grids can be relieved in case of future overloads. The results are based on the simulation of one energy community, without varying the area or the shares of participants. Thormann and Kienberger [5] present an approach for calculating future grid reinforcement needs and show that temporal interactions between existing and future grid customers with electric vehicles and heat pumps must be considered in order to avoid overestimating the needs. Results of the work of Radl et al. [26] show that RECs have the potential to reduce total participant electricity costs. This can be done by load aggregation and increasing community self-consumption, benefitting from reduced grid tariffs for electric energy exchanged, and by reducing communities’ electricity costs. A strategy to prevent over-voltage events is examine in [27]. In distribution grids, a demand response program is used to shift loads to the peak hours of PV generation. In contrast to the REC approach, there is no aggregation layer between customer and DSO. It is assumed that the DSO receives permission from customers and is enabled to shift electricity consumption to off-peak periods.

1.2. Scope of This Work

In comparison to the aforementioned studies, the present paper quantifies the impact of a REC grid service that, with the use of PV systems, battery storages, and flexible loads, reduces the peak power exchange between the community and the electric grid with an optimized grid-friendly operation. Thus, differences between a purely economic operation and necessary steps for realizing a positive impact on the electric grid are identified. Moreover, a new approach considering different shares of participants in the REC is examined to determine if a minimum size of the REC is required and how the impact of the REC increases with the number of participants. Thereby, the shares of different asset types providing flexibility in the reduction of the annual power peak is analyzed. Finally, the economic benefits for REC participants are calculated to derive how profitable participation is and whether renewable energy communities are likely to spread. In this process, the economic difference between the most economic and the most grid-friendly operation strategy is calculated.
The remainder of this paper is structured as follows. Section 2 describes the renewable energy community and the participant’s energy system model, as well as the considered operation strategies and their mathematic formulation using linear programming. This section further describes the investigated grid topologies, REC configurations, and deployment of flexibilities, as well as the metrics used for evaluation. Section 3 presents the results of the grid friendliness assessment for the scenarios and operation strategies investigated. This is followed by a sensitivity analysis on the shares of participants and asset types, along with an outlook on the economic benefits of the participants. Section 4 discusses the main findings and concludes the paper.

2. Method

To address the aforementioned questions, a simulation environment is developed that is used to evaluate operation strategies and scenarios of renewable energy community compositions. First, the simulation framework core is described, which solves the coordination problem of the REC as a linear optimization problem. Then, different operation strategies, the corresponding boundary conditions, and the objective function of the optimization are presented. Scenarios with different compositions and grid topologies of the REC are defined. Each REC scenario is within the grid area of a low-voltage substation and considers different shares of participants. Finally, the evaluation metrics for deriving the results are described. An overview of the methods is given in Figure 1, summarizing the assumptions and input variables on the left, the simulation process in the center, and the results and evaluation metrics on the right.

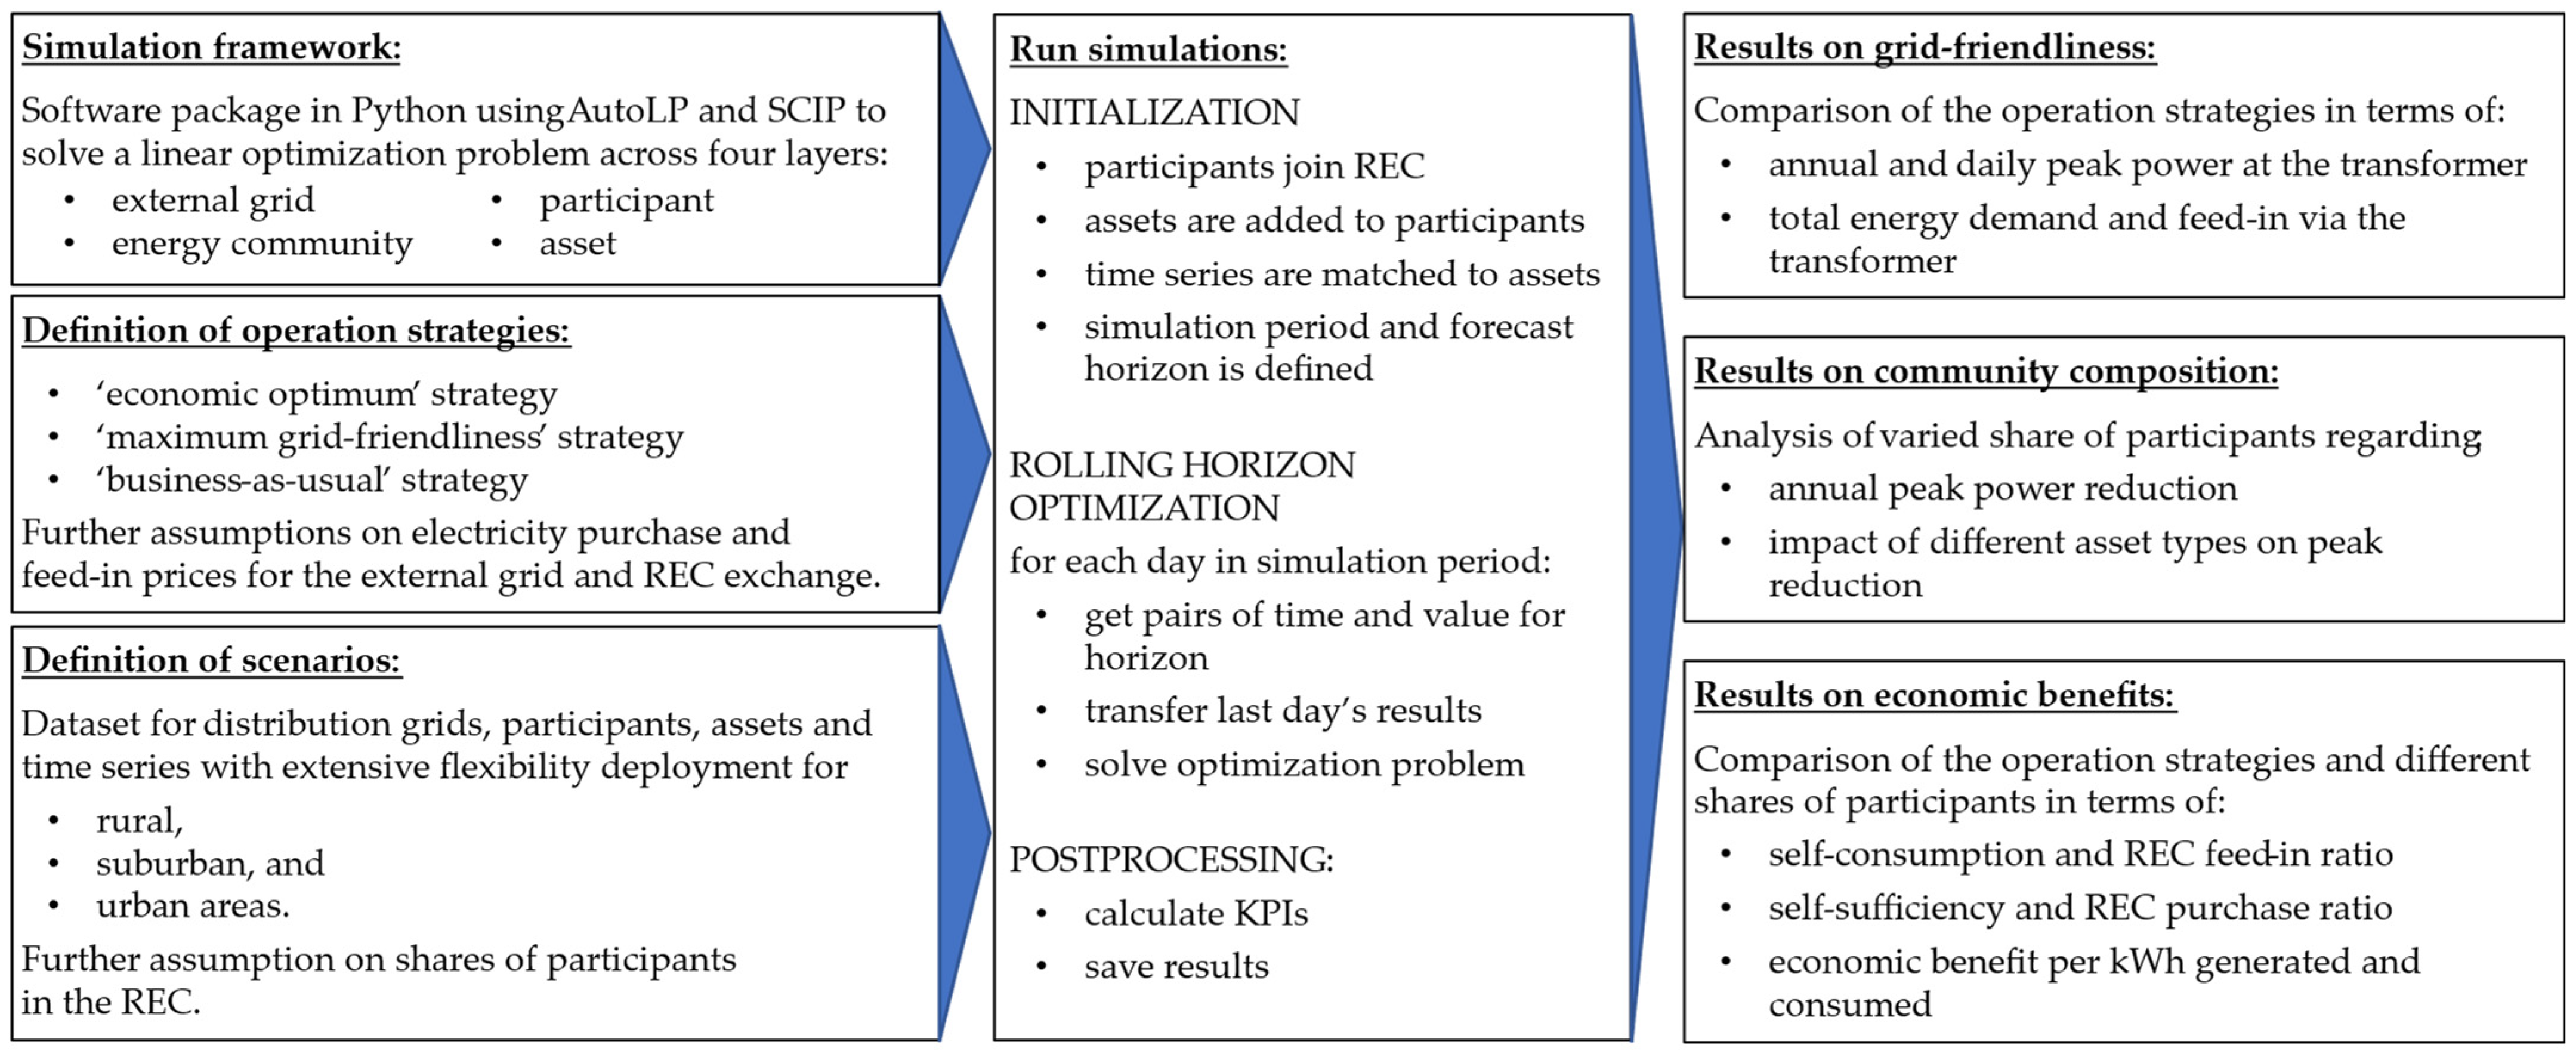
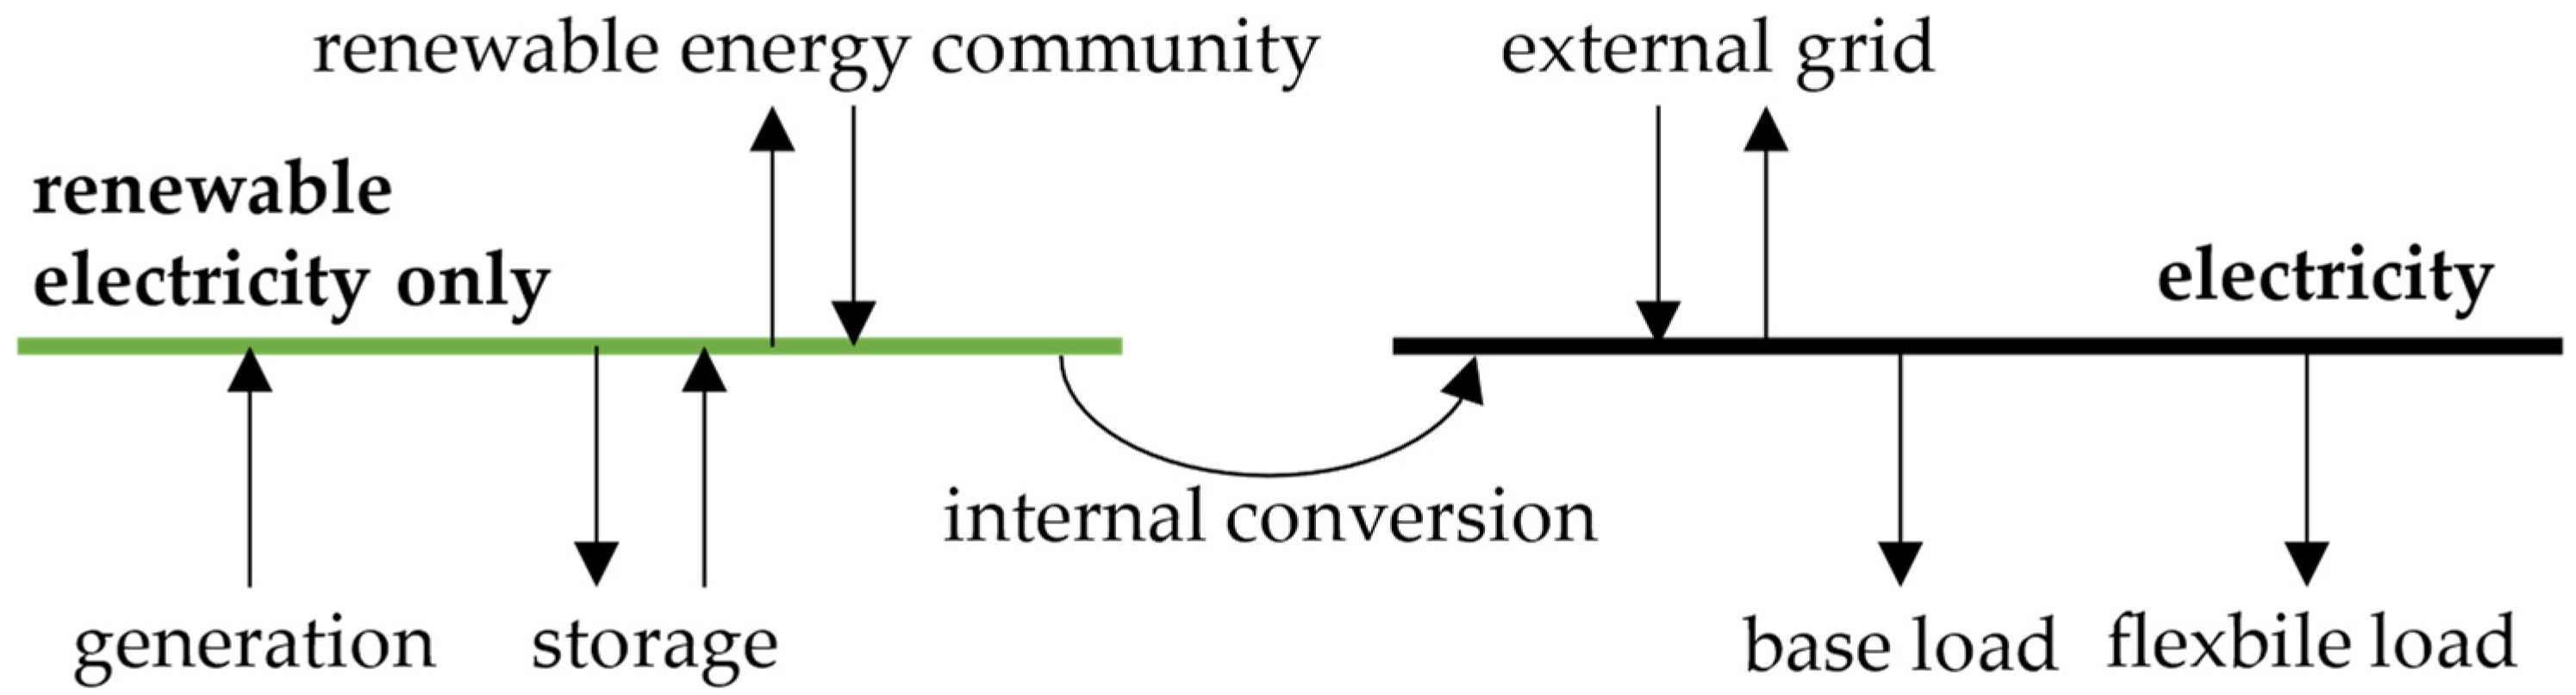
2.1. Simulation Framework for the Renewable Energy Community and Its Participants

The renewable energy community is an aggregation of residential, commercial, or public participants that own and operate energy-related assets. Assets are classified as either generation, storage, base load, or flexible load and divided into controllable and non-controllable assets. PV plants are defined as generation assets and batteries as storage assets. Both charging stations for electric vehicles and heat pumps are flexible loads. All of these, each under specific boundary conditions, are considered as controllable assets. For battery storages, decision variables are the charging and discharging profile of the optimization problem; for EV charging stations and heat pumps, the decision variable is the time of demand response; and for PV plants, the decision variable is the level of curtailment. All non-controllable assets are referred to and aggregated as base load assets. Thus, predicting the demand time series of base loads is an important input variable for the subsequent optimization. If participating in the REC, the target values for the operation of controllable assets are set by the community.
Figure 2 shows all possible energy flow directions in the participant’s energy system. According to the European Directive [11], there are two different categories. One category allows electricity from renewable sources only, while a second category may also contain electricity from conventional generation. Only renewable electricity can be converted into the second category. Via the connection points between the REC and the external grid, electricity from each corresponding category can be purchased and fed in. Base load and flexible loads are assigned to the electricity category that is connected to the external grid, as the community does not always provide a secure supply. Generation and storage are assigned to the renewable energy category in order to allow feeding into and battery charging from the community.
According to the participant’s energy system model, for each participant (p) within the REC and for each time step (t) in the simulation period, the electric power of both categories, ‘renewable electricity only’ (Equation (1)) and ‘electricity’ (Equation (2)), are to be in balance:
P p , t R E C = P p , t g e n e r a t i o n + P p , t s t o r a g e P p , t i n t .   c o n v e r s i o n           t T   a n d   p R E C ,
P p , t g r i d = P p , t b a s e   l o a d P p , t f l e x .   l o a d + P p , t i n t .   c o n v e r s i o n       t T   a n d   p R E C .
The power fed into or purchased from the community ( P p , t R E C ) is equal to the generation ( P p , t g e n e r a t i o n ), the charge or discharge power ( P p , t s t o r a g e ), and the power internally converted into the category ‘electricity’ ( P p , t i n t .   c o n v e r s i o n ). The power exchange with the external grid ( P p , t g r i d ) is equal to the internal renewable energy conversion subtracted by the consumption of base load ( P p , t b a s e   l o a d ) and all flexibles loads ( P p , t f l e x .   l o a d ).
At the renewable energy community level, there is an equilibrium at each time step of the residual power exchanged with the renewable energy community from all participants which are part of the REC:
p R E C P p ,   t R E C = 0                                                           t T .
Non-participants in the renewable energy community located in the supply range of the observed low-voltage substation are modeled using the same approach by omitting the model connection to the REC. In this way, the load can still be covered from the external grid, through self-consumption and stored energy, and surplus generation can be fed into the external grid.
At the asset level, constraints are specified for the four asset types. For generation assets, distinction is made between maximum possible generation ( P r a t e d ), actual generation ( P t g e n e r a t i o n ), and curtailment ( P t c u r t a i l m e n t ) per time step (t) in the simulation period:
0 P t g e n e r a t i o n   P r a t e d ,
P t c u r t a i l m e n t = P r a t e d P t g e n e r a t i o n .
Storage assets are defined by the parameters: nominal capacity (C), minimum and maximum state of charge ( S O C m i n , S O C m a x ), maximum charge and discharge power ( P m a x .   c h a r g e , P m a x .   d i s c h a r g e ), availability (a), charge and discharge efficiency ( η c h a r g e , η d i s c h a r g e ), and the self-discharge coefficient ( φ l o s s ). In storage Equation (6), the charging and discharging power are determined for each time step t:
S O C m i n · C E t   S O C m a x · C ,  
0 P t c h a r g e   a t · P t m a x .     c h a r g e ,  
0 P t d i s c h a r g e   a t · P t m a x .   d i s c h a r g e ,
E t E t 1 Δ t = η c h a r g e · P t c h a r g e 1 η d i s c h a r g e · P t d i s c h a r g e P t s e l f d i s c h a r g e ,  
P t s e l f d i s c h a r g e = φ l o s s · E t 1 Δ t ,           φ l o s s = 0.0001
Flexible loads are coupled with a downstream storage unit, e.g., the battery of an electric vehicle or the thermal storage of a building, so that these can be regarded as converters, with an input power ( P t f l e x .   l o a d ) and output power ( P t d o w n s t r .   c h a r g e ), a rated power ( P r a t e d ), and an efficiency (η):
P t f l e x .     l o a d = 1 η · P t d o w n s t r .     c h a r g e ,     P t f l e x .     l o a d P r a t e d  
Since base loads are not controllable, the demand ( P t d e m a n d ) is covered at each time step t:
P t b a s e   l o a d = P t d e m a n d  
The variables P p , t g e n e r a t i o n , P p , t s t o r a g e , P p , t f l e x .   l o a d and P p , t b a s e   l o a d are considered in the superior participant energy system model and reflect the aggregated values of all assets of the corresponding type belonging to the participant p. For storages, charging and discharging power are combined in one time series.

2.2. Definition of Operation Strategies of the Renewable Energy Community and Its Participants

Three different operation strategies, two of them for the REC and one comparison strategy, are examined, differing in terms of model equations and data exchange:
  • The ‘economic optimum’ strategy focuses solely on the interests of the participants by minimizing the cost of demand and the profit from generation.
  • The ‘maximum grid-friendliness’ strategy leverages the flexibility of the community for an approach that minimizes the annual transformer peak power.
  • The ‘business-as-usual’ strategy provides a comparison and describes the operation of participants’ energy systems without REC participation and optimization.
The approach for the strategy ‘economic optimum’ is a single-objective optimization of the controllable assets based on cost reduction within the REC. The objective function sums the total energy traded with the corresponding prices ( c R E C ) and ( c g r i d ) for all participants in the REC and for each time step of the entire simulation time:
m i n i m i z e     Δ t · t T     p R E C     ( P p ,     t R E C · c R E C + P p ,     t g r i d · c g r i d ) .  
The assumptions for demand and feed-in prices are listed in Table 1. Δt represents the time step period. The constraints are the balance constraints given in Equations (1)–(3), and the asset constraints given in Equations (4)–(12).
In the second strategy, ‘maximum grid-friendliness’, the energy community first uses its flexibility to minimize the annual maximum demand from the external grid before an economic optimization is carried out. For this purpose, an equation to calculate the current load ( P t g r i d ) and the current annual peak load ( P ^ t g r i d ) at each time step at the low-voltage substation is introduced:
P t g r i d =     p R E C     P p ,     t g r i d , P ^ t g r i d = { 0 , t = 0 P ^ t 1 g r i d , t > 0   a n d   P t g r i d P ^ t 1 g r i d P t g r i d , t > 0   a n d   P t g r i d > P ^ t 1 g r i d  
The external grid maximum feed-in is specified by the current annual demand peak at the transformer. Generation can be curtailed at any time step in the simulation environment, so that the feed-in limitation is specified via a boundary constraint. To keep the annual grid power peak at a minimum level and to achieve a maximum grid-friendliness, the objective function is extended by a term that assigns an internal price ( c ^ g r i d ) that is significantly higher than the costs for energy purchase to each increase in annual peak power:
m i n i m i z e           t T ( ( P ^ t 1 g r i d P ^ t g r i d ) · c ^ g r i d + Δ t · p R E C ( P p ,     t R E C · c R E C + P p ,     t g r i d · c g r i d ) ) .  
Thus, on those days when the annual demand peak is not reached in grid-friendly operation, the additional term equals to zero and an economic optimization is carried out.
In a scenario without full participation in the community and without all the assets in the low-voltage grid being under the control of the community, the influence of the non-participants on the substation load is nevertheless considered. Thus, the community operation adjusts to the non-participants’ operation. For this purpose, forecasts of the non-participants’ grid exchange are requested from the DSO and considered for community operation. In this case, the Equation (14) for the current load at the LV transformer station is extended by the share of non-participants:
P t g r i d =     p R E C     P p ,     t g r i d +     p R E C     P p ,     t g r i d
For non-participants, a rule-based operation of the flexible assets is assumed. Thus, battery storages are operated to maximize the self-consumption of PV plants. The operation of the electric vehicle chargers ensures that the assigned batteries are charged at maximum speed and power up to the upper threshold value, if available. The heat pumps are switched on as soon as a state of charge threshold of 30% of the downstream heat storage tank is reached.
For the comparison strategy ‘business-as-usual’, rule-based assumptions for controllable assets are made. The storages are immediately charged if there is a surplus of the participants’ renewable electricity generation, and discharged if electricity would have to be purchased from the grid. Boundary and balance constraints of the storages in Equations (6)–(10) are considered. A possible shift or control of flexible loads, e.g., from charging electric vehicles or heat pumps, is not utilized. Instead, the load is served immediately and as quickly as possible. The prices for buying and selling electricity correspond to those from the definition for external grid prices in Table 1. There is not any other use of flexibilities elsewhere in the grid.
The simulations are performed for a calendar year in time step periods Δt of 15 min. Generation and load time series are taken from the SimBench dataset [29]. Optimizations are performed day-by-day, with a forecast horizon of 36 h, assuming perfect foresight. This linear programming (LP) problem is solved by using SCIP [30].

2.3. Definition of Scenarios

To obtain a comprehensive overview of the renewable energy community’s profit and grid-friendliness, various scenarios are simulated. The dataset from SimBench was selected for this purpose, as it is suitable for describing participants, assets, and the grid topology. This source provides 6 different low-voltage grid topologies for rural, suburban, and urban areas, as well as 3 different scenarios representing a low, medium, and extensive deployment of flexible assets. Thereof, the grid topologies LV2 (rural), LV4 (suburban), and LV6 (urban), and the scenario with an extensive deployment of flexible loads, such as heat pumps and electric vehicle charging stations, battery storage, and PV generation, representing the year 2034, are chosen. Detailed information is listed in Table 2.
In order to investigate the adapted behavior of RECs in low-voltage grids with non-participants, different shares of participants rates are considered. These vary from ‘no participation’ to ‘100% participation’, in increments of 25%. The selection of participants for these scenarios is done randomly, independent of participant types or asset parameters.

2.4. Evaluation Metrics

To qualify the grid impact of the REC operation, a daily and an annual power peak ( P ^ g r i d ), demand peak ( P ^ d e m a n d g r i d ), and feed-in peak ( P ^ f e e d i n g r i d ) are defined. The maximum of all 15 min sums of the participants’ energy exchange with the external grid is calculated for the respective period, in this case, one day or one year. The absolute value of the sum is taken for the power peak, the signed value for the demand peak, and the negative signed value for the feed-in peak.
P ^ g r i d = max T (     p R E C     | P p ,     t g r i d | ) ,          
P ^ d e m a n d g r i d = max T (     p R E C     P p ,     t g r i d ) ,         P ^ f e e d i n g r i d = max T (     p R E C     ( P p ,     t g r i d ) ) .  
For a better illustration of financial gains of the REC and for comparing different scenarios, the metrics grid purchase (GPR), REC purchase (RECPR), and self-sufficiency ratio (SSR) are introduced for the communities’ energy consumption ( E R E C c o n s u m p t i o n ). Generation within the community ( E R E C g e n e r a t i o n ) is divided into grid feed-in (GFR), REC feed-in (RECFR), and self-consumption ratio (SCR). Both consumption and generation metrics together always add up to 100%:
G P R = Δ t E R E C c o n s u m p t i o n t T p ϵ R E C ( P p ,     t g r i d ) + ,     G F R = Δ t E R E C g e n e r a t i o n t T p ϵ R E C ( P p ,     t g r i d ) ,
R E C P R = Δ t E R E C c o n s u m p t i o n t T p ϵ R E C ( P p ,     t R E C ) + ,     R E C F R = Δ t E R E C g e n e r a t i o n t T p ϵ R E C ( P p ,     t R E C ) ,
S S R = 1 G P R R E C P R ,     S C R = 1 G F R R E C F R ,  
E R E C c o n s u m p t i o n = Δ t · t T p ϵ R E C ( P p , t b a s e   l o a d P p , t f l e x .     l o a d ) ,    
E R E C g e n e r a t i o n = Δ t · t T p ϵ R E C ( P p , t g e n e r a t i o n ) .
The economic benefit of the renewable energy community for a share of participants of the considered REC ( B R E C ( x ) ) is calculated from the cost of the comparative ‘business-as-usual’ strategy ( C B A U ) and the cost of the community operation, ( C R E C ) as follows:
B R E C ( x ) = C B A U ( 0 ) C B A U ( 1 x ) C R E C ( x ) ,  
C B A U = Δ t · t T     p R E C     ( ( P p ,     t g r i d ) + c b u y g r i d + ( P p ,     t g r i d ) c b u y g r i d ) .
C R E C = Δ t · t T     p R E C     ( ( P p ,     t R E C ) + c b u y R E C + ( P p ,     t R E C ) c s e l l R E C + ( P p ,     t g r i d ) + c b u y g r i d + ( P p ,     t g r i d ) c s e l l g r i d ) .
From the communities’ economic benefit and the participants’ total consumed and generated energy, an average price difference ( Δ p ¯ ) for a given share of participants is calculated:
Δ p ¯ ( x ) = B R E C ( x )   E R E C c o n s u m p t i o n + E R E C g e n e r a t i o n .  
The price difference is equally split into demand and generation, resulting in cost savings from consumption and additional revenue from feed-in. This approach is one way to distribute the total economic benefit among participants. Alternatively, time-based and/or asset-based approaches can be considered that favor participants who provide storage capacity to the overall system.

3. Results

Simulation results concerning operation strategies, different shares of participants, and grid topologies in terms of grid-friendliness and economic profit are presented. By comparing the operation strategies, ‘economic optimum’ and ‘maximum grid-friendliness,’ conclusions about the costs of grid-friendly operation are drawn. This will determine the price that grid operators are required to pay for the renewable energy community to reduce grid peaks.

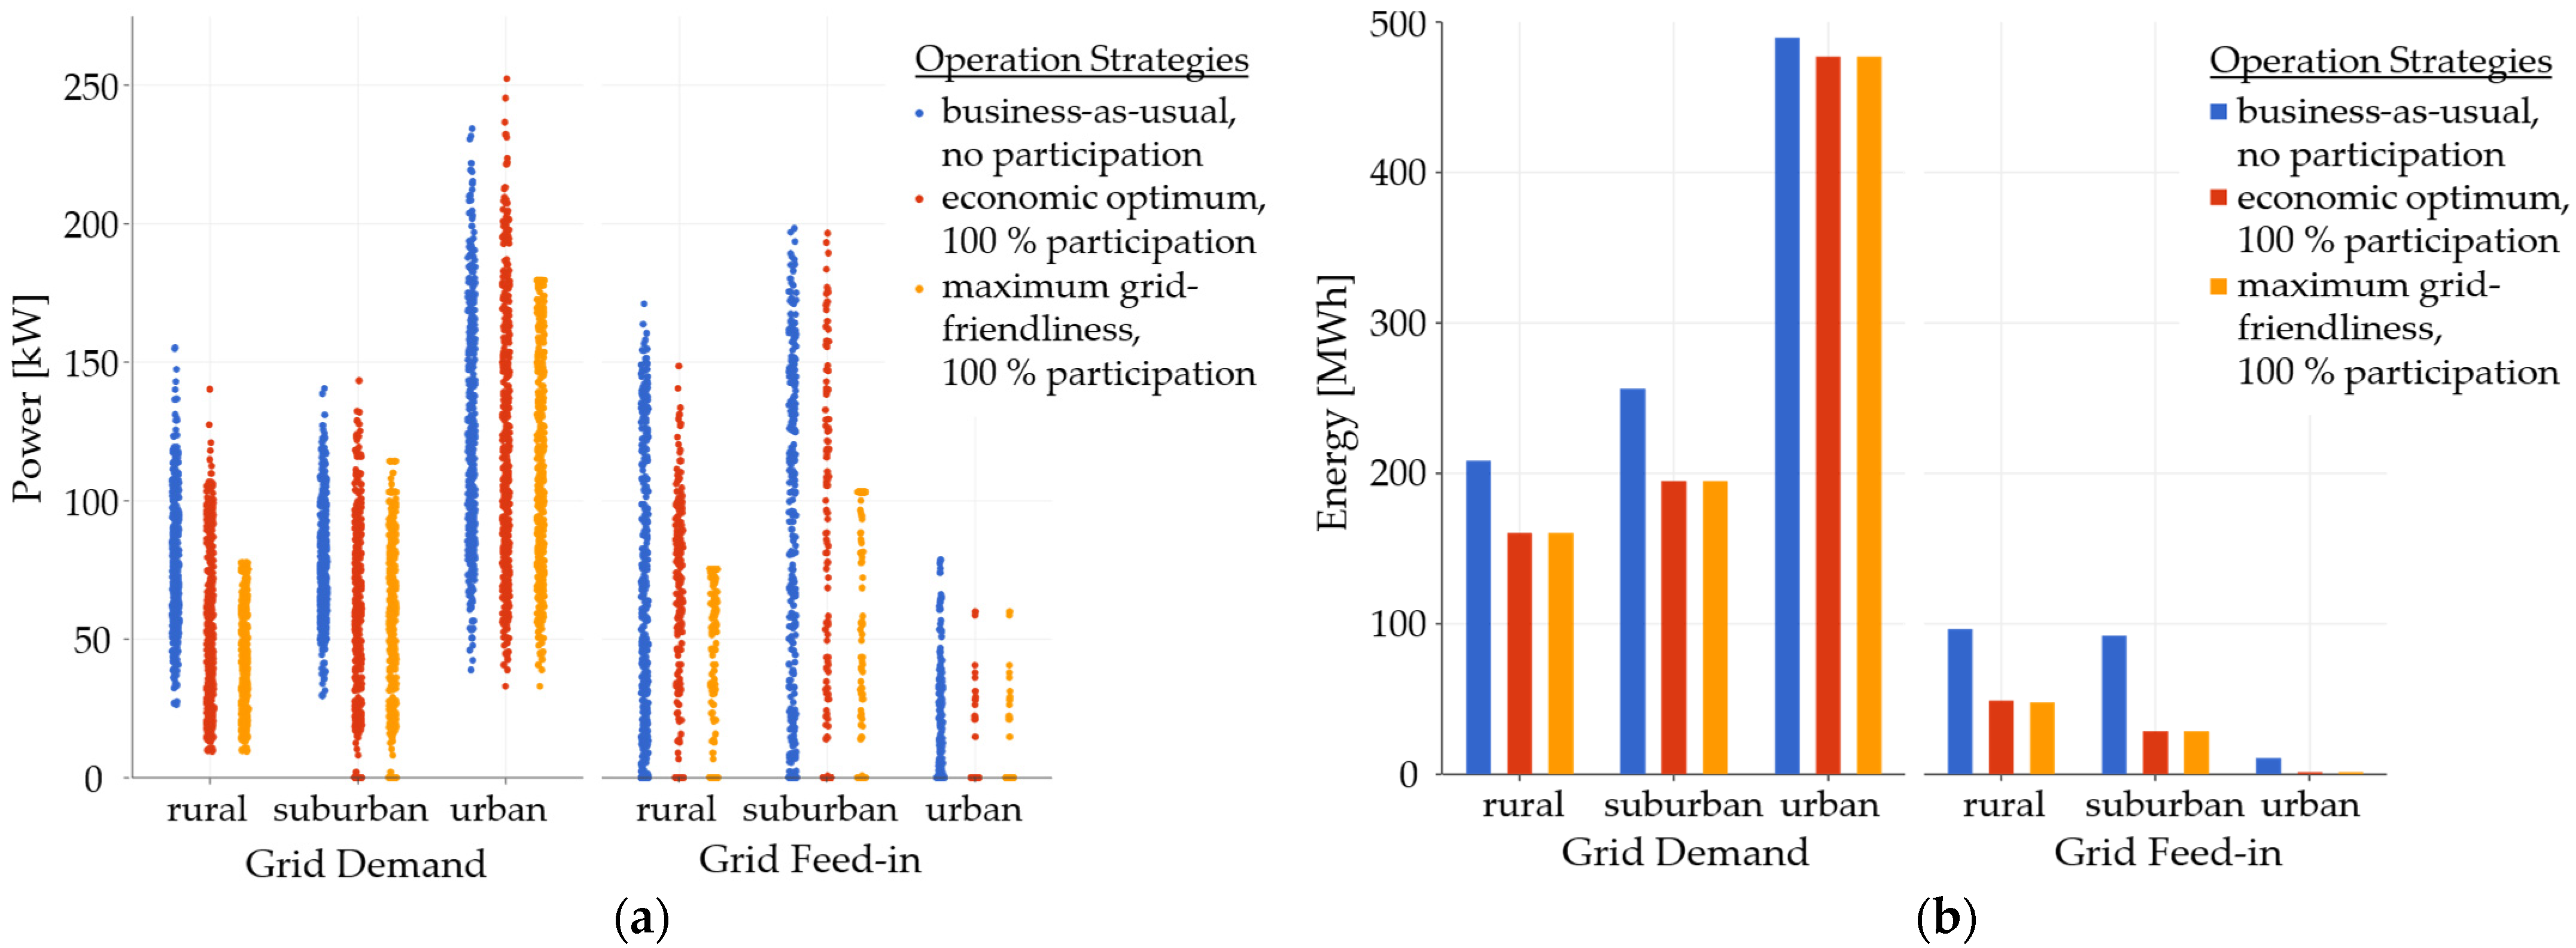
3.1. Renewable Energy Communities Targeting an Economic Optimum and Maximum Gird-Friendliness

The operation strategies ‘economic optimum’ and ‘maximum grid-friendliness’ are considered, each with full participation in the renewable energy community and an optimization-based operation. Furthermore, the comparison strategy ‘business-as-usual,’ without community participation and with a rule-based operation of the flexible assets, is analyzed. Figure 3 illustrates the resulting grid demand and feed-in for all scenarios and strategies.
There is a large scatter over the daily power peaks at the low-voltage transformer in Figure 3a. Zero values for the grid demand show full self-sufficiency and for the grid feed-in, full self-consumption, within the observed area during one day. Through both REC operation strategies, this is reached more often than in ‘business-as-usual’ operation or reached at all, on some days. Whenever values above zero occur, an energy exchange via the low-voltage transformer is required at least once a day to cover the demand or to feed in energy surplus. The annual peak load, used for designing the transformer, differs significantly when comparing the three strategies. As listed in Table 3, in the column ‘economic optimum,’ there is no general trend in the annual peak power. In the rural case, it is lower; in the suburban case, about the same; and in the urban case, it is higher than in the ‘business-as-usual’ scenario. Thus, it is difficult for the grid operator to predict whether the operation of flexible assets in this operation strategy might even increase peak loads. This is different with the operation strategy ‘maximum grid-friendliness.’ Here, the peak power is consistently and noticeably reduced by 23% to 55%, compared to ‘business-as-usual’ scenario, and thereby becomes more plannable for grid operators.
Concerning the total energy demand and feed-in, as shown in Figure 3b, the demand is higher than the feed-in in all cases; although, e.g., in rural and suburban areas, the annual peak feed-in can be higher than the peak demand. Clearly, the establishment of RECs stimulates a change in the behavior of participants compared to the ‘business-as-usual’ operation, resulting in less energy being fed in from local generation and correspondingly, less energy required from outside of the community. The differences in exchanged energy between ‘economic optimum’ and ‘maximum grid-friendliness’ strategies are negligible and can be explained by temporary curtailment of PV plants in rural and suburban areas, as well as different energy losses due to changes in storage operation. Thus, one goal of renewable energy communities, namely increased energy sharing to increase the consumption of renewable energy close to generation, is not in conflict with the grid-friendliness of the community.

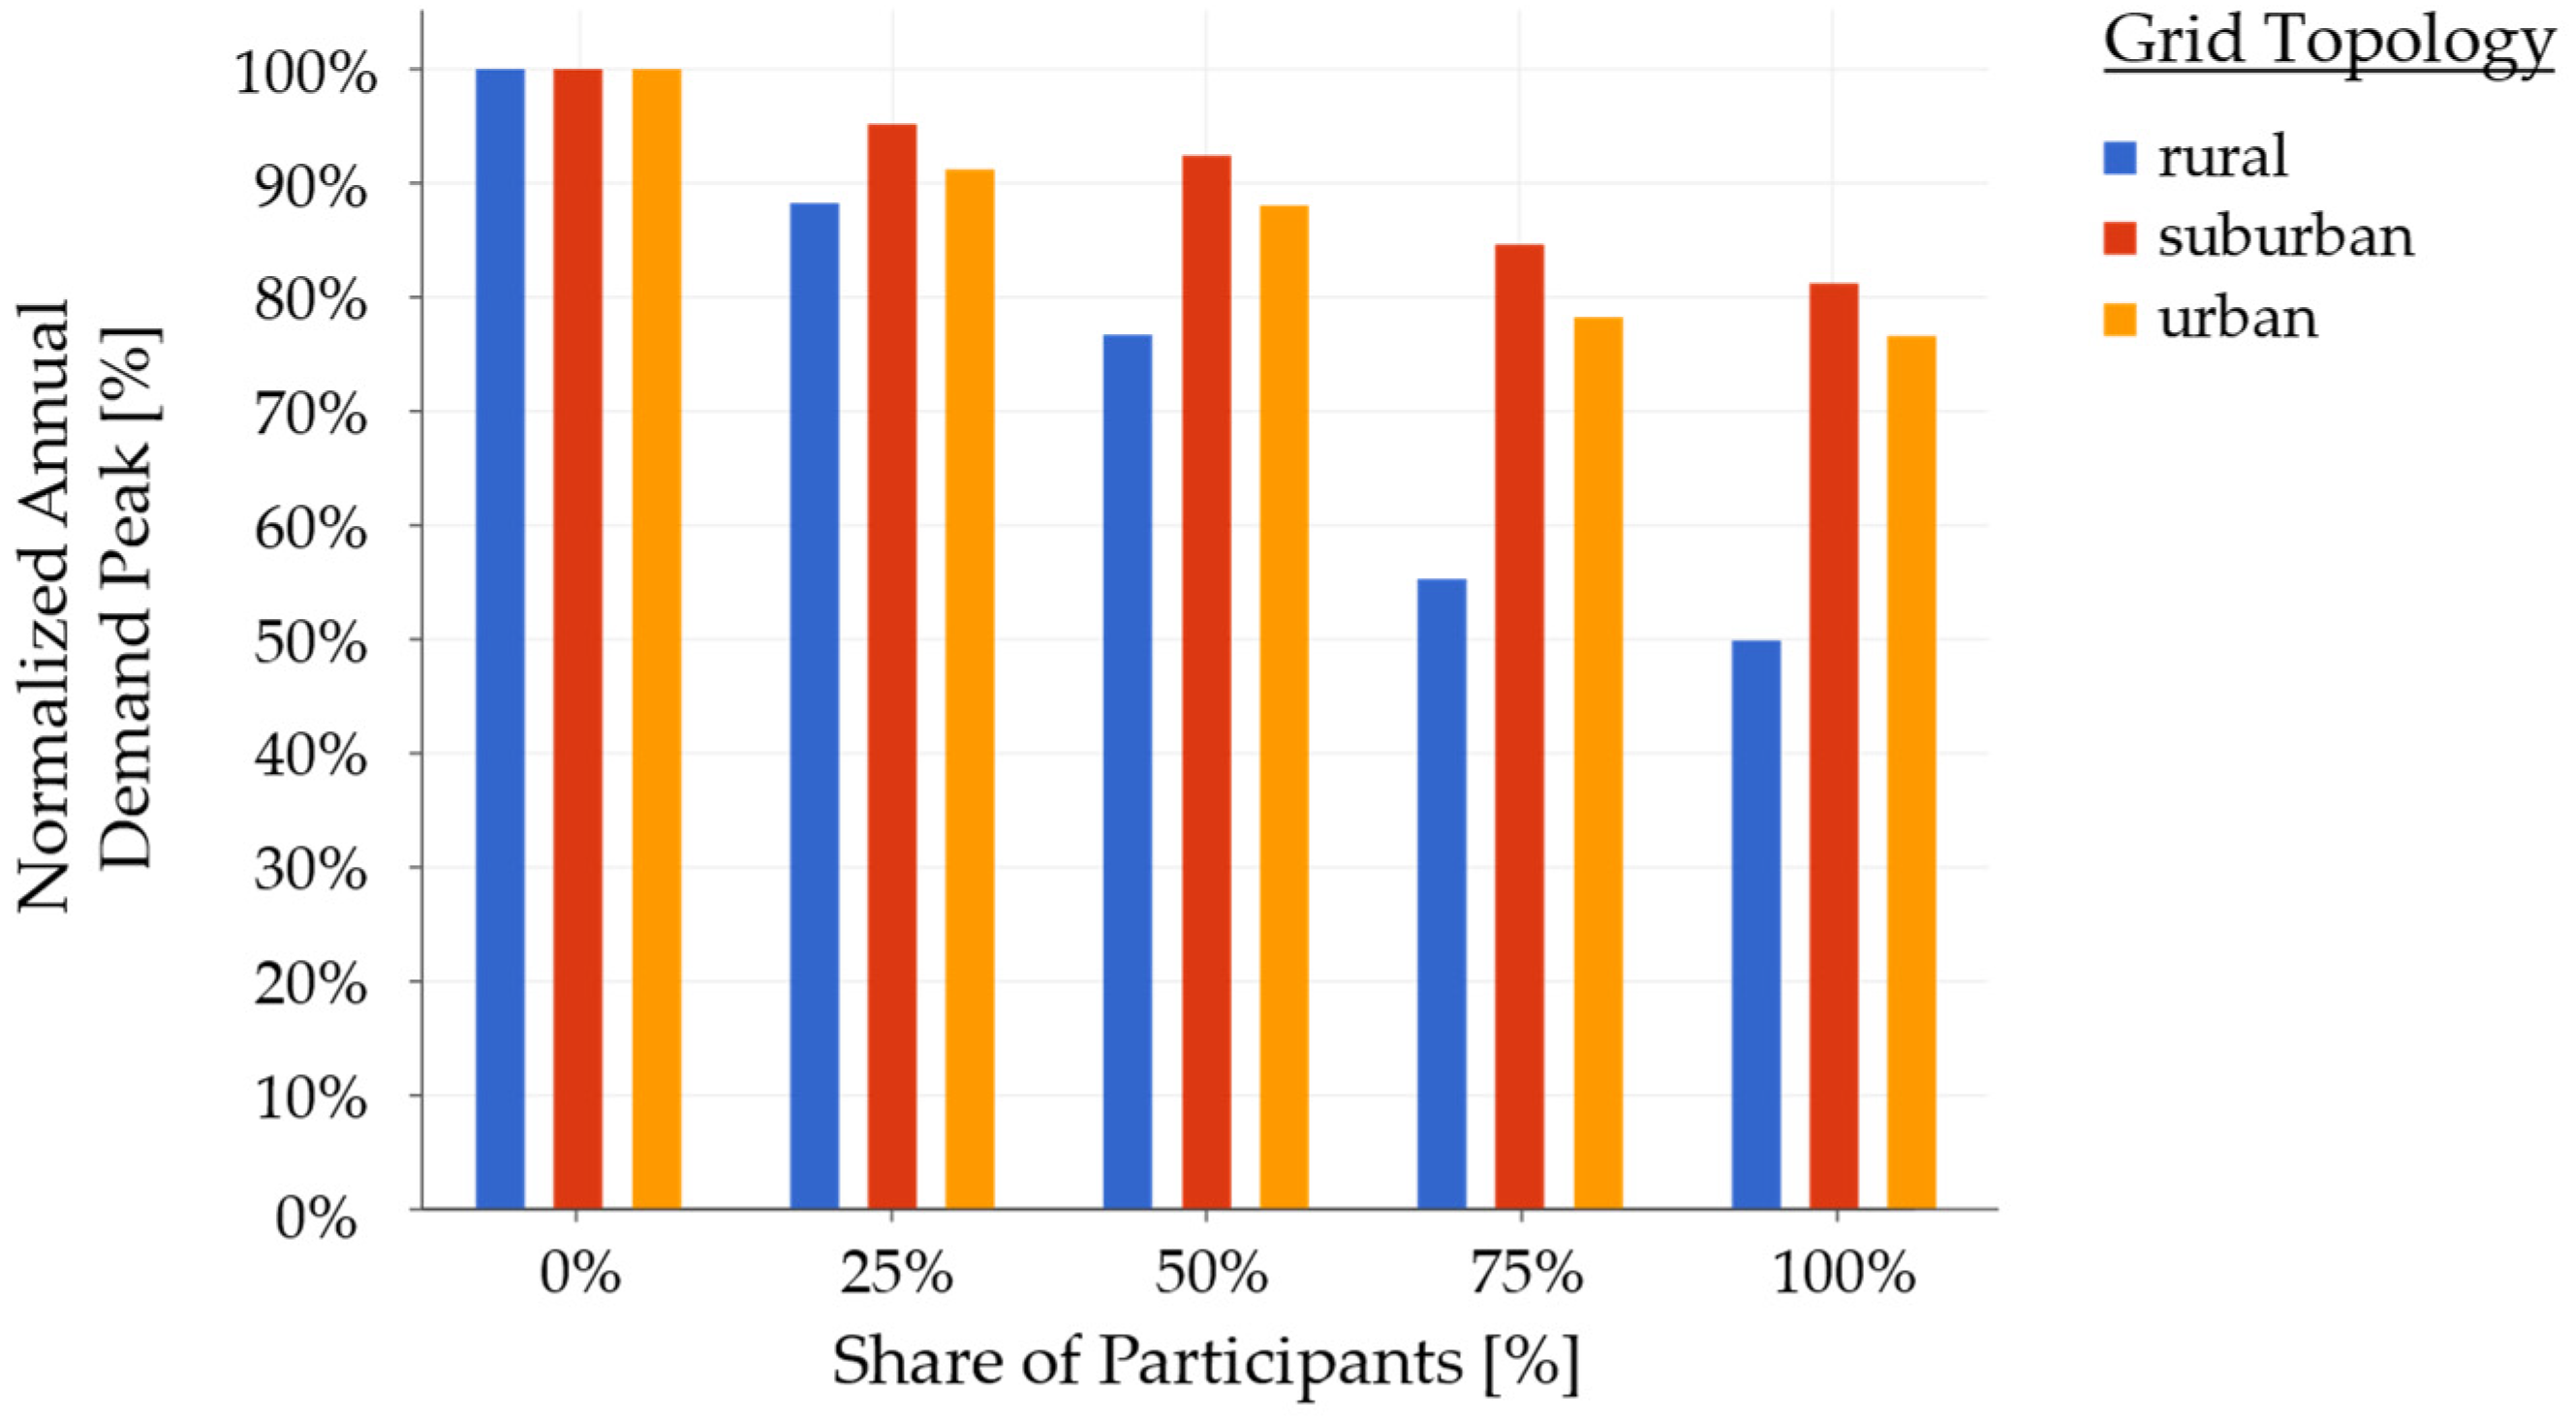
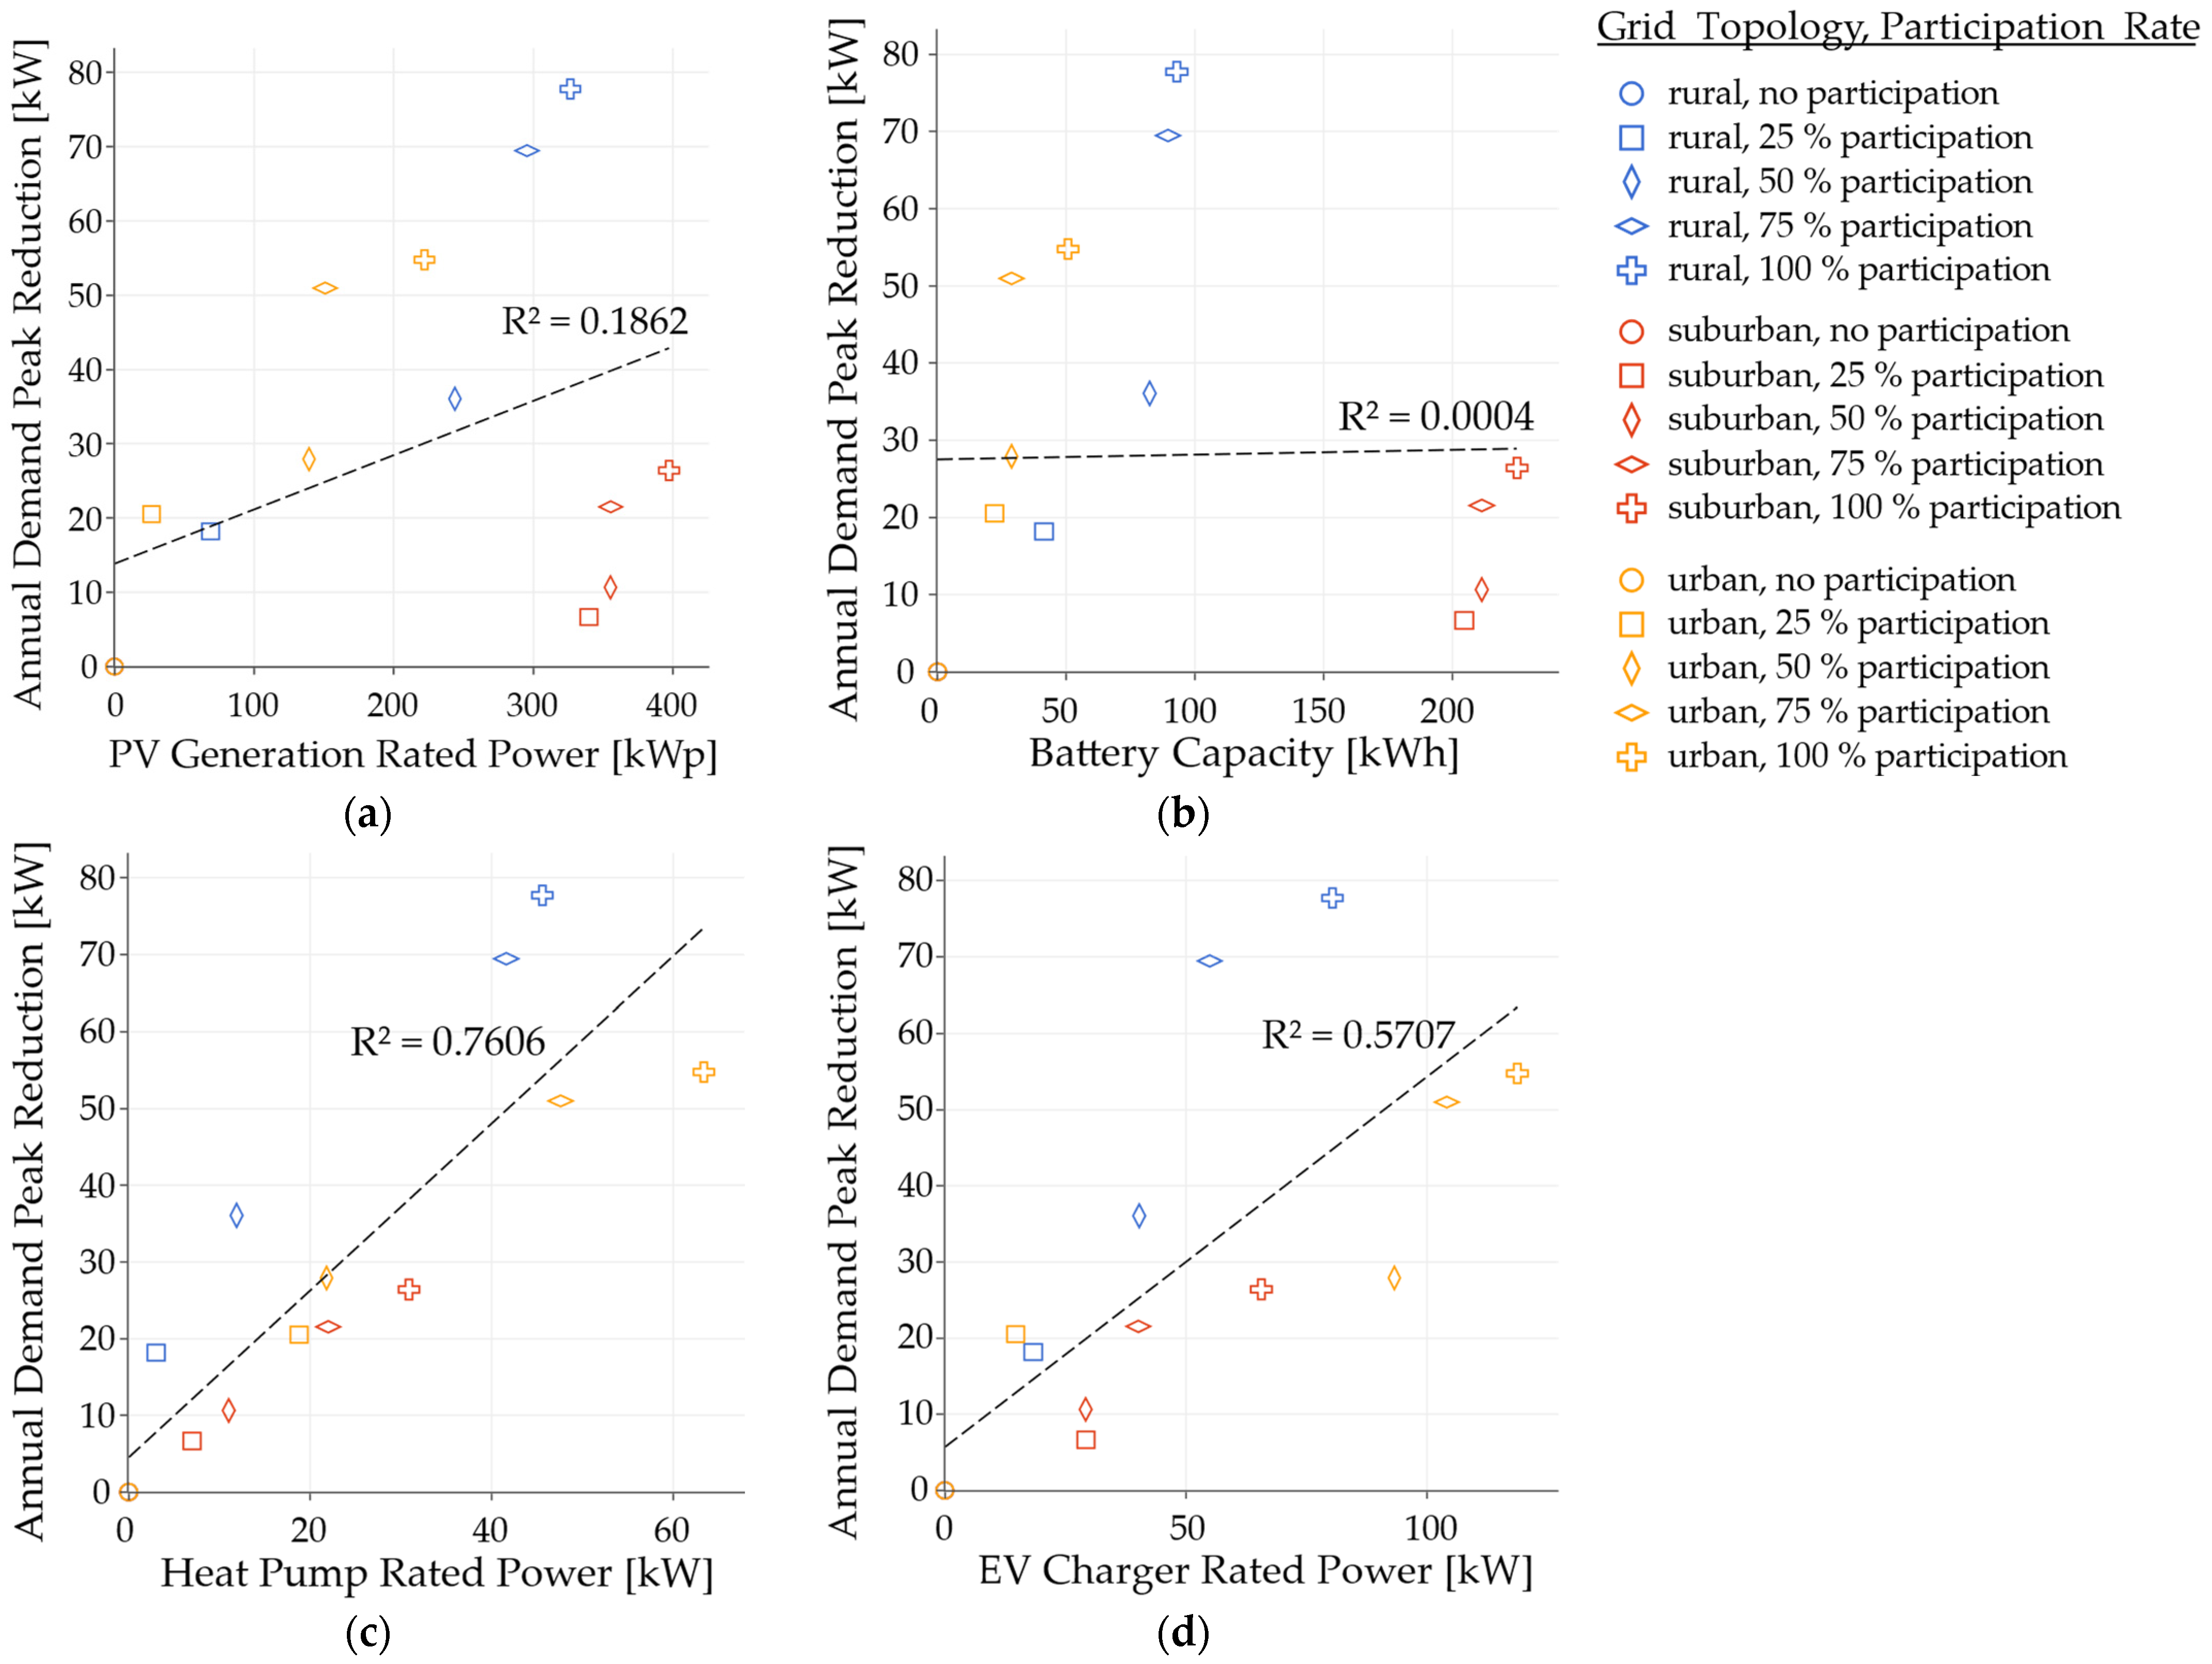
3.2. Peak Demand Limiting Considering Different Shares of Participants

The ‘maximum grid-friendliness’ strategy is further evaluated, assuming that some citizens, SMEs, or local authorities with assets in the supply range of the low-voltage substation do not participate in the renewable energy community, or have not yet registered. Therefore, the questions of whether a minimum size of the community is required to provide a significant reduction in peak power and how the grid benefits increase with size are addressed.
Figure 4 shows the reduction in the annual demand peak as a function of the shares of participants as an input parameter. For comparability, the peak power is normalized using the previously identified maximum annual demand peaks of the ‘business-as-usual’ operation of 155.2 kW (rural), 140.6 kW (suburban), and 234.3 kW (urban).
It can be stated that the reduction in the peak demand is not only possible starting from a certain number of participants, but even from small shares of participants when either a flexible consumer or a combination of power generation and storage is available in the community. According to Figure 4, the analysis of the participant level shows that the reduction increases approximately linearly with the number of participants in all grid topology scenarios.
To determine the influence on the amount of peak reduction by the ‘maximum grid-friendliness’ strategy, an analysis of asset types is performed. This is illustrated in Figure 5 considering the design parameters of the assets controlled by the community. These are the rated PV power in kWp, storage capacity in kWh, and flexible load in kW, divided into heat pumps and charging stations for electric vehicles. The correlation between peak reduction and installed assets is shown in each diagram. For this, a linear regression is used, in combination with the coefficient of determination R².
When considering the largest peak reduction, the ‘rural’ case, with a share of participants of 100%, it is noticeable that no asset type has the highest individual value, yet a comparatively high value is found throughout. The doubling of the power reduction in the ‘rural’ case, with 50% to 75% participation, is driven by an increase in charging stations and especially heat pumps, but not in storage capacity or PV generation. The same is also evident in the ‘suburban’ and ‘urban’ scenarios, if the community grows from 50% to 75% participation. Here, the load reduction at the transformer doubles, without any significant increase in battery storage or PV generation. In the ‘suburban’ case, despite the high installation of storage and PV, the lowest demand peak reduction is achieved because there is less flexible load.
The installed capacity of heat pumps in the renewable energy community contributes, with a large positive linear association (R² = 0.7606), to the peak load reduction. One reason is that heat pumps are always available as a flexible load, since the downstream storage, either as a tank or as the thermal inertia of a building, is available at any time. Another reason is that the time of peak annual demand occurs in winter, when heat pump consumption is high; thus, temporarily turning off the heat pump is particularly effective at this time. In the case of the charging stations, in contrast, the flexibility is comparatively lower, with a medium positive linear association (R² = 0.5707), since the electric vehicle as the storage is not connected and can be charged at any time. Nevertheless, a correlation between installed charging power and peak reduction is observed.
There is no consistency in the influence of PV generation and storage capacity on the demand power peak. Figure 5a,b show an ambivalence between the grid topologies ‘rural’ and ‘urban,’ on the one hand, and ‘suburban,’ on the other hand. This arises from the influence of the location. In the ‘rural’ and ‘urban’ grid areas, there is a low generation from PV, even on the day of the annual demand peak in December. However, in the ‘suburban’ area, one day coincided with the peak demand when there was no power generation within the REC, e.g., due to snow coverage. For this reason, no (R² = 0.0004), or only a small positive linear correlation (R² = 0.1862), can be derived. However, if, as in the ‘rural’ and ‘urban’ cases, generation is available at or right before the time of the annual demand peak, higher installed generation power and battery capacity are shown to result in a larger reduction potential.

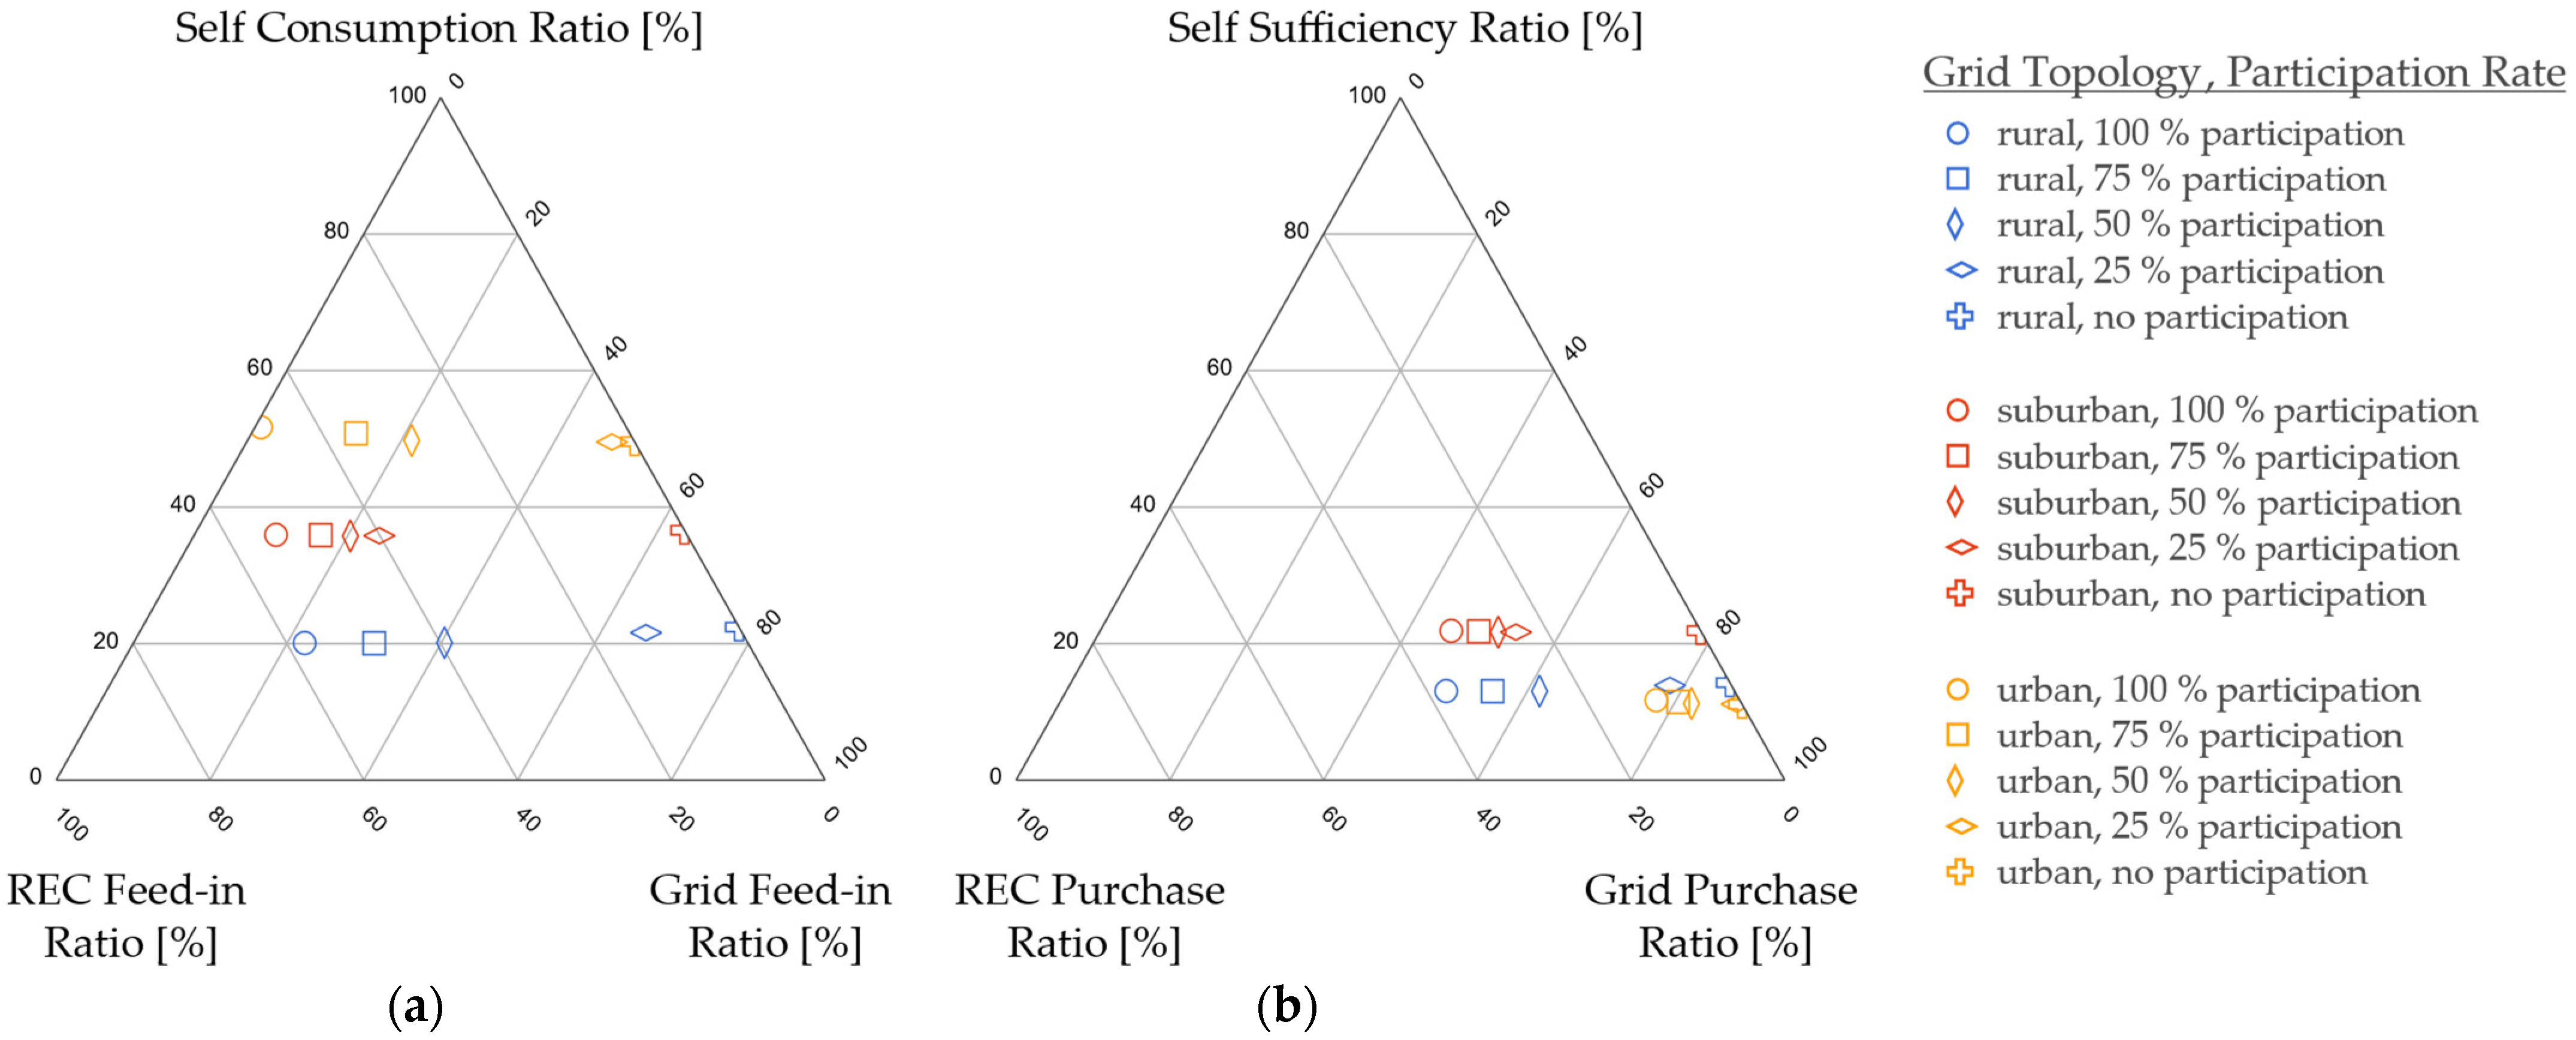
3.3. Economic Benefits and Incentives Required for Grid-Friendly Operation of Renewable Energy Communities

Economic benefits can be achieved, as described in Equations (15) to (18), by a change in price or in the operation of the renewable energy community. Firstly, profits are realized from cheaper energy supply via self-consumption or purchase from the REC. Secondly, higher revenues for energy feed-in, e.g., via energy sharing within the REC, also increase profits. Therefore, how the indicators for the composition of generated and consumed energy change in the scenarios examined is first considered.
Figure 6 shows a breakdown of both the total energy generated and consumed by all participants for the ‘economic optimum’ strategy. On the left side, generation is divided into a self-consumption ratio, as well as ratios of grid feed-in and REC feed-in of surplus energy. In a similar way, on the right, the share of energy consumed is divided into ratios of self-sufficiency, as well as grid purchase and REC purchase of residual energy.
It is observed that self-consumption and self-sufficiency ratios remain unchanged by the renewable energy community, since batteries are operated to optimize self-consumption, even in the ‘business-as-usual’ comparison scenario without REC participants. However, the feed-in destination of energy surplus, as well as the source of residual demand, differs, so that the proportion of locally shared energy increases continuously as the size of the energy community rises.
Given this change in the operation of participants’ flexible assets and the reduced grid fees for local energy sharing, there is an economic benefit for participants in the REC. Table 4 summarizes the average price differences of all simulations. The results are valid for both REC operation strategies, since there are no relevant differences at the considered accuracy. The decline of the economic benefit for the ‘maximum grid-friendliness’ compared to ‘economic optimum’ strategy is limited in the rural grid to 0.6% for 100% participation and 0.3% for 75% participation. In all other cases, it is less than 0.1%. Due to the low opportunity costs, peak reduction by grid-friendly RECs might be a cost-effective way to defer future reinforcements of low-voltage transformers.
The financial benefit is high in cases with a large exchange of energy within the REC, since both giving and receiving parties profit from this. Since REC feed-in and REC purchase ratios are high, as shown in Figure 6, the price difference is the largest in the ‘rural’ and ‘suburban’ cases, with about 2 ct/kWh. In the ‘urban’ case, the installed generation is not sufficient to realize a larger REC purchase ratio, resulting in a reduced profit of about 1 ct/kWh. The savings in the ‘rural’ and ‘urban’ case are already high when the share of participants is low and increase slightly with rising REC size, so that there is an interest for the community to grow. However, this is not generally transferable, as there are constellations of less participants that are favourable for individuals. In the ‘urban’ case, the highest profit per participant is achieved at a share of 50% participation. For higher values, it decreases slightly because the total profit of the REC is not increased to the same extent.

4. Discussion

As mentioned initially, previous studies show a potential for peak reductions in low-voltage grids through the future expansion of flexible assets. They further point out that interactions between grid customers must be considered when planning grid reinforcements, and that customers can reduce their electricity costs by using their own flexibilities. All three points are confirmed by the simulation results of this study for renewable energy communities. In addition, the study shows that there is no minimum size required for an REC to offer grid services effectively, and the peak reduction potential grows linearly with the parameters of available assets in the community. Moreover, the grid-friendly use of flexibilities is possible, without any significant economic losses in operation.

4.1. Limitations

It should be noted that modeling assumptions were made that might influence the results. As already mentioned in the description of the operation, a perfect foresight of all loads, generators, and the availability of flexible loads, such as electric vehicles, were assumed for a period of 36 h. In practice, forecasts, both for the weather and for consumption patterns, are subject to uncertainties. These can affect the results bidirectionally, as at certain times, there might be greater or less flexibility than predicted. In general, however, forecast uncertainties reduce the ability to plan, and hence might have an influence on the potential reduction of annual peaks.
Another assumption relates to the controllability and communication of asset data. It is assumed that all flexible assets can be controlled by specifying target values from the community optimization, and that all target values are met. In fact, it might happen that flexible assets, such as battery storage, do not offer appropriate communication interfaces and are therefore not controllable. Likewise, it cannot be assumed, in general, that forecasts of all assets are given and available for the REC. When calculating the REC operation considering non-participants, aggregated time series data are transmitted by the DSO. To what extent this is permissible must be verified under data protection laws.

4.2. Future Research Directions

The paper leaves spaces for further and more detailed future analysis, primarily in two research fields. On one hand, the existing software module can be expanded to include a forecasting service. This should be able to predict different types of time series, such as weather-dependent data, e.g., the generation of PV plants or wind turbines, as well as daily, weekly, or seasonal patterns, and behavior-dependent data, e.g., the availability and charging demand of electric vehicles. This allows a day-ahead optimal control to be calculated for the real time operation of RECs.
On the other hand, the legal conditions regarding implementation at an EU member level for renewable energy communities should be considered and analyzed regarding their effects on the operation. The effects of various incentive schemes, such as time variable prices, for the provided flexibility should be analyzed. Aspects of grid-friendliness and economic benefits can both be investigated, aiming to identify which regulation or incentive scheme is most advantageous. This would allow a more detailed analysis on the specific benefits per asset or participant and moreover, the creation of a model as a guideline for policymakers that addresses various stakeholder interests in the best possible way.
The regulatory framework allows more complex setups of RECs, e.g., multiple RECs below one substation, or one REC distributed over multiple substations. Future research could address the interaction between DSO and multiple RECs, or many-to-many relationships of RECs.

5. Conclusions

The analysis shows that a multi-site energy management system, in the form of a renewable energy community, is suitable to reduce annual peak loads on low-voltage substations. However, setting the right framework conditions, either through legal requirements or incentives, is decisive for the success of RECs. If the regulation is misleading, the community may benefit, e.g., from reduced grid charges, without justifying this by a grid-friendly operation. An operation that relieves the electric grid can only be achieved with suitable models. This work proposes one model that additionally considers non-participants’ residual loads in the supply range of the transformer to limit its peak power. Using local flexibility, this might be cost-effective and help to integrate renewable energies close to the point of consumption. Against the background of the electrification of the heating and transport sectors and the associated uptake of heat pumps and electric vehicle charging points, a grid-friendly REC operation is required. The analysis in this paper shows that using these assets can contribute to a reduction of peaks, as their flexibility shows the largest impact in the analysis.
From a distribution system operator’s perspective, the aggregation of participants in an REC offers an advantage, as the community has a self-interest for providing their flexibility potential. This allows the DSO to access many flexible assets by a single connection and to achieve a grid-friendly and plannable operation of these assets. Otherwise, the DSO either has to establish communication with individual users in the supply range, or risks the flexibilities being used for other business models that do not correspond to the interests of the DSO. The described interfaces for a grid friendly operation of an REC could be further extended to cover grid services, such as short-term flexibility provision or redispatch.

Author Contributions

Conceptualization, R.S. and S.S.; methodology, R.S.; software, R.S. and S.S.; validation, S.S., S.T. and S.N.; formal analysis, R.S.; investigation, R.S.; resources, R.S. and S.S.; data curation, R.S.; writing—original draft preparation, R.S.; writing—review and editing, S.S., S.T. and S.N.; visualization, R.S.; supervision, S.S., S.T. and S.N.; project administration, S.T.; funding acquisition, S.T. and S.N. All authors have read and agreed to the published version of the manuscript.

Funding

This research received no funding.

Institutional Review Board Statement

Not applicable.

Informed Consent Statement

Not applicable.

Data Availability Statement

Not applicable.

Acknowledgments

The presented work was supported by the research team of Aspern Smart City Research (ASCR). The presented approach will be implemented and tested in a simulation environment first and then realized as a demonstration within the Smart City testbed in Vienna.

Conflicts of Interest

The authors declare no conflict of interest.

Abbreviations

DSODistribution System Operator
EUEuropean Union
EVElectric Vehicle
LPLinear Programming
LVLow Voltage
PVPhotovoltaic
RECRenewable Energy Community
REDRenewable Energy Directive
SME Small and Medium-sized Enterprises
Variables:
aavailability
Beconomic benefit
c ,   c ^ specific cost, specific peak cost
Cstorage capacity, total cost
Eenergy
GFRgrid feed-in ratio
GPRgrid purchase ratio
ηefficiency
P ,   P ^ power, peak power
φ loss self-discharge coefficient
coefficient of determination
RECFRREC feed-in ratio
RECPRREC purchase ratio
SCRself-consumption ratio
SOCstate of charge
SSRself-sufficiency ratio
t, T, Δttime step, simulation period, simulation time step interval
xshares of participants
Indices:
base loadaggregation of base loads
BAUbusiness-as-usual scenario
buyenergy purchase
chargestorage charging
consumptionenergy consumption
curtailmentcurtailment of generation
demandenergy/power demand
dischargestorage discharging
downstr. chargecharging of a downstream storage asset
feed-inenergy/power feed-in
flex. loadflexible loads
generationgeneration asset
gridexchange with external grid
int. conversioninternal conversion from ‘renewable electricity only’ to ‘electricity’ category
max. chargemaximum charging power of storage
max. dischargemaximum discharging power of storage
pparticipant index
ratednominal asset power
RECexchange with Renewable Energy Community
self-dischargestorage loss by self-discharge
sellenergy sale
storage storage asset
t time step index

References

  1. European Commission. The European Green Deal; European Commission: Brussels, Belgium, 2019. [Google Scholar]
  2. European Commission. REPowerEU: Joint European Action for More Affordable, Secure and Sustainable Energy; European Commission: Strasbourg, France, 2022. [Google Scholar]
  3. European Commission. EU Solar Energy Strategy; European Commission: Brussels, Belgium, 2022. [Google Scholar]
  4. The DfT and BEIS. COP26 Declaration: Zero Emission Cars and Vans; The DfT and BEIS: Glasgow, UK, 2021. [Google Scholar]
  5. Thormann, B.; Kienberger, T. Evaluation of Grid Capacities for Integrating Future E-Mobility and Heat Pumps into Low-voltage Grids. Energies 2020, 13, 5083. [Google Scholar] [CrossRef]
  6. Navarro-Espinosa, A.; Ochoa, L.F. Probabilistic Impact Assessment of Low Carbon Technologies in LV Distribution Systems. IEEE Trans. Power Syst. 2016, 31, 2192–2203. [Google Scholar] [CrossRef]
  7. Wolisz, H.; Punkenburg, C.; Streblow, R.; Müller, D. Feasibility and Potential of Thermal Demand Side Management in Residential Buildings Considering Different Developments in the German Energy Market Q. Energy Convers. Manag. 2016, 107, 86–95. [Google Scholar] [CrossRef]
  8. López, M.A.; De Torre, S.; Martín, S.; Aguado, J.A. Electrical Power and Energy Systems Demand-Side Management in Smart Grid Operation Considering Electric Vehicles Load Shifting and Vehicle-to-Grid Support. Int. J. Electr. Power Energy Syst. 2015, 64, 689–698. [Google Scholar] [CrossRef]
  9. Venegas, F.G.; Petit, M.; Perez, Y. Active Integration of Electric Vehicles into Distribution Grids: Barriers and Frameworks for Flexibility Services. Renew. Sustain. Energy Rev. 2021, 145, 111060. [Google Scholar] [CrossRef]
  10. Parag, Y.; Sovacool, B.K. Electricity Market Design for the Prosumer Era. Nat. Energy 2016, 1, 16032. [Google Scholar] [CrossRef]
  11. European Parliament DIRECTIVE (EU) 2018/2001 OF THE EUROPEAN PARLIAMENT AND OF THE COUNCIL of 11 December 2018 on the Promotion of the Use of Energy from Renewable Sources. Off. J. Eur. Union 2018, 2018, 82–209.
  12. Bundesministerium für Klimaschutz Umwelt Energie Mobilität Innovation und Technologie Erneuerbaren-Ausbau-Gesetz. In 733 der Beilagen zu den Stenogr. Protok. des Natl. XXVII. GP; Bundesgesetzblatt: Vienna, Austria, 2021; pp. 1–97.
  13. Ministerio para la Transición Ecológica RD 244/2019, 5 Abril, Por El Que Se Regulan Las Condiciones Administrativas, Técnicas y Económicas Del Autoconsumo de Energía Eléctrica. Boletín Of. Del Estado 2019, 6, 35674–35719.
  14. Conselho de Ministros Decreto-Lei No 162/2019. In Diário da República, 1.a série N.o; Presidência do Conselho de Ministros: Lisboa, Portugal, 2019; pp. 45–62.
  15. Repubblica Italiana Testo Coordinato Del Decreto-Legge 30 Dicembre 2019, n. 162. In Gazz. Uff. Della Repubb. Ital; Ufficio Pubblicazione Leggi e Decreti: Rome, Italy, 2019; pp. 1–84.
  16. Mendicino, L.; Menniti, D.; Pinnarelli, A.; Sorrentino, N.; Vizza, P.; Alberti, C.; Dura, F. Dso Flexibility Market Framework for Renewable Energy Community of Nanogrids. Energies 2021, 14, 3460. [Google Scholar] [CrossRef]
  17. Märzinger, T.; Österreicher, D. Supporting the Smart Readiness Indicator-A Methodology to Integrate a Quantitative Assessment of the Load Shifting Potential of Smart Buildings. Energies 2019, 12, 1955. [Google Scholar] [CrossRef] [Green Version]
  18. Stinner, S.; Huchtemann, K.; Müller, D. Quantifying the Operational Flexibility of Building Energy Systems with Thermal Energy Storages. Appl. Energy 2016, 181, 140–154. [Google Scholar] [CrossRef]
  19. Chen, L.; Xu, Q.; Yang, Y.; Song, J. Optimal Energy Management of Smart Building for Peak Shaving Considering Multi-Energy Flexibility Measures. Energy Build. 2021, 241, 110932. [Google Scholar] [CrossRef]
  20. Martirano, L.; Rotondo, S.; Kermani, M.; Massarella, F.; Gravina, R. Power Sharing Model for Energy Communities of Buildings. IEEE Trans. Ind. Appl. 2021, 57, 170–178. [Google Scholar] [CrossRef]
  21. Stefan, M.; Zehetbauer, P.; Cejka, S.; Zeilinger, F.; Taljan, G. Blockchain-Based Self-Consumption Optimisation and Energy Trading in Renewable Energy Communities. IET Conf. Publ. 2020, 2020, 371–374. [Google Scholar] [CrossRef]
  22. Nan, S.; Zhou, M.; Li, G. Optimal Residential Community Demand Response Scheduling in Smart Grid. Appl. Energy 2018, 210, 1280–1289. [Google Scholar] [CrossRef]
  23. Di Silvestre, M.L.; Ippolito, M.G.; Sanseverino, E.R.; Sciumè, G.; Vasile, A. Energy Self-Consumers and Renewable Energy Communities in Italy: New Actors of the Electric Power Systems. Renew. Sustain. Energy Rev. 2021, 151, 111565. [Google Scholar] [CrossRef]
  24. Weckesser, T.; Dominković, D.F.; Blomgren, E.M.V.; Schledorn, A.; Madsen, H. Renewable Energy Communities: Optimal Sizing and Distribution Grid Impact of Photo-Voltaics and Battery Storage. Appl. Energy 2021, 301, 117408. [Google Scholar] [CrossRef]
  25. Wiesenthal, J.; Aretz, A.; Ouanes, N.; Petrick, K. Energy Sharing: Eine Potenzialanalyse; Institut für ökologische Wirtschaftsforschung (IÖW): Berlin, Germany, 2022. [Google Scholar]
  26. Radl, J.; Fleischhacker, A.; Revheim, F.H.; Lettner, G.; Auer, H. Comparison of Profitability of PV Electricity Sharing in Renewable Energy Communities in Selected European Countries. Energies 2020, 13, 5007. [Google Scholar] [CrossRef]
  27. Heidari Yazdi, S.S.; Rahimi, T.; Khadem Haghighian, S.; Bagheri, M.; Gharehpetian, G.B. Over-Voltage Regulation of Distribution Networks by Coordinated Operation of PV Inverters and Demand Side Management Program. Front. Energy Res. 2022, 10, 1–8. [Google Scholar] [CrossRef]
  28. E-Control Strompreisentwicklung, Tabellarische Darstellung Ab 2016. Available online: https://www.e-control.at/statistik/e-statistik/archiv/marktstatistik/preisentwicklungen (accessed on 30 June 2022).
  29. Meinecke, S.; Sarajlić, D.; Drauz, S.R.; Klettke, A.; Lauven, L.P.; Rehtanz, C.; Moser, A.; Braun, M. SimBench—A Benchmark Dataset of Electric Power Systems to Compare Innovative Solutions Based on Power Flow Analysis. Energies 2020, 13, 3290. [Google Scholar] [CrossRef]
  30. Gamrath, G.; Anderson, D.; Bestuzheva, K.; Chen, W.-K.; Eifler, L.; Gasse, M.; Gemander, P.; Gleixner, A.; Gottwald, L.; Halbig, K.; et al. The SCIP Optimization Suite 7.0. 2020, pp. 1–46. Available online: http://www.optimization-online.org/DB_HTML/2020/03/7705.html (accessed on 30 June 2022).
Figure 1. Graphical summary of the method.
Energies 15 05468 g001
Figure 2. Participant’s energy system model, consisting of categories for renewable electricity only and electricity, the four participant asset types (generation, storage, base load, and flexible load), and the connection points to the external grid and to the renewable energy community.
Energies 15 05468 g002
Figure 3. Comparison of operation strategies in rural, suburban, and urban grid topology regarding external grid exchange with respect to: (a) daily peak power at the low-voltage transformer, separated into demand and feed-in; (b) total energy demand and feed-in via the low-voltage transformer.
Energies 15 05468 g003
Figure 4. Annual demand peak reduction by ‘maximum grid-friendliness’ strategy depending on the renewable energy communities’ share of participants.
Energies 15 05468 g004
Figure 5. Reduction of the annual demand peak by ‘maximum grid-friendliness’ compared to ‘business-as-usual’ strategy, depending on the design parameters of assets controlled by the renewable energy communities: (a) PV generation rated power, (b) installed battery capacity, (c) heat pumps rated power, (d) electric vehicle chargers rated power.
Energies 15 05468 g005
Figure 6. Breakdown based on rural, suburban, and urban simulation cases, different shares of participants, and ‘economic optimum’ operation of (a) generated energy into grid feed-in, REC feed-in, and self-consumption ratio, and (b) consumed energy into grid purchase, REC purchase, and self-sufficiency ratio.
Energies 15 05468 g006
Table 1. Prices for energy purchase from and feed-in into the renewable energy community and the external grid based on electricity prices and regulatory incentive models for local renewable energy communities in Austria [12,28].
UnitPurchaseFeed-In
renewable energy community€/kWh0.15−0.10
external grid€/kWh0.20−0.05
Table 2. Scenario definition based on grid topology, number of residential and commercial participants, and number, installed capacity, and mean installed capacity of flexible assets [29].
RuralSuburbanUrban
residential participants9232102
commercial participants799
no.Øno.Øno.Ø
PV [kWp]1932717.21039739.71922211.7
battery [kWh]818623.34450113710214.6
heat pump [kW]845.65.701030.93.091463.44.53
EV charger [kW]1180.47.31765.69.371011911.9
Table 3. Annual peak power at the low-voltage transformer for operation strategies and scenarios.
Operation StrategyRuralSuburbanUrban
PeakChangePeakChangePeakChange
business-as-usual171.1 kW 198.4 kW 234.3 kW
economic optimum148.5 kW−13%196.6 kW−1%252.3 kW+8%
maximum grid-friendliness77.5 kW−55%114.2 kW−42%179.5 kW−23%
Table 4. Average price difference for both ‘economic optimum’ and ‘maximum grid-friendliness’ strategies of renewable energy community operation.
Δ p ¯ (x) [ct/kWh]RuralSuburbanUrban
25% participation1.97 1.92 0.50
50% participation2.02 1.93 1.34
75% participation2.08 1.961.18
100% participation2.16 1.99 1.04
Publisher’s Note: MDPI stays neutral with regard to jurisdictional claims in published maps and institutional affiliations.

