1. Introduction
The corona wind is an airflow consisting of ionized matter and neutral particles generated by electric discharges [
1,
2,
3]. Non-thermal or cold plasma is capable of being generated by various methods, for instance, dielectric barrier discharge (DBD) requires a high voltage alternate current and an insulating barrier [
4]. The ionic wind generation method studied in this research is corona discharge which takes advantage of using air as a dielectric medium. The corona effect consists of a high-voltage application between two electrodes; when the dielectric strength of the environment is exceeded, ionization of the gas molecules takes place. Consequently, in this physicochemical process, the generation of electrons, charged ions, and free radicals is triggered. These charged species leave the ionization zone and are coupled with neutral particles of the gas present in the drift zone. Through these interactions, where collisions occur between charged species, radicals, and neutral particles, an airflow is created which is called an electric wind or an ionic wind.
Unlike other non-thermal plasma generation systems, the corona phenomenon can be easily achieved and controlled by modifying the design and performance parameters: electrode configuration, electrode dimensions, ionization medium, mode of current application (direct current or alternating current), polarity (positive or negative), or material selection, among others [
5,
6,
7]. Consequently, numerous research studies have focused on developing electrode configurations for later application in industry such as wire-to-plane, wire-to-cylinder, wire-to-plane, point-to-grid, or blade-to-plane fins, for example [
8,
9,
10,
11,
12]. After decades of analyzing this phenomenon, corona discharge-based systems have importantly evolved for progressively reaching industry. Two applications of great present interest, due to the needs required by various industrial sectors, are the cooling of microelectronic systems [
13,
14,
15] and the inactivation of microorganisms on surfaces and indoor air environments [
16,
17]. This latest application has attracted remarkable attention due to the serious health crisis caused by the SARS-CoV-2 virus and the related COVID-19 pandemic. One of the species generated during electric discharge into atmospheric air is the ozone molecule, which is an oxidizing substance used in numerous technological areas [
18,
19,
20]. However, this gas entails also important drawbacks, since it accelerates the degradation of surrounding materials and may cause health problems after inhalation in high concentrations, which should be considered whenever designing and testing these systems. This complication has, in many cases, prevented ionized air generators from being implemented in industrial and social areas. Therefore, the foremost aims for the launch of these electro-fluid-dynamic systems are focused on ensuring a uniform, stable, and safe discharge and defining the available operating parameters according to a developed electrode configuration.
Thus, an electrode arrangement based on wire-to-two fins has previously been studied by several researchers as electrostatic precipitators, evaluating its potential with several geometric and performance parameters [
21,
22,
23]. This research analyzes and optimizes such electrode configuration to achieve an efficient, stable, and long-lasting device. An innovative wire-to-two fin setting, called “EMBID”, is designed, optimized, and experimentally evaluated by applying a positive polarity by direct current in atmospheric air. A single corona filament is characterized from electrical and aerodynamic tests. Its electrostatic behavior is analyzed from the characteristic voltage–current curves (CVCCs) and, in parallel, airflow velocity measurements are recorded. This geometric study initiates an investigation of this corona system configuration for its future use as a purifier of environments and surfaces for subsequent chemical analysis of species generated by ionization. Subsequently, a scale of geometry is evaluated.
The scaled system consists of three wires connected in series to define an improvement in its aerodynamic performance and a new analysis is implemented to determine the efficiency of such improved configuration. In consequence, this study contributes with a design, modeling, prototyping, testing, and optimization methodology for novel electrode configurations in corona discharge systems.
2. Mathematical Model
2.1. Equation of Electrical Behavior in EFD Devices
The corona discharge phenomenon is defined by complex analytical equations to solve due to the large number of parameters influencing the discharge. To achieve empirical mathematical expression with corona systems, Townsend proposed a relationship between the applied voltage (
V) and the current (
I) for a coaxial cylindrical configuration subjected to direct current corona discharge [
24]:
where
I is the current of the phenomenon,
V is the applied voltage,
V0 is the initial voltage, and
K is a constant that depends on geometric and environmental factors. This equation has been evaluated and modified several times to suit different electrode configurations and ionization media. Subsequently, Meng et al. [
25] set out to define an
I-
V ratio that accurately responded to the maximum number of electrode configurations. A logarithmic equation is proposed in which the exponent appears as a coefficient:
where the corona current can be directly expressed as:
where the coefficient m is the slope connecting the logarithms of current and voltage. On the other hand, another important value such as the initial voltage (
V0) is considered. Once this value of
V0 is determined, it expresses the current as a function of the applied voltage and the onset voltage:
Meng et al. [
25] evaluated the effect of geometric and environmental factors according to the values of m,
V0, and
K. These variables are based on the electrode arrangement, the mobility of the species, and the physical parameters of the gas (such as temperature, pressure, and relative humidity (RH)). The values attained among the experts show deviations because the results depend on the conditions in which the research was carried out. Therefore, many researchers define a range of values to contrast the results and check the design and methodology. The parameter m can be determined as the slope of the line accomplished by the relationship described by the logarithms of the applied current and voltage. The values that have been analyzed are around 1.5 and 2 [
26,
27]. From this geometric parameter, m, the electrical behavior of the suggested electrode arrangement will be expressed mathematically.
2.2. Flow Dynamic Equations
The ionic wind generated by the corona effect must be characterized by aerodynamic actions. The relationship between the ionic fluid and the electrical power is defined by the aerodynamic pressure at the system output:
where
p defines the pressure of the system outflow as a function of the density of the gas (
), a loss coefficient (
K), and the velocity of the fluid (
v). Electrostatic equations participate in this characterization. Each infinitesimal volume of air has a charge density due to the applied electric field
. Consequently, the product
determines the electrical force per unit volume that generates a pressure gradient in this infinitesimal volume of air (see Equation (6)). When corona discharge begins, the air between the electrodes has a current density (see Equation (7)):
Equations (6) and (7) are combined, and the pressure gradient is the variation in the pressure in space. The pressure is defined as:
where
rg and
rc are the radii of ground and corona electrodes, respectively. By combining Equations (5) and (8), the velocity is obtained:
where the current density
j depends on the geometry and is proportional to the intensity of current. On the other hand, the constant
K is linked to geometry of the system and can be approximated to the characteristic section (
S). Therefore, the gas velocity is considered proportional to the square root of the corona current [
28]:
Considering a quadratic relationship between current and voltage, the flow velocity must establish a linear relationship with the voltage, approximately [
28,
29]:
If the electrical power is considered as the product of the current and the voltage, the gas velocity will present a non-linear relationship with the power:
This latest expression indicates that there is a maximum velocity that an EFD device can achieve, and, consequently, a limit efficiency. Accordingly, if the mechanical power (
W) and electrical power (
) are considered, the efficiency is defined as:
On the one hand, the electrical power is interpreted as
. Instead, the mechanical power is the time derivative of the kinetic energy of an air mass
[
29]:
where
represents the density of the gas,
S is the characteristic section, and
is the ionic wind. Electrical power can be expressed as:
If Equations (13) and (14) are substituted, the efficiency is specified by the following definition:
Finally, the final efficiency equation is simplified as the quotient of the gas velocity and the velocity of the generated ionic wind is doubled. Therefore, this formula accounts for the low efficiencies achieved.
3. Materials and Measuring Procedures
The EMBID configuration is developed with the aim of generating and directing the largest airflow. The EMBID configuration is schematically presented in
Figure 1. NX-11 (
Siemens PLM Solutions) is used to design the device and NX-11 is employed for optimization purposes. An electrical and dynamic characterization of the ionic flow is carried out to understand the behavior of the system by corona effect. First, an assessment of the characteristic voltage–current curve is performed with different variations between corona and mass electrodes (
g), separations between the planes that configure mass (
D), and the different exit angles of the system (α). In addition, the diameter of the corona filament is studied with 25, 50, and 100 μm. In parallel, the aerodynamic behavior of the flow generated by the discharge is evaluated from the output velocities of the system. After determining the optimal configurations of a single EMBID configuration, the scaling of the arrangement is examined in depth using different performance parameters such as consumption power, system pressures, and the airflow generated. All experiments are carried out in ambient air (T = ~25 °C, RH% = 30%) under atmospheric pressure.
3.1. Electrode Cnfiguration: Optimization of Design and Performance Parameters
A DC discharge of positive polarity is applied between the wire and the ground fins. According to the scheme in
Figure 1, various design parameters are valued. On the one hand, the geometry of the electrodes is studied according to the micrometric dimensions of the tungsten emitter filament with diameters of 25, 50, and 100 mm. Other outstanding design criteria are the distances between electrodes (
g) studied ranging from −1 to 3 mm; the separation between the collecting fins (
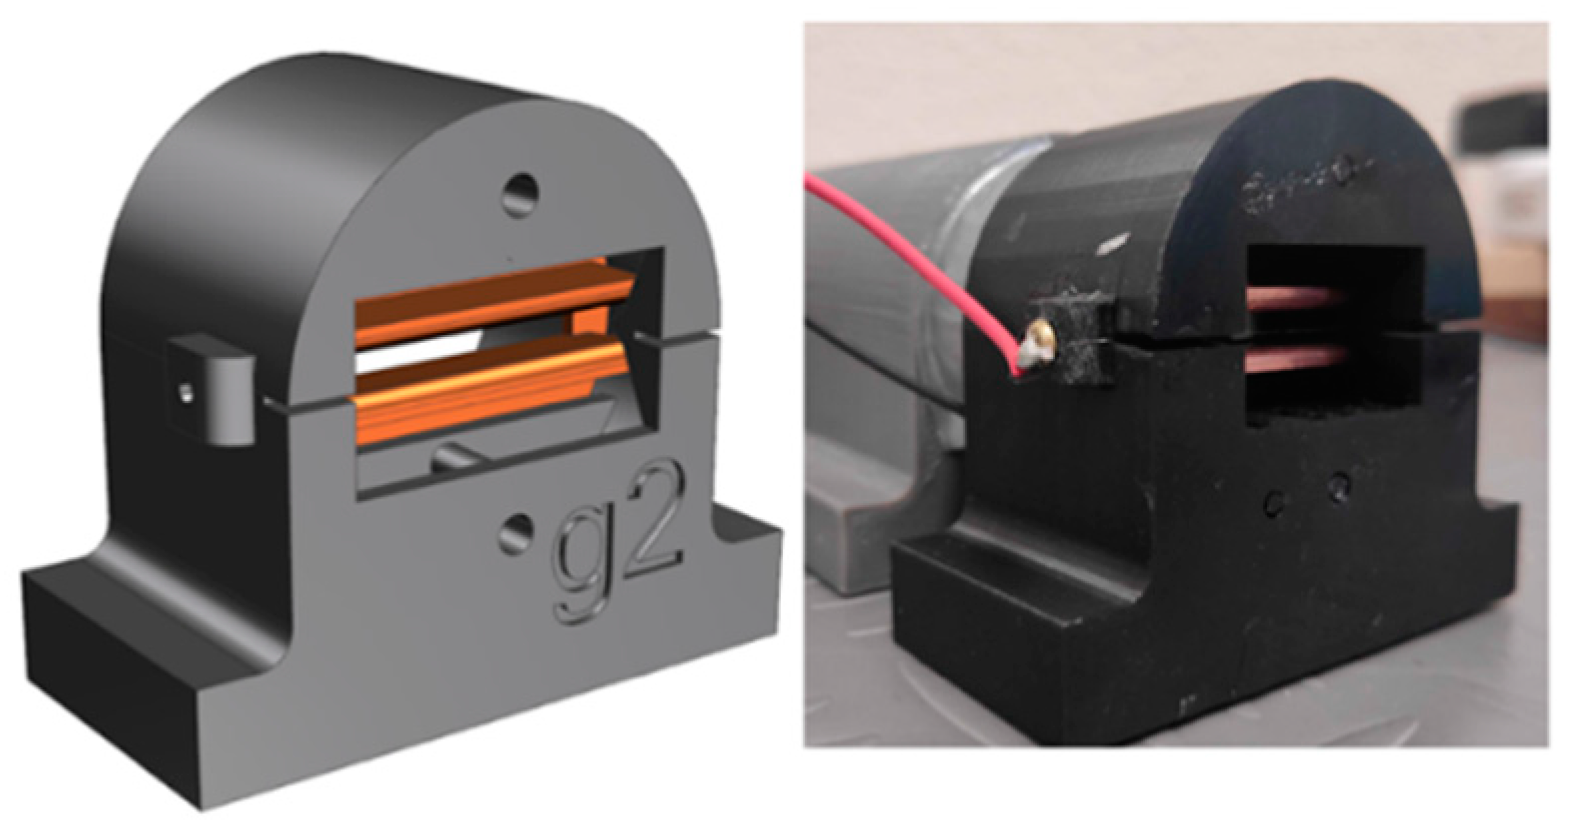
D) ranging from 2 to 3.5 mm; and the angle of inclination at the exit (α) with 80°, 90°, and 100°. The copper and brass ground electrodes are designed and manufactured to these specifications. The electrodes are coupled using a dielectric structure designed using NX Siemens software, version 8.5. The three-dimensional design and assembled prototype are visualized in
Figure 2. From this piece, the filament and metal fins are positioned according to the proposed configuration. The manufacture of these electrically insulating structures is carried out using conventional 3D printing (fused deposition modelling) of polylactic acid (PLA). Thanks to these rapid prototyping techniques, more than 60 configurations are studied, which proves the efficiency of these tools for determining the performance of these devices and for systematically analyzing variations in design parameters and subsequent industrial scaling.
3.2. Experimental Methods: Electrical and Ionic Airflow Characterization
The performance of EFD devices is assessed using electrical and dynamic tests of the ionic wind. A high-voltage direct current power supply (Heinzinger High Voltage Smart Solutions, Rosenheim, Germany, 10,000-5 pos high-voltage laboratory LNC model) is used for testing to produce non-thermal plasma. The emitter electrode (micrometric filament) is connected to the source with a voltage between 0 and 10 kV, while the collector electrode (fins) is grounded. The electrostatic behavior is justified by the CVCCs and the onset voltage of the phenomenon. This method is carried out with different voltages and different geometries to achieve greater accuracy in data collection. Each experimental analysis with more than six repetitions is studied for the configuration shown. These data help to optimize disposition from an empirical and theoretical point of view.
The experimental procedure of taking different velocity measurements on the device to verify the suction and blowing zone. In the single corona filament devices, EMBID configuration velocities at the output of the system are analyzed by means of a dielectric pressure probe that measures the total pressure and static pressure of the ionized airflow. This system consists of a differential pressure sensor (Sensirion model, SDP610-125Pa)and an Arduino board. For accuracy issues, in general, instead of taking pressure measurements (1 Pa approximately), velocity values (0.01 m/s accuracy) are preferred, as they are a direct equivalence calculated by the anemometer. In such a way, the measurements of dynamic velocity (Pitot tube) and static pressure (orifice in tunnel walls), depending on the output area, are recorded at different applied voltages. Subsequently, other magnitudes such as the consumption power or the initial efficiency can be calculated.
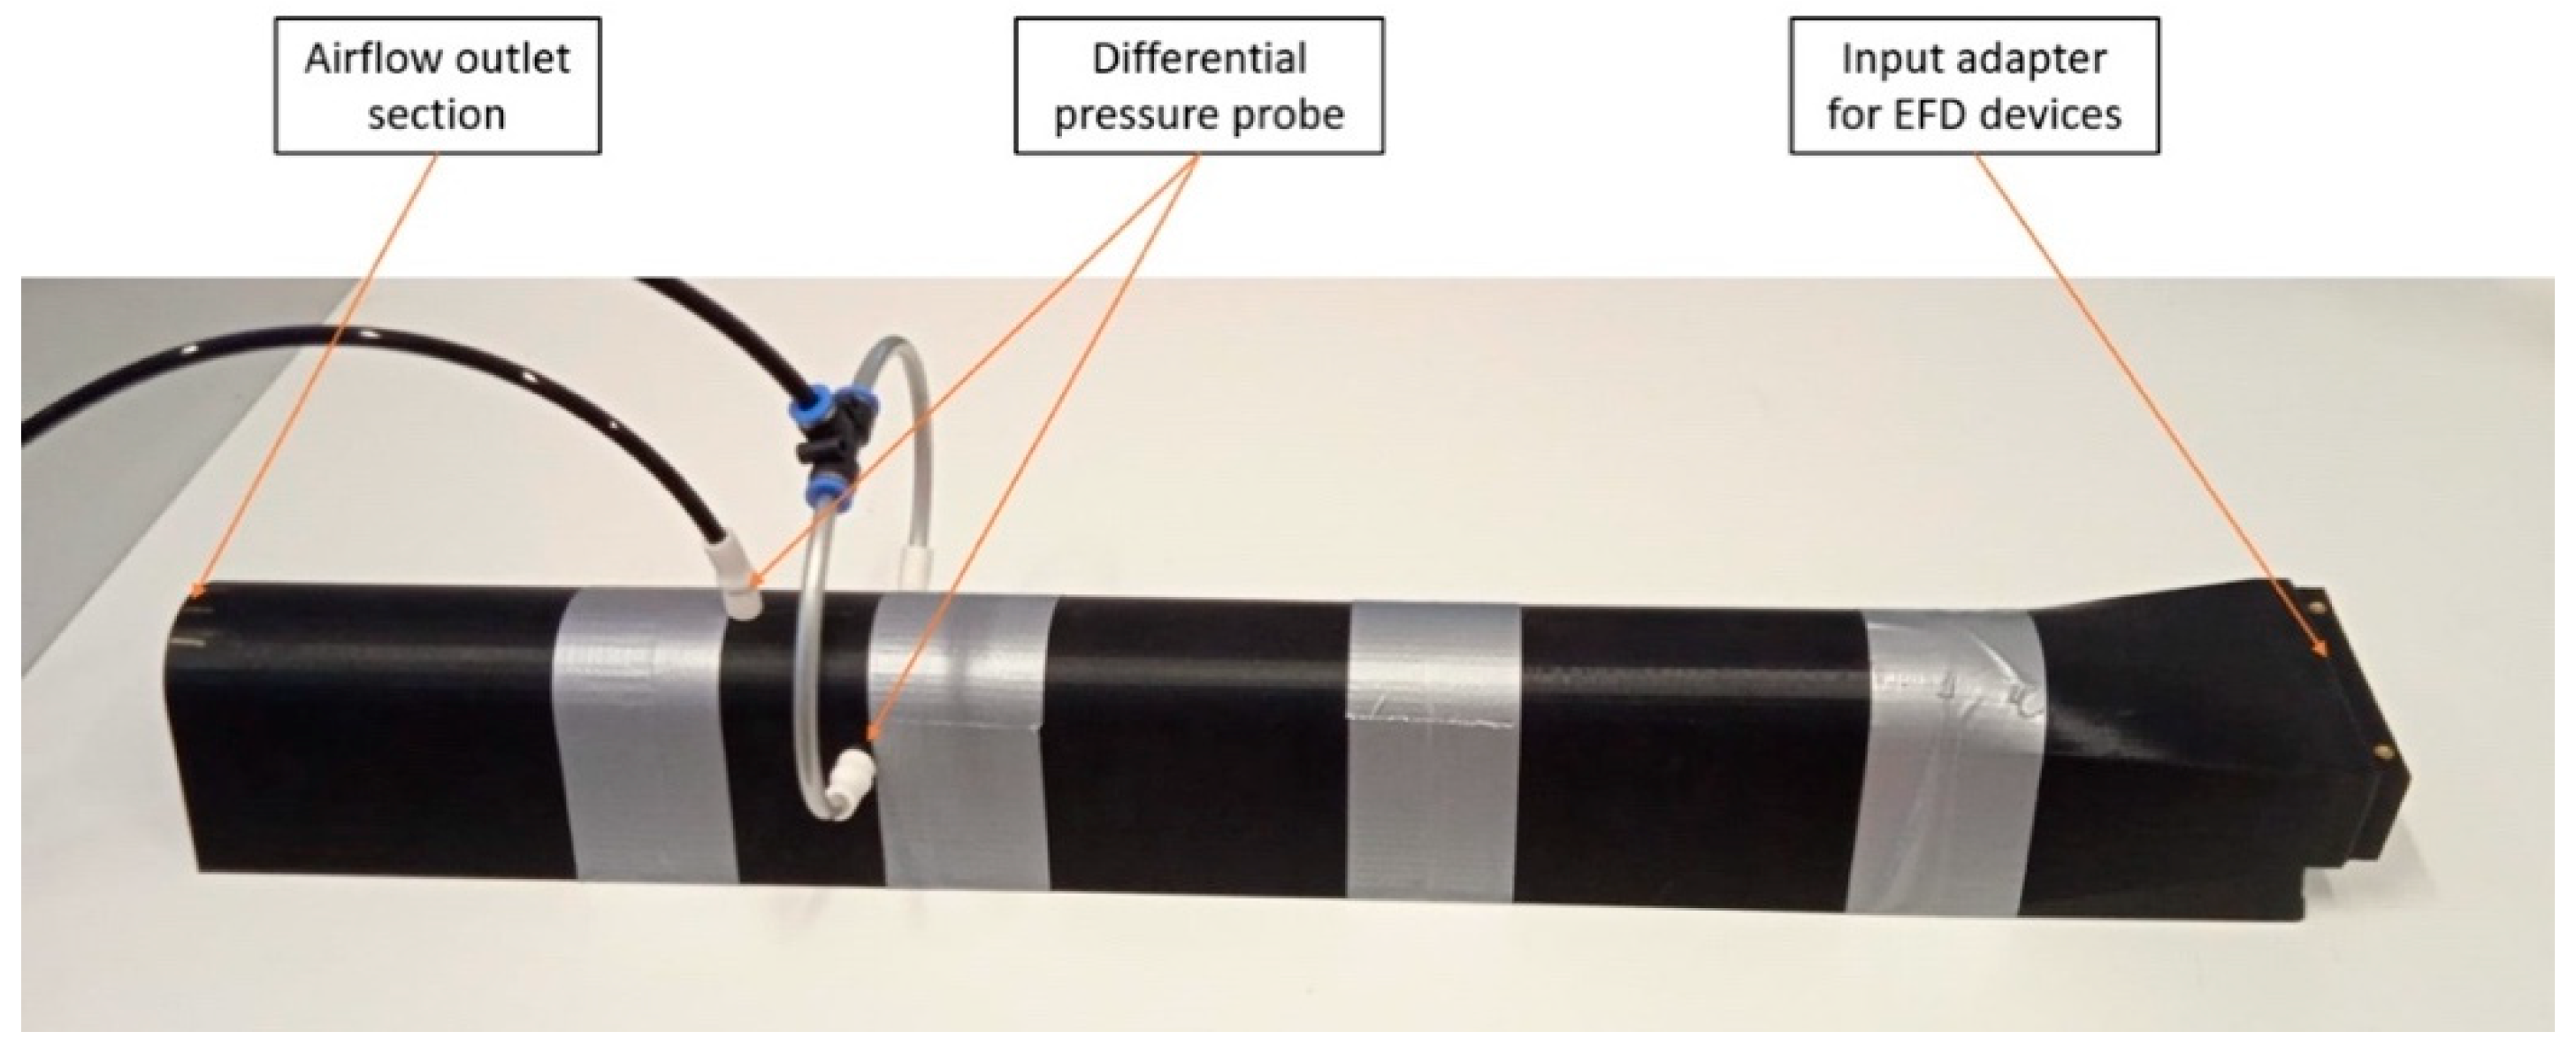
Once the most optimal configurations are chosen, dynamic airflow tests are carried out in a wind tunnel. This equipment is manufactured by 3D printing and consists of three modules (a constant section, Ø
1 = 50 mm), a diffuser with differences between the rectangular section (46 × 16 mm) and the circular section (Ø
2 = 50 mm), and an adapter that acts as support for the devices (see
Figure 3). From this assembly, the measurements of pressure, velocity, airflow rate, and efficiency at different voltages and consumption powers are recorded and evaluated.
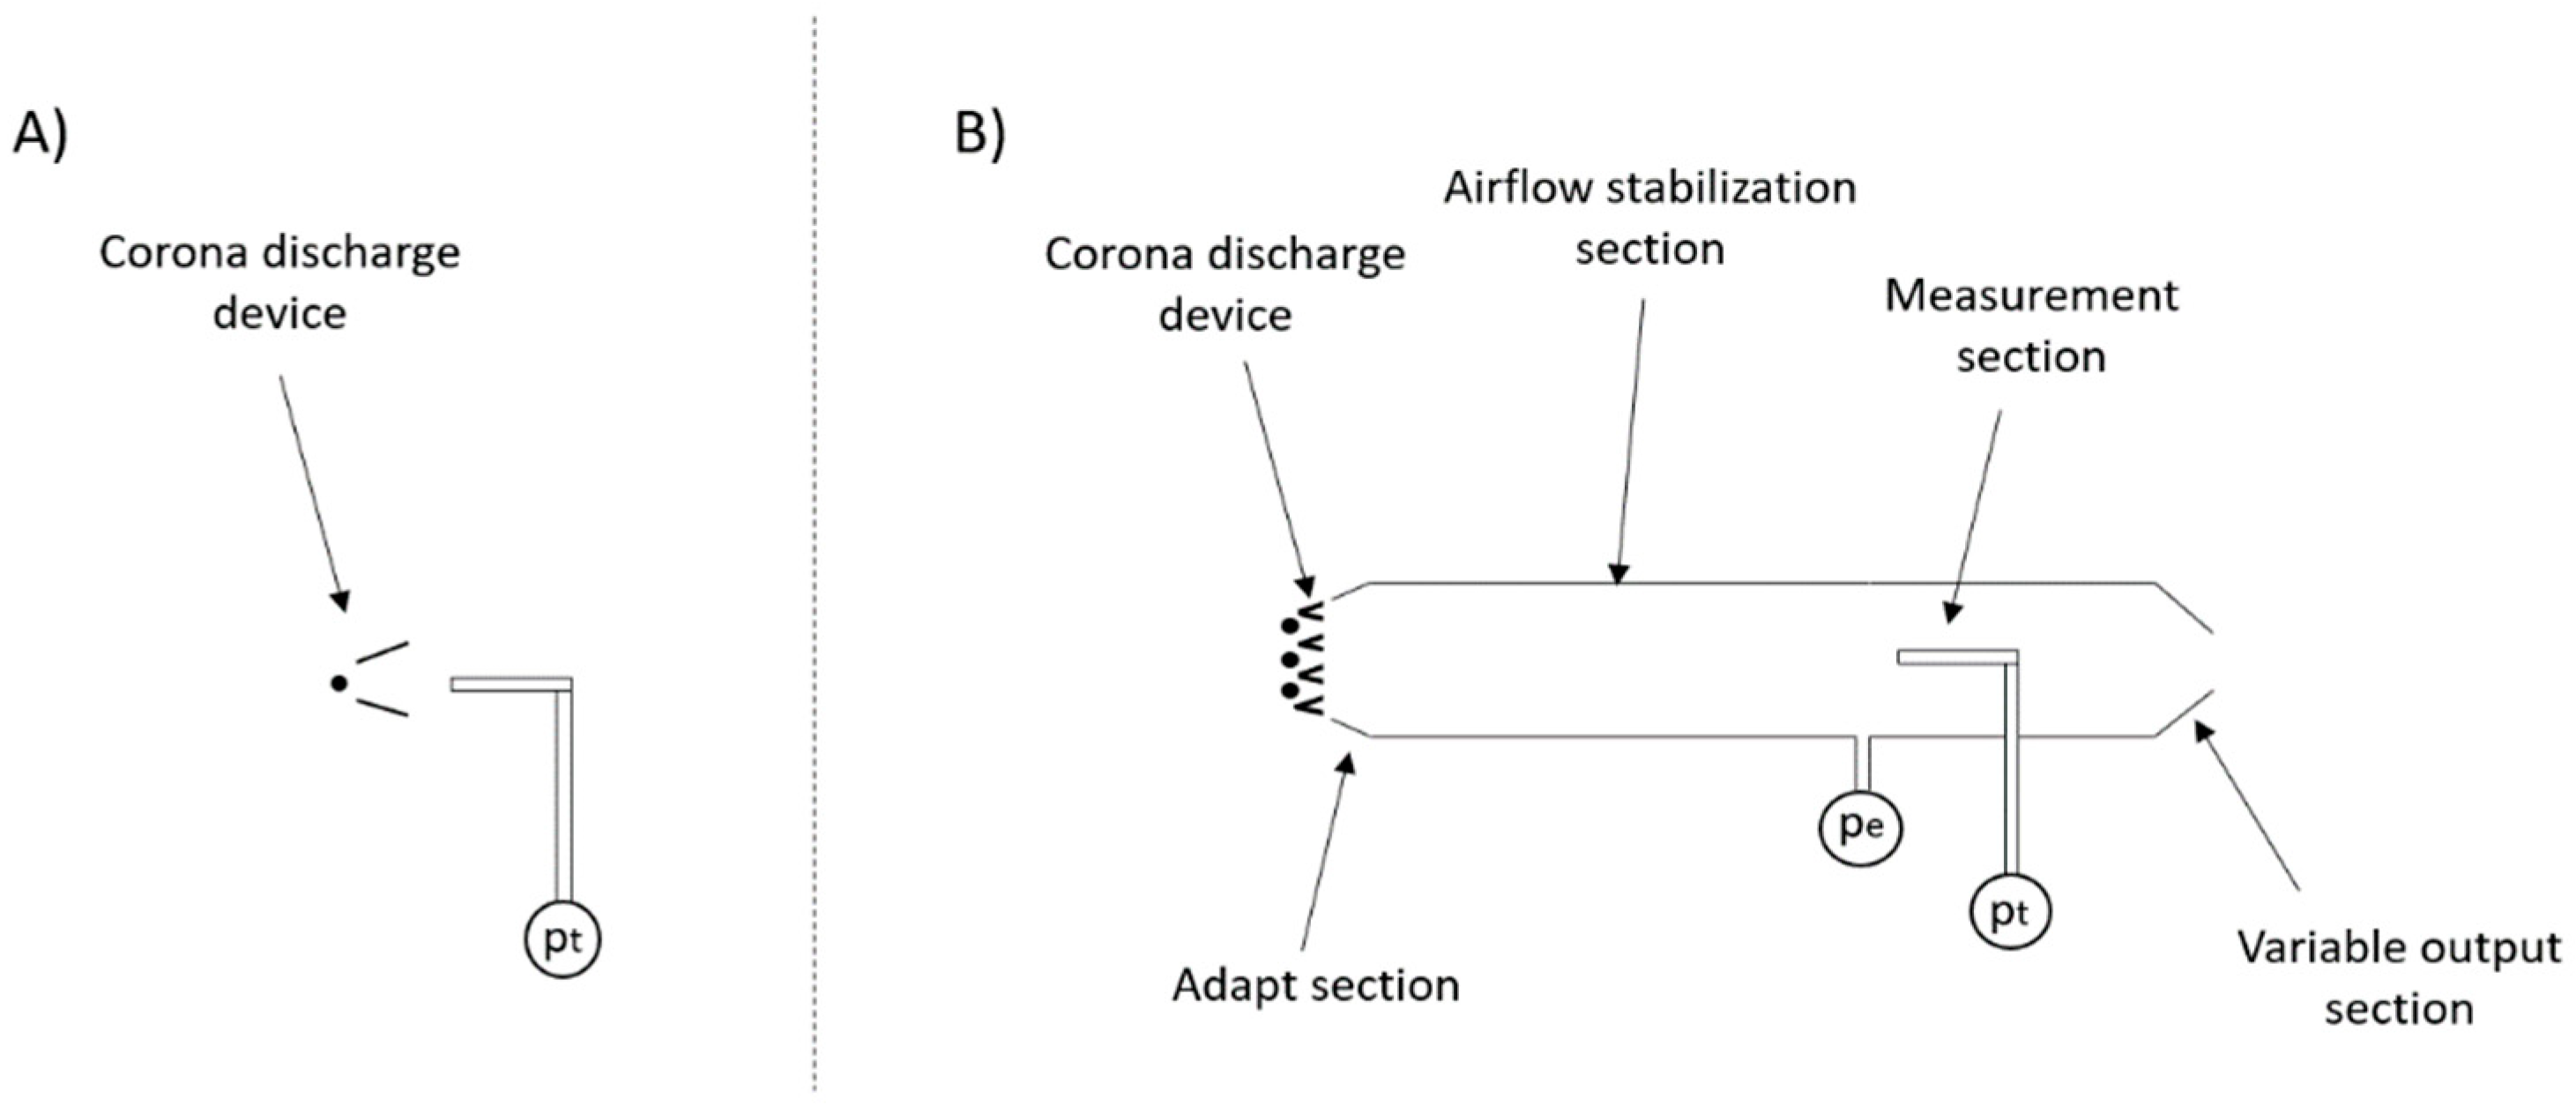
Figure 4 shows an outline of the experimental methods with integrated corona systems for the evaluation of their electrostatic and dynamic behavior.
4. Single EMBID Configuration: Results and Discussion
The EMBID system evaluates the influence exerted by the diverse design limitations on the coefficients and the exponent of the Townsend equation. All experiments are conducted in atmospheric air with an average ambient temperature of Tamb = 23–26 °C and relative humidity of RH% = 30%, and are executed for each configuration between 3 and 5 repetitions. The geometric parameters considered focus on the corona electrode diameter, dc (25, 50, and 100 μm); the inter-electrode distance, g (−1, 0, 1, 2, and 3 mm); and the separation between the fins that act as the ground electrode, D (2, 2.5, 3, and 3.5 mm). The electrode material and the angles of the ground electrode at the output are not evaluated because they do not directly affect the electrical behavior.
4.1. Electrical Characterization
4.1.1. Effect of Inter-Electrode Separation and the Distance of Ground Fins
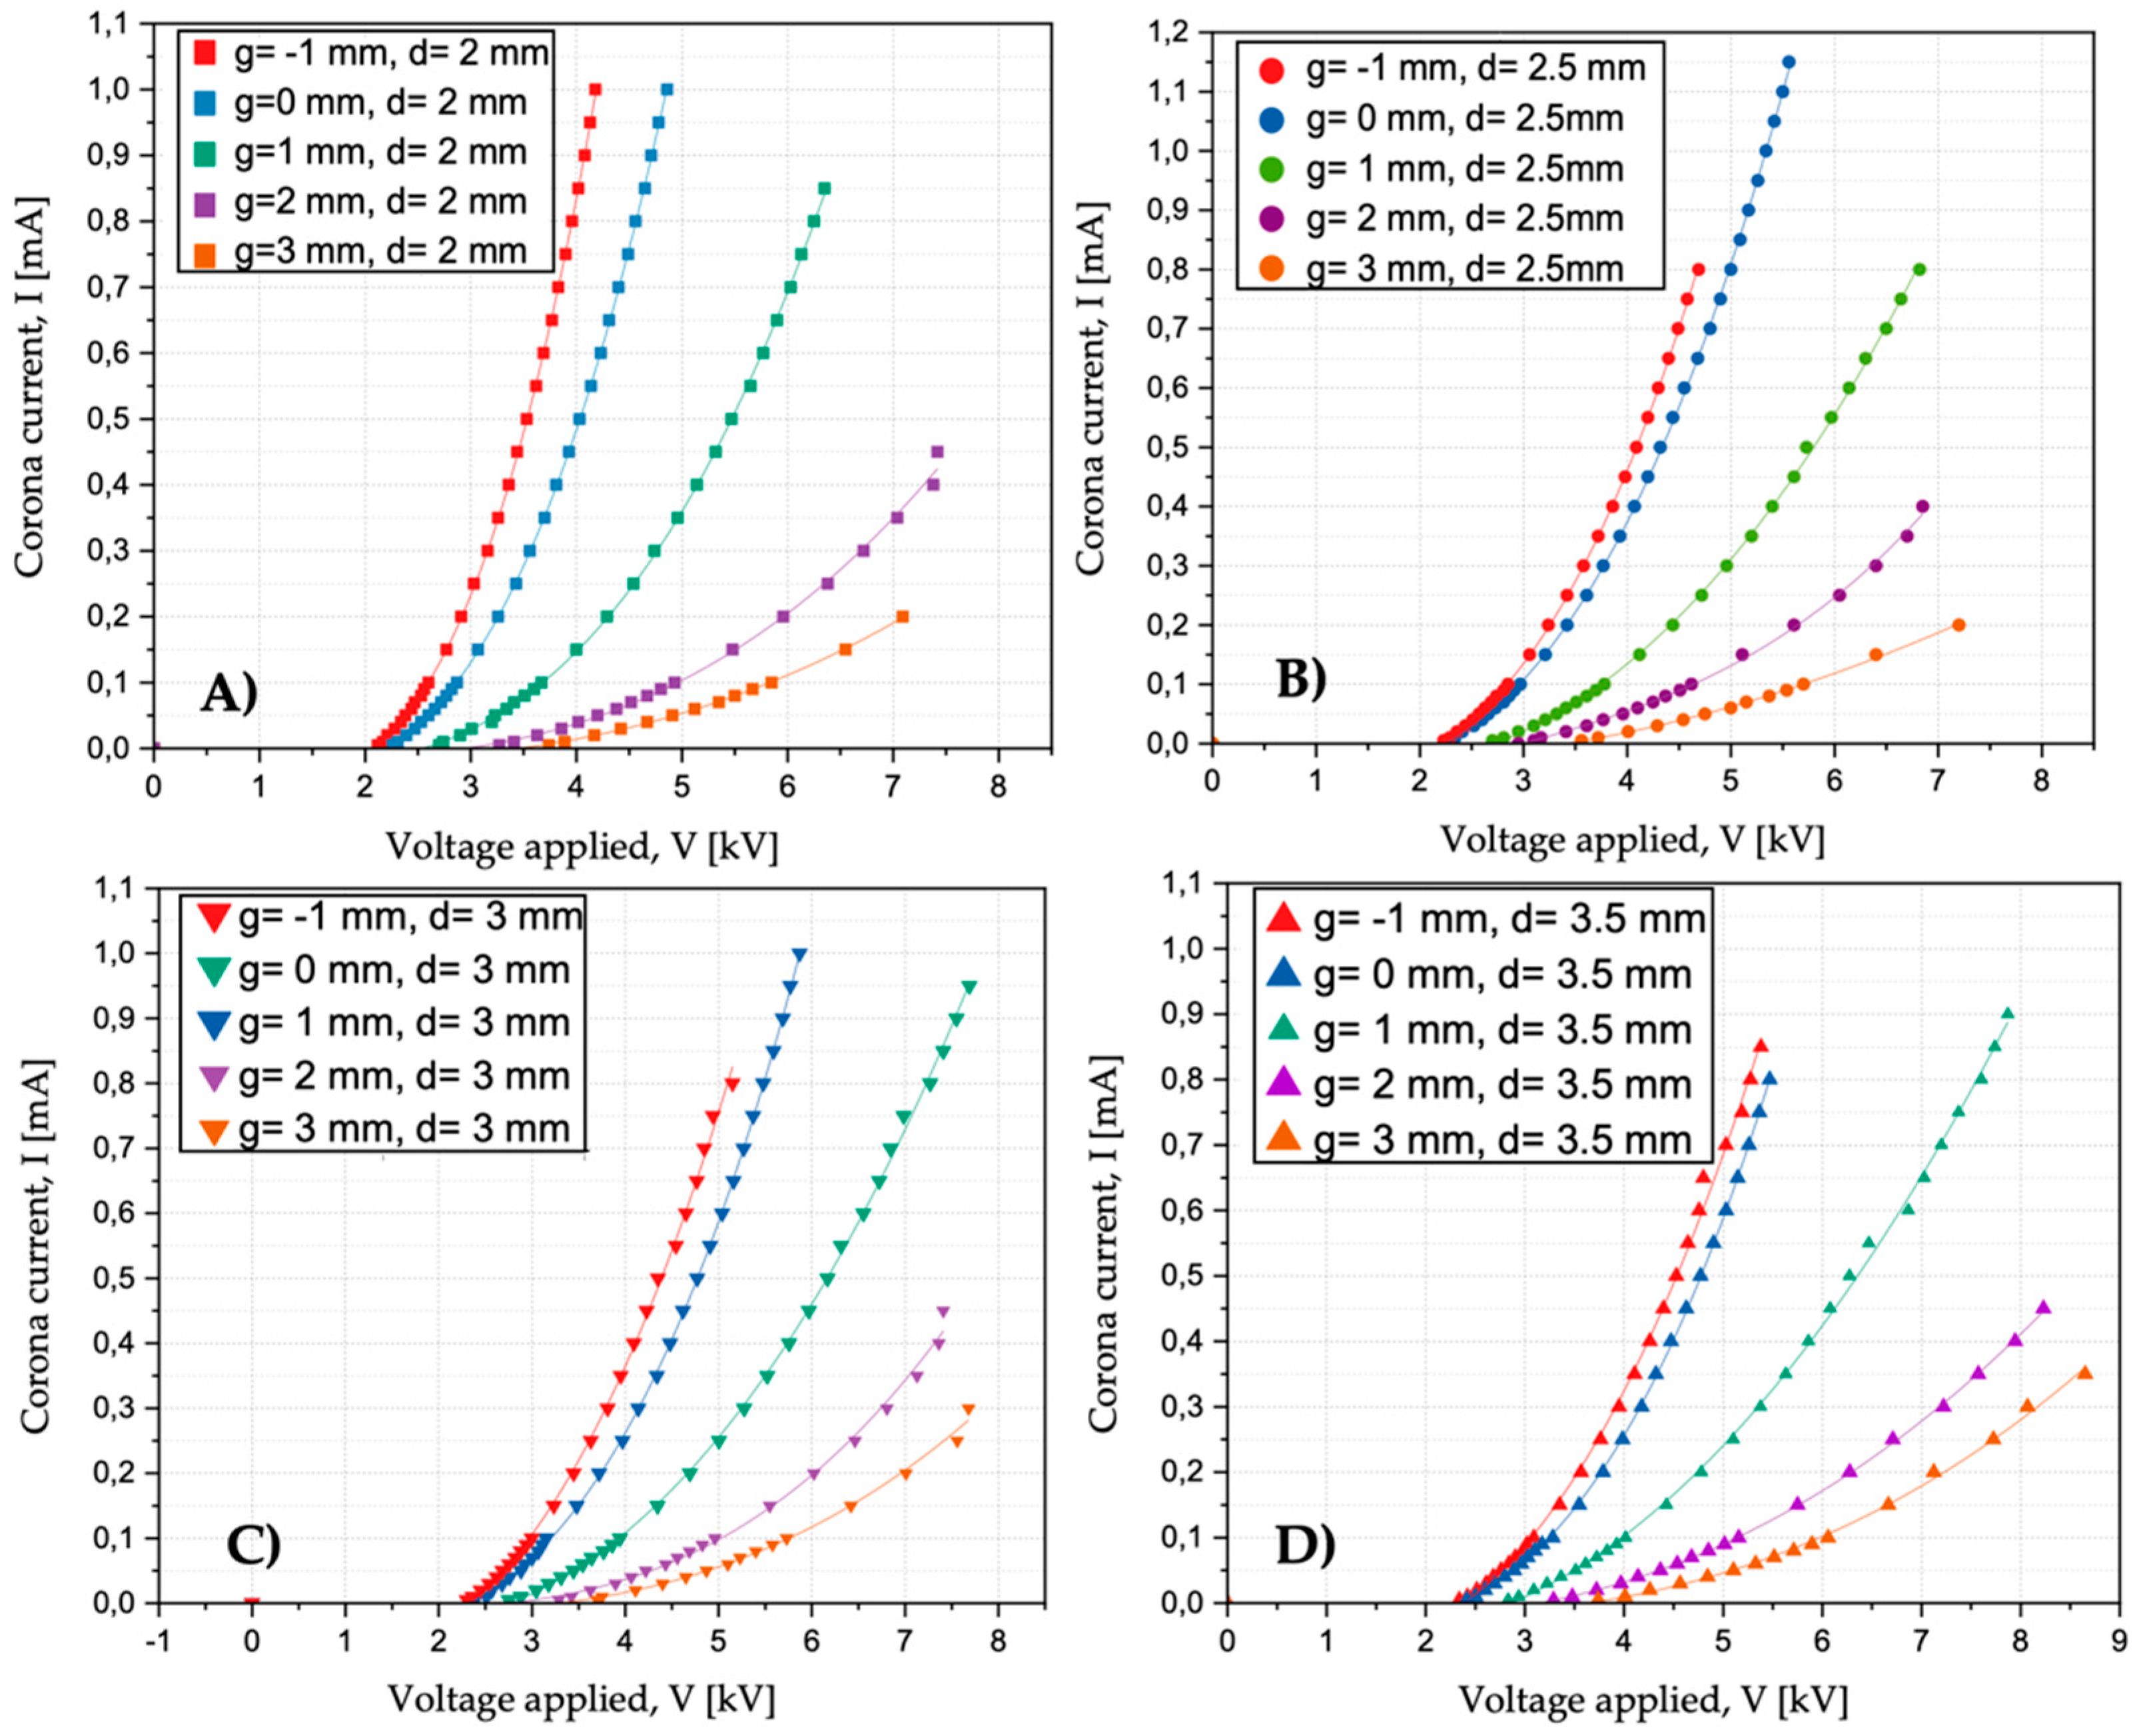
The appraisal of electrostatic behavior is characterized by CVCCs through adjustment of the gap, and the separation between the ground planes instigates the displacement of the corona current–voltage applied curves.
The effect of increasing the distance between corona and ground electrodes is visualized in
Figure 5. The CVCCs with different electrode distances and separation between the collector fins shift to the right by increasing both
g and
D. This value has consistency because a larger distance between the electrodes increases the voltage necessary for the discharge to begin to occur. From the values achieved, the outstanding design parameter is the gap of the electrodes. Regarding the distance between the ground fins, the effect is minimal.
4.1.2. Effect of Corona Filament Diameter
The effect of cable diameter on the relationship between corona intensity and applied voltage is studied. CVCs are qualitatively compared for a 25 μm thread with other filament dimensions of 50 and 100 μm.
Figure 6 highlights how variations in the diameter of the emitter electrode produces a change in the characteristic curves. Then, in the case of the 25 μm cable, the voltages are mostly between 2 and 4 kV. On the other hand, for diameters of 50 μm, the initial voltage starts from 3 to 4.5 kV; meanwhile, in some 100 μm wire devices, there are onset voltages closed between 5 and 5.5 kV.
A displacement of the curves, from 300 to 500 V, after magnifying the diameters, is appreciated. Furthermore, when the wire diameter is minor, higher currents are observed. As there is a greater difference in curvature between the fins and the filament of 25 μm, higher electric field strengths are reached, which end up translating into higher intensities. This justifies that, despite working in much higher voltage intervals, the power consumed by wire devices 100 μm is lower in numerous occasions.
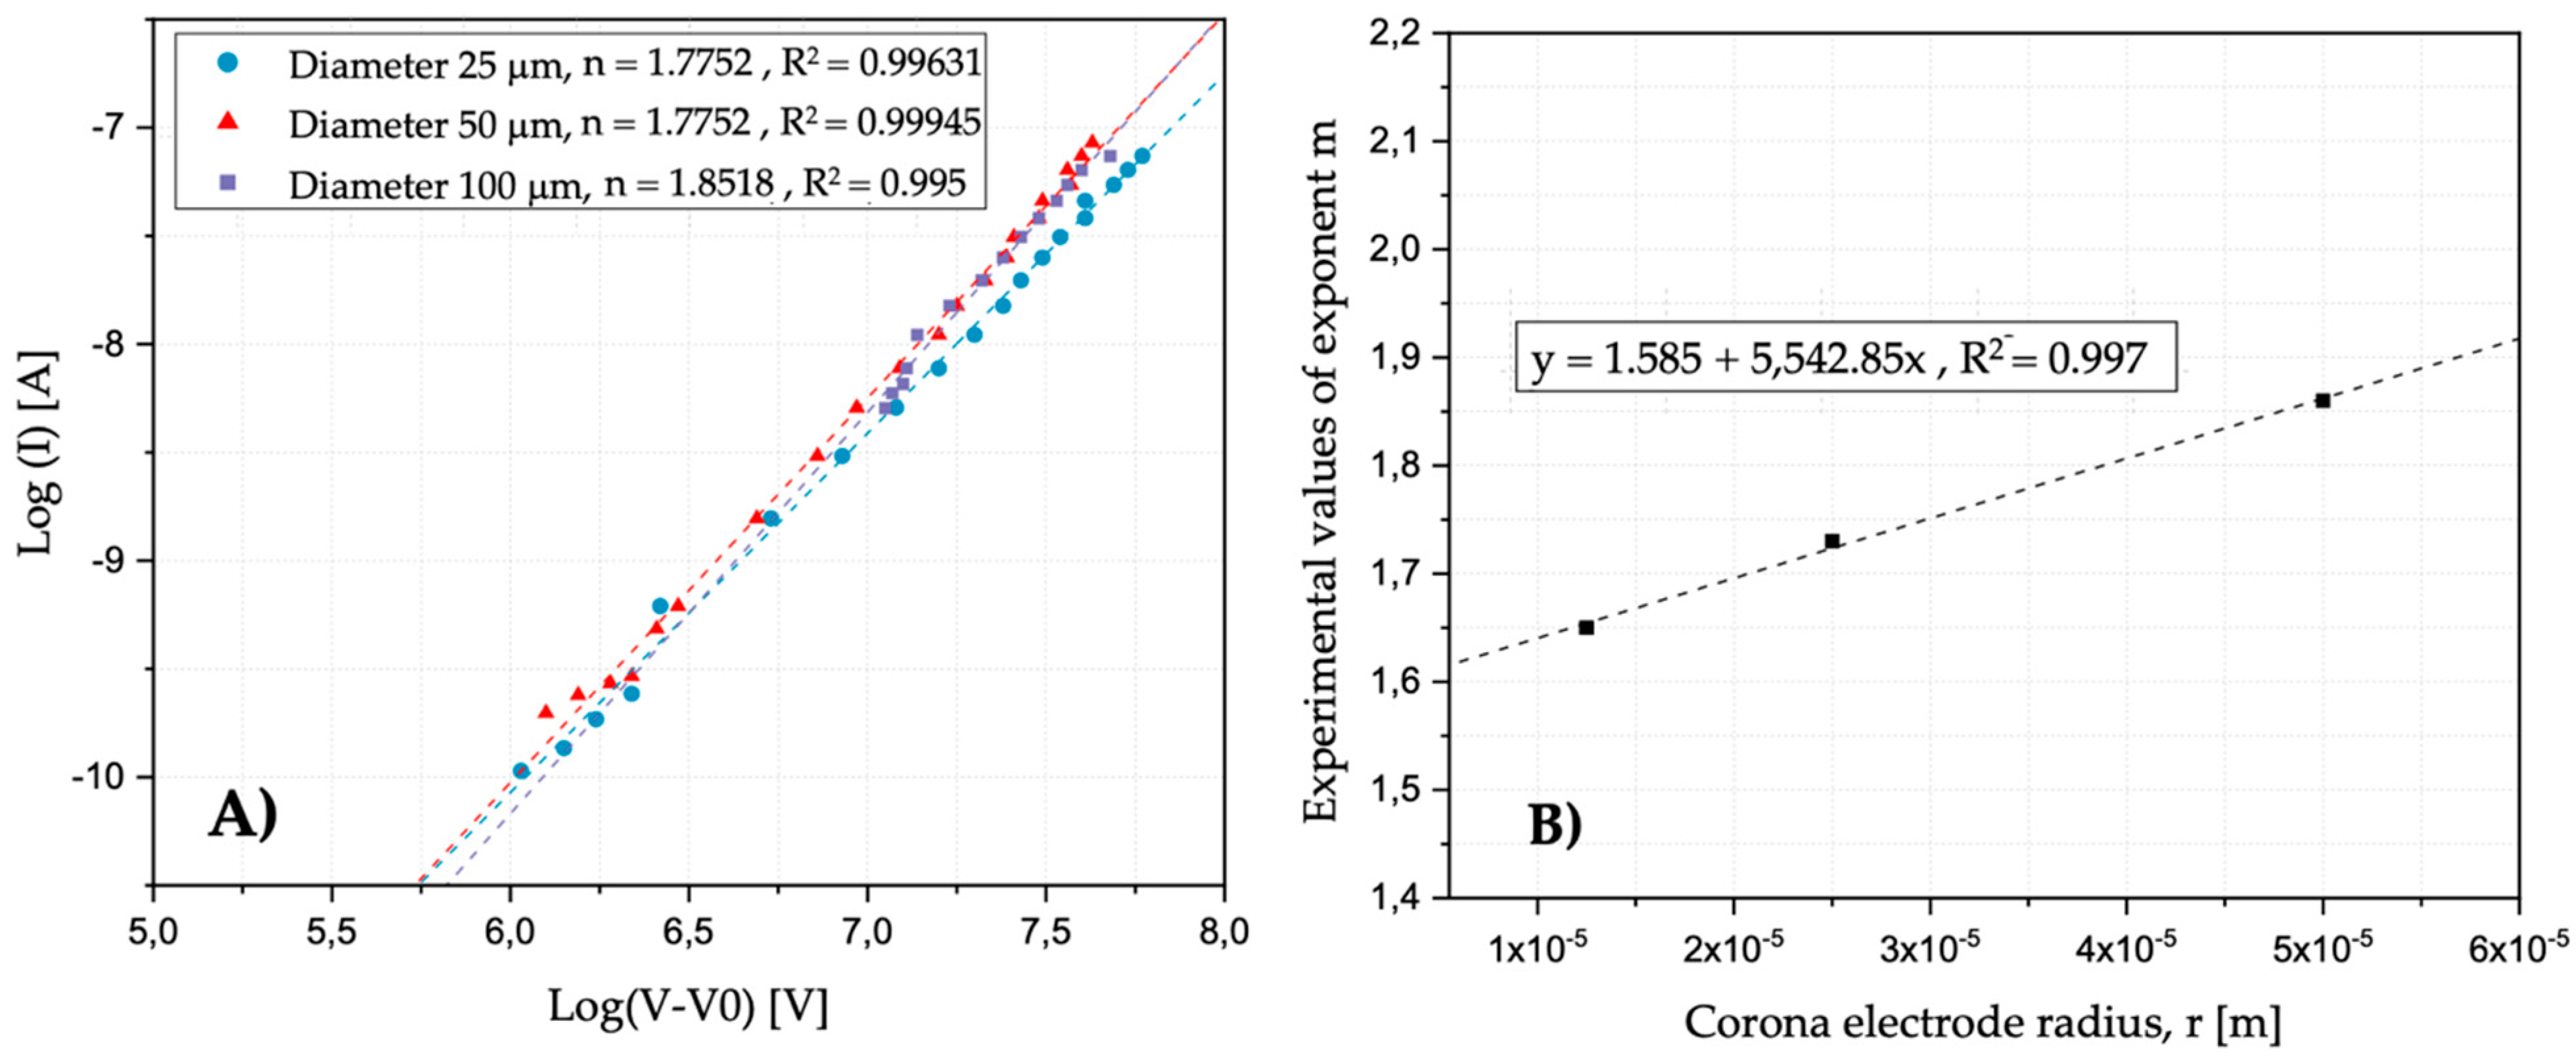
4.1.3. Empirical Formulation of Positive Corona Discharge
The characteristic parameter m is calculated through the evaluation of the initial voltage of the different configurations. The electrode distance (
) and the distance between the collector planes (
D) and the emitter filament diameter are analyzed (see
Figure 7). There is a linear relationship between the values of
and
and the different diameters of the corona electrode used
. The results for these settings are shown in
Figure 8A.
The exponent m is directly related to the slope of the linear representation with the different diameters of the high-voltage electrode. The values obtained from the exponent m are faced with the different dimensions of the corona electrode radius. Consecutively, a linear relationship is observed, as shown in
Figure 8B. Finally, the CVCCs for the individual EMBID arrangement are expressed mathematically as:
This value of the exponent m proves the results of previous research where this parameter is assessed. For arrangements of electrodes formed by wire and planes, the exponent m has values ranging from 1.5 to 2.2.
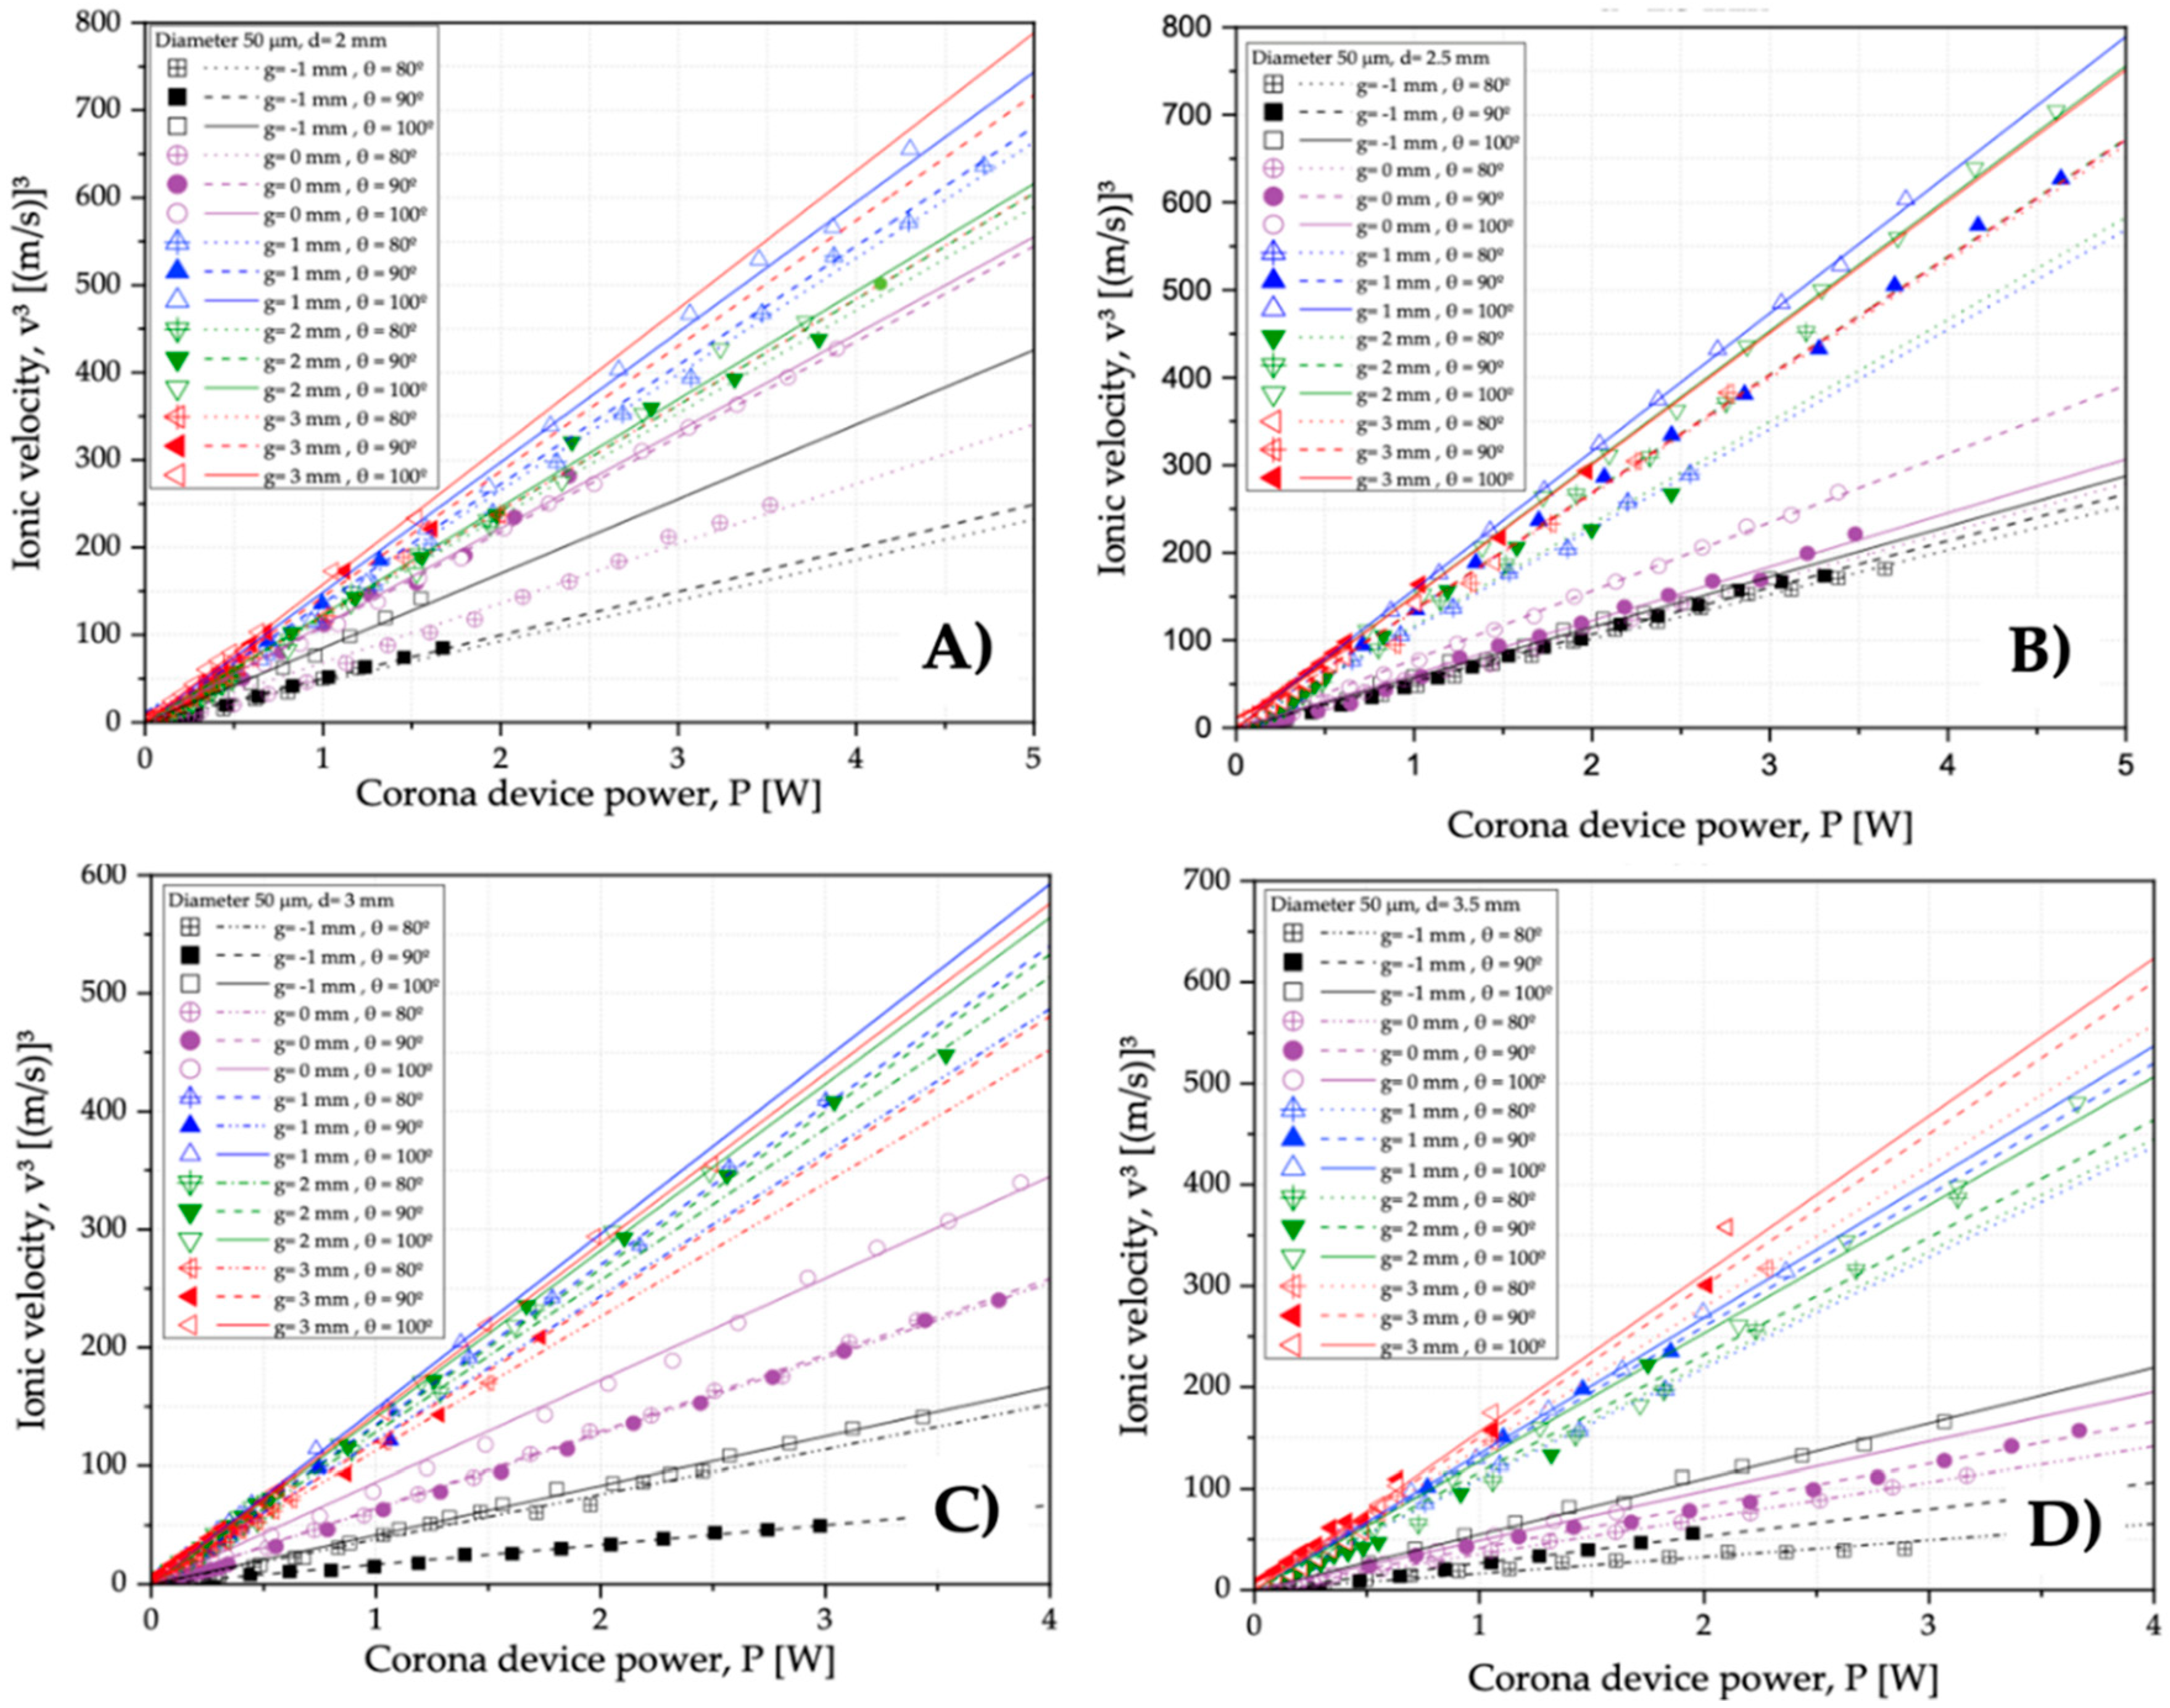
4.1.4. Velocity Tests of Ionic Wind
From the dynamic tests of the fluid, the ionic wind velocities are obtained at the outlet of the devices. Similarly, the influence of the design parameters studied on the airflow generated is considered. Different pressure measurements are made at diverse electrical powers for each configuration varying the gap (); the distance between the ground electrode fins ; the diameter of corona electrodes ; and the angle of inclination 80°, 90°, and 100°. The total pressure at the outlet of the corona system is considered as dynamic pressure, and the static pressure is regarded as negligible.
Once the investigational data are acquired, an experimental adjustment is made with the aim of comparing the different design parameters and determining the influence of current on the velocity values. Then, the study of the flow velocity as a function of the applied electrical power is proposed (P = I·V). Thus, the velocity raised to the cube is related to the consumed power of the device (P). This linear ratio is evaluated for the three diameters investigated with all their possible electrode arrangements.
Figure 9 shows that, where the corona wire used is 50 μm, the effect exerted by the gap is greater than that applied by the distance between the ground fins in the electrical characterization. This linear relationship allows a more exhaustive analysis of the influence of the separation between electrodes (
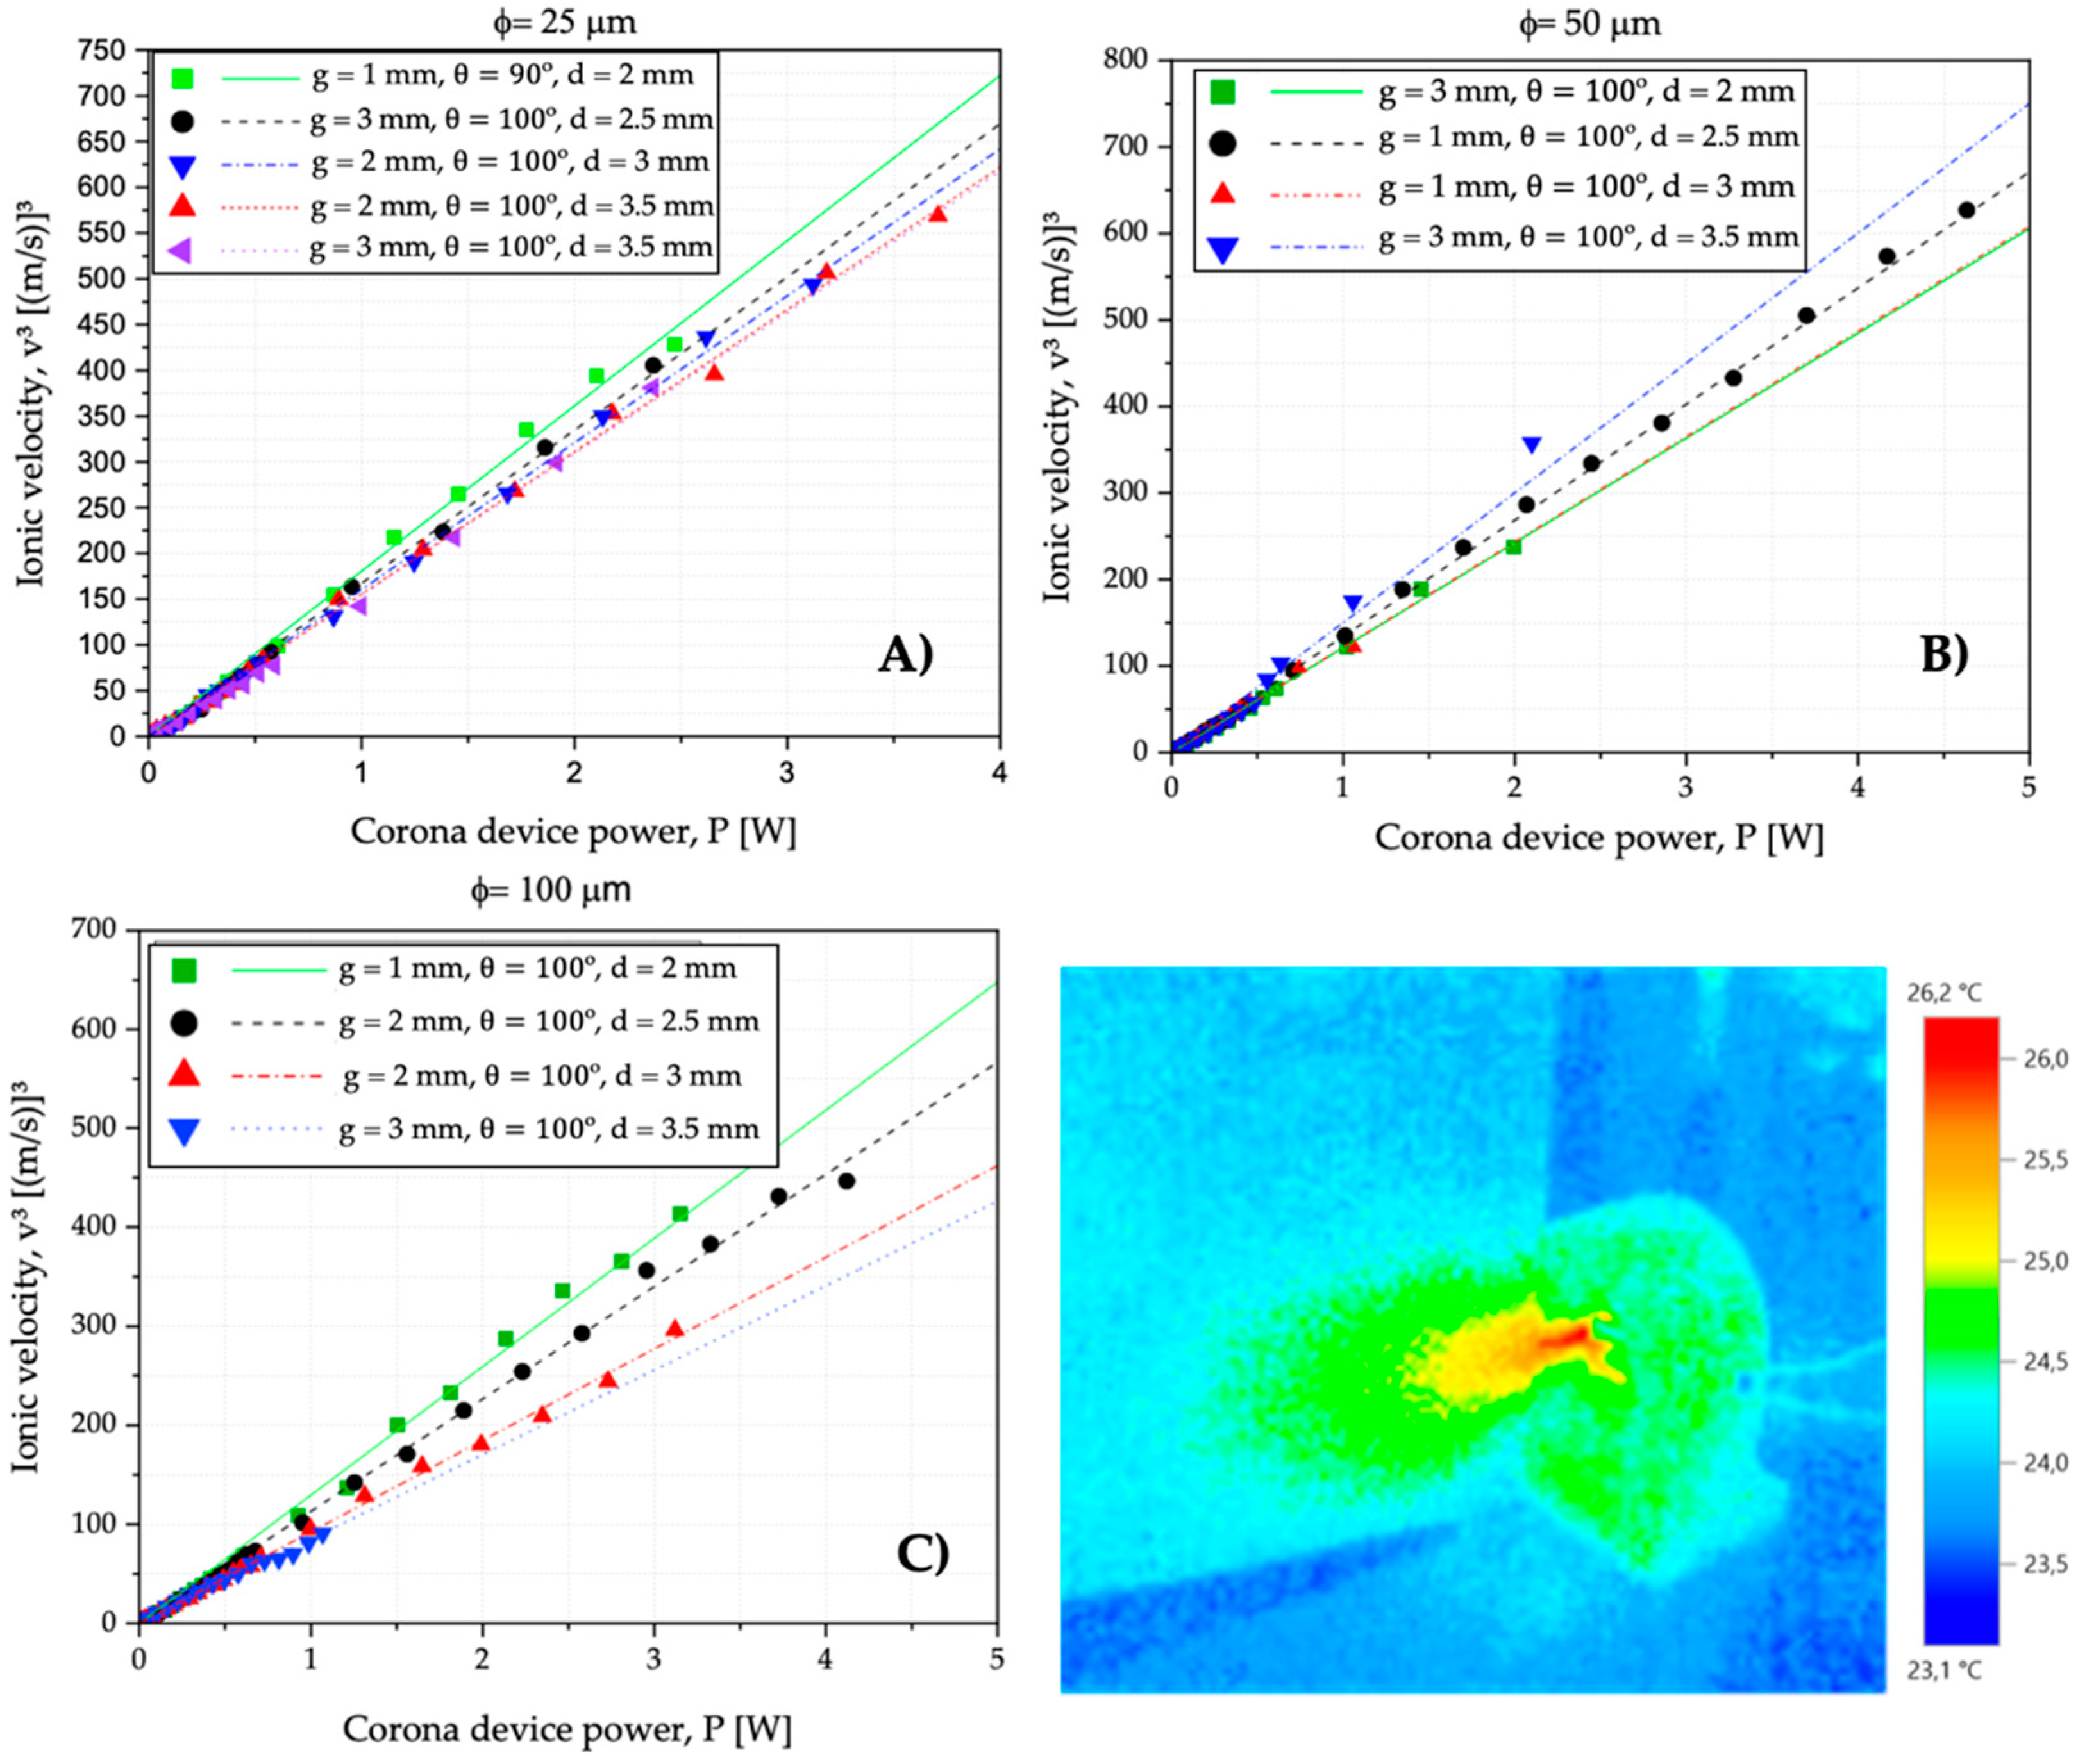
g). The values of greater gap (1, 2 and 3 mm) maximize the obtained airflow velocities. Another representative parameter is the angle of inclination of the ground electrode (α). In most cases, the 100° angle, followed by the 90° angle, shows the best results. This improvement can be explained as an improvement in viscous pressure drag in a more aerodynamic geometry. Finally, the diameter of the emitter electrode is a remarkable parameter. After performing an analysis according to the corona electrode diameter, configurations are removed to finally select the most efficient electrode arrays based on the corona wire. As shown in
Figure 10, the filament diameter of 100 μm has a lower flow rate compared to 25 and 50 μm filaments. Although larger diameters are reached, lower intensities are also lower. However, the change between diameters 25 and 50 μm is barely noticeable.
With this evaluation, the arrangement with a wire of 25 μm is corroborated to present a better performance. However, the corona electrode of 50 μm is quite close to the values accomplished for the previous configuration, i.e., its greatest competition. As expected, the worst result is derived from the 100 μm wire.
In addition, other aspects are considered to select the final configuration of the EFD system. Wire handling during assembly, electrode stability during discharge, and corona electrode reliability are evaluated. Considering all the factors, the configuration chosen for configuration scaling has a diameter of 50 μm and D = 3.5 mm. Regarding the exit angle, the manufacturing process by both a machining process and metal injection limits the production of the ground electrode with an inclination of 100°. Comparing this configuration with an angle of 90°, the difference is small with the arrangement of a greater angle. Therefore, after analyzing all the notable factors for scaling the EFD system prototype, the selected EMBID setting consists of: 50 μm, g = 3 mm, D = 3.5 mm, and .
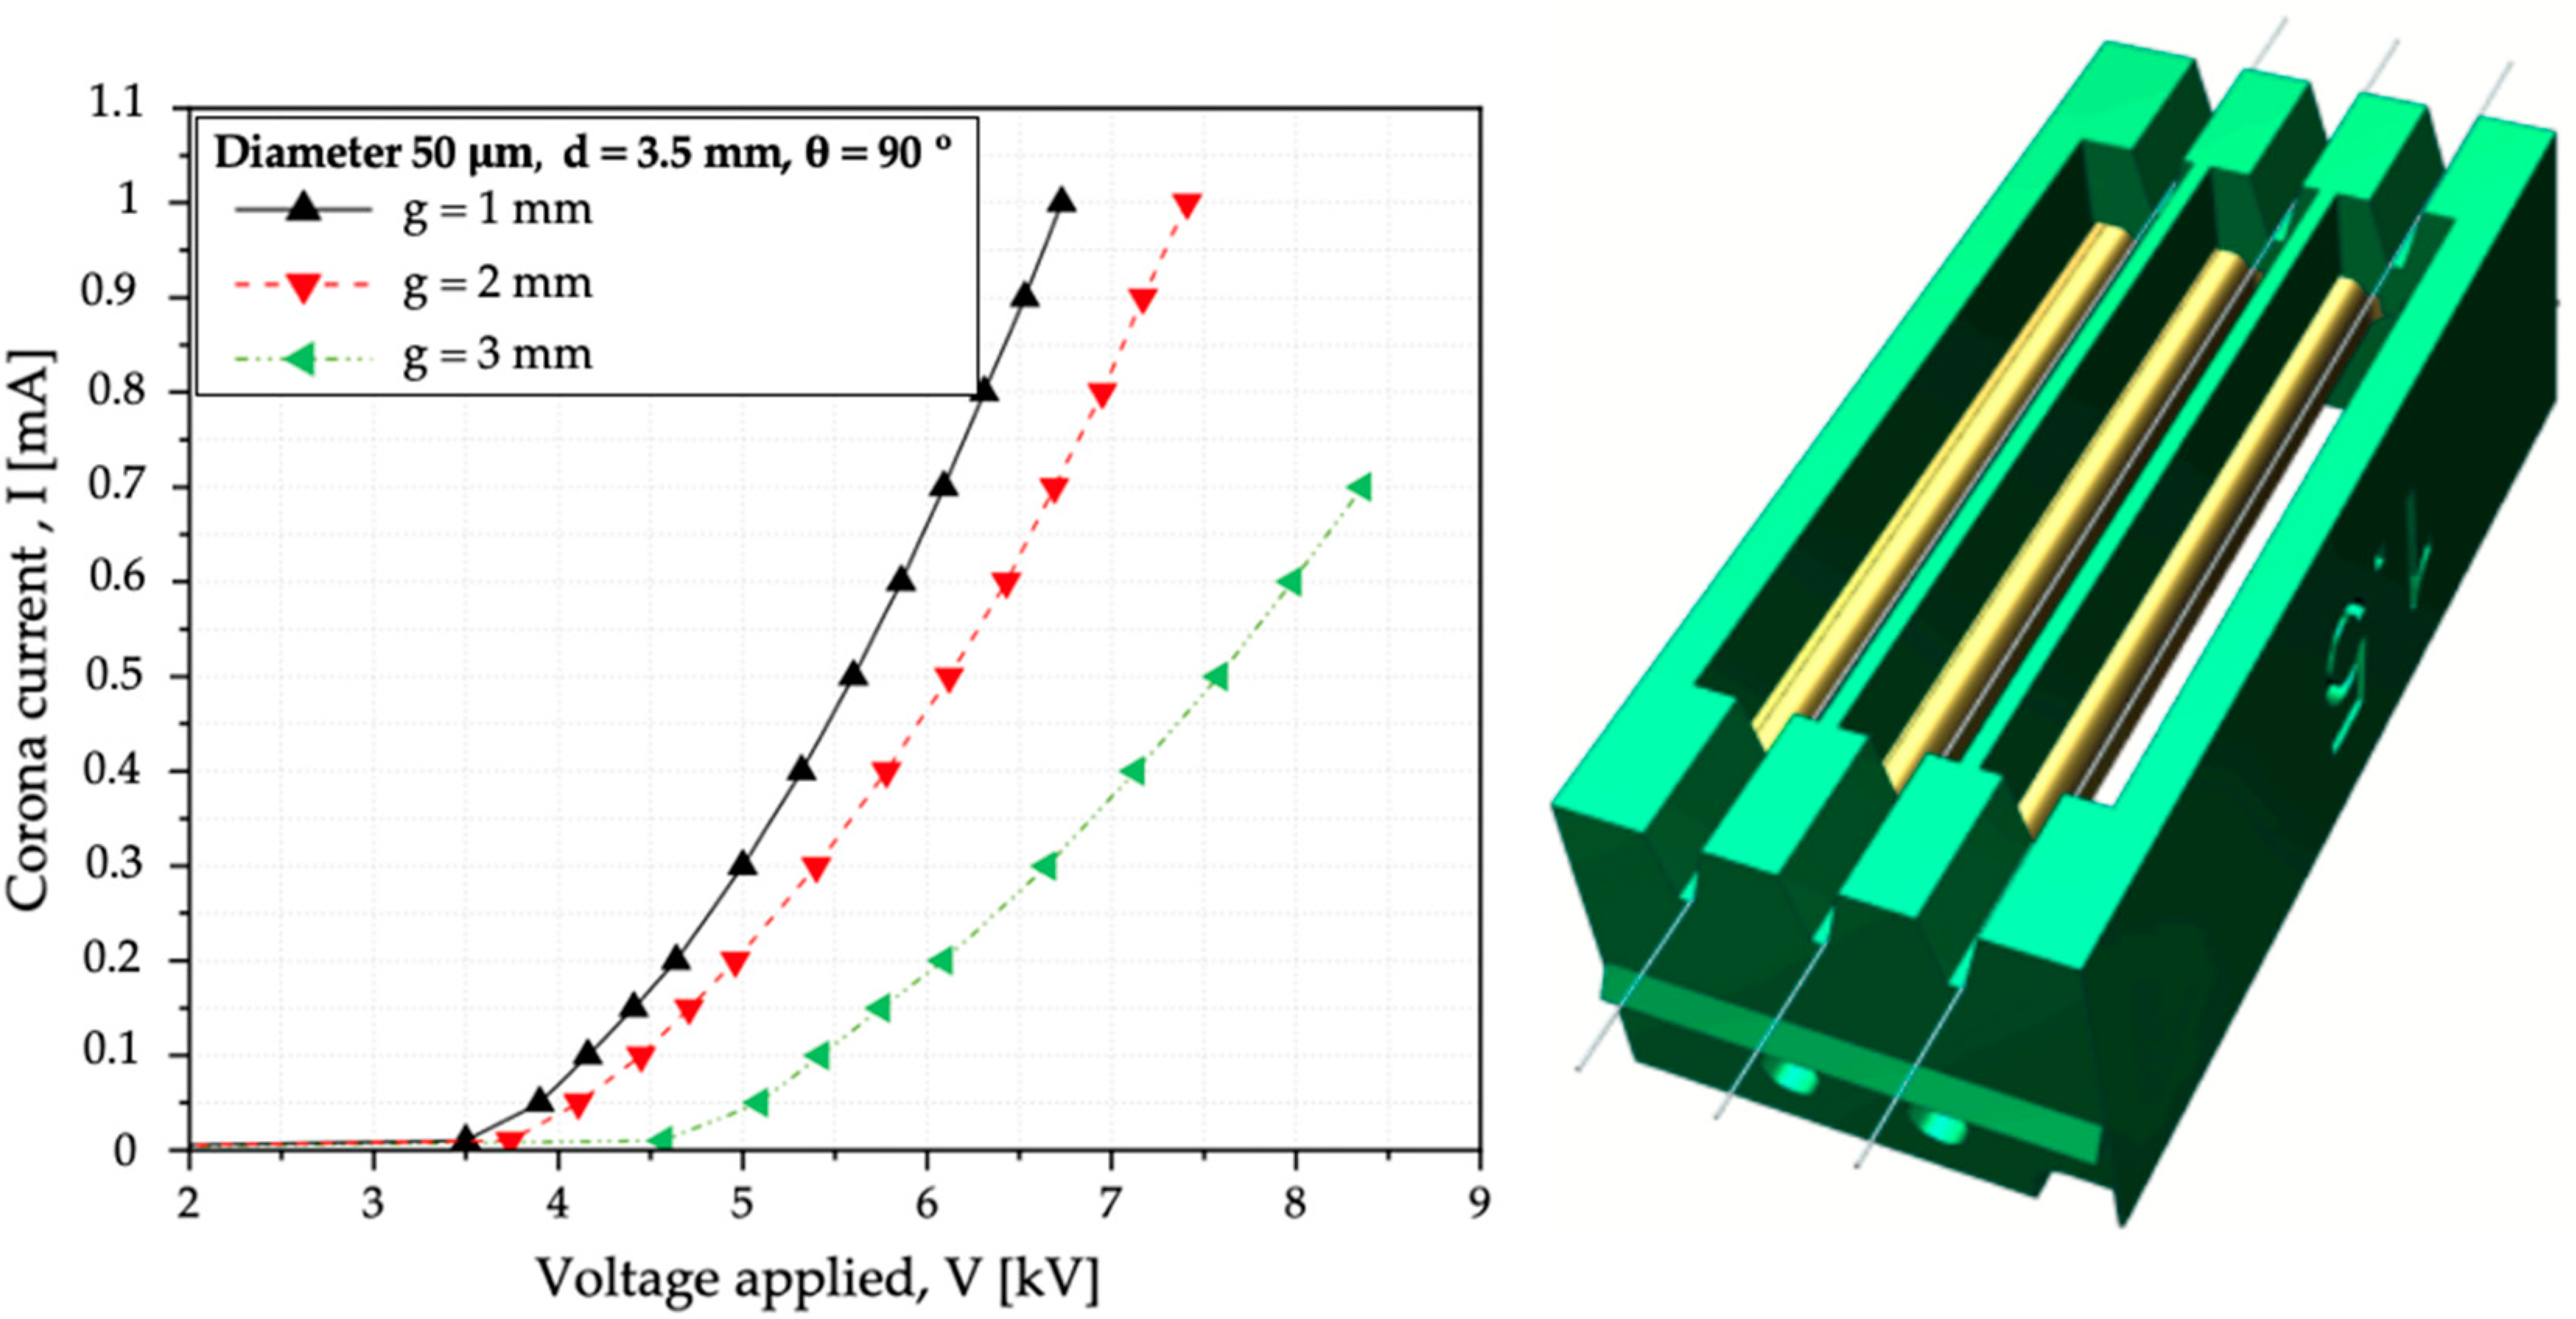
5. Scaling of EMBID Configuration: Results and Discussion
From the results of the measurements of total airflow velocity at the exit of the discharge, a new sweep is carried out with parameters closer to the optimal ones obtained; thus, the true aerodynamic actions of each geometry can be evaluated with greater precision. The corona wire configuration of dc = 50 μm, with a collector fins distance of D = 3.5 mm and an angle of θ = 90°, is evaluated with different gaps (1, 2 and 3 mm). The scale arrangement of the EMBID consists of three filaments in series with an exposed length of 40 mm. All configurations are incorporated into a wind tunnel with a section diameter of 50 cm, from which the dynamic behavior of the discharge is more precisely defined.
The CVCCs of the proposed scaled configurations are shown in
Figure 11. An increase in the gap causes the curves to the right to be more noticeably defined with more exposure to corona discharge. The operating range for these arrangements of the EFD system extends from 3 to 8 kV, with intensities above 1 mA. From the point of view of aerodynamic performances, the flow rate is analyzed with respect to the velocity in the wind tunnel test area; therefore, the area of that section of the tunnel is considered. Meanwhile, the efficiency is specified through a relationship with the hydraulic power generated and the consumption power. By its orders of magnitude, airflow is expressed in liters per minute (lpm) while efficiency is expressed in percentage (%).
where the
is the total pressure,
is the static pressure,
is the density of the air (1.225 kg/m
3), and
is the velocity of the generated airflow.
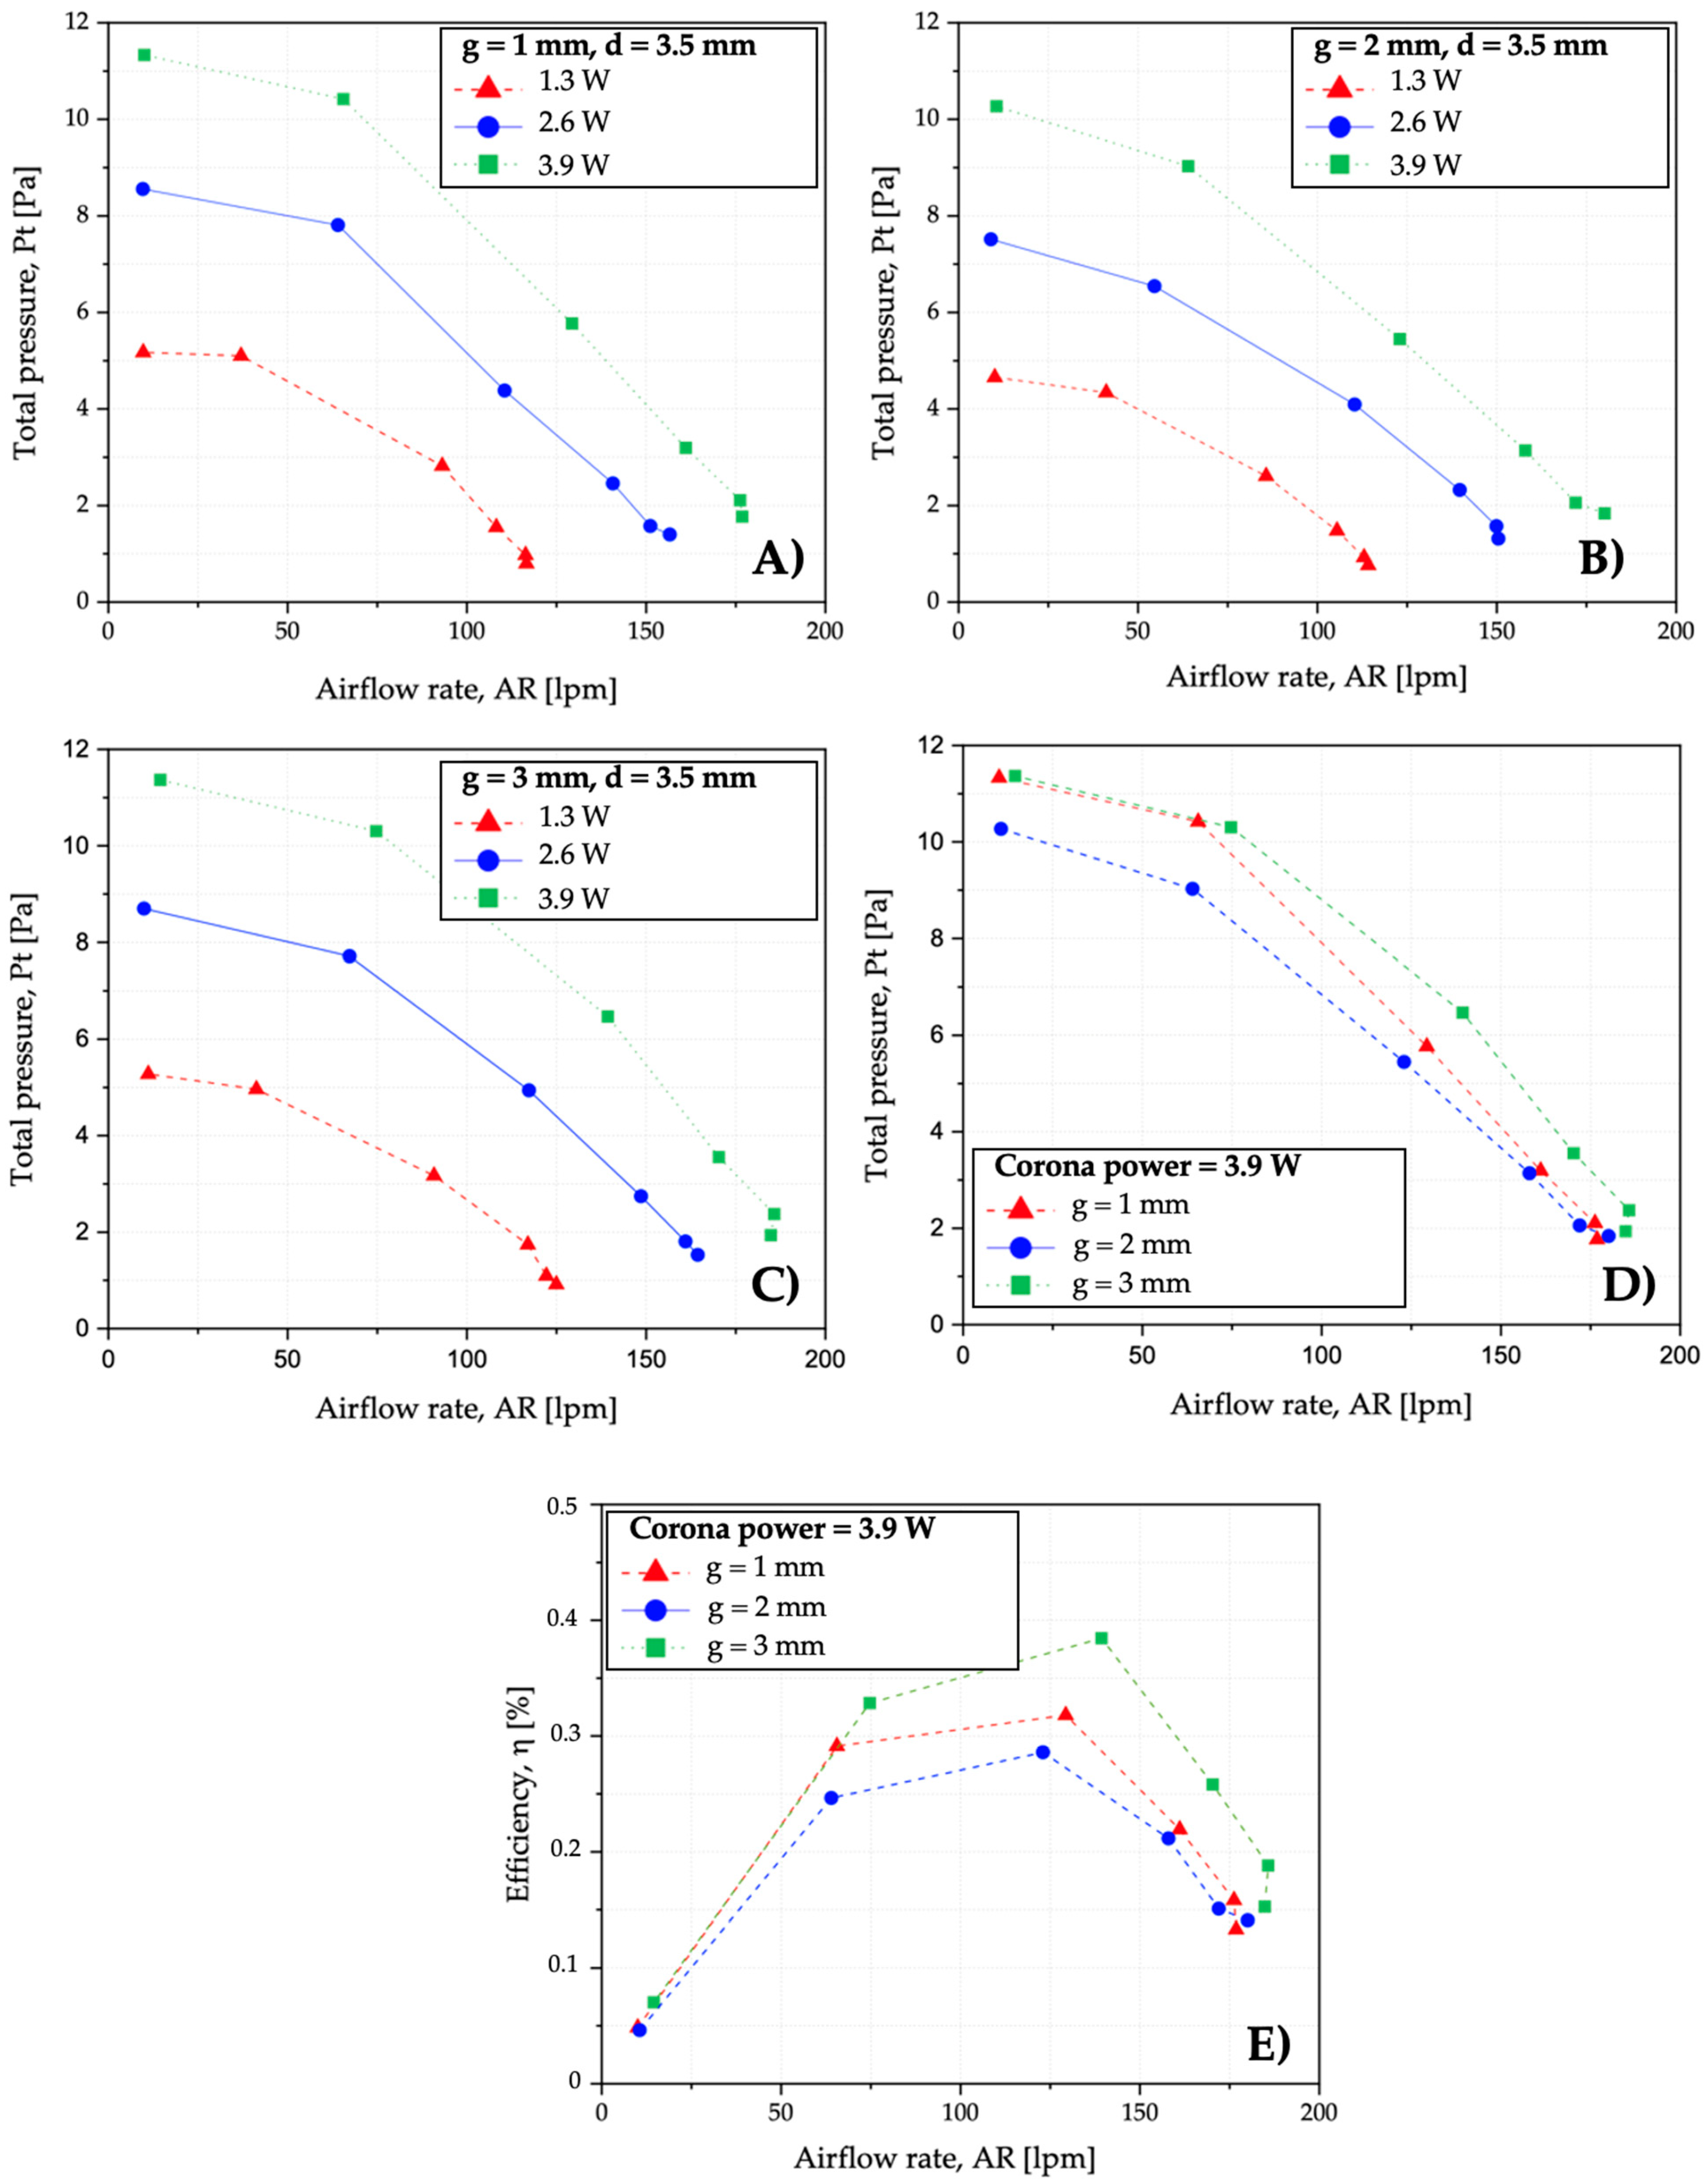
In parallel, the airflow’s total pressure and efficiency curves for the three EMBID geometries are analyzed in three operating power values (1.3 W, 2.6 W, and 3.9 W). The data are obtained from the velocity tests with a constant operating electrical power with variable output areas for each device. As can be seen in
Figure 12, an increase in electrical power raises the total pressure generated by the device, that is, by a higher initial static pressure value. Lastly, the pressure drop is less pronounced in the middle. As for the pressure drop described, this phenomenon is due to the regime transition of the flow itself. The evolution of efficiency with respect to airflow offers a maximum. This maximum point is a relationship between the mechanical and electrical powers consumed. For the presented designs, the best efficiency is determined for the arrangement with space g = 3 mm (
0.38%). Consecutively, the paramount airflow rate with AR = 140
lmp value is the one with this same electrode arrangement.
Finally, from the experimental electrical and aerodynamic tests, the device developed using the corona effect with wire-to-two fin configuration is evaluated and optimized for industrial application, mainly as a purifier of environments and surfaces. Therefore, for a complete study of this system, an assessment of the concentrations of species produced is necessary to determine their potential as an inactivator of microorganisms. Finally, the dimensions of the EMBID prototype have a width of w = 25 mm, a length of l = 76 mm, and a height h = 19 mm, with a final volume of VE = 36,100 mm3 and a weight of 34 g.
6. Conclusions and Future Research Lines
In this research, an innovative EFD system, with a structure based on a wire-to-two fin configuration, is designed, modelled, prototyped, experimentally characterized, and optimized. Systematic variations of design parameters are introduced and evaluated through the performance CVCCs and aerodynamic performances. A characterization of electrical operation is carried out to define the range in service of all the proposed arrangements, defining the so-called CVCCs. In parallel and to assess the ionic air generated, the dynamic actions of the corona wind are examined. Optimal configurations result in a greater electrode distance, and are studied with a scaled prototype of the configuration. Finally, the electrode arrangement is determined by analyzing the power, output airflow rate, and efficiency of the system. The optimized and validated systems show stable CVCCs, operating at values with a driving voltage of 6 to 8 kV, producing airflow velocities between 6 and 9 m/s, and providing outstanding additions to the state-of-the-art, with potential for cleaning, sterilization, and refrigeration, among others, thanks to a configuration that guides airflow in a more controlled way, with air velocities similar to the highest obtained in the bibliography. Furthermore, flow–pressure curves shown in this study are the most accurate obtained for EFD systems, according to authors’ knowledge, following measurement method. Those curves provide a reliable measure of transformation efficiency of electrical energy into mechanical energy of the corona discharge.
Future studies should deal with chemical characterization to evaluate the concentrations of ozone and nitrogen compounds generated during corona discharge. These species should be studied with the most efficient configurations at different service powers and, consequently, should determine the operating parameters for their use in industry. In addition, although airflow rates obtained in this study are acceptable for environment ventilation or refrigeration, ozone production may raise a problem for the implementation of this technology in human presence. Ozone concentration can be reduced using a catalyst, such as activated carbon or alumina, but those catalysts may deteriorate airflow performances. This problem can be engaged by catalyst geometry optimization, or by implementing several stages in series, incrementing static pressure, and defeating pressure drop produced by the catalyst. The potential application of this technology can be further analyzed via the elimination of different microorganisms, for which the interactions with viruses and bacteria and their eventual inactivation should be evaluated.


