Article

Numerical Simulation of Combustion and Emission Characteristics during Gas Turbine Startup Procedure

1
Steam Turbine and Gas Turbine Technology Department, Huadian Electric Power Research Institute Co., Ltd., Hangzhou 310030, China
2
Aero-Engine Thermal Environment and Structure Key Laboratory of Ministry of Industry and Information Technology, Nanjing University of Aeronautics and Astronautics, Nanjing 210016, China
*
Author to whom correspondence should be addressed.
Energies 2022, 15(15), 5444; https://doi.org/10.3390/en15155444
Submission received: 20 June 2022 / Revised: 14 July 2022 / Accepted: 25 July 2022 / Published: 27 July 2022
(This article belongs to the Section I2: Energy and Combustion Science)

Abstract

:
The annual operation data of an F-class gas turbine generator set revealed that the duration of the startup process accounts for about 8.5% of the whole operation process. The three combustion models of a DLN2.0+ combustor demonstrated higher NOx emissions than the premixed mode under normal load during the startup process. In order to evaluate the scale of NOx emissions at this stage, numerical simulation was carried out for the startup process to discern the NOx emission pattern. Typical simulation conditions for each season were established to calculate the total annual NOx emissions at the initial stage based on operating data. On this basis, the characteristics of NOx emissions influenced by changes in the atmospheric environment were studied in depth. The results of this study provide referential data for evaluating the pollution characteristics and combustion adjustment of a ground gas turbine during startup.

1. Introduction

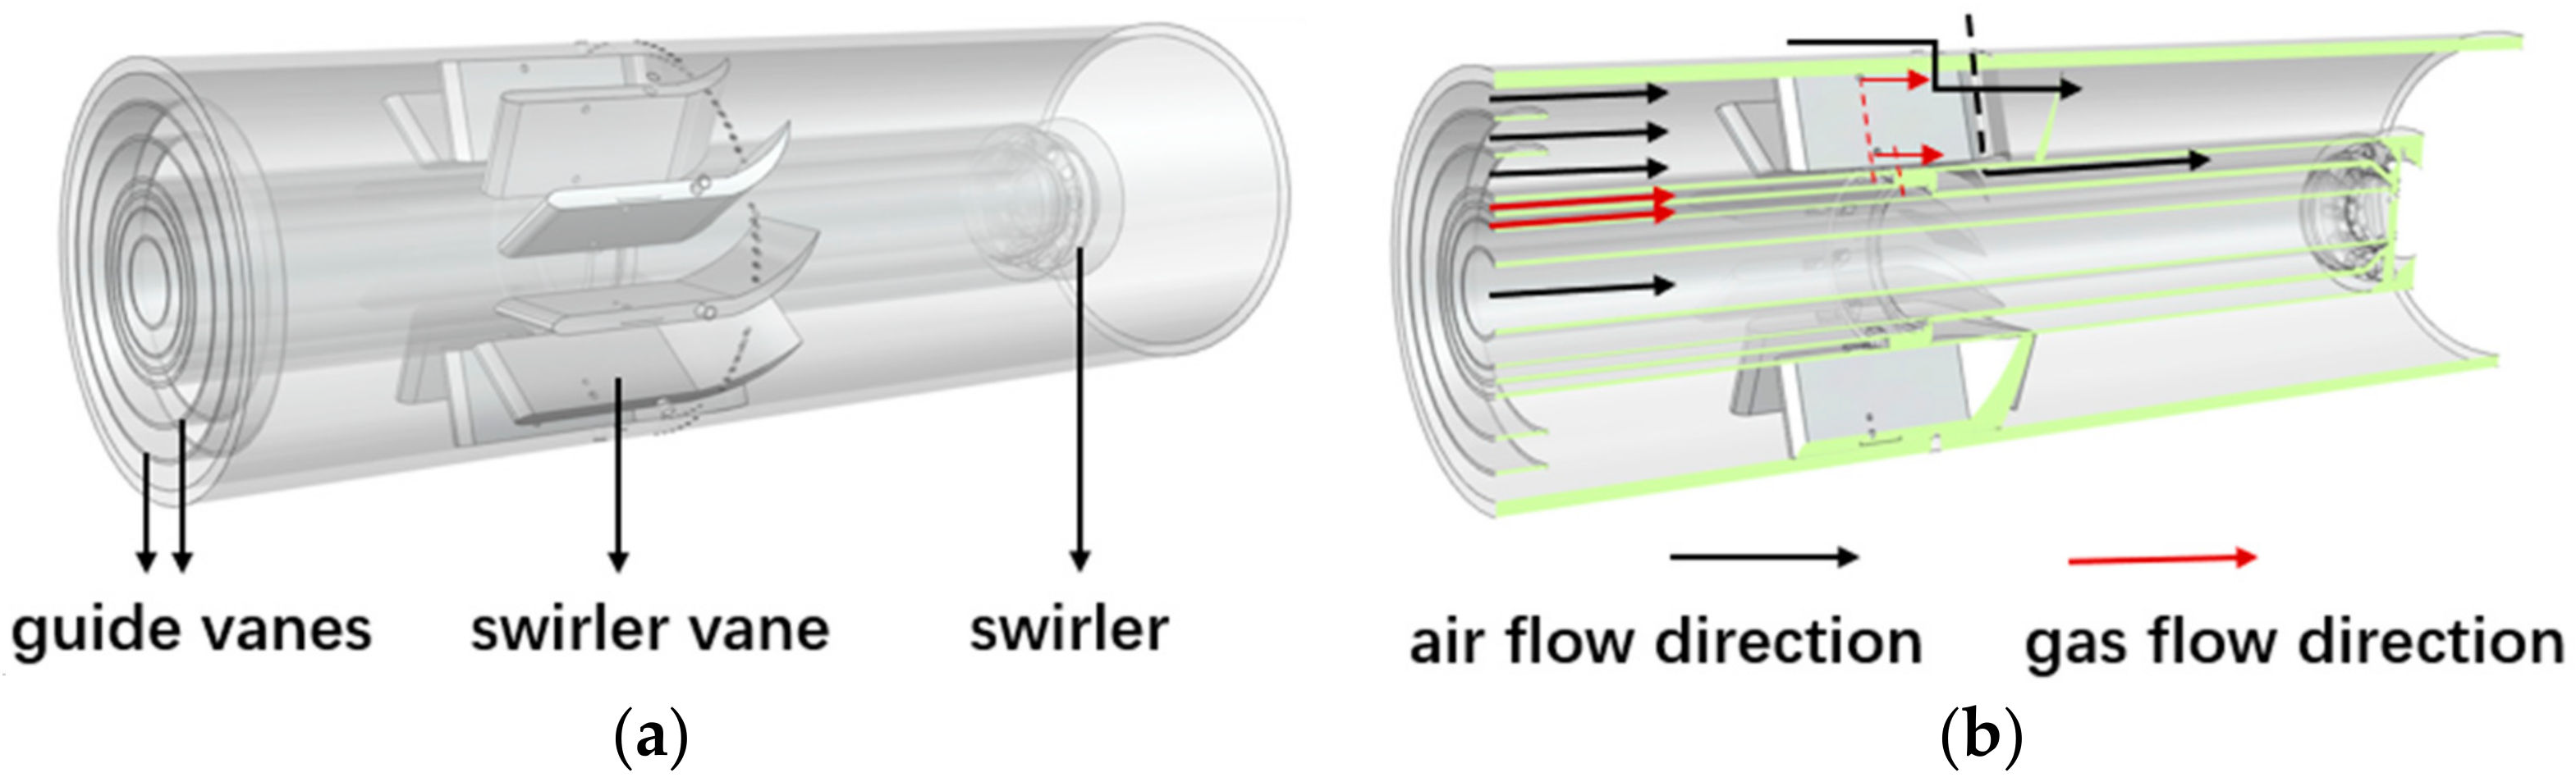
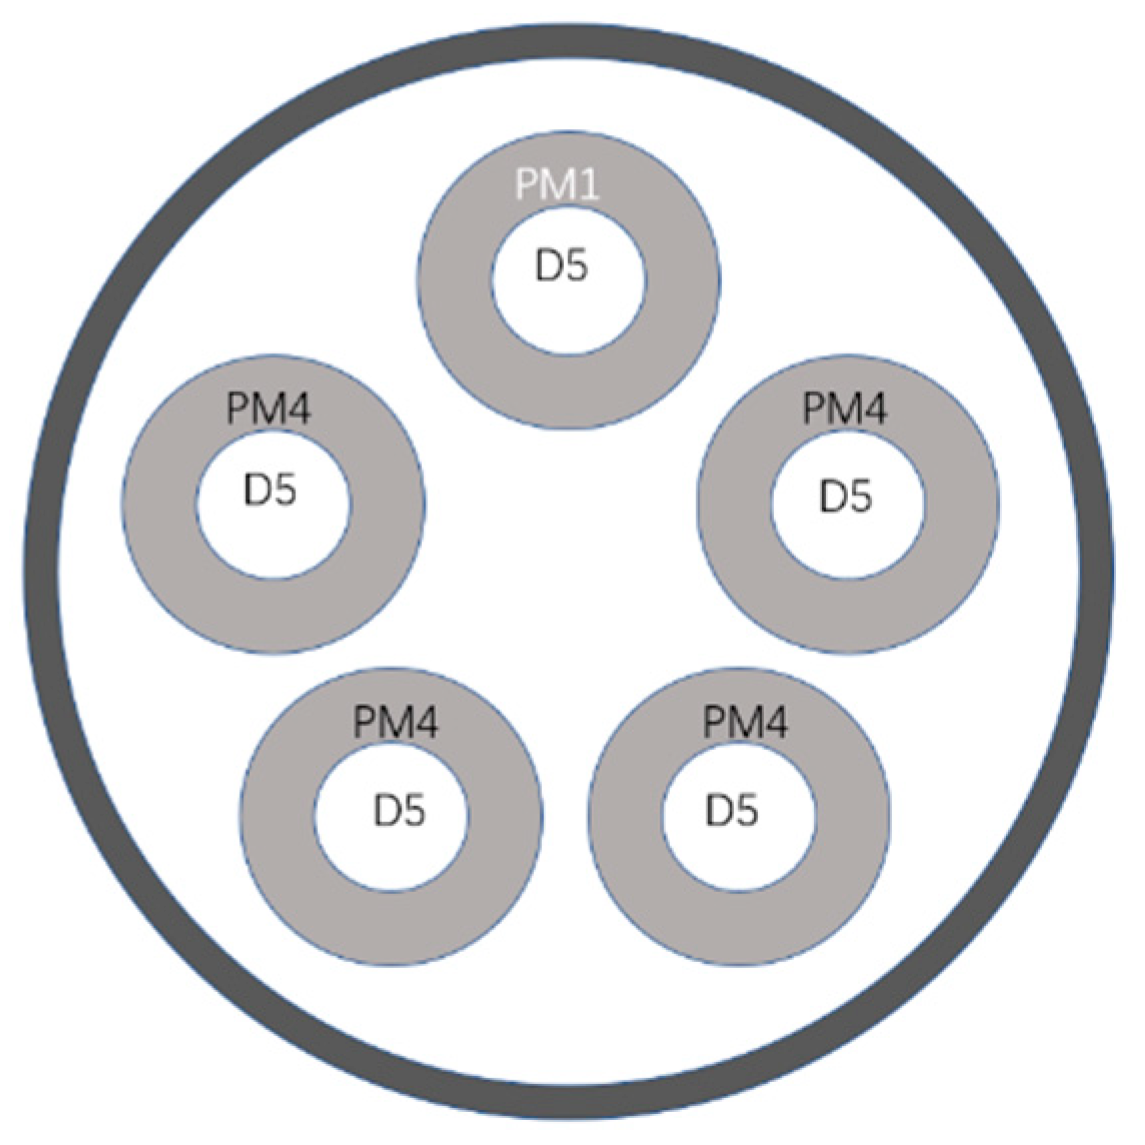
In recent years, the gas power generation industry in China entered a stage of rapid development. Gas–steam combined cycle units have become an important part of China’s energy utilization [1]. Due to the increasingly strict environmental standards, the NOx emission standard in flue gas is extremely low. To reduce flame temperature and avoid high temperature spots, lean premixed combustion technology was applied to modern gas turbines. Some units even sell out of combined flue to reduce NOx emissions [2,3]. However, the gas turbine engine is prone to Combustion Instability (CI), which leads to dangerous oscillation. As a result, gas turbines typically operate within a very small range of an equivalence ratio, to avoid the Lean Blow-off Limit (LBO) and CI [4,5,6,7]. However, the ignition of a gas turbine cannot be successfully achieved under such an equivalence ratio. The diffusion mode should be adopted to gradually transition to the premix mode to ensure the avoidance of blow-out and CI phenomena in the start stage of ignition. A DLN2.0+ combustor is a parallel staged premixed combustor produced by GE, which is widely used in F-class gas turbine units. Early gas turbines used the method of injecting steam or water to reduce the temperature of the combustion area. The DLN combustor uses air as diluent to mix fuel and excess air in advance and burns them in the combustion process, so as to control the combustion temperature. Different DLN combustion chambers have different fuel distribution and operation modes, as the DLN2.0+ combustor is one in a series. Taking a DLN2.0+ gas turbine as an example, from startup to stable working conditions, it required three startup combustion modes (it will be introduced in detail in the following chapters), namely the diffusion mode, sub-pilot premix mode, pilot premix mode, and finally it enters the normal premix mode [
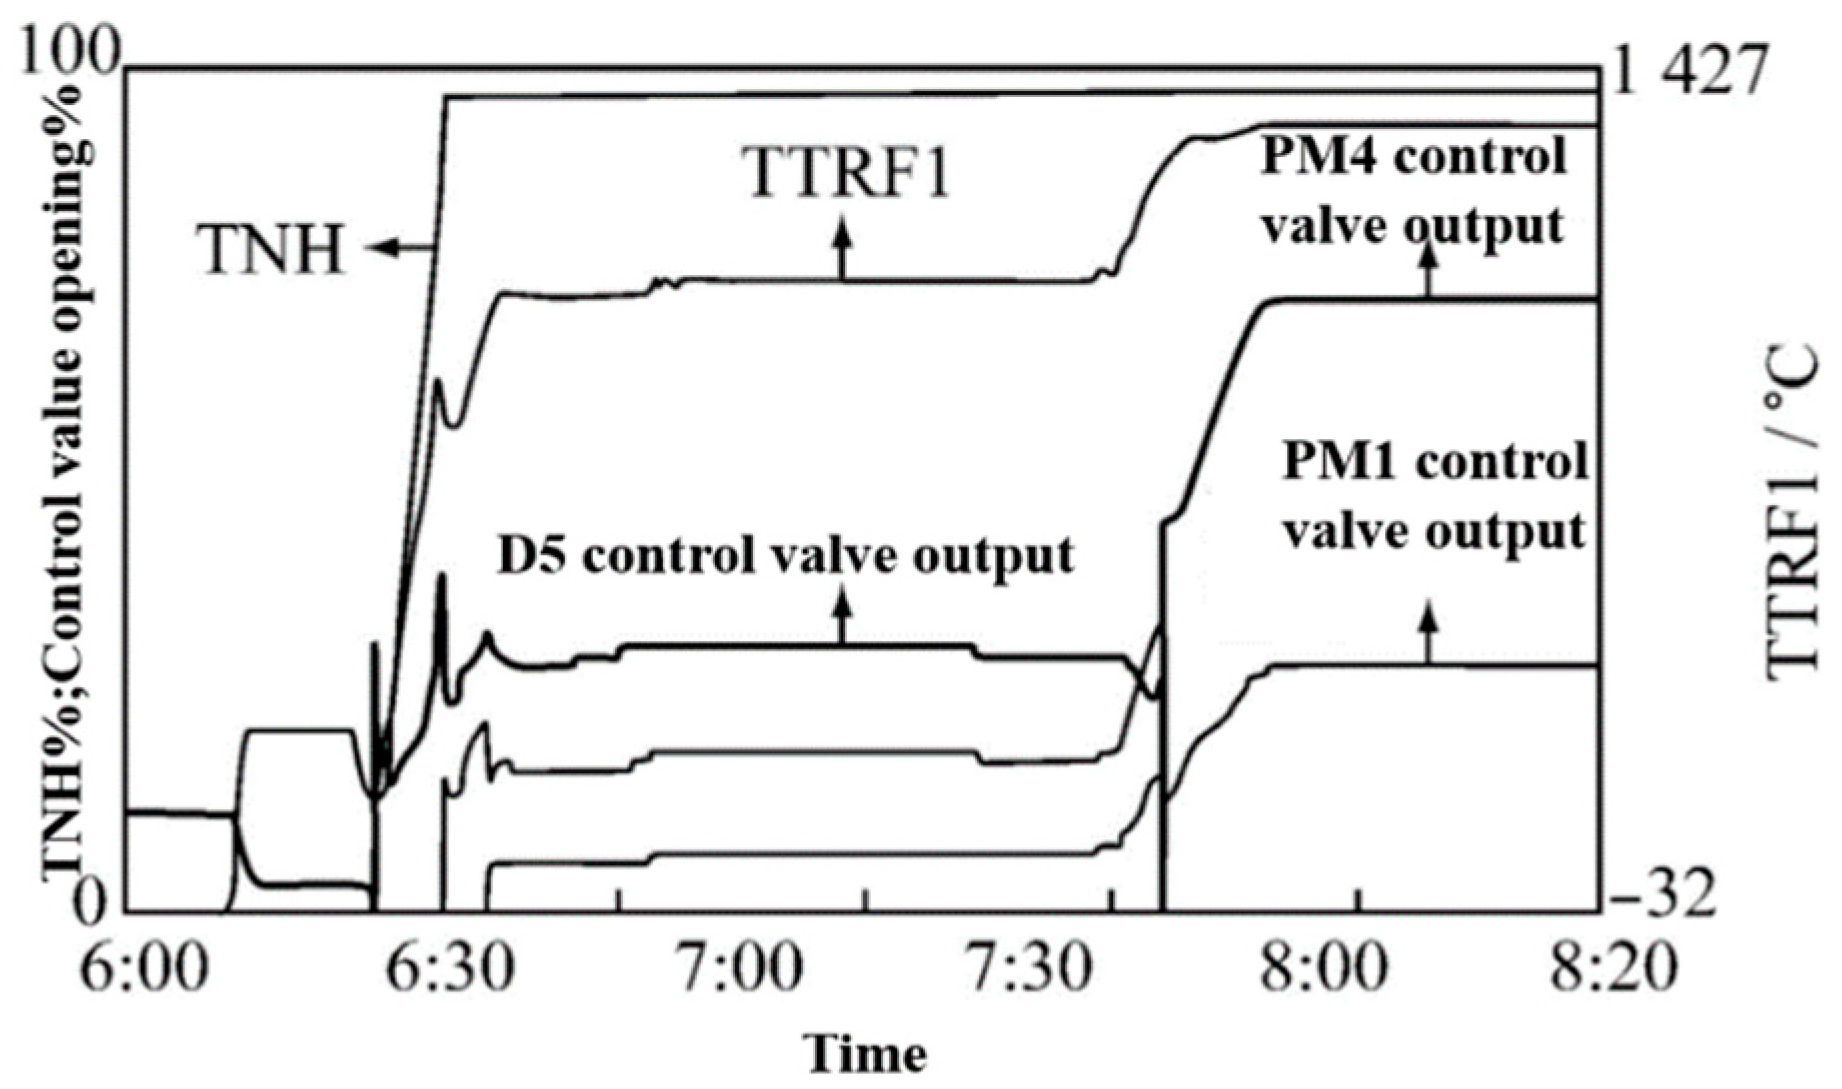
8]. The three modes all have diffusion combustion types. In order to ensure the stability of gas turbine startup, a fuel-rich combustion zone exists behind the PM1 jet in the sub-pilot premix and pilot premix modes. This also results in higher NOx emissions during startup than during typical load operation. The typical startup process of a DLN2.0+ gas turbine usually lasts more than one hour, and the equivalent ratio provided by the gas turbine manufacturer at this stage is conservative, so as to ensure the successful ignition and continuous combustion of the gas turbine without excessive consideration of emission indicators. The diffusion combustion mode inevitably results in the appearance of a high temperature zone, with NOx exceeding the standards outlined in the combustion chamber. In fact, since gas turbine power stations are usually used for peak shaving, the annual start and stop frequency is high, so the level of NOx emission in the startup process is considerable. Because the flue gas post-treatment in the startup stage usually does not work normally, or because some units may not include post-treatment systems, the NOx emissions in this part are not conducive to pollution control. The NOx emission of a DLN2.0+ combustor can be controlled at 10–25 ppm during high load operation, while NOx emissions in the startup stage can even exceed 100 ppm. The NOx emission standard of Beijing and Jiangsu in China is 15 ppm, and the emission level in the startup stage is much higher than this standard, which is a major challenge for environmental protection. Before replacing existing gas turbines with more advanced equipment, existing equipment needs to be improved to meet current pollution standards.
In the process of gas turbine operation, NOx is mainly emitted in the form of thermal NOx [9,10,11], which has an exponential relationship with the temperature of the combustion zone. The lean combustion premix combustion structure was adopted to make the equivalent ratio deviate from the stoichiometric equivalence ratio, and reduce the combustion temperature and local high temperature hot spots, thus greatly reducing the NOx index. Therefore, the main measures to achieve the low emissions of gas turbines are combustion organization and combustion optimization. As the design and manufacture of gas turbines is also a long-term strategic goal of China, a variety of domestic studies on the combustion organization of gas turbines have been published [12,13]. However, most of them focus on low-nitrogen emission combustion adjustment technologies under normal working conditions. For example, at present, according to the operating conditions of a gas turbine combustor, the thermodynamic conditions, chemical dynamics characteristics and flow conditions of soft combustion have been studied, and the soft combustion has been realized in the model combustion chamber [14]. Xiao Junfeng et al. [15,16,17] conducted a series of numerical simulation studies on gas turbines concerning the influence of air moisture content, atmospheric temperature and intake pressure on the combustion effect of a gas turbine, etc. In the early stages of research, a number of studies on pollutant emissions and the pollutant discharge of DLN gas turbines were reported [18,19,20], but the current studies on lean oil premixed combustors mainly focus on combustion stability, including the important influencing factors [21] and control methods [22,23,24]. Research on flame shape changes in a premixed combustor under an oscillation state is also popular [25,26]. Mitchell Cohen [27] introduced the adjustment and maintenance strategy of a DLN burner, and Min Chul Lee [28] adopted the six Sigma method for time management and other adjustment strategies for NOx emissions in the combustion process. However, Chikushev et al. [29] pointed out that at present, most studies on the combustion adjustment process and combustion focus on the design condition and normal load, and there are relatively few studies concerned with NOx emissions in the startup stage. NOx emission characteristics and adjustment strategies in the startup stage have not yet been reported. In the startup stage, diffused combustion and a fuel-rich premix mode are important components, hence the zone of an extremely high local temperature. The high concentration of NOx generated in the local high temperature region is not consumed in the subsequent reaction, but enters the subsequent stages and is finally discharged into the atmosphere.
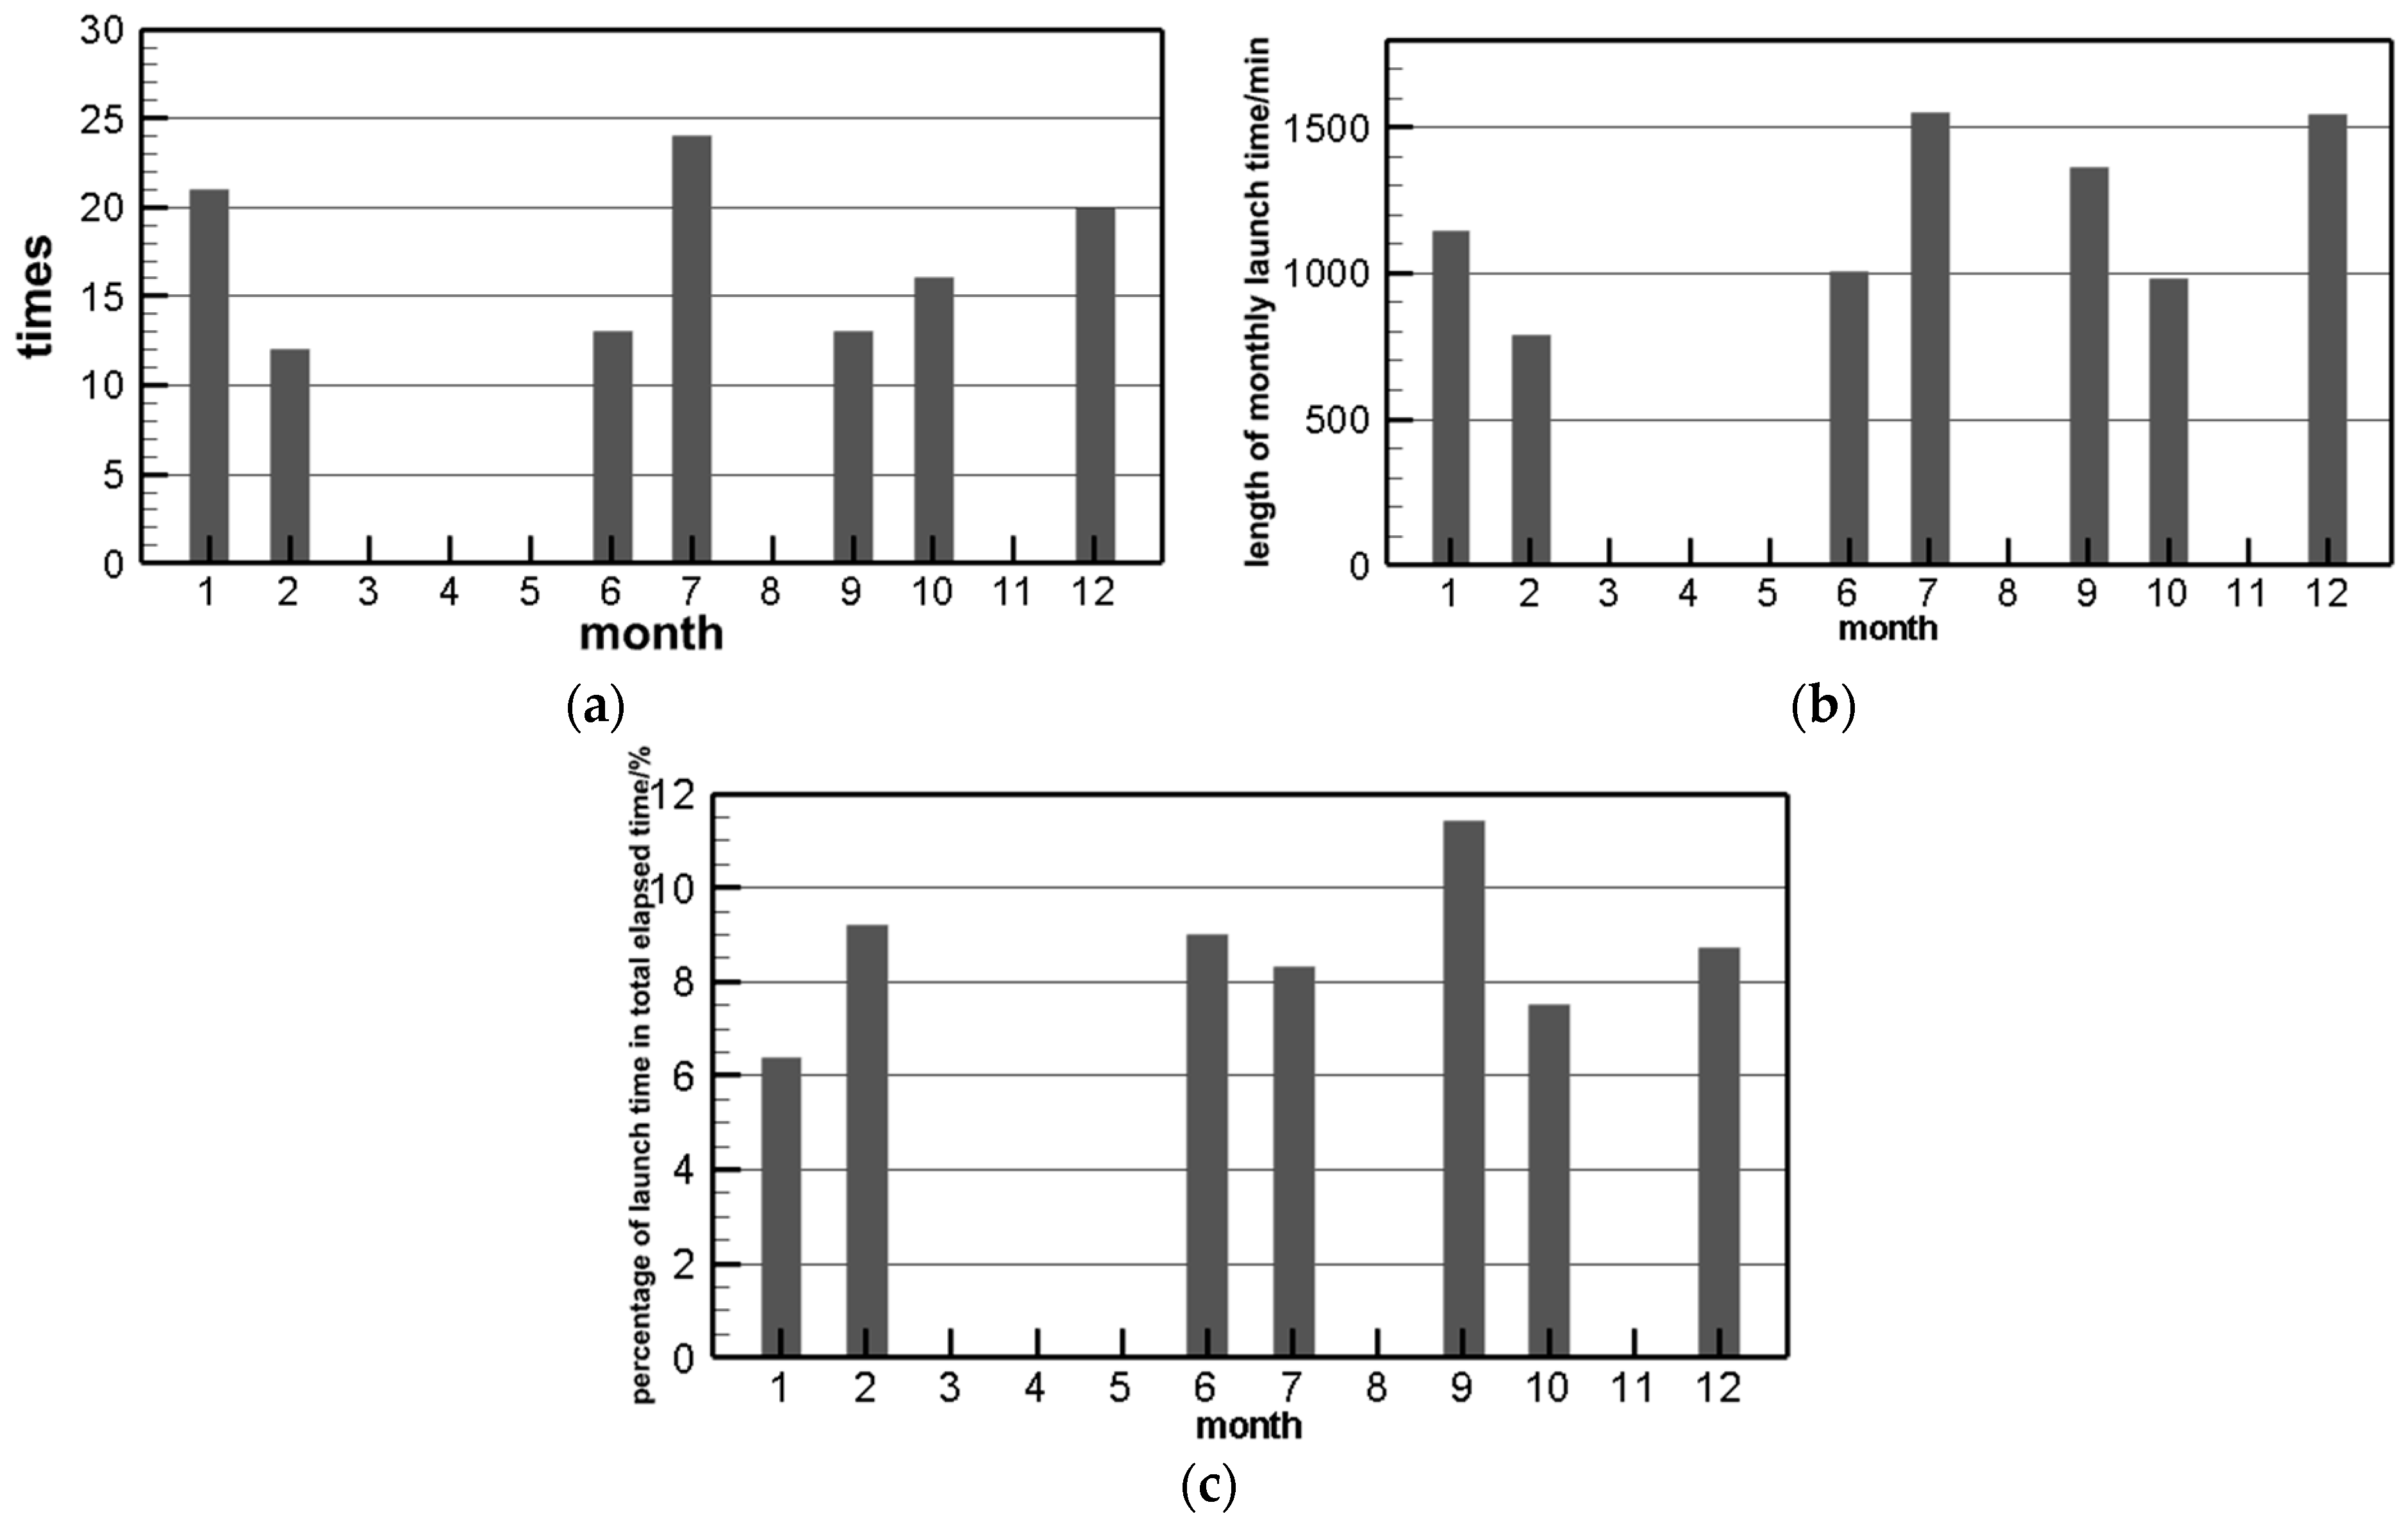
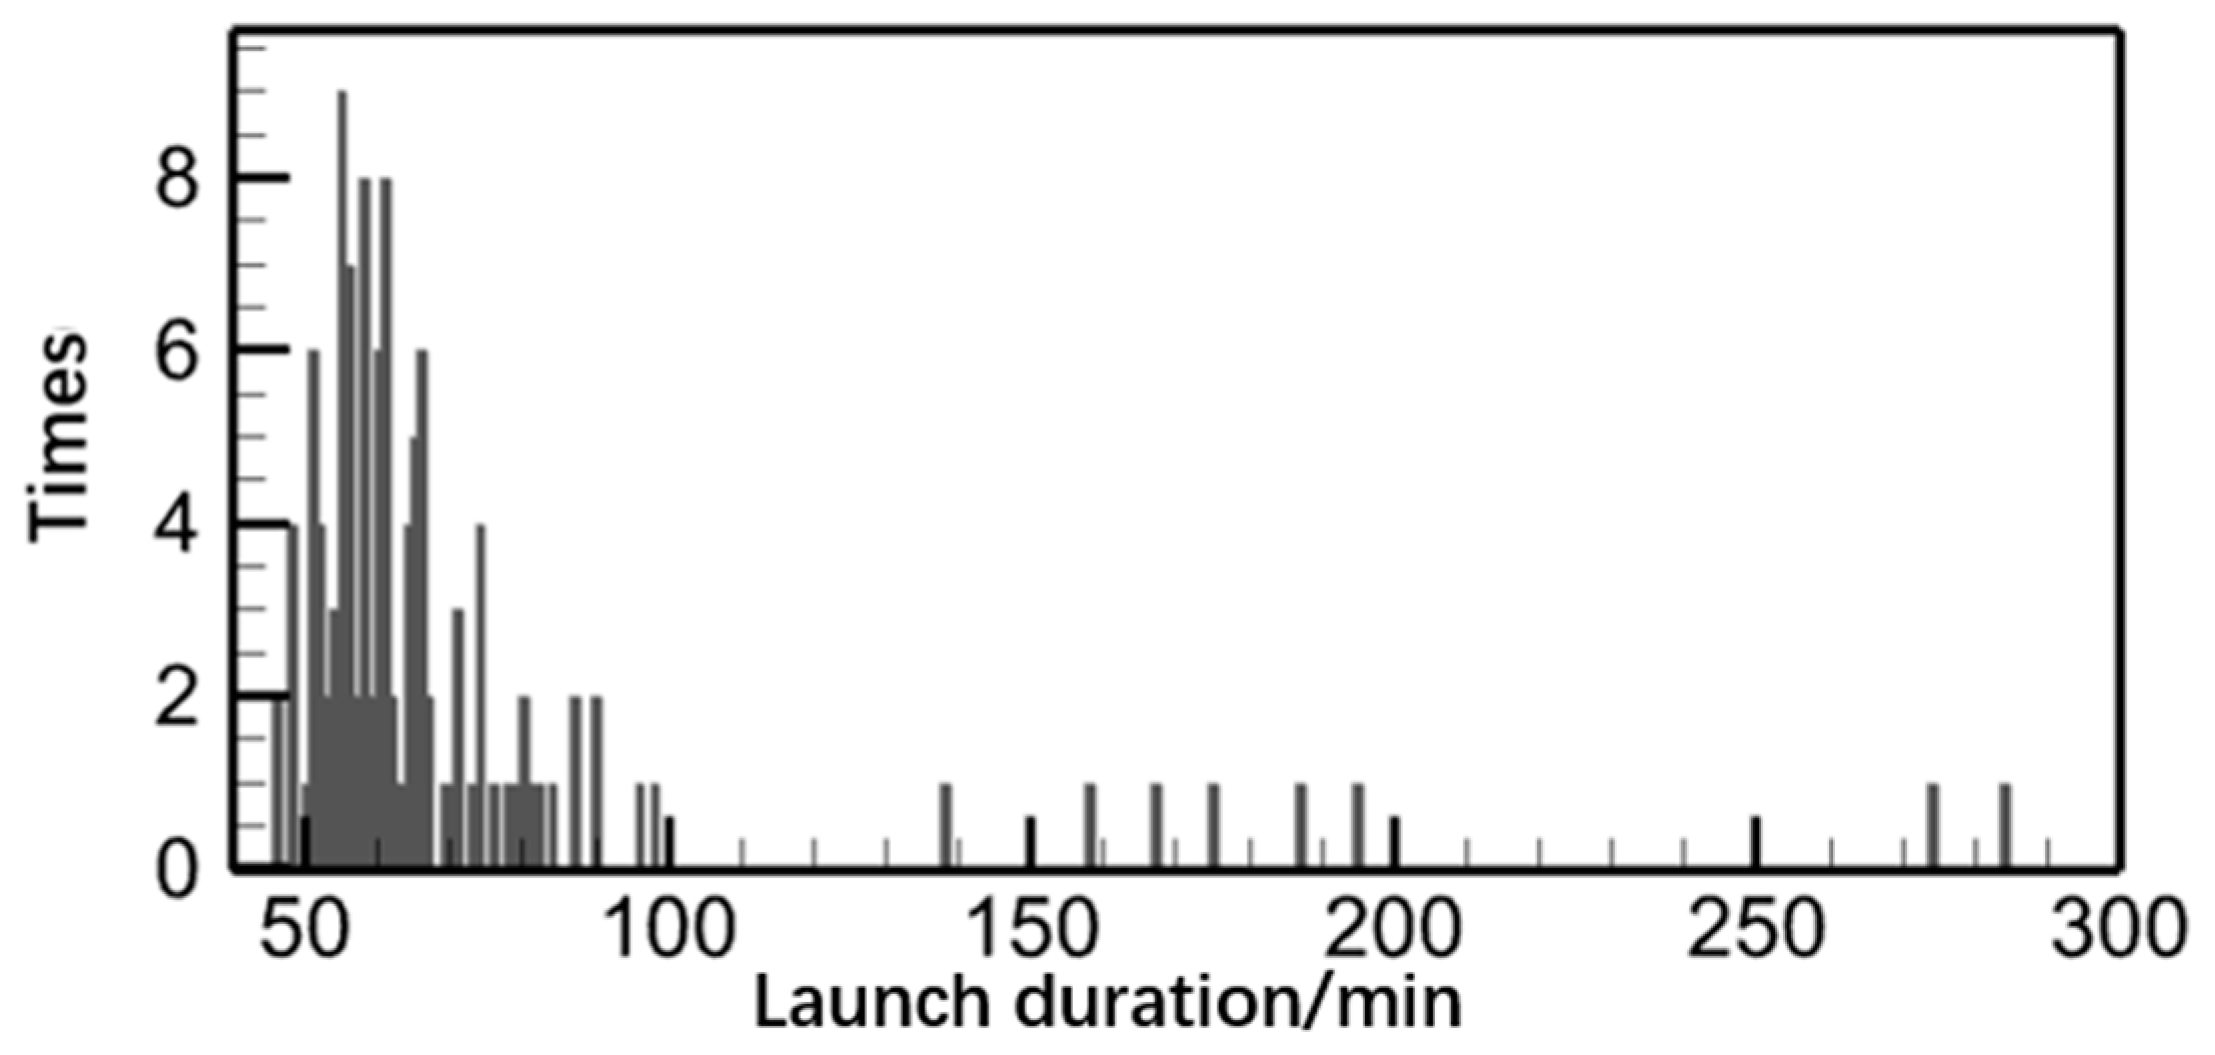
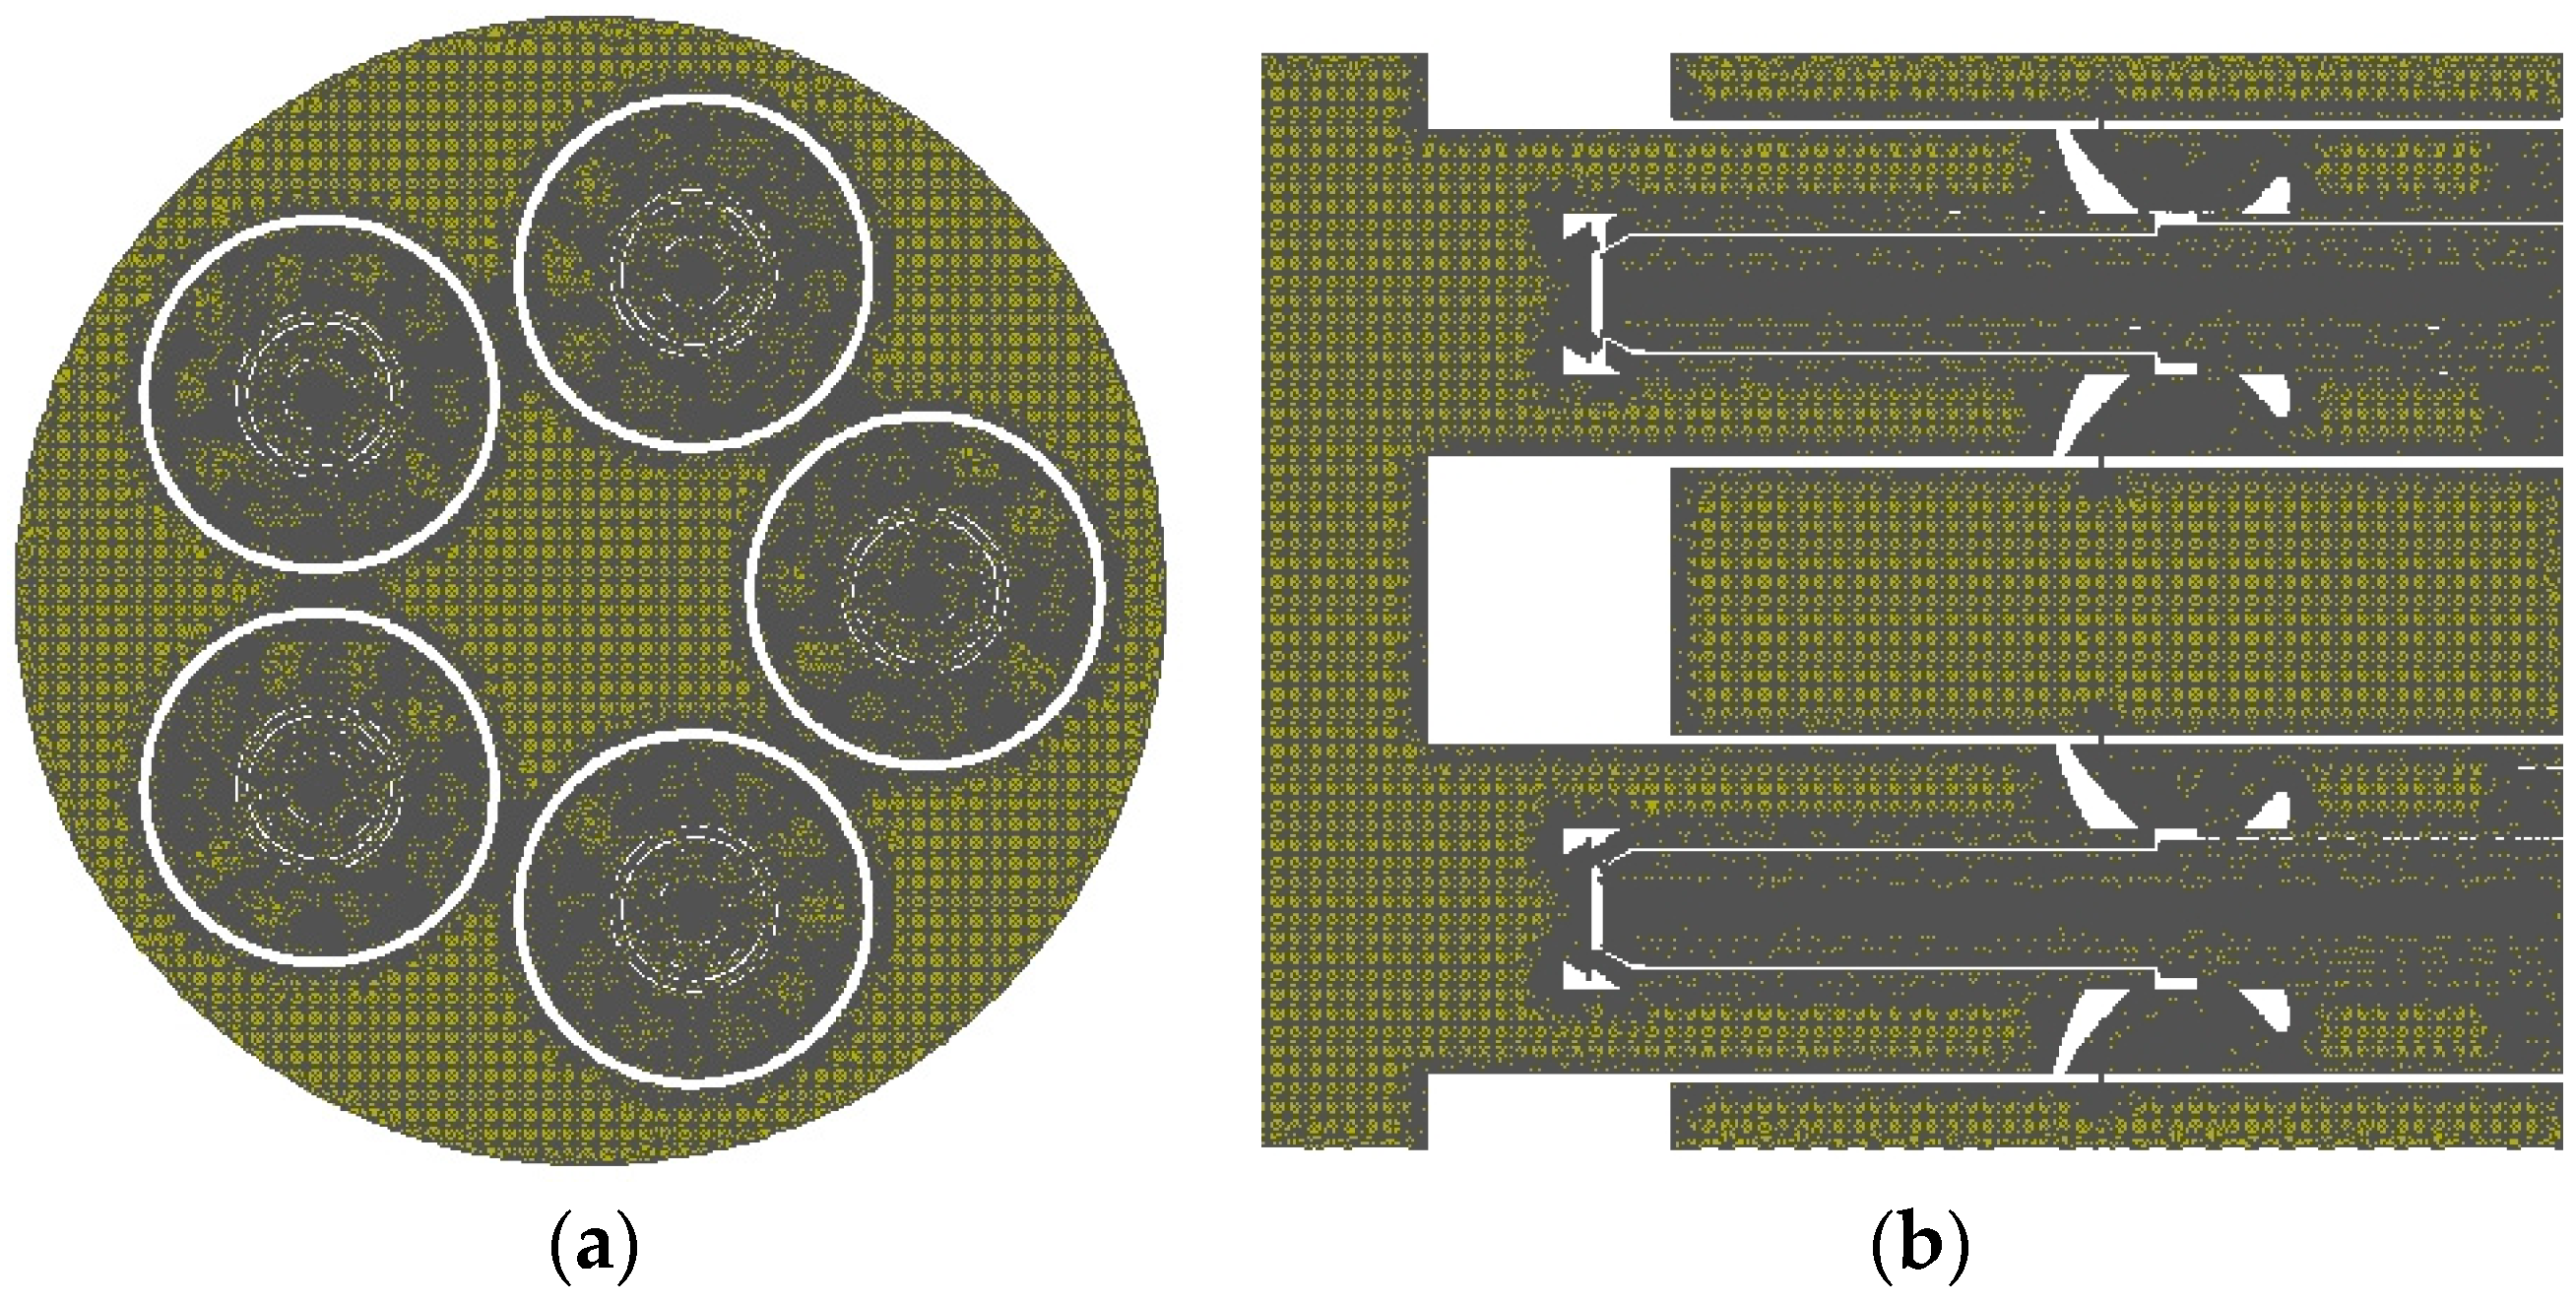
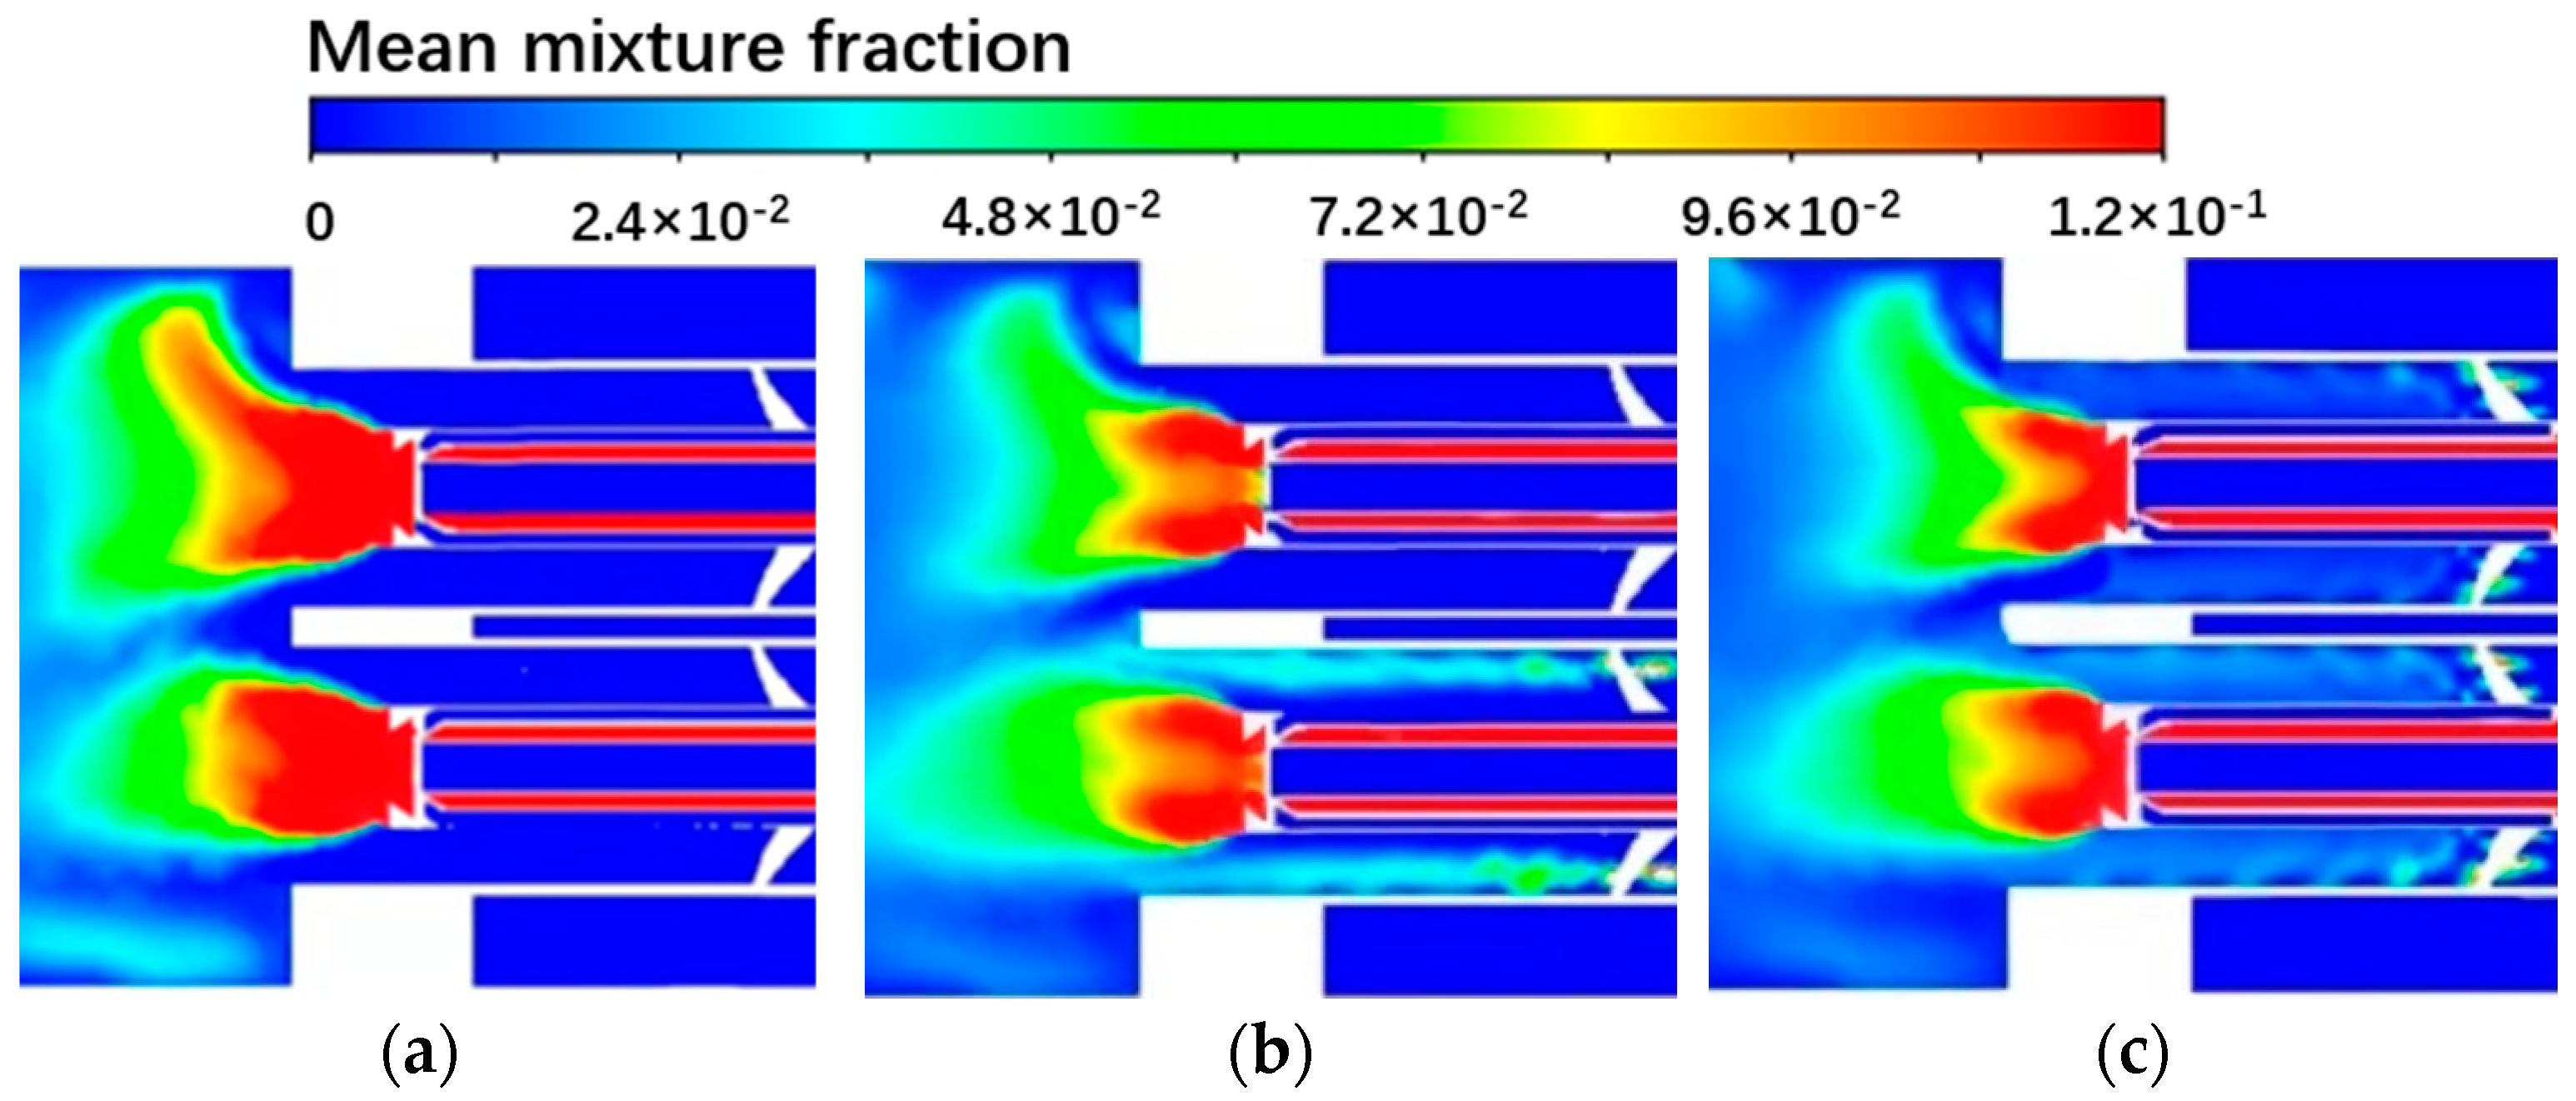
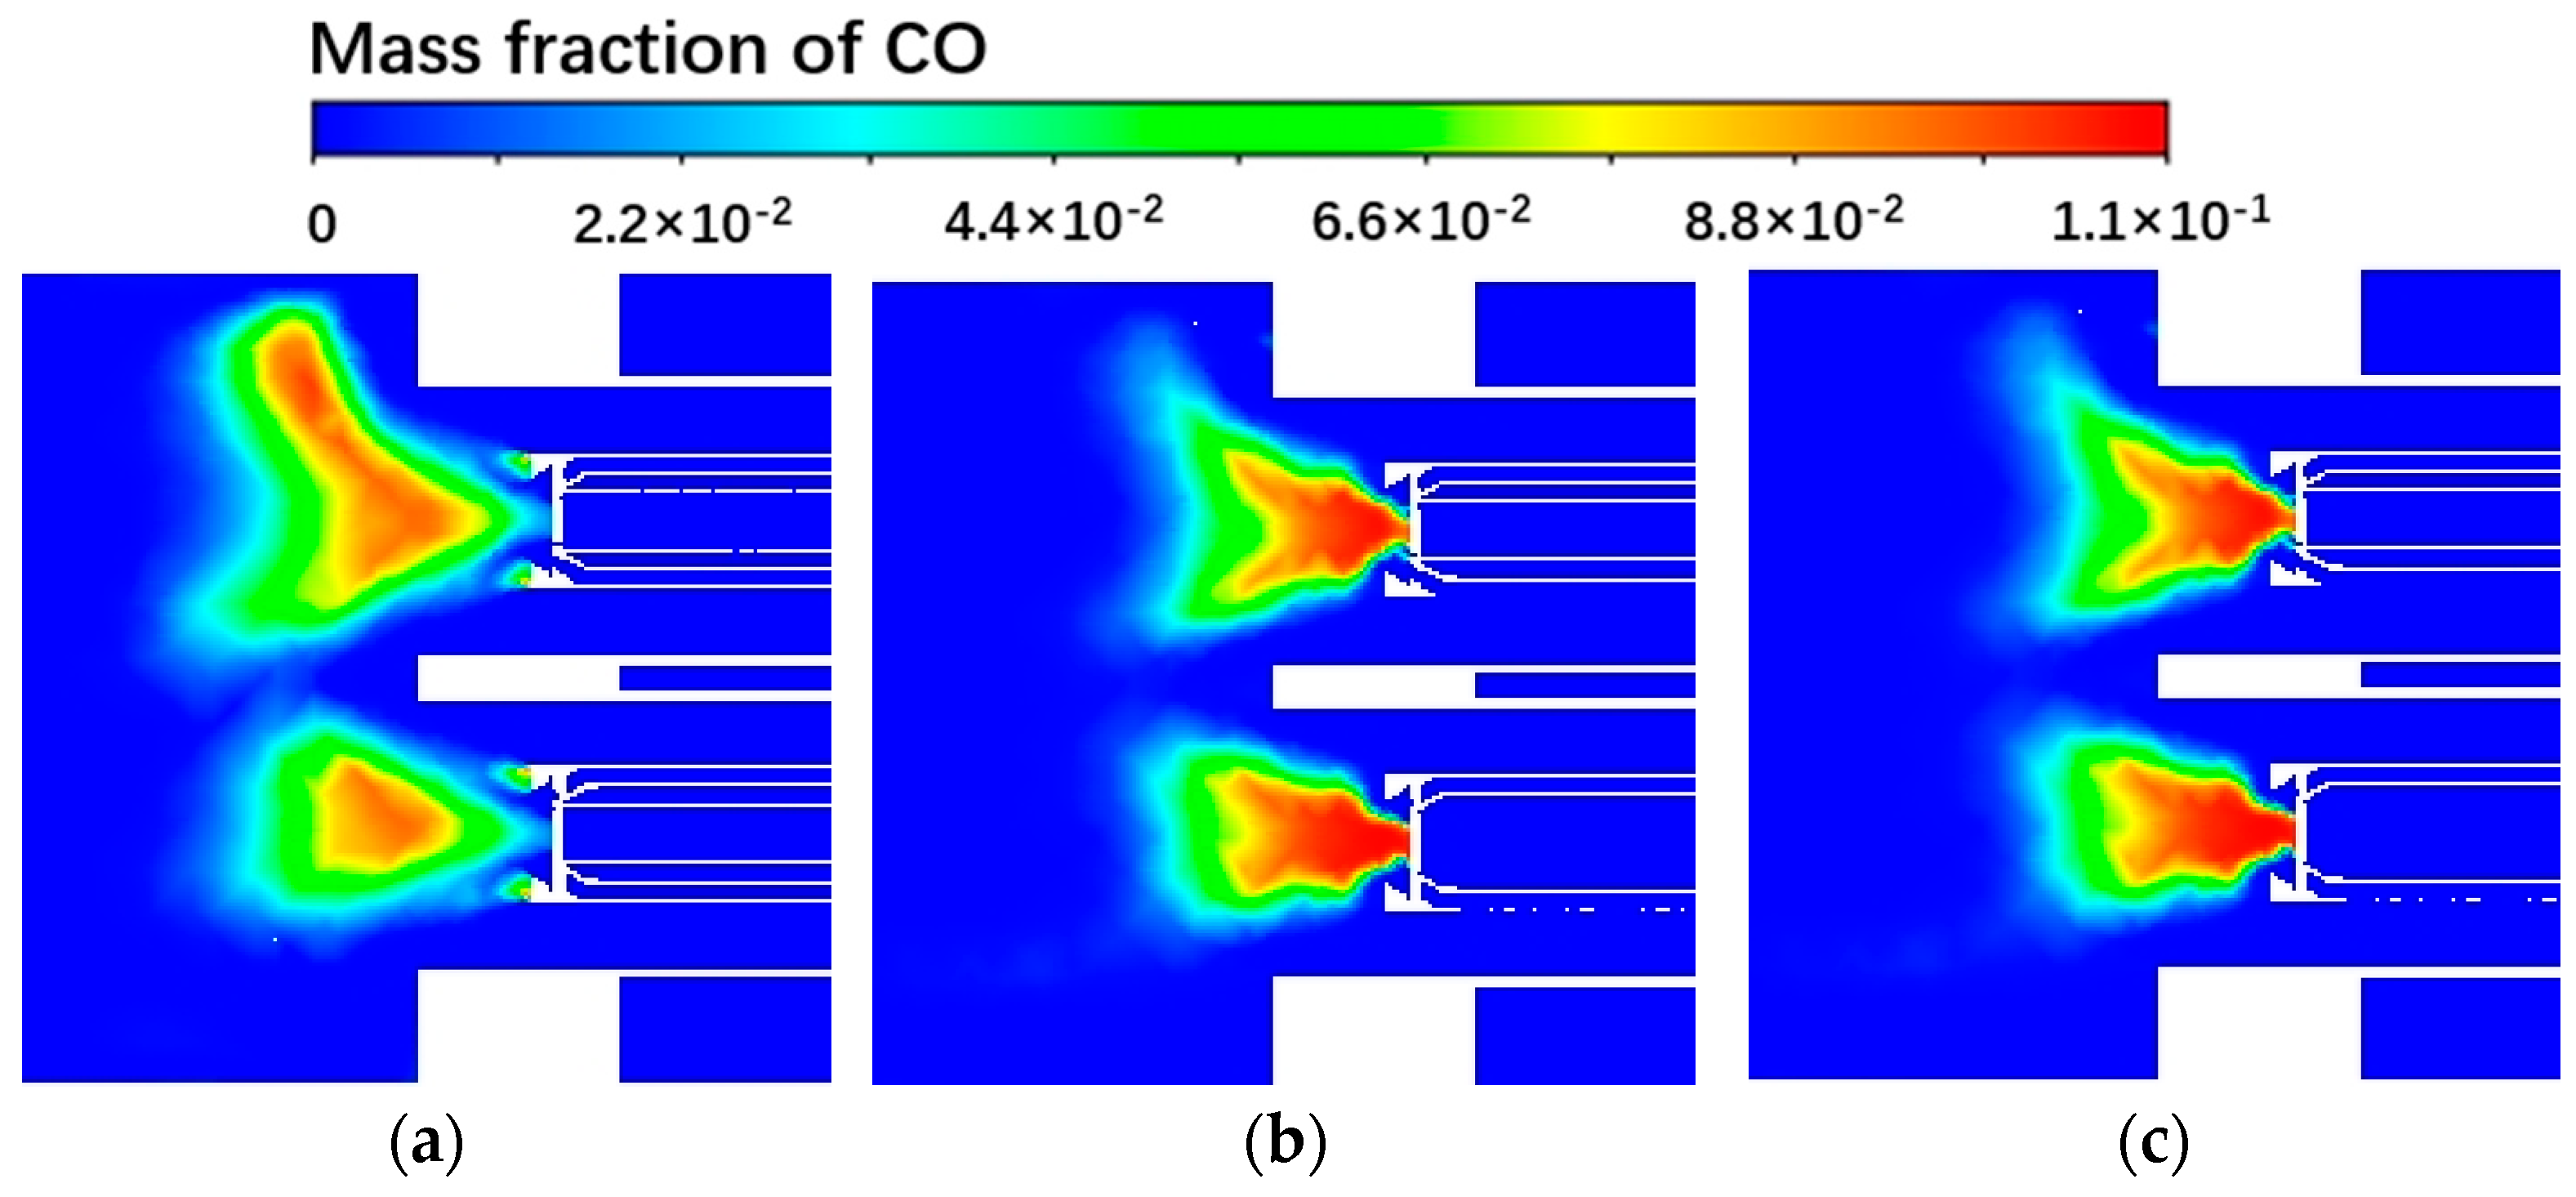
In order to evaluate and analyze the emission characteristics and influencing factors of NOx emissions during the startup stage of a gas turbine, the numerical simulation method was adopted in this paper to estimate the Nox emissions during the startup period of a DLN2.0+ gas turbine unit in one year. The influence of atmospheric conditions on gas turbine emissions during the startup process was analyzed to provide data and a basis for the optimization and adjustment of gas turbines during the startup process.

2. Duration of Gas Turbine Startup

In order to evaluate the startup process of gas turbine units, an F-class gas–steam combined cycle generator set was taken as an example. Figure 1 shows the startup statistics of a certain year from January to December. Figure 1a shows the unit’s operation records in January, February, June, July, September, October and December, starting 21, 12, 13, 24, 13, 16 and 20 times in each month, respectively. The gas turbine underwent a startup process on every operating day. Figure 1b shows the total duration of the startup process in each running month, with both July (summer) and December (winter) reaching more than 1500 min (25 h), meaning that each startup required about an hour on average. Figure 1c shows the percentage of startup time in terms of total running time, with the lowest in January accounting for 6.4% and the highest in September accounting for 11.4%. The annual startup time of the unit reached 139 h, accounting for 8.46% of the annual actual operation time. Figure 2 shows the distribution of the startup time of the unit. It can be seen that the longest duration lasted about 284 min, and the shortest 46 min. Most of the startup events lasted around 1 h.
According to the design parameters, the NOx emission level of gas turbines is only about 10–25 ppm under normal load and stable operation, but it can reach much higher in the startup stage. Therefore, the annual NOx emissions of 139 h is also unignorable. Numerical simulation was performed to analyze the NOx emission characteristics of the gas turbine startup process in different seasons, so as to aggregate data for the further optimization of the startup process.

3. Research Object

A numerical simulation study of the NOx emissions of an F-class heavy gas turbine during startup was carried out. There were 18 single-tube DLN2.0+ combustors in the whole ring of the gas turbine. Due to the computing power and efficiency, only a single combustor was simulated. Figure 3 provides a schematic diagram of a single combustion chamber. Each combustion chamber consists of five groups of burners evenly arranged in a circumferential direction (as shown in Figure 3a). Air and methane gas enter the burner from the left side. The mixed gas enters the combustion zone from the burner for combustion. After flowing through the transition section, it enters the turbine for work and enters the waste heat boiler (as shown in Figure 3b). In the startup process and normal load state, there are five groups of burners in each combustion chamber which can be adjusted to initiate diffusion, diffusion and premixing, premixing and other combustion processes. This structure makes the air organization and fuel distribution of each burner controllable.
Figure 4 shows the structure and medium flow diagram of a single burner. The burner includes a guide vane, a swirl vane, and a head swirl (Figure 4a). The guide vane distributes the inlet air according to the design. The swirl blade forms a tangential swirl when the main combustion air enters the combustion chamber to construct the flame stabilization structure in the combustion zone. The head swirl organizes the burning and flame stabilization structure of the piloted flame. In the mixed modes, which have both a diffusion flame and premix flame, the low-emission combustion flow field is established in the whole combustion space through the central classification mode. Figure 4b shows the air/gas flow diagram of the burner. In order to achieve different modes under startup and normal load, the gas is designed to enter the burner through multiple channels with a controlled flow rate to achieve different combustion modes. Air (marked by black arrows) enters the combustion zone through the premixed passage (outer three air flows) and the diffusion passage (central flow passage) through the guide vane and the head cyclone, respectively. This means that there is also a stream of air through the mixing hole on the wall of the burner, which is imported by the difference between the internal and external pressure of the main cyclone. The fuel (as shown by the red arrow) is divided into pre-mixed fuel and diffused fuel, where the innermost ring is the diffused fuel channel, which is directly injected into the combustion chamber through the head cyclone to form a diffused flame. The premixed fuel flows out through the small hole on the swirl blade and mixes with air into the combustion chamber to form a premixed flame. After the combustion reaction in the combustion zone, the high-temperature gas enters the turbine from the transition section for work.
Gas turbine startup is a dynamic process, and the evolution process is a lengthy, unsteady process in terms of physical mechanisms. In order to determine an appropriate emission prediction method, the continuous startup process was decomposed, and the startup process operation parameters of DLN2.0+ were calculated in the segment. Reynold’s Averaged Numerical Simulations (RANS) were performed at each stage, and this state was statistically analyzed as the average value of the evaluation startup process at each stage.

3.1. Startup Procedure

To avoid flameout and oscillation during startup, DLN2.0+ adopts a startup process from diffusion combustion to premixed combustion, which is divided into four stages (including premixed combustion stage). The four stages are formed by adjusting the fuel mix of five burners, each containing a diffusion mode (D) and a premix mode (PM) andthe structure of each burner is shown in Figure 5. The combination label of burners used in the startup process is shown in Figure 6 [6], where D5 represents the diffusion nozzles among the five burners, PM1 is one of the five premixed nozzles and PM4 is the remaining four premixed nozzles. Table 1 shows the four operating modes and the nozzles used in the startup process of the combustion chamber. In the first stage—the pure diffusion combustion mode—the central diffusion nozzles of the five burners are fully open, i.e., D5. The second stage sub-pilot premix mode, on the basis of the first stage, opens the premix fuel of a burner at the same time, so that the burner is in both the diffusion and premix working modes, that is, D5 + PM1. The third stage is the pilot premix mode, on the basis of the second stage, which opens the premix mode of the other four burners, so that all five burners work in both the diffusion and premix working mode, that is, D5 + PM1 + PM4. The fourth stage is the normal working state of the gas turbine. At this time, the diffused fuel of all the burners is closed and only premixed combustion is performed, that is, PM1 + PM4. Therefore, the startup process consists of the first three modes. When entering the fourth mode, it indicates that the gas turbine enters the normal working state.

3.2. Computing Domain Grid Division

A single combustion chamber is composed of five groups of burners, and each group of burners has a relatively complex flow structure inside. Therefore, the unstructured mesh discrete computing domain was adopted, as shown in Figure 7. A grid of individual burner flow structures was first generated and then combined into the combustor. In the mesh generation, the swirler blade, air intake pipe, cooling hole and other complex structures were refined. Figure 7a is a schematic diagram of the cross-section mesh. Figure 7b is a sectional view of the center line, where the elements’ distribution near the wall surface and small structures can be seen. Through mesh independence verification based on flow field calculation, the meshes composed of 25.44 million tetrahedric elements were selected for numerical simulation calculation. The overall quality of the mesh was above 0.2, which met the requirements of calculation.

3.3. Computational Models and Mediums

Fluent software was used for the numerical simulation of the combustion flow field, and the incompressibility hypothesis was adopted in the mathematical model. A pressure-based solver was used, and standard k-ε model was selected for the turbulence model. The turbulent combustion model was a Flamelet Generated Manifold. A simplified version of the detailed chemical mechanism of GRI 1.2 was selected for the chemical reaction mechanism, with a total of 19 components and 84 steps. The NOx emission level was calculated using the empirical model of fluent. The fuel medium was natural gas, and the main mole composition was the mean value of local natural gas, which was as follows: CH4: 97%, C2H6: 0.68%, and N2: 2.23%. The composition of the air medium accounted for the humidity difference in different seasons.

3.4. NOx Pollutant Model

NOx generation models in fuel combustion usually include thermal NOx, transient NOx and fuel NOx. Thermal nitrogen and transient nitrogen are mainly considered in the calculation of NOx generation models.
The formation of thermal NOx is highly dependent on the temperature of the chemical reaction [31,32,33], and the net rate of the main reaction formation is expressed as follows:
d [ NO ] d t = k f , 1 [ O ] [ N 2 ] + k f , 2 [ N ] [ O 2 ] + k f , 3 [ N ] [ OH ] k r , 1 [ NO ] [ N ] k r , 2 [ NO ] [ O ] k r , 3 [ NO ] [ H ]
where k i are coefficients, and the values are shown in Table 2.
More NOx is produced in rich flames, and its formation process involves a series of complex reactions and intermediate components. The net rate of the generation of transient NOx is:
d [ NO ] d t = k 0 [ CH ] [ N 2 ]
where k 0 is the reaction coefficient.

3.5. Computing Validation

In order to verify the reliability of the numerical simulation calculation of combustor outlet discharge characteristics, the steady-state combustion flow field of a single head combustor in various operating modes was calculated based on the operation data of the F-class unit. The comparison of power plant operation data and simulation results is shown in Table 3. The NOx emission concentration at the combustor outlet of the numerical simulation was close to the measured data in actual operation, and the error was small. The results indicate that the combustion model, chemical reaction mechanism and pollutant model used are suitable for combustor emission assessment. Based on this simulation scheme, this paper investigated emission characteristics during the startup process.

3.6. Startup Process Simulation Scheme

The actual operation data of the F-class unit in the startup process were distributed across the 18 heads to obtain the average natural gas flow in each stage of the single-tube combustor, as shown in Table 4. The actual operation data were also used to calculate the fuel distribution ratio. As mentioned above, the change in the fuel quantity in each stage of actual operation was gradual, and the average value was used as the representative working condition of each stage in this paper. Three typical simulation conditions of RANS were simulated in the whole startup process, and the simulation results were used as the evaluation data of emission characteristics in each stage.
The inlet air temperature of the combustion chamber is the outlet temperature of the compressor. After the air is compressed by the compressor, the temperature increases, and the temperature rise is related to the compressor pressure ratio. As the rotational speed of the compressor is different under different operating modes, the actual outlet temperature of the compressor changes to a certain extent. Table 5 shows the temperature rise relationship under the calculated working conditions, according to which the pressure ratio of the compressor of the unit under normal working conditions was about 14.97. The inlet water vapor content of combustion chamber was calculated by analyzing the relative humidity of inlet air.
Figure 8 shows the high temperature zone of the combustion chamber under three typical working conditions during startup. In the sub-pilot premixed and pilot premixed modes, more fuel was distributed at the PM1 nozzle (the burner in the lower part of the figure), and the fuel quantity at the other PM4 nozzles gradually decreased. So, compared with the diffusion mode, there was a larger high-temperature zone in the PM1 burner, while the high-temperature zone behind the PM4 burner was significantly smaller. Figure 9 is a distribution diagram of the mixing fraction under different modes in the startup. It can be seen that in the sub-pilot and pilot premixed modes, methane was mixed with air through the small hole on the cyclone blade, and the combustion organization changed, which also affected the generation of CO (Figure 10). In the transition from the diffusion mode to the pilot premixed mode, the proportion of diffusion fuel decreases, the distribution of the mixing fraction becomes more uniform, which makes the combustion more sufficient, and the distribution area of CO gradually reduces. The quantitative statistical results are shown in Table 6, in which the average concentration of CO at the outlet also gradually decreased. The production of NOx has a higher correlation with the high temperature zone. As shown in Figure 11, the NOx distribution area behind the PM1 burner in sub-pilot premixed and pilot premixed modes was slightly larger than in the diffusion mode, and the concentration was higher, while the concentration behind the PM4 burner was lower and the distribution area was small. In the startup, the diffusion mode presented the lowest Nox emission level, followed by the pilot premixed mode, and the sub-pilot mode demonstrated the highest level. This is because diffusion occurs in all three modes. With the increase in fuel quantity, a fuel-rich premix nozzle is opened in the sub-pilot mode, and more high-temperature regions are generated. When entering the pilot premix mode, the other four premix nozzles are fully opened. In this mode, the premix fuel is distributed to the five premix nozzles and the equivalent ratio of each premixed nozzle is lower than in sub-pilot premixed mode; therefore, the temperature of the local high temperature zone decreases, resulting in a lower NOx emission level in the pilot premix compared to the pilot mode. CO reflects the degree of combustion completeness, and the addition of a premix nozzle improves the combustion efficiency, thus leading to the gradual reduction in CO in the starting sequence.

4. Results and Analysis

From the analysis provided in the above section, it can be seen that in the startup stage, pollutant discharge is more significant than in the normal working state. In fact, changes in the atmospheric environment also lead to changes in emission performance. Therefore, the effect of season should be considered in order to accurately analyze the annual emission characteristics in the startup stage.

4.1. Analysis of Annual Total Emissions

According to the statistical data in Figure 1, the unit mainly works in summer (June and July), autumn (September and October) and winter (December, January and February). Atmospheric temperature and relative humidity change significantly in each season, so alterations in the atmospheric environment change the inlet boundary of the combustion chamber, and then affect the emission characteristics. In order to simplify the analysis, the typical atmospheric environment of the unit was taken in different seasons to form three typical working conditions in different seasons, as shown in Table 7. In the calculation, the atmospheric pressure was considered to experience little change, so the atmospheric pressure was fixed.
The calculation method in the above section was adopted to calculate the emission characteristics by changing the inlet boundary. Based on the typical operating time, combined with statistical data of startup times, calculations were conducted for the total annual startup emissions. Table 8 shows the emission characteristics of the startup phase in different seasons and throughout the year.
In the three seasons, due to the impact of temperature and relative humidity, the highest NOx emissions in a single day occurred in autumn. The annual emission level of a single combustion chamber is 714.92 kg, so the annual accumulated NOx emissions of the F-class unit (with 18 combustion chambers) in the startup stage is 12.87 tons.
As the gas turbine unit is responsible for time-varying tasks such as peak regulation, steam regulation and heating, it is frequently engaged. According to the simulation results, the emission of pollutants in the startup stage is considerable. Although the NOx emission in the startup stage is not constrained by environmental regulations, it is of great significance to master its emission characteristics to assist in combustion optimization and adjustment in the startup stage. It is shown in Table 7 that in the sub-pilot premix mode, the NOx concentration at the combustor outlet reached the highest level of 136 ppm in summer, which is far greater than the environmental requirements. In addition, the content of NO2 was also high, and yellow smoke can be seen in the chimney in actual operation. In the past, manufacturers did not strictly control the emission concentration during the startup. However, now, for example, China’s environmental protection law stipulates that the weighted average of NOx emissions should be measured for five minutes on the hour of every hour, and exceeding a time limit of 3 h within every 24 h violates the law. This is a great challenge for the operation of existing gas turbine units. At present, in order to meet the regulations, power plants mainly adopt methods of shortening the startup time and adjusting the start time to control the sampling period. However, this method does not fundamentally solve the problem of high NOx emissions in the startup stage. In the future, it is still necessary to explore a more reasonable adjustment method to reduce the NOx emissions in the startup stage, in order to cope with the increasingly severe environmental challenges.

4.2. The Influence of Atmospheric Environment

From the analysis in the above section, it can be seen that in the startup stage, pollutant discharge is more significant than that in the normal working state. In fact, changes in the atmospheric environment also lead to changes in emission performance. Therefore, the effect of season should be considered in order to accurately analyze the annual emission characteristics in the startup stage.
It can be seen from Table 7 that from summer to winter, two changes in atmospheric temperature and water vapor content occurred. The average atmospheric temperature decreased, and the water vapor content decreased. Table 9 outlines five groups of simulation conditions to study the influence of temperature and water vapor content changes on startup emissions. As conditions 3–5 possessed different atmospheric temperatures, the same absolute humidity was used to exclude the influence of different water vapor contents.

4.2.1. Humidity Influence

The first three simulation conditions reflect the influence of atmospheric relative humidity on emissions. The simulation results at different running stages were grouped, as shown in Table 10. It can be seen that in the three stages of startup, the reduction in air humidity promoted combustion reactions and increased the average outlet temperature and NOx emission concentration. The influence trend is shown in Figure 12.
During the diffusion mode, all D5 nozzles are in the diffusion combustion mode, so the fuel mixing is not sufficient, and the outlet mole fraction of CO is generally in a relatively high state. Due to the existence of a local high temperature zone of diffusion flame, NOx emissions far exceed environmental protection indicators. In the sub-pilot and pilot premix modes, in order to smoothly switch the gas turbine startup stage, two rich premix nozzles PM1 and PM4 were added, respectively, in addition to the diffusion nozzle. As a result, the total amount of diffused fuel decreased, making the combustion more complete than in the pure diffusion mode. The concentration of CO emissions shows a downward trend. However, with the increased high temperature region, NOx emissions increased compared with pure diffusion combustion mode. In addition, these two modes take a long time in the startup stage, so combustion optimization adjustment can be carried out to reduce the emission in the startup stage. The influence of humidity on NOx and CO in these three modes is similar (Figure 12). With the decrease in the water vapor content, the overall temperature of the combustion chamber outlet increased, which led to an increase in thermal NOx, decrease in CO concentration and decrease in the combustion efficiency. The reduction in the moisture content indirectly improved the oxygen content of the intake and reduced the heat absorption effect of water vapor as an inert medium, thus improving the temperature of gas and resulting in an increase in NOx emissions and a decrease in CO.

4.2.2. The Temperature Influence

In Conditions 3, 4 and 5 in Table 9, the absolute humidity of the atmosphere was kept unchanged, and the atmospheric temperature was changed to simulate the influence of atmospheric temperature on emissions in the startup stage. The calculation results are shown in Table 11. It can be seen that in the three starting modes, air temperature had a similar influence on emissions and outlet temperature, as shown in Figure 13. The reduction in atmospheric temperature inhibited the combustion reaction, reduced outlet average temperature and NOx emission concentration, and increased CO emissions.
The decrease in the atmospheric temperature reduced the temperature of air entering the combustion chamber after passing through the compressor, resulting in a decrease in the combustion efficiency, and ultimately affected the high temperature zone of the combustion chamber and the concentration of emissions. Because the production amount of thermal NOx is closely related to the high temperature area in the combustion chamber, the average temperature at the exit of the combustion chamber can characterize the average temperature rise of the combustion chamber. In the startup process, under the condition of the same average atmospheric humidity, a rise in the local temperature can promote the improvement of combustion efficiency, resulting in an increased volume of the local high temperature zone, and improving the overall temperature of the combustion chamber. In this case, CO generation is inhibited, but it also causes an increase in NOx emissions.

5. Conclusions

Through the numerical simulation of the emission characteristics of a DLN2.0+ combustor in the startup stage of a class F unit, the annual emission characteristics of the unit in the startup stage were obtained. Based on the operation data of the power plant, the NOx emissions at this stage were analyzed. The results show that the pollutant emissions at this stage were considerable due to the frequent startup of the gas turbine unit, so combustion optimization and adjustment at the startup stage should be considered. Numerical simulations were performed to analyze the emission characteristics at various startup stages, and the main conclusions were as follows:
(1)
Due to the regulating role of the gas turbine unit, the frequent startup process accounts for 8.46% of the total operating time. The highest concentration of NOx at the combustor outlet can reach 136 ppm, which is far more than the normal operation stage of 15 ppm, according to the statistics, the daily startup procedure is up to 1–3 h. After the annual working condition estimation, the annual NOx emission of the unit in the startup stage is about 12.89 tons. In terms of the total amount and peak value of NOx emissions in the startup stage, NOx emissions in the startup stage of gas turbines is the direction of future gas turbine technology improvement in terms of total amount and peak value. It is the general trend of environmental protection to continuously reduce NOx and yellow smoke emissions in the start-up stage. However, in the process of improvement, the relationship between startup efficiency, combustion stability and pollutant discharge needs to be comprehensively considered and balanced, which is also difficult to some extent.
(2)
Among the three modes in the startup stage, the NOx emission concentration in the pure diffusion combustion stage is relatively low compared with the other two modes containing premix. This is due to the existence of the diffusion modes in the sub-pilot and the pilot, and the addition of a rich premixed combustion mode, which increases the overall high temperature region. Additionally, these two modes have a relatively long running time, so the optimization of ignition control in the startup stage can be considered from these two modes.
(3)
The emission law of the atmospheric environment in the startup stage is as follows: a reduction in air humidity and steam will lead to a rise in the combustion chamber temperature and NOx emissions, while CO decreases; furthermore, an increase in air temperature will lead to a rise in the combustion chamber temperature and NOx emissions, while CO emission will decrease. From the statistical results, the startup emission level in autumn was found to be more significant across the whole year.

Author Contributions

Data curation, Y.D. and J.H.; Investigation, Y.D. and A.L.; Validation, J.H. and X.W.; Writing—original draft, Y.D. and A.L.; Writing—review & editing, X.Z. and Y.L. All authors have read and agreed to the published version of the manuscript.

Funding

This research received no external funding.

Institutional Review Board Statement

Not applicable.

Informed Consent Statement

Not applicable.

Data Availability Statement

The data that support the findings of this study are available from the corresponding author upon reasonable request.

Conflicts of Interest

The authors declare no conflict of interest.

References

  1. Hong, F.; Chen, J.; Wang, R.; Long, D.; Yu, H.; Gao, M. Research status and progress of heavy gas tuebine combustion adjustment technology. Therm. Power Gener. 2021, 50, 1–8. (In Chinese) [Google Scholar]
  2. Cen, K. Combustion Theory and Pollution Control; China Machine Press: Beijing, China, 2004. (In Chinese) [Google Scholar]
  3. Wang, H. Large Eddy Simulation of Lean Fuel Premixed Swirl Combustion Instability; Dalian University of Technology: Dalian, China, 2014. (In Chinese) [Google Scholar]
  4. Meier, W.; Weigand, P.; Duan, X.R.; Giezendanner-Thoben, R. Detailed characterization of the dynamics of thermoacoustic pulsations in a lean premixed swirl flame. Combust. Flame 2007, 150, 2–26. [Google Scholar] [CrossRef]
  5. Boxx, I.; Arndt, C.M.; Carter, C.D.; Meier, W. High-speed laser diagnostics for the study of flame dynamics in a lean premixed gas turbine model combustor. Exp. Fluids 2010, 52, 555–567. [Google Scholar] [CrossRef] [Green Version]
  6. Liu, C.; Liu, F.; Yang, J.; Mu, Y.; Hu, C.; Xu, G.; Su, S. Improvement on ignition and lean blowout performances of a piloted lean-burn combustor. Proc. Inst. Mech. Eng. Part A J. Power Energy 2016, 230, 196–205. [Google Scholar] [CrossRef]
  7. Huang, S.; Jing, D.; Zhuang, J.; Fan, H. Combustion adjustment practice for heavy duty gas turbine DLN2.0+ system. Electr. Power 2018, 51, 96–100. (In Chinese) [Google Scholar]
  8. Wang, Y.; Hu, H.; Wang, X.; Liu, H.; Dong, L.; Luo, G.; Yao, H. Advanced Combustion; Zhejiang University Press: Hangzhou, China, 2001. (In Chinese) [Google Scholar]
  9. Chang, L. Study on the Formation and Release of Nitrogenous Compounds during Coal Pyrolysis and Gasification; Taiyuan University of Technology: Taiyuan, China, 2004. (In Chinese) [Google Scholar]
  10. Stanmore, B.R.; Visona, S.P. Prediction of NO emissions from a number of coal-fired power station boilers. Fuel Process. Technol. 2000, 64, 25–46. [Google Scholar] [CrossRef]
  11. Feng, C.; Qi, H.; Xie, G. Study onpremixing uniformity and emission of R0110combustor. J. Eng. Thermophys. 2010, 31, 1431–1434. (In Chinese) [Google Scholar]
  12. Liu, A.; Zhu, Y.; Chen, B.; Zeng, W.; Weng, Y.; Liu, K.; Wang, C. Numerical calculation of reaction dynamics for NOx emission performance of a heavy-duty gas turbine. J. Shanghai Jiaotong Univ. 2017, 51, 1383–1390. (In Chinese) [Google Scholar]
  13. Huang, M. Research on Soft Combustion Mechanism and Performance of Gas Turbine Combustor; Chinese Academy of Sciences: Beijing, China, 2014; pp. 1–6. (In Chinese) [Google Scholar]
  14. Xiao, J.; Li, X.; Wang, F.; Wang, W.; Hu, M. Numerical Study on The Influence of Atmospheric Temperature on combustion Stability and NO_x Emission of a Gas Turbine. Gas Turbine Technol. 2020, 33, 19–25. (In Chinese) [Google Scholar]
  15. Xiao, J.; Wang, W.; Hu, M.; Li, X.; Wang, F.; Xia, L. Influence of air moisture content on combustion performance of gas turbine. Therm. Power Gener. 2019, 48, 84–89. (In Chinese) [Google Scholar]
  16. Xiao, J.; Wang, F.; Gao, S.; Li, X.; Wang, W. Influence of inlet pressure on premixed combustion stability of gas turbine. Therm. Power Gener. 2018, 47, 86–91. (In Chinese) [Google Scholar]
  17. Moore, M.J. Nox emission control in gas turbines for combined cycle gas turbine plant. Proc. Inst. Mech. Eng. Part A J. Power Energy 1997, 211, 43–52. [Google Scholar] [CrossRef]
  18. Mandai, S. Methods of NOx reduction in MHI gas turbines. In Proceedings of the IMechE Seminar on Best Technology for NOx Emission Control, London, UK, 27 September 1995. [Google Scholar]
  19. Kang, S.; Kim, Y.; Lee, K.S. Numerical simulation of structure and no formation of turbulent lean-premixed flames in gas turbine conditions. J. Mech. Sci. Technol. 2009, 23, 3424–3435. [Google Scholar] [CrossRef]
  20. Zettervall, N.; Worth, N.A.; Mazur, M.; Dawson, J.R.; Fureby, C. Large eddy simulation of CH4-air and C2H4-air combustion in a model annular gas turbine combustor. Proc. Combust. Inst. 2019, 37, 5223–5231. [Google Scholar] [CrossRef]
  21. Oh, J.; Kim, M.; Yoon, Y. The tuning methodology of a GE 7FA + e DLN-2.6 gas turbine combustor. Appl. Therm. Eng. 2011, 36, 14–20. [Google Scholar] [CrossRef]
  22. Angello, L.C.; Castaldini, C. Combustion tuning guidelines: Understanding and mitigating dynamic instabilities in modern gas turbine combustors. In Proceedings of the ASME Turbo Expo: Power for Land, Sea, and Air, Vienna, Austria, 14–17 June 2004. [Google Scholar]
  23. Albrecht, P.; Bade, S.; Lacarelle, A.; Paschereit, C.O.; Gutmark, E. Instability Control by Premixed Pilot Flames. J. Eng. Gas Turbines Power 2010, 132, 041501. [Google Scholar] [CrossRef]
  24. Janus, B.; Dreizler, A.; Janicka, J. Experimental Study on Stabilization of Lifted Swirl Flames in a Model GT Combustor. Flow Turbul. Combust. 2005, 75, 293–315. [Google Scholar] [CrossRef]
  25. Yin, Z.; Nau, P.; Meier, W. Responses of combustor surface temperature to flame shape transitions in a turbulent bi-stable swirl flame. Exp. Therm. Fluid Sci. 2017, 82, 50–57. [Google Scholar] [CrossRef] [Green Version]
  26. Boxx, I.; Slabaugh, C.; Kutne, P.; Lucht, R.P.; Meier, W. 3 kHz PIV/OH-PLIF measurements in a gas turbine combustor at elevated pressure. Proc. Combust. Inst. 2014, 35, 3793–3802. [Google Scholar] [CrossRef] [Green Version]
  27. Cohen, M. Best practices in the operation and maintenance of GE combustion system. In Proceedings of the IAGT Symposium, Banff, AB, Canada, 17–19 October 2011. [Google Scholar]
  28. Lee, M.C.; Ahn, K.I.; Yoon, Y. Development of gas turbine combustion tuning technology using six sigma tools. In Proceedings of the ASME Turbo Expo: Power for Land, Sea, and Air, Copenhagen, Denmark, 11–15 June 2012. [Google Scholar]
  29. Chikishev, L.M.; Sharaborin, D.K.; Lobasov, A.S.; Dekterev, A.A.; Tolstoguzov, R.V.; Dulin, V.M.; Markovich, D.M. LES Simulation of a Model Gas-Turbine Lean Combustor: Impact of Coherent Flow Structures on the Temperature Field and Concentration of CO and NO. Energies 2022, 15, 4362. [Google Scholar] [CrossRef]
  30. Wang, Z. DLN2.0+ Control System for Dry Low NOx Combustion in Gas Turbine. Power Gener. Equip. 2006, 20, 326–330. [Google Scholar]
  31. Blauvens, J.; Smets, B.; Peters, J. 16th Symp. (Int’l.) on Combustion; The Combustion Institute: Pittsburgh, PA, USA, 1977. [Google Scholar]
  32. Flower, W.L.; Hanson, R.K.; Kruger, C.H. Kinetics of the reaction of nitric oxide with hydrogen. Symp. Combust. 1975, 15, 823–832. [Google Scholar] [CrossRef]
  33. Monat, J.P.; Hanson, R.K.; Kruger, C.H. Shock tube determination of the rate coefficient for the reaction N2+O→NO+N. Symp. Combust. 1979, 17, 543–552. [Google Scholar] [CrossRef]
Figure 1. Annual startup status of a Class F gas turbine unit. (a) Monthly launch times; (b) Length of monthly launch time; (c) Percentage of launch time in total elapsed time.
Energies 15 05444 g001
Figure 2. Unit startup time statistics.
Energies 15 05444 g002
Figure 3. Schematic diagram of DLN2.0+ single tube combustor. (a) Burner inlet view; (b) Side view of combustion chamber layout.
Energies 15 05444 g003
Figure 4. Single burner structure and medium flow diagram. (a) Burner construction; (b) Medium flow diagram.
Energies 15 05444 g004
Figure 5. Combination of burner diffusion (D) and premix (PM) mode.
Energies 15 05444 g005
Figure 6. Combustion modes switching during unit startup [30].
Energies 15 05444 g006
Figure 7. Mesh generation. (a) The burner inlet section; (b) The head of combustor.
Energies 15 05444 g007
Figure 8. Calculation results of temperature distribution of each mode in startup stage. (a) Diffusion; (b) Sub-pilot premix; (c) Pilot premix.
Energies 15 05444 g008
Figure 9. Calculation results of mean mixture fraction distribution of each mode in startup stage. (a) Diffusion; (b) Sub-pilot premix; (c) Pilot premix.
Energies 15 05444 g009
Figure 10. Calculation results of CO concentration distribution in each mode at startup stage. (a) Diffusion; (b) Sub-pilot premix; (c) Pilot premix.
Energies 15 05444 g010
Figure 11. Calculation results of NOx distribution in each mode during startup stage. (a) Diffusion; (b) Sub-pilot premix; (c) Pilot premix.
Energies 15 05444 g011
Figure 12. Influence of air humidity on startup emission. (a) Diffusion; (b) Sub-pilot premix; (c) Pilot premix.
Energies 15 05444 g012
Figure 13. Effects of atmospheric temperature variations on startup emissions. (a) Diffusion; (b) Sub-pilot premix; (c) Pilot premix.
Energies 15 05444 g013
Table 1. Operation mode of combustion chamber startup process.
Operating ModeNozzle in Service
DiffusionD5
Sub-pilot premixD5 + PM1
Pilot premixD5 + PM1 + PM4
PremixPM1 + PM4
Table 2. Value of reaction coefficients.
Reaction Coefficient-
kf,11.8 × 108e−38,370/T
kf,21.8 × 104e−4680/T
kf,37.1 × 107e−450/T
kr,13.8 × 107e−425/T
kr,23.81 × 103e−20,820/T
kr,31.7 × 108e−24,560/T
Table 3. Comparison of multi-combustion emission data with simulation results.
Total Natural Gas Mass Flow Rate/(kg·s−1)Emission of NOx from Combustion Outlet
Measured Value/ppmCalculate Value/ppmRelative Error Value/%
5.589697.38+1.42
12.671110.4−5.5
Table 4. Fuel allocation ratio at each stage of power-up process.
Operating ModeTotal Natural Gas Mass Flow Rate/(kg·s−1)D5 Flow Proportion/%PM1 Flow Proportion/%PM4 Flow Proportion/%
Diffusion0.25110000
Sub-pilot premix0.29368320
Pilot premix0.31602218
Premix0.703015.584.5
Table 5. Combustor inlet boundary conditions.
Operating ModeAtmospheric Temperature/KAtmospheric Relative Humidity/%Natural Gas Temperature/KCompressor Outlet Temperature/KCompressor Pressure Ratio
Diffusion28850290.8539.58.98
Sub-pilot premix28850374.4585.99.59
Pilot premix28850395.3596.29.85
Premix28850457624.514.62
Table 6. Numerical simulation results of each operating mode under original conditions.
Operating ModeAverage Temperature of Combustion Outlet/KAverage NOx Concentration at Combustion Outlet/ppmAverage CO Concentration at Combustion Outlet/ppm
Diffusion1181.0382.36275.72
Sub-pilot premix1233.63101.58170.51
Pilot premix1258.8197.3890.78
Table 7. Typical atmospheric conditions in different seasons.
SeasonAtmospheric Temperature/KAtmospheric Relative Humidity/%Molar Content of Water Vapor/%
Summer303803.35
Autumn293701.62
Winter278650.56
Table 8. Annual startup phase emission characteristics.
SeasonOperating ModeStartup Duration/minEmission of NOx from Combustion Outlet/ppmDaily NOx Emission/kgTotal NOx Emission/kg
SummerDiffusion12.3166.780.8029.43
Sub-pilot premix7.39136.131.2245.23
Pilot premix29.55116.874.13152.84
AutumnDiffusion14.4365.290.9126.44
Sub-pilot premix8.66116.051.2235.43
Pilot premix34.64113.214.69136.03
WinterDiffusion11.7161.470.7035.52
Sub-pilot premix7.026134.711.1759.55
Pilot premix28.11113.403.81194.45
Annual----714.92
Table 9. Comparison of temperature and water vapor content changes.
ConditionAtmospheric Temperature/KAtmospheric Relative Humidity/%Atmospheric Absolute Humidity/(g·m−3)
13038024.25
23035015.16
3303206.05
4293356.05
5283646.05
Table 10. Simulation results of humidity variation.
Operating ModeConditionAverage Outlet Temperature/K Average NOx Concentration at Outlet/ppmAverage CO Concentration at Outlet/ppm
Diffusion11181.7080.31288.42
21182.8683.49275.35
31185.1388.62268.76
Sub-pilot premix11224.1598.32198.88
21226.01101.24184.48
31227.28107.19153.19
Pilot premix11245.5894.05162.84
21247.5398.01108.36
31249.88102.8772.87
Table 11. Simulation results of temperature variation.
Operating ModeConditionAverage Outlet Temperature/K Average NOx Concentration at Outlet/ppmAverage CO Concentration at Outlet/ppm
Diffusion31185.1388.62268.76
41173.9785.11293.68
51167.7882.42309.81
Sub-pilot premix31227.28107.19153.19
41216.7997.02187.02
51200.4393.41218.94
Pilot premix31249.88102.8772.87
41243.5694.76127.20
51236.3488.35168.23
Publisher’s Note: MDPI stays neutral with regard to jurisdictional claims in published maps and institutional affiliations.

