1. Introduction
Owing to the implications of fossil fuels on climate change, various energy sources have been developed. Hydrogen is considered an important energy store that can maximize the advantages of renewable and sustainable energies [
1]. Renewable energy sources such as solar and wind energies are unstable and intermittent during generation owing to climate variations. Thus, these valuable electric energies are not easily applied continuously and stably. To resolve this issue, the employment of large-scale energy storage systems combined with renewable energy may significantly improve the utilization rate and stability of renewable energy [
2,
3].
Hydrogen possesses various important characteristics. For example, it has a high energy density and energy conversion, is part of the water cycle (production and consumption), and does not emit pollutants during combustion [
4,
5]. Globally, several countries are promoting policies for developing and popularizing hydrogen energy in an attempt to minimize the impact of climate change. These policies include the European Commission’s hydrogen strategy for a climate-neutral Europe [
6], United States’ Hydrogen Posture Plan [
7], and South Korea’s master plan for implementing a hydrogen economy [
8].
Carbon dioxide (CO
2) is emitted by various economic sectors. However, heat generation in the building and industrial sectors accounts for one-third of the energy-related CO
2 emissions globally [
9]. Therefore, the conversion of heat-generation systems that use fossil fuels into systems that use low-carbon fuels for realizing carbon neutrality is crucial.
A fuel cell is an electrochemical cell that directly converts chemical energy into electricity through a redox reaction between a fuel and an oxidizing agent. Methanol, natural gas, hydrogen, etc. are often used as fuel in this cell. However, this process is not a completely carbon-neutral technology because carbon is emitted during the production or use of these fuels. However, a fuel cell using hydrogen obtained through water electrolysis using renewable energy is a completely carbon-neutral technology. Moreover, it is suitable as an alternative heat production system that generates heat and electricity.
Fuel cells used as heat-generation systems exhibit high heat and electricity generating efficiency, flexible scaling, and rapid deployment. The heat-generating efficiencies of fuel cells are within the rage of 30–55%, and their total power generating efficiencies combined with electricity generation approach a maximum of 95% [
9]. A fuel cell can be used depending on the scale of the system. For example, polymer electrolyte membrane fuel cell and solid oxide fuel cell can be used for small-scale power generation, whereas phosphoric acid fuel cell and molten carbonate fuel cell can be used for large-scale power generation [
10]. Further, fuel cells can be manufactured in module forms to easily adjust the power generation scale; thus, their energy conversion efficiency does not depend on the scale. Several studies have focused on fuel cells as distributed power sources [
11]. Another major feature of fuel cell is that existing stationary combined heat and power (CHP) systems that use natural gas can be converted to hydrogen fuel systems [
10]. The CHP market doubled in size annually until 2014 in Europe, Japan, Korea, and other countries. Moreover, its increase is expected to be steady in the future [
9]. These features suggest that heating systems that use hydrogen fuel cells can rapidly spread to large-scale industrial sectors and homes.
The safety of hydrogen fuel cells in homes needs to be studied to expand their use because, unlike in large-scale industrial facilities, household fuel cells cannot be constantly managed by experts. Further, the causes of concerns in homes other than the technical problems in fuel cells include gas leaks that can result in explosions. Therefore, ventilation is one of the main factors in improving safety.
Thus far, ventilation efficiency has been extensively studied. Li et al. [
12] studied leaks in the fuel cell rooms of ships using a numerical model. However, they focused on the hydrogen concentration that escaped the fuel cell room or spread to the control cabin or passenger cabins rather than the immediate danger within the fuel cell room. Salva et al. [
13] used a numerical model for analyzing the distribution of leaked hydrogen within a vehicle. However, this technique was different from that within a fuel cell room in several ways because the setting was a vehicle interior and included other parameters, such as obstacles, ventilation methods, and location. Houf et al. [
14] studied the hydrogen leaks in tunnels using numerical modeling and experiments. However, the spatial scale of their study differs from the present study by a factor of more than 30. Choi et al. [
15] analyzed hydrogen leaks from vehicles in underground parking garages. Their finding revealed extremely different spatial scales. Xie et al. [
16] used numerical modeling to determine the efficiency by which a ventilation fan ventilates hydrogen leaking from a vehicle in an 8 m × 6 m × 3 m space. The spatiotemporal scale was like that of the present study. However, the ventilation method was different. Cerchiara et al. [
17] studied ventilation conditions in terms of a mild leak in which the hydrogen concentration did not exceed 2 vol% in a fuel cell room with a ventilation opening and a ventilation fan. Papanikolaou et al. [
18] evaluated the efficiency of ventilation in rooms based on computational fluid dynamic simulations.
Thus, the safety check of multiple ventilation conditions, including those involving shutoff valves, ventilation fans, and ventilation openings under severe leaks with a hydrogen concentration of 50 vol% or more in air is crucial. Unlike previous studies, this study performed experiments and analyses on higher volumes of hydrogen leakage from household fuel cell rooms and reduced hydrogen concentrations through a variety of methods such as ventilation openings, ventilation fans, and automatic supply shutoff devices.
2. Experiments
The experimental equipment was constructed based on an assumed scenario wherein a hydrogen supply pipe of a fuel cell was leaking. The experimental equipment was fabricated by referring to the standards reported in the reference literature listed in
Table 1. The size of the room was 1800 mm × 2200 mm × 2900 mm. The hydrogen supply pipe was installed on the floor, and the leak hole was installed at the center of the room facing the top. The pipe was connected to some control facilities outside, these facilities included a shutoff valve in an electronic flow supply apparatus connected directly to control the hydrogen supply. Three natural ventilation openings wherein air circulated in and out (net area = 0.12 m
2) were installed on each wall within 300 mm of the ceiling. A single explosion-proof ventilation fan having a maximum air volume of 13,000 L/min (780 m
3/h) was installed within 300 mm of the ceiling. Compared with the size of the room, this volume was 3.28 m
3/min/m
2 and satisfied the NFPA 853 standard for mechanical ventilation devices. Further, a vent with a net area of 0.15 m
2 was installed within 300 mm of the floor on the bottom wall where the ventilation fan was installed.
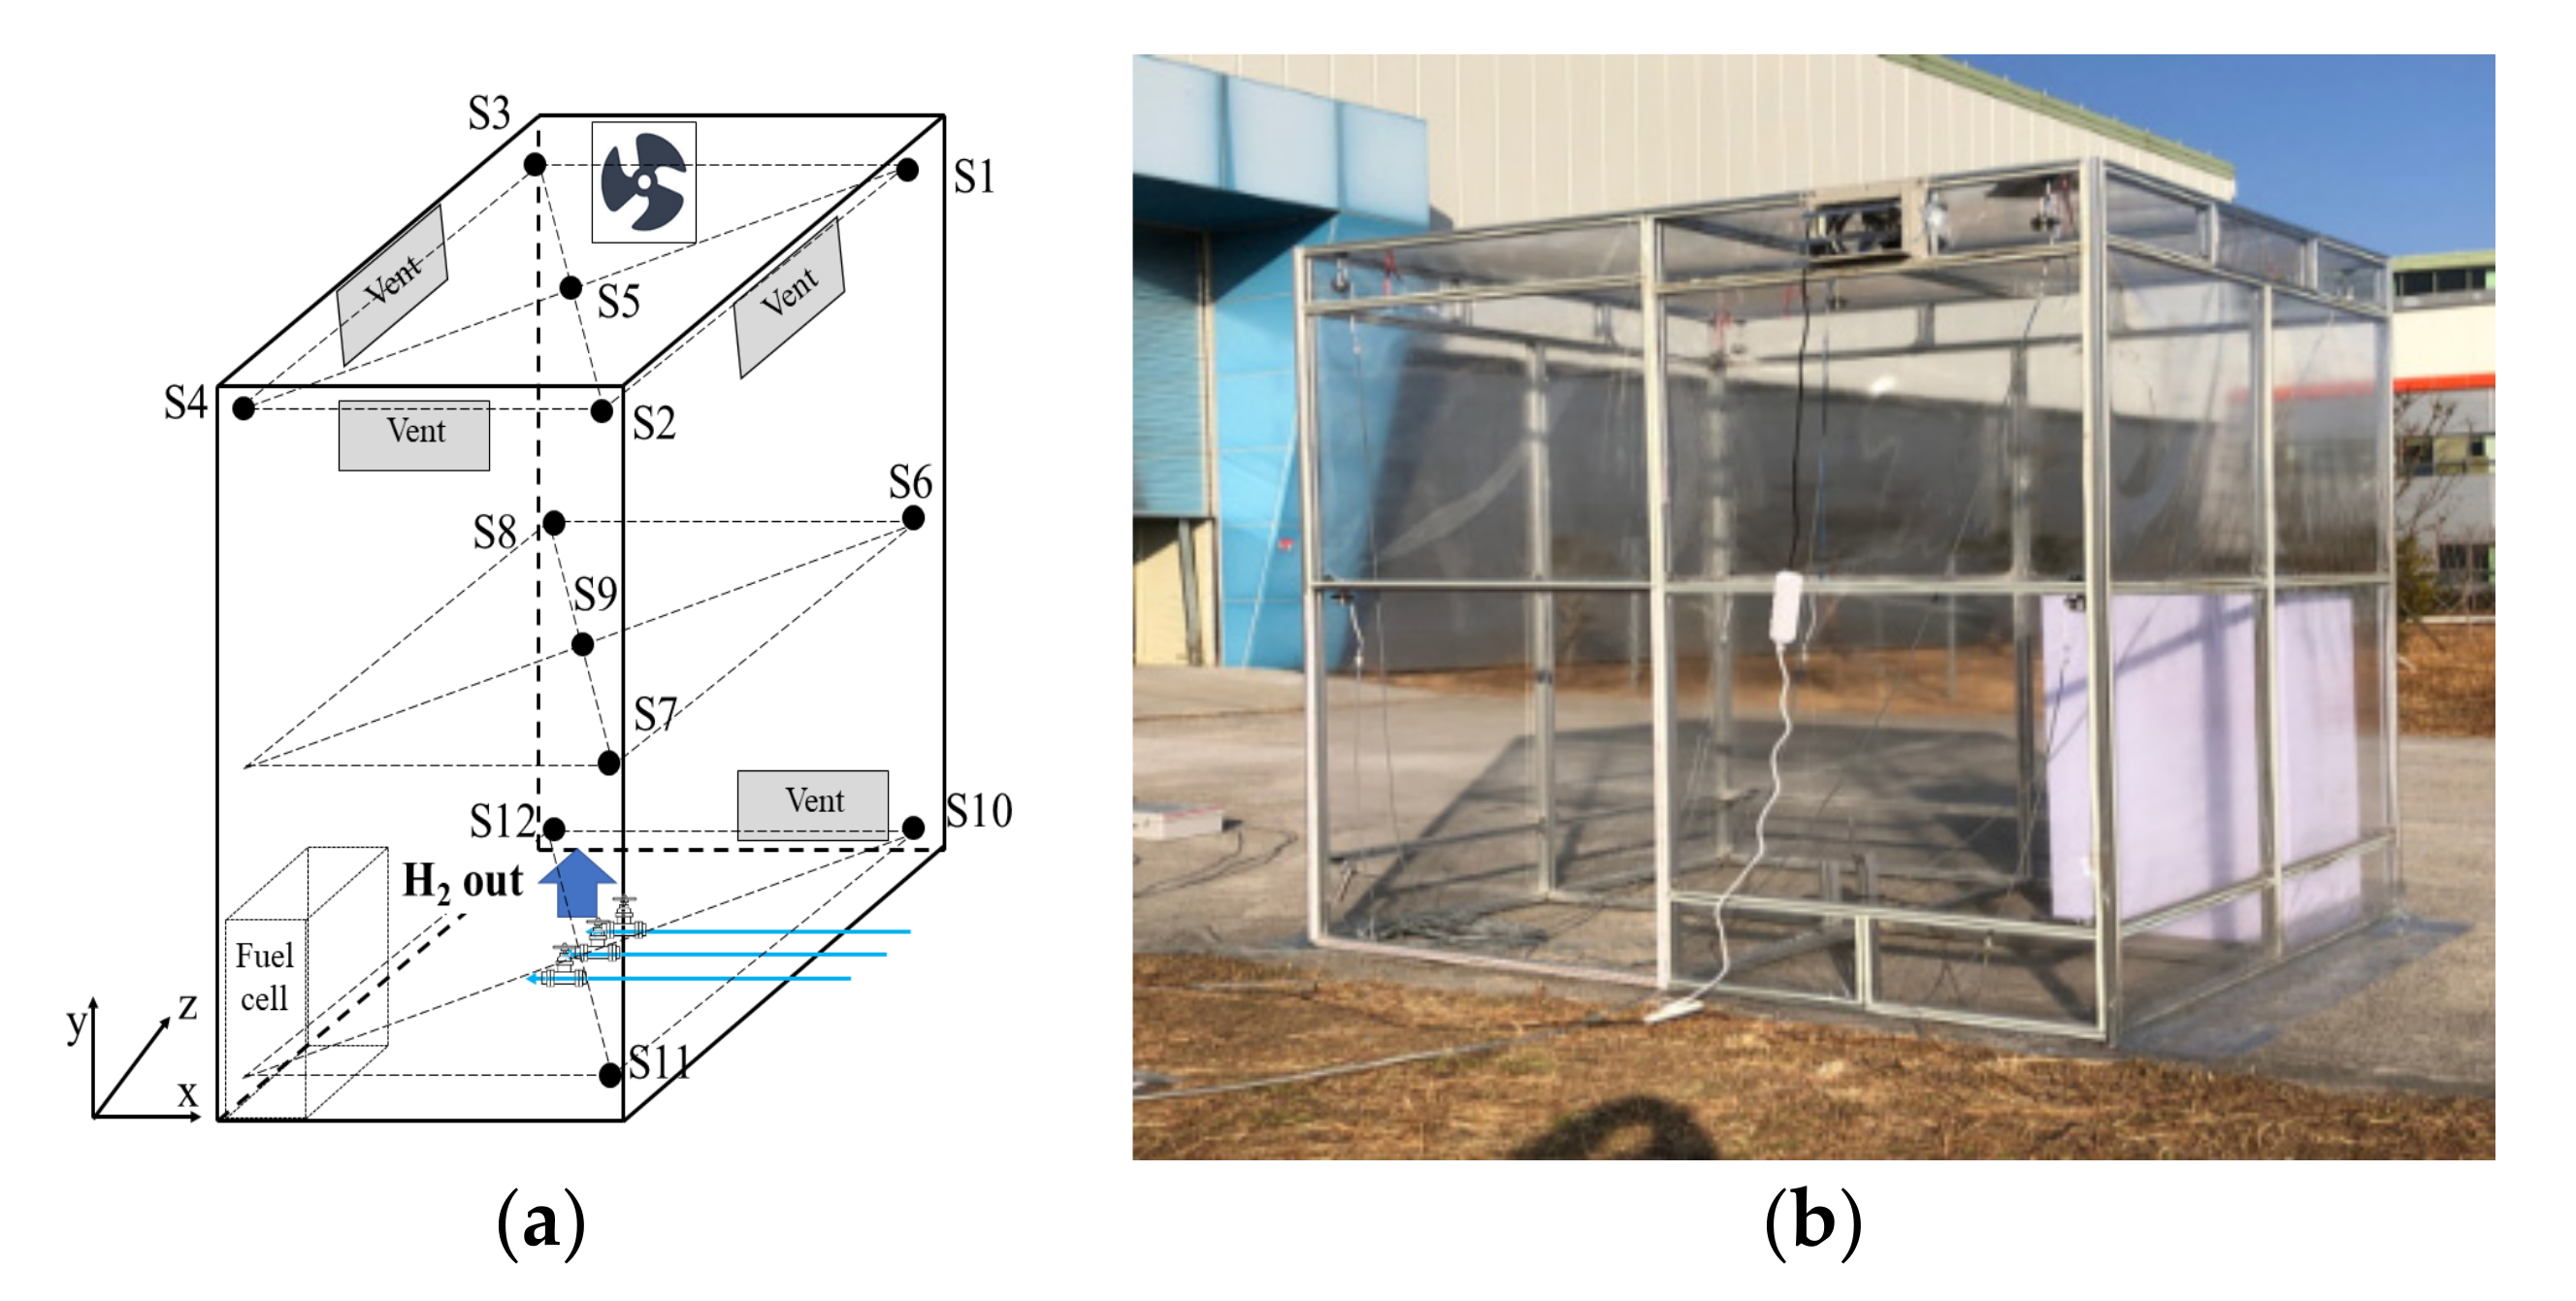
The installed fuel cell room is shown in
Figure 1. The room was sealed to prevent the air outside from affecting the hydrogen leak diffusion experiments. The outer wall was covered with vinyl to prevent shrapnel risk during the explosion tests. A polycarbonate box similar only in terms of shape was used as the fuel cell. A 3/8-inch hydrogen supply pipe was installed, and 1/8-, 1/4-, and 3/8-inch nozzles were installed in the leak area to simulate the leak holes. The hydrogen gas used had a purity level equal to or exceeding 99.999%, and the hydrogen gas supply was steadily controlled by an electronic flow supply apparatus. Hydrogen detection sensors were installed at 12 points on the top (S1–S5), middle (S6–S9), and bottom (S10–S12) of the room. Their specific coordinates are summarized in
Table 2. The sensors were VQ35MB, models, which operated on the principle of thermal conductivity. They were made of stainless steel and could detect concentrations within the range of 0–100 vol%. Their explosion-proof ratings were Ⅱ 2G Ex db ⅡC T5 Gb.
The variables in the experiment included the leak type, supply pressure, leak hole size, opening/closing of the ventilation openings, and ventilation fan operating rate. All experimental conditions defined by the variables are listed in
Table 3. In South Korea, the gas supplied from the district governor to individual buildings is a liquefied natural gas with a pressure 30 kpa, whereas that for final users has a pressure 3 kpa. The hydrogen leak experiments were performed by controlling the inflow of gas using a monitoring and control system connected to the outside of the hydrogen room. The measurement data of the hydrogen concentration were automatically recorded each second by the monitoring system connected to the sensors. The shutoff valve was connected to sensor S5 and the external control system operated according to the concentration of S5.
3. Results
To investigate the effect of the ventilation fan rate, experiments wherein the ventilation fan was not operated were compared with those wherein it was operated. The comparable experiments included Cases 1–25, excluding Cases 2, 7, 12, 17, and 22. These cases were excluded as the ventilation opening was only for a total of 20 cases.
Figure 2 shows Case 1, where the ventilation fan is not operated. Hydrogen continuously leaked at 750 L/min from a 3/8-inch nozzle at a supply pressure of 3 kPa. The concentrations at the top and middle continuously increased and then remained constant after 5 min. At the bottom, no noticeable increase in the concentration, which increased along a low slope after 5 min, was observed. At 12 min, the concentration reached the maximum value of 4 vol%. Sensor S9 was at the horizontal and vertical center with the same x and y coordinates as that of the leak hole and a z coordinate of 1570 mm above the leak hole. Further, S9 did not detect any concentration until approximately 2 min. Then, after 4 min, the concentration increased to 54 vol%, which was the highest concentration among the 12 sensors.
Figure 3 shows Case 5. Herein, the ventilation fan is operated at full speed. The hydrogen supply pressure, leak hole size, and leakage volume are the same as in Case 1. However, the hydrogen concentration does not exceed 27 vol% at the top and middle because of the operation of the ventilation fan. Further, the hydrogen concentration at the bottom increases along a low slope and reaches a high concentration of 9 vol% compared with that for Case 1. The flammability limit of hydrogen in air is within the range of 4–75 vol% [
23]. However, the concentration is maintained below 1 vol% for safety [
24]. According to this information, we consider that Case 5 is not sufficiently ventilated.
After the leakage volume decreases to 40 L/min, the maximum hydrogen concentration decreases to 8 vol%, including when the ventilation fan operates at 1/3 speed, as shown in
Figure 4. Based on the measurement sensors, some differences are observed. For instance, the concentration measurements are higher in the middle than at the top because the top is ventilated, whereas the middle is in the path taken by hydrogen. In certain parts, the concentration reaches 4 vol%. However, it does not decrease to the recommended concentration of 1 vol%. The concentration decreases to 1 vol% when the ventilation fan is operated at full speed, and the leakage volume is 40 L/min, as shown in
Figure 5.
The parameter α represents the ratio of the hydrogen leakage volume to the ventilation volume of the fan. It is given by
the parameter β represents the rate of reduction in the maximum hydrogen concentration at sensor S5 when the fan is not operated versus when it is. It is expressed as
Here, α and β are set as aforementioned to analyze the hydrogen leakage volumes, ventilation fan rate, and ventilation efficiency.
Figure 6 shows the correlation between α and β. The R
2 value, which indicates correlation, is 0.7895; this indicates a negative correlation. As the ventilation volume exceeds the hydrogen leakage volume, the rate of reduction in the maximum hydrogen concentration increases. The performance of the ventilation fan must be at least 20 times greater than the leakage volume to reduce the hydrogen concentration by 50%.
These results are similar to those observed in previous studies. For example, Xie et al. [
16] used a ventilation fan to ventilate hydrogen leaking from a vehicle in a 8 m × 6 m × 3 m space. In their study, the hydrogen concentration was less than 4 vol% within 5 s when the hydrogen leak was 2000 L/min and a ventilation fan with a performance of 740,000 L/min was used. This result was achieved by using a ventilation fan with a performance volume that was 370 times larger than the leakage volume. Cerchiara et al. [
17] used a ventilation fan and ventilation openings in a hydrogen room. They reported that when a ventilation fan with a high flow of at least 200 times the hydrogen leakage volume is used, the hydrogen concentration remains at 2.5 vol% or less.
To investigate the effect of the leak hole size and the ventilation fan, the typical cases where the ventilation fan was not operated (Cases 1, 6, and 11) were compared to those where it was operated (Cases 5, 10, and 15) under a supply pressure of 3 kPa and a closed ventilation opening. Data comparison was performed on sensor S5.
Figure 7 shows that the maximum concentration of hydrogen decreases as the size of the leak hole decrease. The concentration decreased by 50% or more when a ventilation fan was used. As the size of the leak hole decreases, the reduction effect became more significant. The maximum hydrogen concentration was 0.85% when the leak hole was 1/8 inch. Therefore, hydrogen’s lower limit for explosiveness, which is 4%, was not exceeded. The hydrogen leakage volume was 40 L/min (i.e., 0.3% of the ventilation volume).
Figure 8 shows the change in the hydrogen concentration when the ventilation openings are opened without using the ventilation fan. The maximum concentration is 34 vol% at S5. This value is lower than that for Case 1 (
Figure 2), wherein ventilation is excluded, but higher than that for Case 5 (
Figure 3), wherein the fan is operated. The maximum hydrogen concentration at the bottom is 11 vol%, which is higher than those of Cases 1 and 5. Thus, in a totally sealed space, hydrogen becomes concentrated at the top because of the difference in density. However, in the presence of a ventilation opening, it easily diffuses because of the effect of convection current along with the ventilation.
To investigate the effect of the ventilation openings and the leak hole sizes, experiments in which ventilation openings were closed were compared with those in which they were open when the fan was not operated. In Cases 1, 6, and 11, the ventilation openings were closed, and in Cases 2, 7, and 12, they were open.
Figure 7 shows that the maximum concentration of hydrogen decreases as the size of the leak hole decreases. The ventilation openings played a significant role in reducing the hydrogen concentration. The decrease was only 40% when the size of the leak hole was 3/8 inches. However, when the size was 1/4 or 1/8 inches, a decrease of 50% or more was observed. However, the ventilation performance of the ventilation openings was lower than that of the ventilation fan. Further, as the leak hole increased, the leakage volume increased, and the difference in the performance between the ventilation fan and ventilation openings became more significant.
This study assumed a scenario wherein a shutoff valve was engaged when a hydrogen leak occurred in a fuel cell room. The shutoff valve was engaged when the hydrogen concentration reached 1 vol% at sensor S5 located in the top middle of the fuel cell room.
Figure 9 shows the experimental results for Case 26. The hydrogen concentration at S5, which had increased to 1.3%, declined to less than 1 vol% immediately as the hydrogen leak was shut off at 0.15 min (9 s). In Cases 26, 27 (
Figure 10), and 29 (
Figure 11), the concentration decreased within 0.1 min, and in Case 28 (
Figure 12), it decreased within 1 min.
The hydrogen concentration at S9, which was at the vertical center of the fuel cell room, increased to a maximum of 17%. The difference in the concentration between the top and bottom was reversed as compared with those in cases where the room was sealed, where only the ventilation fan was operated and only the ventilation holes were open. Sensor S9 was located at the horizontal and vertical centers, which were directly above the leak hole and in the path that the hydrogen gas travelled through. The hydrogen concentration was measured before the leaked hydrogen diffuses. However, another issue was that the concentration measurements of S1–S4 located at the top corners of the fuel cell room were higher than those of S5. Thus, the hydrogen gas was expelled from the upper-middle by the leak pressure and became concentrated in the periphery. The hydrogen concentration at the bottom was within the range of 2–4 vol%, which was lower than those observed in the other experiment cases.
The time required for the hydrogen concentration at S5 to drop to 1 vol% or less after the leak was stopped varied between 0.6 and 0.8 min when the ventilation fan and ventilation openings were used. By comparison, the effect of the shutoff valve was extremely rapid. Further, the shutoff valve had an advantage in that the maximum value of the hydrogen concentration was not extremely high.
The control of the hydrogen concentrations during the leaks in the fuel cell rooms is classified into the upper, middle, and lower parts. It is categorized as follows:
In the upper part, hydrogen concentrations can directly be controlled through ventilation fans, ventilation openings, and shutoff valves.
In the lower part, the hydrogen concentration is low and Further tends to decrease with a decrease in the concentration in the upper part.
The hydrogen concentration in the middle part varies depending on the method used for dealing with leaks.
The hydrogen concentrations of the upper and middle parts were similar when a ventilation fan and ventilation openings were used. Moreover, the concentration in the middle part decreased as the concentration in the upper part decreased. However, the concentration in the middle part increased by a factor of 15 (15 vol%) at maximum when a shutoff valve was used (
Figure 9), and in Case 28, the hydrogen concentration was continuously maintained in the middle part even after the hydrogen supply was shut off (
Figure 11). This hydrogen concentration distribution was also found in other studies. According to the computational fluid dynamic modeling by Hajji et al. [
25], when hydrogen continuously leaked from the center of the floor in the space of a cuboid, the hydrogen concentration at the upper middle height of the leak hole was higher than that of the ceiling. On the ceiling, hydrogen diffused widely and the concentration was low. Thus, a ventilation device or ventilation opening was required to reduce the hydrogen concentration in the middle part of fuel cell rooms.
Therefore, the most effective approach for reducing the concentration of leaked hydrogen in fuel cell rooms is using a shutoff valve. However, the use of a ventilation device or ventilation opening is considered a safe method to reduce the overall concentration in the room.
The experiment conducted in this study satisfies the existing gas room ventilation facility design guidelines, but it was observed that the hydrogen concentration inside the space rises to the flammability limit according to the leakage amount and changes in the ventilation system. In order to design safe hydrogen fuel cell rooms for home use, the design guidelines for ventilation facilities need to be higher, and the design guidelines should be economical in consideration of various ventilation methods, size of space, and expected leakage.


