Article

Geochemical Characteristics and the Sedimentary Environment of Lower Cambrian Argillaceous Rocks on the Kongquehe Slope, Tarim Basin, China

1
State Key Laboratory of Oil and Gas Reservoir Geology and Exploitation, Chengdu University of Technology, Chengdu 610059, China
2
Exploration and Development Research Institute, SINOPEC Northwest China Company, Urumchi 830011, China
3
Institute of Sedimentary Geology, Chengdu University of Technology, Chengdu 610059, China
4
College of Earth Science, Chengdu University of Technology, Chengdu 610059, China
*
Author to whom correspondence should be addressed.
Energies 2022, 15(15), 5400; https://doi.org/10.3390/en15155400
Submission received: 16 June 2022 / Revised: 1 July 2022 / Accepted: 22 July 2022 / Published: 26 July 2022
(This article belongs to the Section H1: Petroleum Engineering)

Abstract

:
The deposition of the Lower Cambrian argillaceous rocks on the Kongquehe slope provides a good opportunity to reconstruct the paleoenvironmental conditions of the Tarim Basin. To explore the paleoredox conditions, paleoclimate, and provenance of this deposit, 21 samples were collected from Well A, and the concentrations of major and trace elements were analyzed. The V/(V + Ni), V/Cr, Ni/Co, U/Th, Uau, and V/Sc ratios indicated that the sediments in the water body from the Lower Cambrian were in a reducing environment, and the degree of reduction weakened from the bottom to the top. The Sr/Cu, Mg/Ca, and Fe/Mn ratios in the sediments revealed that the Lower Cambrian was mainly characterized by a warm and humid paleoclimate, and there may be a paleoclimatic transition toward drought conditions as recorded by the sediments of Xidashan Formation. The chemical alteration index, compositional variation index, plagioclase alteration index values, and Th/U and K/Rb ratios of the Lower Cambrian mudstone all reflected that the parent rock in the study area was mainly subject to low- to medium-degree chemical weathering. Longitudinally, the Lower Cambrian gradually increased and then weakened from Xishanbulake Formation to Xidashan Formation. The ratios of trace elements and rare earth elements as well as Th–Sc–Zr/10, Th–Co–Zr/10, and ∑REE–La/Yb diagrams all showed that the mudstones of Xishanbulake and Xidashan Formations of the Lower Cambrian in the study area have a common parent rock type, mainly sedimentary rocks rich in felsic minerals. Additionally, the structural setting discrimination diagrams of SiO2–K2O/Na2O, Th–Sc–Zr/10, Th–Co–Zr/10, and La–Th–Sc showed that the structural setting of the Lower Cambrian mudstone deposition is mainly a continental island arc environment and has the characteristics of an active continental margin.

1. Introduction

The concentrations of elements in fine-grained sediments have been widely used to reconstruct the depositional environment and track the tectonic evolution over geological times. The geochemical compositions of sedimentary rocks are regulated by multiple factors, such as source rock composition, weathering, transportation from the continent to the ocean, sedimentation, and diagenesis. Compared with other clastic rocks, fine-grained sedimentary rocks, such as mudstone and shale, are considered to better preserve the original geological information of the source area and their geochemical characteristics are closer to their parent rock [1,2,3]. Great progress has been achieved in using fine-grained sediments in different regions to explore the sedimentary environment, source area properties, and tectonic background [4,5,6,7,8,9].
Tarim Basin, as a polycyclic superimposed marine and land basin, is the largest oil and gas basin in the west of China [10,11]. During the Ediacaran–Cambrian transition, a series of major tectonic, biological, and environmental evolution events, such as sea-level rise and hypoxia events, occurred in the shallow sea shelf areas. Consequently, a set of organic-rich black mudstones were widely deposited in the lower part of the Lower Cambrian in different areas, such as in Canada, Siberia, and South China [12]. Such organic-rich deposits also developed in northern Tarim and have been confirmed as one of the main source rocks for oil and gas exploration in this area [11].
Herein, we analyzed the major, trace, and rare earth elements (REE) on the mudstone from the Lower Cambrian Xishanbulake and Xidashan Formations in the Kongquehe slope, northeast Tarim Basin. We also discussed the characteristics of the paleosedimentary environment, provenance attributes, and the tectonic background of the Lower Cambrian to provide basic data for further research. In addition, The Cambrian source rocks in Tarim Basin have great potential. These geological understandings will also provide an important basis for further oil and gas exploration in the lower Cambrian.

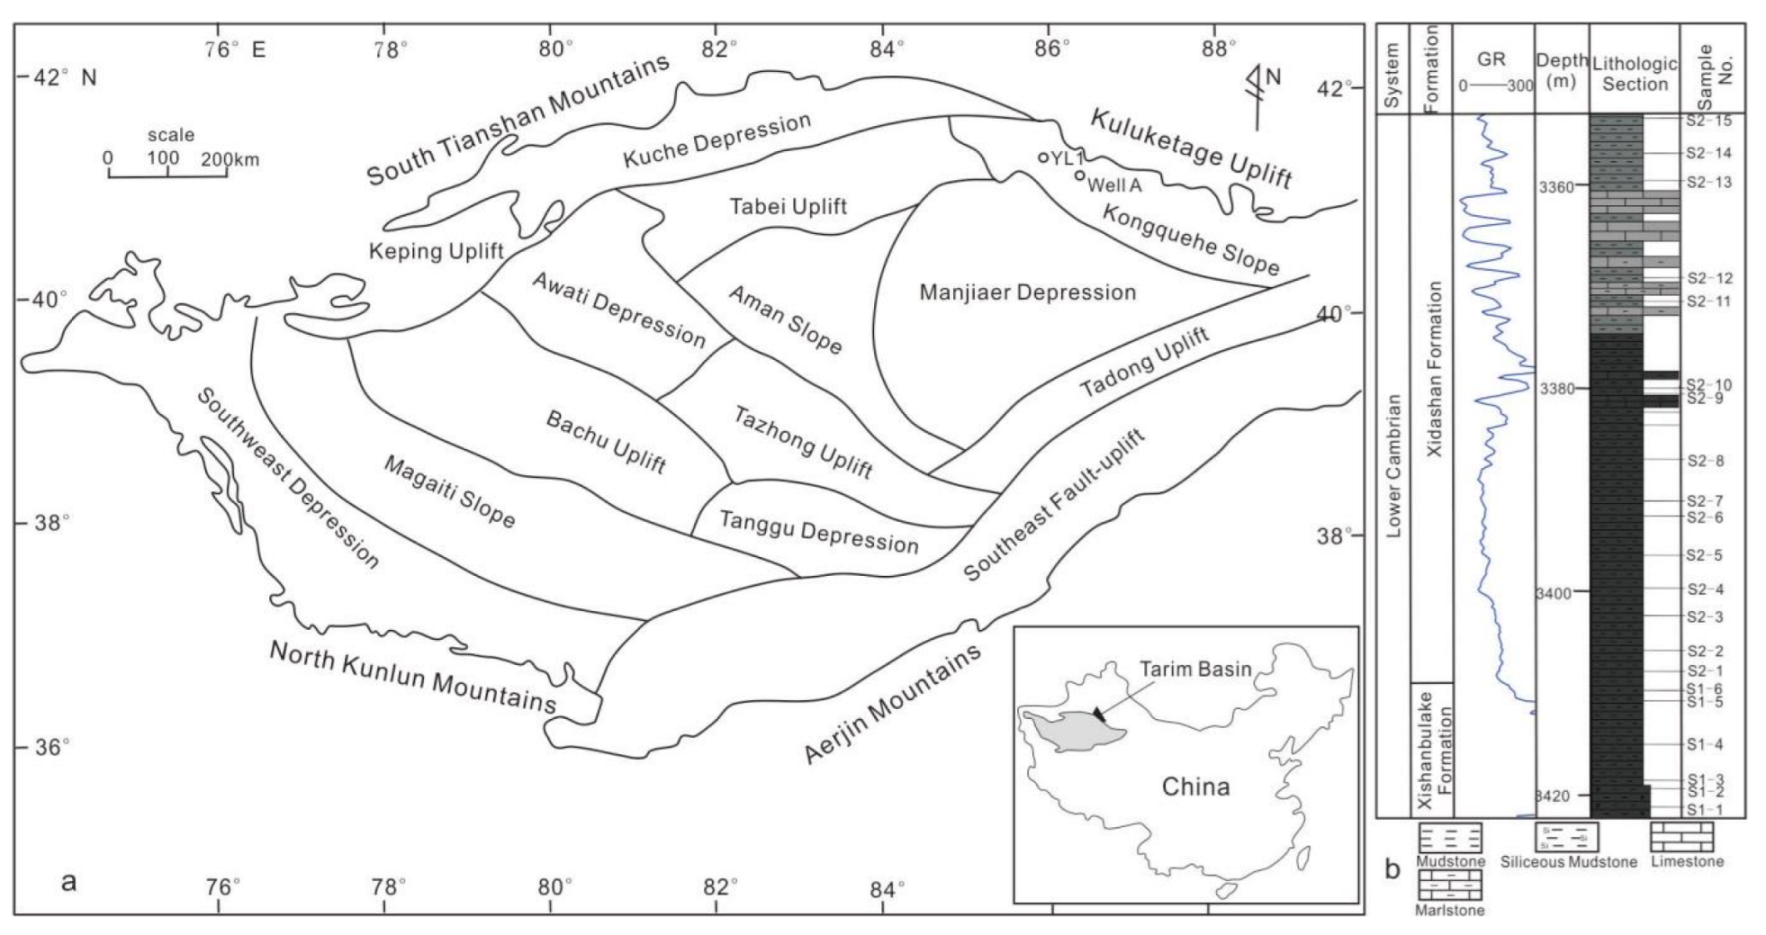
2. Geological Settings

Tarim Basin is located in southern Xinjiang, China, and covers an area of 5.6 × 10⁵ km2 [13]. The basin is surrounded by Tianshan, Kunlun, Arkin, and Kuruktag Mountains (Figure 1). Tarim Craton comprises the Neoarchaean to Neoproterozoic metamorphic basement and overlies the Ediacaran to Cenozoic marine sediments [10]. Tarim Basin has experienced multistage tectonic events and can be subdivided into multiple tectonic units (Figure 1a).
In the Early Cambrian, carbonate platform sediments developed in the Western Tarim block, and the eastern Tarim block was occupied by basin facies deep-water sediments. The study area is located on the Kongquehe slope in the northeastern Tarim Basin. It experienced a large-scale transgression in the Early Cambrian. Consequently, a set of organic-rich black rock series that can serve as high-quality source rock was deposited in Xishanbulake and Xidashan Formations.
According to the correlation based on paleontological, stratigraphic, and carbon isotope data, in recent years [14,15], Xishanbulake and Yuertus Formations in the western part of the basin are isochronous and the sedimentation periods of Xishanbulake Formation are equivalent to those in Shoerbrak and Wusonger Formations. To date, two drill cores of the Lower Cambrian mudstones, namely, Well YL1 and Well A, have been deployed and obtained in the northeast of the basin. Well A has yielded massive core data from the Lower Cambrian Xishanbulake and Xidashan Formations, providing the important basis for this study. Based on core observation and thin section analysis, The wells reveal that Xishanbulake Formation comprises mainly black mudstone, with siliceous mudstone developing at its bottom (Figure 1b). The Xidashan Formation is also mainly black mudstone; however, thin marl and micrite limestone are developed in its middle and upper parts.

3. Samples and Methods

All the study samples were collected from a fresh core in northeast Tarim Basin, covering the Lower Cambrian Xidashan and Xishanbulake Formations. Xishanbulake Formation is mainly gray-black mudstone intercalated with black-gray calcareous mudstone and black siliceous mudstone. The bottom is in parallel unconformable contact with Sinian breccia dolomite. In this study, after well core observations, we collected 21 experimental mudstone samples, of which 15 were from the Xidashan Formation and 6 were from the Xishanbulake Formation. Figure 1 shows the location of these samples.
Chemical treatment and analyses of the samples were completed in the Analysis and Test Research Center of Beijing, Geological Research Institute of Nuclear Industry. Before testing, all samples were crushed to 200 mesh, after which the sample powders were calcined in a high-temperature (1150–1250 °C) furnace to remove the organic matter. Major elements of the composition were measured by the X-ray fluorescence spectrometer (AB-104L, PW2404). the procedure is as follows. In total 0.5 g of powdered sample with anhydrous Li2B4O7 were mixed in Ni-pots and diluted the mixture with suitable oxidant and NH4Br liquid of concentration of 120 mg/mL. Afterward, the Ni-pots were placed on the sampling machine named CLAISSIE and heated to 1150–1250 °C to form a glass and then cooled to room temperature, according to the display of the program. Based on the matrix correction method, X-ray data were converted into concentrations by a computer program. For major element analysis, X-ray fluorescence spectrometry was used following the method of the national standard GB/T14506.28–2010, and the analysis error was less than 1%.
Trace element concentrations, including REE, were obtained by inductively coupled plasma mass spectrometry (ICP-MS). Put the sample in a closed vessel and added the solution with a one-to-one ratio mixture of HF-HNO3 to the beaker to mix it evenly. The vessel was heated in an oven for 24 h at 185 ± 5 °C. After cooling down, the sample was heated on an electric heating plate and evaporated until nearly dry. Then, nitric acid was added to steam the sample, and this step was repeated. Nitric acid was added and sealed again, placed in an oven, and heated for 3 h at 130 °C. The test accuracy was better than 5%.

4. Results

4.1. Major Elements

Table 1 lists the major elements in both formations. In the Xidashan Formation, the SiO2 contents are in the range of 26.8–85.91% (average 68.35%); in Xishanbulake Formation, they vary from 4.43% to 89.58% (average 68.90%). The CaO content of the Xidashan Formation is 0.26–29.34% (average 4.89%), and that of Xishanbulake Formation is 0.58–31.86% (average 6.65%). The average MgO content of the Lower Cambrian is 2.18%, which is similar to the 2.19% of PAAS. The MgO content in Xidashan Formation is 0.32–8.13% (average 1.93%) and that in Xishanbulake Formation is 0.14–15.56% (average 2.94%). The content of each component in the other samples is very low.

4.2. Trace Elements

Table 2 lists the trace elements in the samples. Relative to the upper continental crust (UCC), there is significant enrichment of V, Ni, Cu, Zn, Mo, Sb, Ba, Ti, and U and similar trends are observed in the strata except for Ba and Tl. The contents of trace elements are higher in Xishanbulake Formation than in Xidashan Formation.

4.3. REE

Table 3 lists the REE in the Lower Cambrian mudstones in the study area. The total amount of REE is 12.86–104.09 μg/g (average 56.38 μg/g) (Table 3), which is much lower than the total amount of REE in North American shale (173.21 μg/g). There is little difference in ∑REE between Xishanbulake and Xidashan Formations. After standardization of the North American shale, it has a similar distribution model (Figure 2), reflecting that the Lower Cambrian mudstone has a similar provenance. The ratios of light and heavy REEs (∑LREE/∑HREE) are in the range of 4.27–10.84 (average 7.33), which is close to the 7.5 ratio of North American shale, reflecting the characteristics of light rare earth enrichment and heavy rare earth loss. REE after North American shale standardization are δCe 0.57–0.89 (average 0.78), indicating that there is a certain degree of negative anomaly; δEu is 0.92–1.71 (average 1.27).
Figure 2. (a) UCC-normalized trace element spider diagrams; (b) NASC-normalized REE distribution pattern of Xishanbulake Formation mudstone; (c) NASC-normalized REE distribution pattern of Xidashan Formation mudstone, Kongquehe area.
Energies 15 05400 g002
Table 1. Major element concentrations (in %) for Lower Camnrian mudstones in the study area.
SampleXishanbulake Formation (n = 6)Xidashan Formation (n = 15)
S1-1S1-2S1-3S1-4S1-5S1-6S2-1S2-2S2-3S2-4S2-5S2-6S2-7S2-8S2-9S2-10S2-1S2-12S2-13S2-14S2-5
SiO289.5894.354.4377.5567.0980.4131.7082.0272.7287.6982.2563.5982.8179.5878.9673.3783.3853.2285.9163.6772.62
Al2O31.030.760.812.903.883.452.215.205.973.567.039.575.827.156.387.945.085.702.374.555.05
Fe2O31.221.100.382.852.621.6336.271.923.391.561.885.772.072.683.353.802.192.541.743.092.66
MgO0.250.1415.560.410.670.620.320.630.580.410.630.870.600.680.570.690.574.970.504.522.32
CaO1.790.5831.860.833.801.030.580.640.260.460.380.400.400.410.380.440.5811.692.137.023.99
Na2O0.150.150.200.300.350.130.110.150.180.110.160.230.140.150.150.170.210.290.150.400.35
K2O0.210.150.110.680.990.930.631.411.640.941.602.781.561.961.912.471.381.550.541.181.32
MnO0.040.020.290.030.040.020.030.010.030.020.020.020.010.020.010.010.010.030.020.020.01
Ti O20.040.030.030.160.230.200.140.300.500.190.350.820.290.410.340.460.230.350.090.220.27
P2O50.040.030.730.180.150.180.030.080.050.050.060.060.050.050.050.070.040.090.020.040.05
FeO1.010.910.321.321.451.182.581.171.381.110.821.471.291.161.021.040.500.830.760.850.62
LOI///////////15.385.676.307.529.996.0518.425.9614.7210.79
CaO*1.670.4929.410.253.300.420.470.390.100.300.170.200.250.230.210.210.4611.402.056.883.82
CIA33.6949.022.6470.2845.5469.9464.6572.7475.6972.6378.5174.8474.9075.3473.7573.6471.2630.0946.3934.9747.93
PIA31.1148.782.3080.3244.1982.0373.0987.5593.9986.6394.3693.9591.6193.1892.5293.6284.6926.1945.4131.6347.24
ICV3.482.7557.121.612.111.1517.180.921.080.990.681.120.850.861.030.980.993.712.143.582.13
CaO*:CaO content in silicate.
Table 2. Trace element concentrations (in μg/g) for Lower Cambrian mudstones in the study area.
SampleXishanbulake Formation (n = 6)Xidashan Formation (n = 15)UCC
S1-1S1-2S1-3S1-4S1-5S1-6S2-1S2-2S2-3S2-4S2-5S2-6S2-7S2-8S2-9S2-10S2-1S2-12S2-13S2-14S2-15
Li6.145.872.0718.4015.8010.104.369.6611.308.6911.3015.609.1411.7011.2018.909.8917.708.7912.2013.7020.00
Be0.430.351.743.901.181.030.541.211.460.841.502.301.491.801.461.921.071.590.591.101.233.00
V239.00399.00120.001708.00982.002419.00885.001819.001790.00851.001191.001013.00645.00332.00389.00216.00687.00180.00503.00559.00132.0060.00
Cr46.1032.6014.90107.0083.40111.0075.2091.40140.0053.1074.90113.0051.2062.8043.6054.9042.6048.6039.0043.7034.20355.00
Co2.331.761.317.837.054.833.985.6410.504.076.5818.306.739.756.8012.805.7310.703.619.7311.40
Ni37.2038.5022.30132.00176.00193.00221.00109.00172.0056.1060.70180.0071.7066.6096.6051.9086.8040.30102.0098.6040.2020.00
Cu21.9018.009.75260.0081.5039.40245.0047.2079.0029.8060.30126.0035.4059.6029.5061.6030.3038.4024.0044.5051.4025.00
Zn59.0046.7022.102070.00121.00242.00281.00579.00949.00175.00644.00283.00106.0084.90186.0050.50132.0045.20128.0060.8028.0071.00
Ga1.631.220.9218.805.955.703.808.7110.205.489.4714.909.1211.009.9011.607.348.773.446.647.2717.00
Rb7.435.113.5422.0034.9034.8023.4052.4063.5033.7057.90101.0056.3066.9060.8077.5046.0054.1019.1044.2045.60112.00
Sr71.0029.80800.0091.60145.0048.6034.0040.3028.8030.5033.4039.5032.8034.7032.0038.3033.10229.00106.00129.00127.00350.00
Y4.442.7323.3023.5030.6029.207.8714.6021.707.8011.5020.307.058.607.9812.805.4817.204.6411.409.7522.00
Mo21.6018.8015.10300.0095.7078.6034.3053.9077.8028.3028.10141.0043.1053.3046.2076.4038.5020.3027.0048.6032.101.50
Ba460.00444.001168.001888.001640.001705.001048.002622.002311.002309.003052.003217.003936.003645.004256.004231.003179.002420.001316.002115.002055.0050.00
Sb1.400.930.7534.207.573.5751.706.1112.905.209.579.062.221.981.432.801.632.250.782.141.020.20
Cs0.680.450.251.972.682.811.673.694.312.313.786.283.454.073.814.983.043.461.332.623.134.90
Tl0.340.300.173.152.262.8513.902.793.851.771.936.292.492.652.843.241.791.781.301.511.56
Pb10.205.408.5144.7018.9010.4066.1012.4020.6010.3016.6025.308.8516.909.8022.4012.9017.109.2333.6020.0020.00
Bi0.090.070.040.250.230.190.800.190.390.170.200.670.300.550.210.320.280.210.160.400.30
Th0.840.620.632.835.043.552.655.077.343.305.7113.405.537.925.767.984.456.812.015.574.7110.70
U16.1012.0033.20201.0053.0033.607.8017.0025.4014.5010.9029.707.6213.0014.4033.7011.5019.707.1714.0011.902.80
Sc1.000.411.072.654.113.471.994.866.523.205.429.344.936.825.157.854.227.651.637.403.9711.00
Nb1.310.850.834.545.593.832.675.9811.003.726.6817.606.027.905.759.254.187.911.664.405.1525.00
Zr7.267.335.0030.1078.9041.0026.9049.20101.0029.5056.40156.0049.5067.6049.6079.1037.1060.0016.2033.4038.10190.00
Hf0.200.170.110.691.671.090.741.422.750.861.614.301.361.871.402.191.031.770.430.951.13
Table 3. REE elements (in μg/g) concentrations for Lower Cambrian mudstones in the study area.
SampleXishanbulake Formation (n = 6)Xidashan Formation (n = 15)NASC
S1-1S1-2S1-3S1-4S1-5S1-6S2-1S2-2S2-3S2-4S2-5S2-6S2-7S2-8S2-9S2-10S2-1S2-12S2-13S2-14S2-15
La3.552.5311.7028.8019.6014.406.0615.2012.909.5112.6012.4012.5013.5011.5015.908.6921.404.7312.8012.3032.00
Ce5.564.5611.4030.1036.3025.7013.5026.1021.6015.7021.9021.2021.5024.1019.5029.5015.2039.608.8125.2021.9073.00
Pr0.780.701.454.085.264.062.143.462.831.992.882.692.633.032.583.932.024.621.082.992.327.90
Nd3.322.905.8714.0024.1018.009.0113.4010.807.9110.7010.109.7110.909.7715.107.3517.304.1311.808.2733.00
Sm0.640.550.941.863.943.921.382.542.191.661.952.111.461.651.743.031.203.350.782.281.625.70
Eu0.150.150.440.530.820.870.330.650.570.470.560.650.500.520.570.760.400.650.260.480.461.24
Gd0.600.501.282.013.443.581.162.232.131.461.752.051.271.451.572.461.022.880.731.951.525.20
Tb0.100.080.230.350.580.670.190.390.480.250.320.460.200.260.260.440.170.520.130.350.270.85
Dy0.530.361.422.203.403.611.002.092.921.271.723.021.011.481.382.380.992.820.772.041.585.80
Ho0.120.070.350.530.740.760.210.450.670.250.370.670.220.300.280.450.200.580.150.410.331.04
Er0.320.211.051.672.362.090.631.322.010.721.052.050.670.880.801.340.601.670.461.220.913.40
Tm0.050.030.170.300.420.350.110.230.380.120.190.390.130.170.140.240.110.300.080.220.160.50
Yb0.340.201.041.722.742.010.701.452.400.771.192.520.831.140.921.480.692.000.491.431.043.10
Lu0.050.030.160.250.390.290.100.190.330.100.170.360.120.170.130.210.100.300.080.210.160.48
∑REE16.1012.8637.4988.39104.0980.3036.5169.6962.2142.1857.3360.6652.7659.5551.1377.2138.7497.9822.6963.3752.82173.21
∑LREE14.0011.3931.8079.3790.0266.9532.4261.3550.8937.2450.5949.1548.3053.7045.6668.2234.8686.9219.7955.5546.87152.84
∑HREE2.101.475.699.0314.0713.364.088.3511.324.946.7411.514.455.865.478.993.8811.062.907.825.9620.37
L/H6.657.745.588.796.405.017.947.354.507.547.504.2710.849.178.347.598.987.866.827.107.877.50
(La/Yb)N1.021.221.091.620.690.690.841.020.521.201.030.481.461.151.211.041.221.040.940.871.15
δEu1.091.221.711.190.981.011.161.191.161.311.331.371.621.461.501.221.580.921.491.001.28
δCe0.730.740.570.580.780.730.800.780.780.780.790.800.810.820.780.810.790.870.850.890.88
Ceanom0.710.760.520.560.760.730.850.790.780.770.810.810.820.840.790.840.820.870.860.890.88

5. Discussion

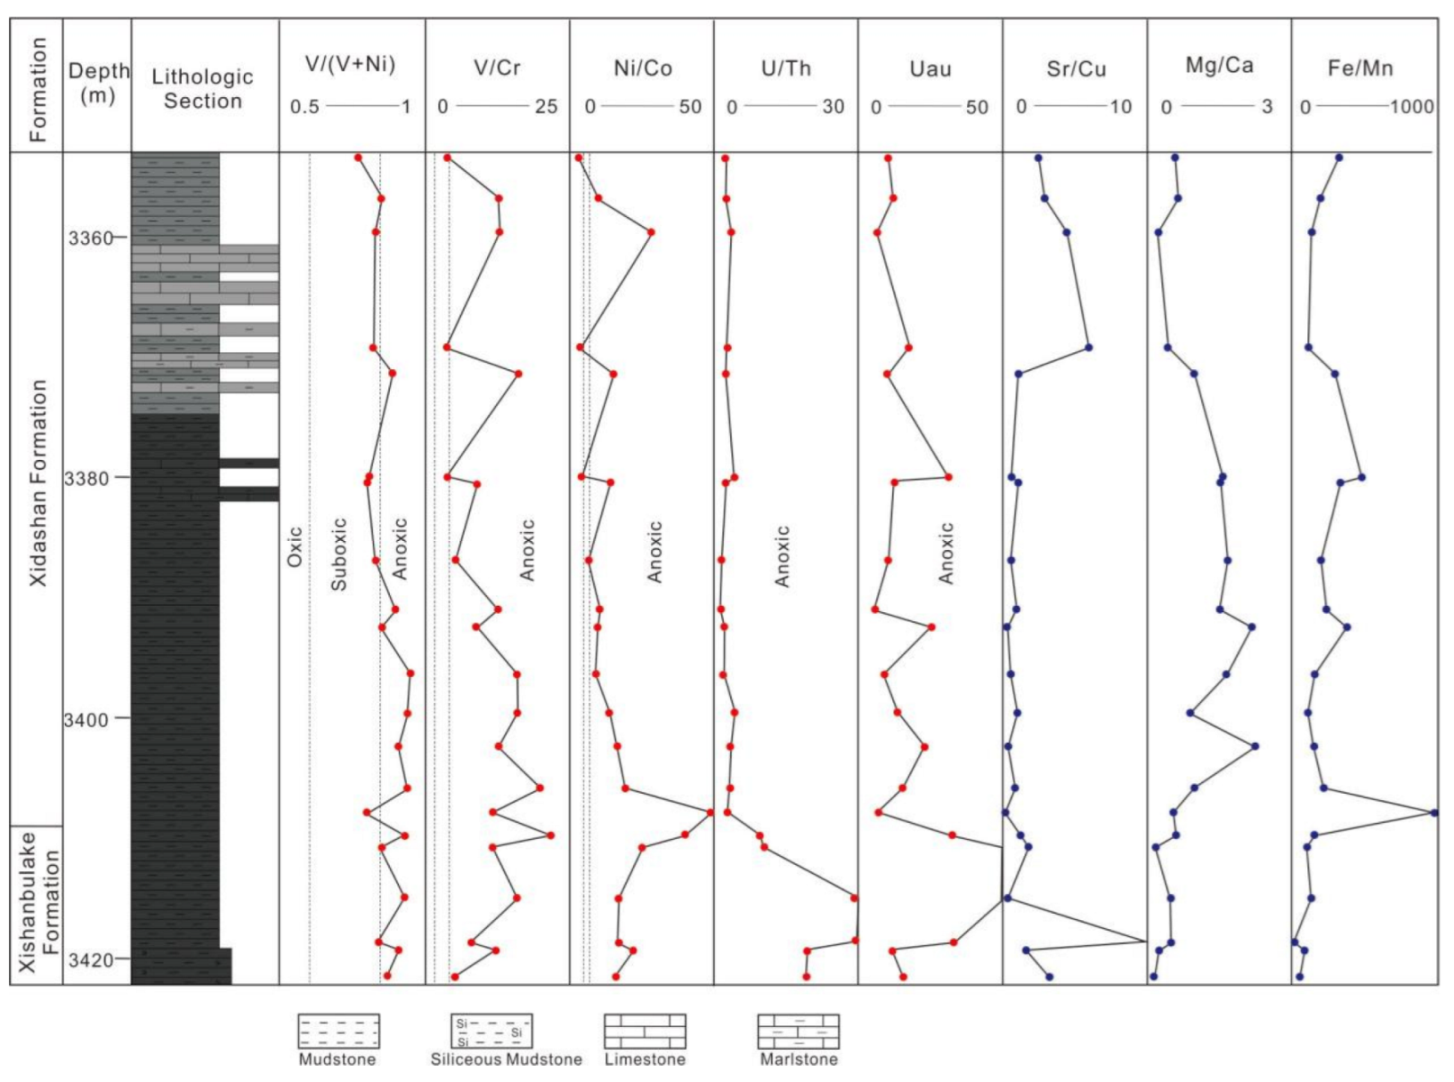
5.1. Paleoredox Conditions

The content and ratio of redox-sensitive trace elements in fine-grained sediments can reflect the redox conditions in the water column during their deposition. In particular, the degree of enrichment of elements such as V, Ni, U, Co, and Th is related to the water column redox conditions. These elements easily migrate and become enriched in anoxic water and sediments; therefore, they are often used as proxies of paleoredox environments in sedimentary rocks [16,17].
Redox-sensitive elements V and Ni are reliable indicators to distinguish the redox environment of water. In an anoxic environment with relatively closed water circulation, V precipitates in the form of +4 valent hydroxide or oxide and is preferentially enriched in sediments [18]. The V/(V + Ni) ratio is usually used to reflect the paleoredox state. Generally, a V/(V + Ni) ratio greater than 0.84 means a euxinic environment, a V/(V + Ni) ratio between 0.60 and 0.84 represents an anoxic environment, and a V/(V + Ni) ratio between 0.40 and 0.60 means an oxygen-poor environment with weak water stratification [6]. The mudstone V/(V + Ni) value in Xidashan Formation in the study area is 0.77–0.95 (average 0.86). The mudstone V/(V + Ni) value in Xishanbulake Formation is 0.84–0.93 (average 0.89). This shows that water stratification was strong during the deposition of Lower Cambrian mudstone and is an anoxic environment. Vertically, the V/(V + Ni) values change under different sedimentary backgrounds, reflecting the evolution of the sedimentary environment. In Figure 3, from Xishanbulake Formation to Xidashan Formation, a decreasing V/(V + Ni) is observed, indicating that the reducibility of the sedimentary environment changes from strong to weak.
The V/Cr and Ni/Co ratios can be used as proxies to reflect the redox environment of water [6]. Generally, a V/Cr ratio less than 2 and Ni/Co ratio less than 5 indicate an oxidizing environment. A V/Cr ratio of 2–4.25 and Ni/Co ratio of 5–7 indicate an anaerobic environment with weak water stratification. V/Cr and Ni/Co ratios are higher than 4.25 and 7, respectively, indicating an anoxic environment [16,19]. In this study, the mudstone samples have V/Cr of 3.70–21.795 (average 11.45) and Ni/Co of 3.53–55.53 (average 17.01), indicating that the water bodies of Xishanbulake and Xidashan Formations were anoxic during the sedimentation period.
The U/Th ratio can also be used for determining redox conditions. Generally, Th is relatively stable and exists in the +4 valent form in sediments. U has two valence states, namely, U4+ and U6+. In an oxygen-rich environment, U4+ is oxidized to U6+ and dissolved in water, resulting in the loss of U in sediments. In a reducing or oxygen-poor environment, U6+ is reduced to insoluble U4+; therefore, U is enriched in the sediments [20,21]. A U/Th value less than 1.25 indicates an oxidizing environment, and a U/Th value greater than 1.25 indicates a reduction environment [16,22]. In Figure 3, all samples indicate that the Early Cambrian was a reducing environment, and the U/Th value showed a downward trend from the bottom to the top.
Figure 3. Variations in paleoredox and paleoclimate discrimination indices of the Lower Cambrian mudstone in the Kongquehe area.
Energies 15 05400 g003
Authigenic uranium content (Uau) is used as an indicator of paleoredox conditions [23]. It is calculated using
Uau = U − Th/3.
According to Wignall and Myers (1988) [23], when Uau is less than 5, the sediments in the water body are in an oxidizing environment; Uau greater than 5 indicates a reducing environment. The Uau values of all samples in this study were greater than 5, indicating that the Lower Cambrian mudstone in the study area was beneath a reducing environment during sedimentation. Moreover, Kimura and Watanabe [21] proposed the V/Sc ratio as a proxy index to distinguish the paleoredox conditions of sediments in water bodies. A V/Sc ratio less than 9 indicates oxidation conditions. The V/Sc ratios of all the samples are greater than 9, indicating that the sediments in the water body were in a reducing environment.
Comprehensive analysis of the above six parameters shows that, during the sedimentation period of the Lower Cambrian in the Kongquehe slope area, the ancient water body was in a reducing environment and the degree of reduction weakened from the bottom to the top (Figure 3)

5.2. Paleoweathering Conditions

Paleoclimate affects the contents of some elements in sediments, resulting in obvious differences in element enrichment under different climatic conditions. The Sr, Cu, Ga, Rb, and Fe ratios have been widely used to analyze the characteristics of paleoclimates. Generally, the Sr/Cu ratio is used to reconstruct the paleoclimate. A Sr/Cu ratio greater than 5 reflects a dry and hot climate, and 1.3 < Sr/Cu < 5 reflects warm and humid climate conditions [6,24,25]. The Sr/Cu ratio of the Lower Cambrian strata in the study area changes very little overall. Except for an abnormal value, most of the values are less than 5, indicating a relatively stable climate. Vertically, the Sr/Cu ratios in the upper part of the Xidashan Formation increase slightly (Figure 3), reflecting that the Early Cambrian had a warm and humid climate, and there may have been a relatively arid climate recorded in the late deposition of Xidashan Formation.
Mg/Ca and Fe/Mn ratios serve as proxies to reconstruct characteristics of paleoclimate change. Generally, high values of these ratios in sediments represent warm and humid climates, while low values represent dry and cold climates [26,27]. The Mg/Ca ratio of the Lower Cambrian strata in the study area is 0.14–2.24 (average 0.94). The Fe/Mn ratio ranges from 2.45–1253.22 (average 245.82), indicating that the sedimentation period of the Xishanbulake and Xidashan Formations was mainly characterized by a warm and humid climate. Comparing the vertical distribution curves of Sr/Cu, Mg/Ca, and Fe/Mn (Figure 3), high Sr/Cu values correspond to low Mg/Ca and Fe/Mn values, showing a mirroring effect. This comprehensively reflects that the sedimentation period of the Lower Cambrian was mainly characterized by a warm and humid paleoclimate, and there may have been a trend toward drought conditions in the late sedimentation period of the Xidashan Formation.

5.3. Provenance and Tectonic Settings

5.3.1. Paleoweathering Conditions
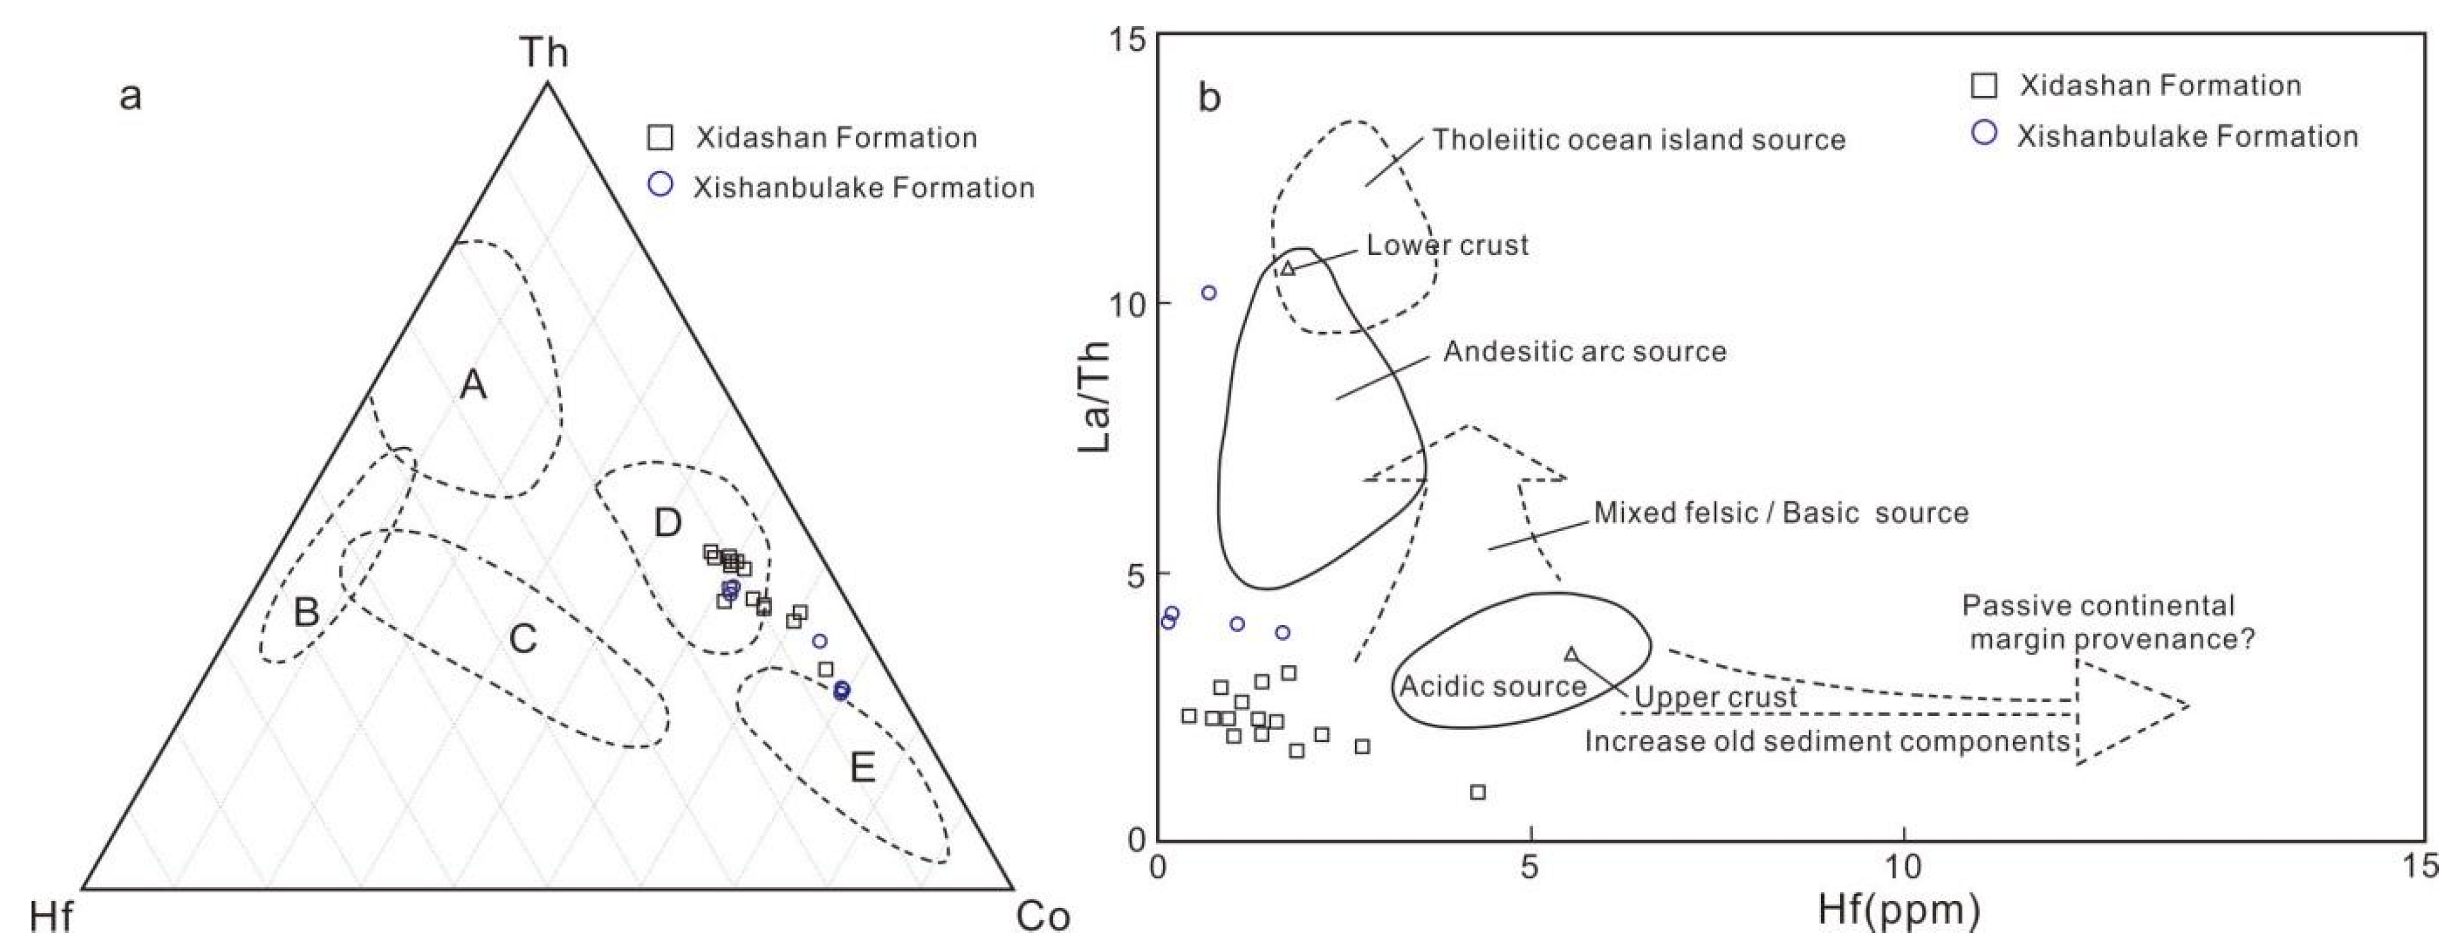
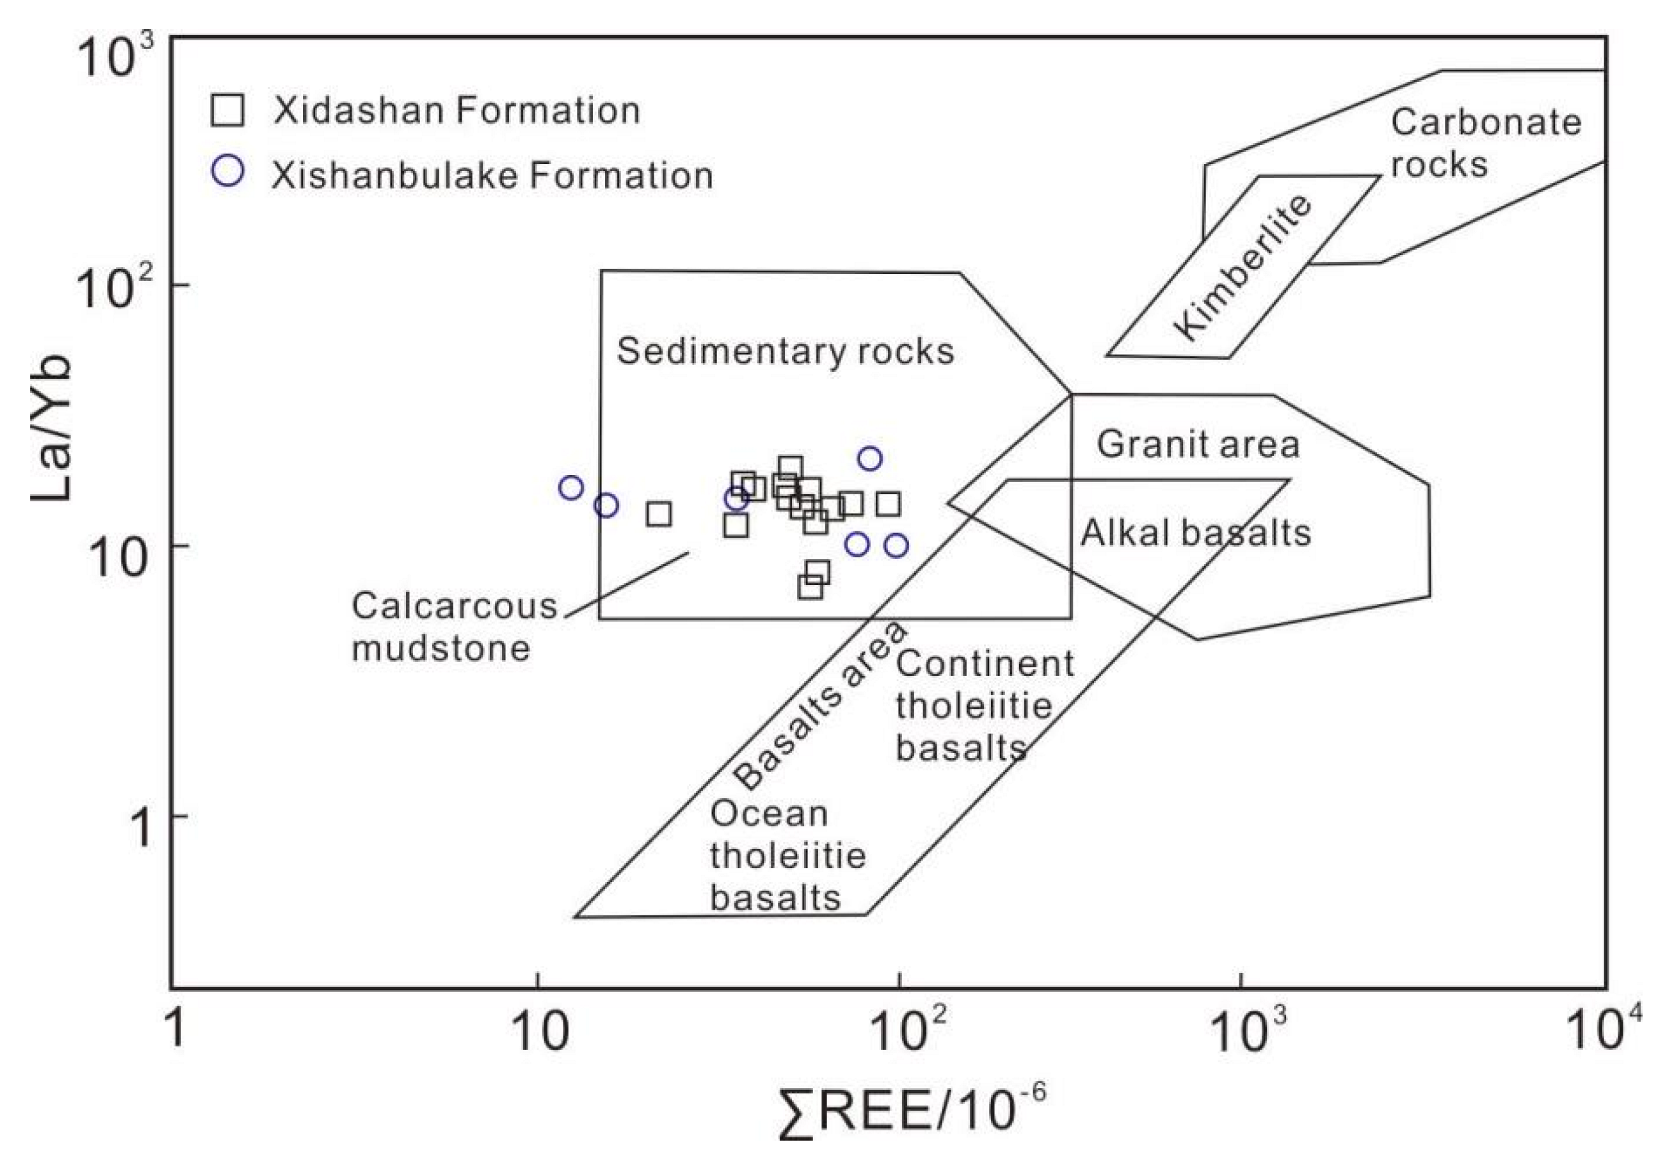
In physicochemical weathering, the stability of different elements is different. With the progress of chemical weathering, K, Ca, and Na will gradually decrease and the relative amount of Al will increase during the transformation of feldspar to clay minerals. Based on the analysis of this difference, a series of indices to evaluate the degree of chemical weathering have been proposed, such as the chemical alteration index (CIA), compositional variation index (ICV), and plagioclase alteration index (PIA) [1,28,29].
The CIA index proposed by Nesbitt and Young [1] is the most commonly used index to quantitatively indicate the intensity of chemical weathering in the source area. It can be effectively used to evaluate the degree of transformation from feldspar to clay minerals. The higher the CIA value is, the higher the degree of chemical weathering [30]. The CIA formula is as follows:
CIA = [Al2O3/(Al2O3 + CaO* + Na2O + K2O)] × 100,
where CaO* represents the CaO content in silicate. Herein, the method proposed by McLennan, Hemming, Taylor, and Erikson [31] is used to calculate the CaO* content using the equation
CaO* = CaO − 10/3 × P2O5.
Generally, the CIA value of Phanerozoic shale ranges between 70 and 75, indicating that the rocks in the source area have experienced moderate weathering. When the CIA value is close to 100, the rocks in the source area experience strong and stable weathering [1]. CIA values of 70, 77, and 48 have been measured for post-Archean Australian shale, cratonic shale, and upper crust unweathered rock, respectively [3]. The CIA value of the Xishanbulake Formation is 2.64–70.28 (average 45.18). The CIA value of mudstone in the Xidashan Formation is 30.09–78.51 (average 64.49). Vertically, it trends from low values to high values and back to low values (Figure 4), indicating that the mudstone of the Xishanbulake Formation had a low degree of chemical weathering and that the parent rock of the Xidashan Formation has experienced a medium degree of chemical weathering.
ICV and PIA can also be used to indicate the weathering degree of rocks in the source area and can be calculated using
ICV = (Fe2O3 + K2O + Na2O + CaO* + MgO + MnO + Ti2O)/Al2O3,
PIA = (Al2O3 − K2O)/(Al2O3 + CaO* + Na2O − K2O) × 100.
The ICV value can be used to evaluate the maturity of the sediment composition and to judge whether the rock sequence represents primary deposition or is from recycled sediments. The higher the ICV value is, the lower the maturity it represents. An ICV greater than 1 indicates that fine-grained sediments contain a small amount of clay material, indicating primary deposition in an active structural belt. When ICV is less than 1, it represents deposition under an inactive environment of a craton or primary deposition under strong chemical weathering conditions [32]. The average ICV of the Xishanbulake Formation is 11.37 and that of the Xidashan Formation is 2.55, indicating that the compositional maturity of the Lower Cambrian mudstone is low and that the sediments were deposited in a tectonically active area.
The PIA value can reflect the failure strength of plagioclase in weathering, transportation, sedimentation, and diagenesis in the source area. The larger the PIA value is, the higher the weathering degree of the source area, and vice versa. The average PIA of the Xishanbulake Formation is 48.12 and that of the Xidashan Formation is 75.72, reflecting weak- to medium-strength plagioclase weathering in the source area.
Figure 4. Chemostratigraphic profiles of the characteristics of the discrimination index of the weathering degree of the Lower Cambrian mudstone in the Kongquehe area.
Energies 15 05400 g004
Th/U and K/Rb ratios can also effectively reveal the weathering conditions of the source area [4,33]. With increasing chemical weathering intensity, the Th/U ratio in sedimentary rocks will increase. When Th/U is greater than 4, the formation of sedimentary rocks is related to the chemical weathering of source rocks. The Th/U of the Lower Cambrian mudstone in the study area is less than 4. The average Th/U of the Xishanbulake Formation is 0.39 and that of the Xidashan Formation is 0.06, reflecting that the parent rock has experienced low-intensity chemical weathering. The K/Rb of the Xishanbulake Formation is 267.53–310.45 (average 291.06), and the K/Rb of the Xidashan Formation is 258.27–318.71 (average 283.65). The average value of mudstones in the two formations is higher than the K/Rb value of 230 in the crust [33], revealing a low degree of weathering.
In conclusion, the CIA, ICV, and PIA values and the Th/U and K/Rb ratios of the Lower Cambrian mudstone all reflect that the parent rock in the study area was mainly subject to low- to medium-degree chemical weathering and has not experienced sedimentary recycling. The weathering degree of mudstone in the Xidashan Formation is higher than that of mudstone in the Xishanbulake Formation.

5.3.2. Provenance

Trace elements and REE in fine-grained sedimentary rocks can reveal information on the provenance property of sedimentary rocks. Nonmigrating elements, such as La, Zr, Th, Co, and Sc, stay in water for a short time and show strong stability during weathering, denudation, transportation, sedimentation, and diagenesis. The La/Sc, Th/Co, Th/Cr, and Th/Sc ratios reflect the component characteristics of provenance. Through the comparison of characteristic ratios corresponding to UCC, LUC, and OC (Table 4), it was found that the characteristic ratios of trace elements in the Lower Cambrian mudstone samples in the study area were similar to those of UCC but quite different from those of LUC and OC.
In addition to the analysis of element contents and ratios, the use of an element discrimination diagram for provenance analysis is also very important [34,35,36]. In this study, a Th–Hf–Co diagram and a Hf–La/Th discrimination diagram were used to judge the source rock types of the Lower Cambrian in the Kongquehe area. In the Th–Hf–Co discrimination diagram, the Lower Cambrian mudstone samples are mainly cast in the shale distribution area of the continental upper crust (Figure 5a). In the Hf–La/Th discrimination diagram, the samples are mainly cast in the source area of felsic and basic rock mixtures and adjacent areas (Figure 5b). This shows that the parent rock of the Lower Cambrian mudstone is mainly controlled by felsic rocks from the upper crust.
Allègre and Michard [36] proposed that the type of sedimentary source rock can be determined by ΣREE–La/Yb diagrams. In the ΣREE–La/Yb diagram, the vast majority of samples are cast in the sedimentary rock area (Figure 6). The above discussion shows that the mudstones of the Lower Cambrian Xishanbulake and Xidashan Formations in the study area have a common parent rock type, which is mainly sedimentary rock rich in felsic minerals. The mixing of basic rocks may be related to the upwelling current in this area.
Figure 5. Discrimination diagram of the provenance properties of the Lower Cambrian mudstone in the Kongquehe area. (a) Th–Hf–Co discrimination (after Taylor and McLenna, 1985) and (b) Hf–La/Th diagram (after Floyd and Leveridge, 1987). A—felsic volcanic rocks; B—quartzite from cratonic basin; C—feldspar sandstones; D—shale (average upper continental crust); E—graywackes (arcs).
Energies 15 05400 g005
Figure 6. ∑REE vs. La/Yb diagram of the Lower Cambrian mudstone (modified from Xie et al., 2018 [6]).
Energies 15 05400 g006

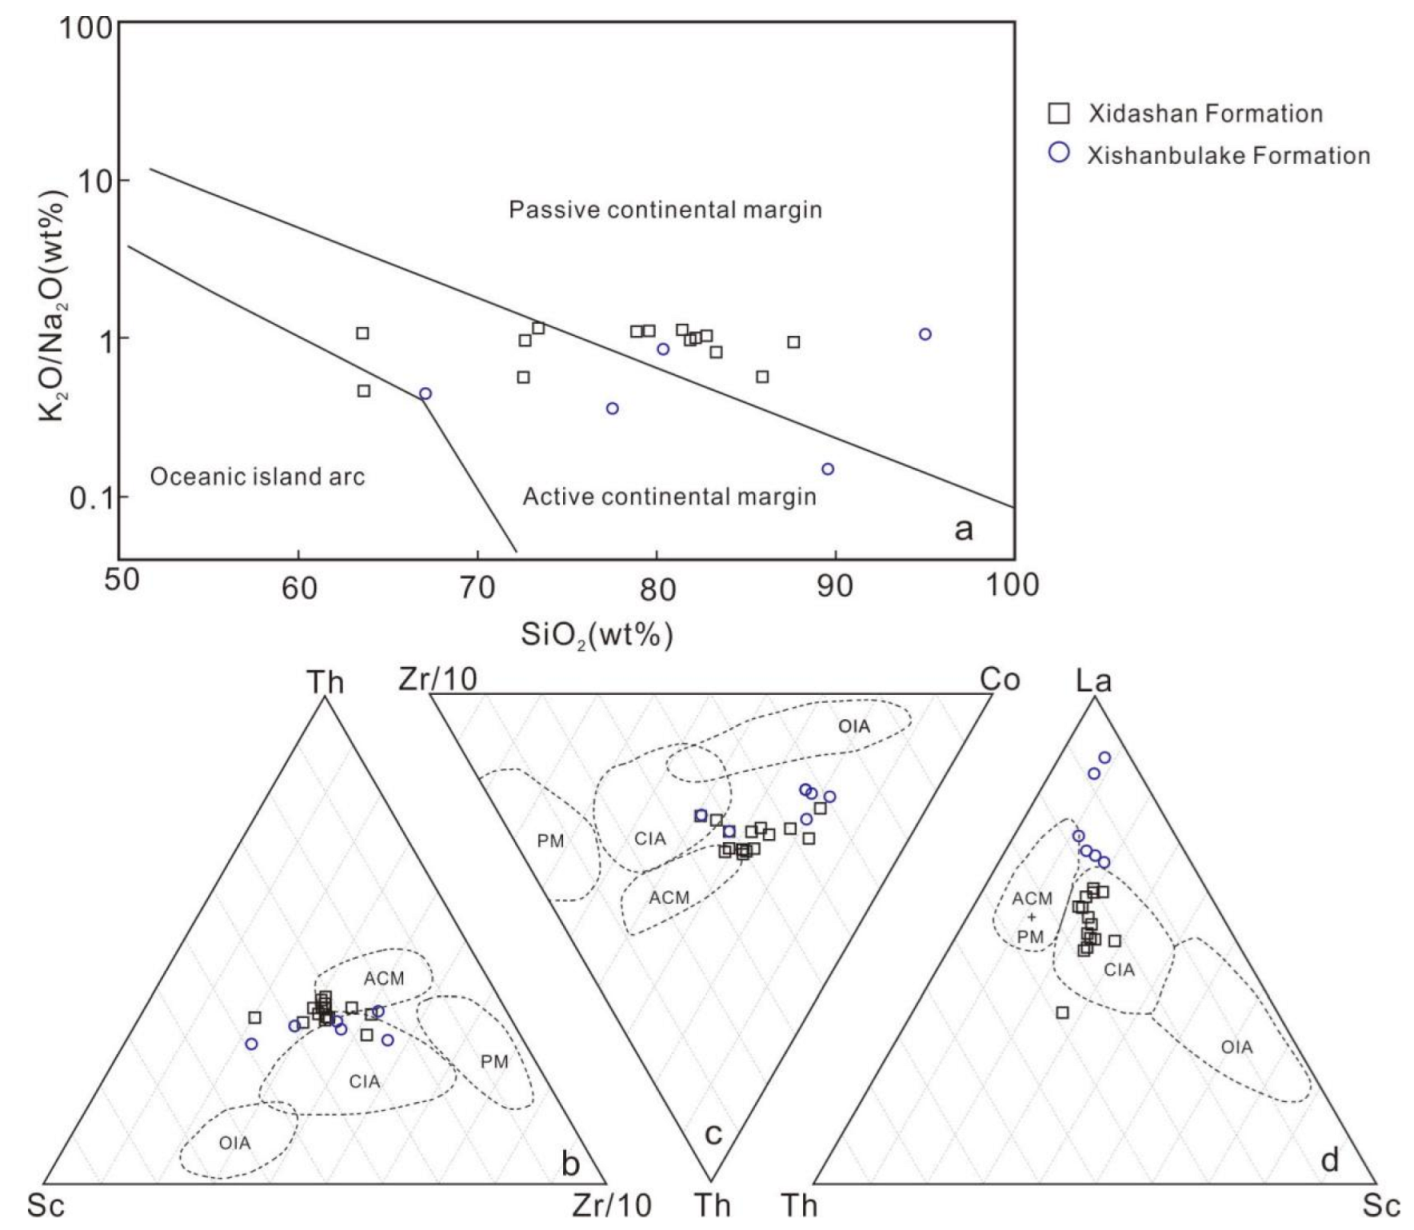
5.3.3. Tectonic Setting

The geochemical composition of clastic sedimentary rocks is controlled by the tectonic background of the source area. Sedimentary rocks under different tectonic backgrounds have different geochemical characteristics [36]. Based on the study of sand and mudstone, Roser and Korsch [36] considered that the major elements Si, K, and Na are effective indicators of the tectonic environment and established the discrimination diagram of the SiO2–K2O/Na2O tectonic background, which has been widely used to distinguish three different types of tectonic environments: oceanic island arc (arc), active continental margin (ACM), and a passive continental margin (PCM) [6,9,37]. In the SiO2–K2O/Na2O diagram (Figure 7a), most mudstone samples are located in the ACM and PCM.
Bhatia and Crook [38] established the Sc Zr/10, Th–Co Zr/10, and La–Th–Sc diagrams to determine different tectonic environments through the study of ancient fine-grained clastic rocks under the tectonic environment of known source areas in East Australia. Figure 7b–d shows that Xishanbulake and Xidashan Formations have similar tectonic backgrounds. The sample points are mainly located in and near the continental island arc area, and some are located on the ACM. This may be related to a relatively strong volcanic activity and hydrothermal activity in a later stage.
In summary, the tectonic setting of the Lower Cambrian mudstone in the Kongquehe area is mainly a continental island arc environment with characteristics of an ACM. The tectonic development pattern of the Lower Cambrian on the Kongquehe slope duiring the sedimentary period is shown in Figure 8.
Figure 7. Tectonic discrimination plots for mudstones of the Lower Cambrian mudstones (after Roser and Koesch [37], 1986; Bhatia and Crook, 1986 [38]). (a) K2O/Na2O-SiO2 discrimination diagram; (b) Th-Sc-Zr/10 discrimination diagram; (c) Th-Co-Zr/10 discrimination diagram; (d) La-Th-Scdiscrimination diagram. OIA—oceanic island arc; CIA—continental island arc; ACM—active continental margin; PM—passive margin.
Energies 15 05400 g007
Figure 8. Tectonic development pattern of the Lower Cambrian on the Kongquehe slope, Tarim Basin.
Energies 15 05400 g008

6. Conclusions

Based on the geochemical characteristics of mudstone in the Xishanbulake and Xidashan Formations of the Lower Cambrian on the Kongquehe slope, Tarim Basin, the following conclusions can be drawn:
(1)
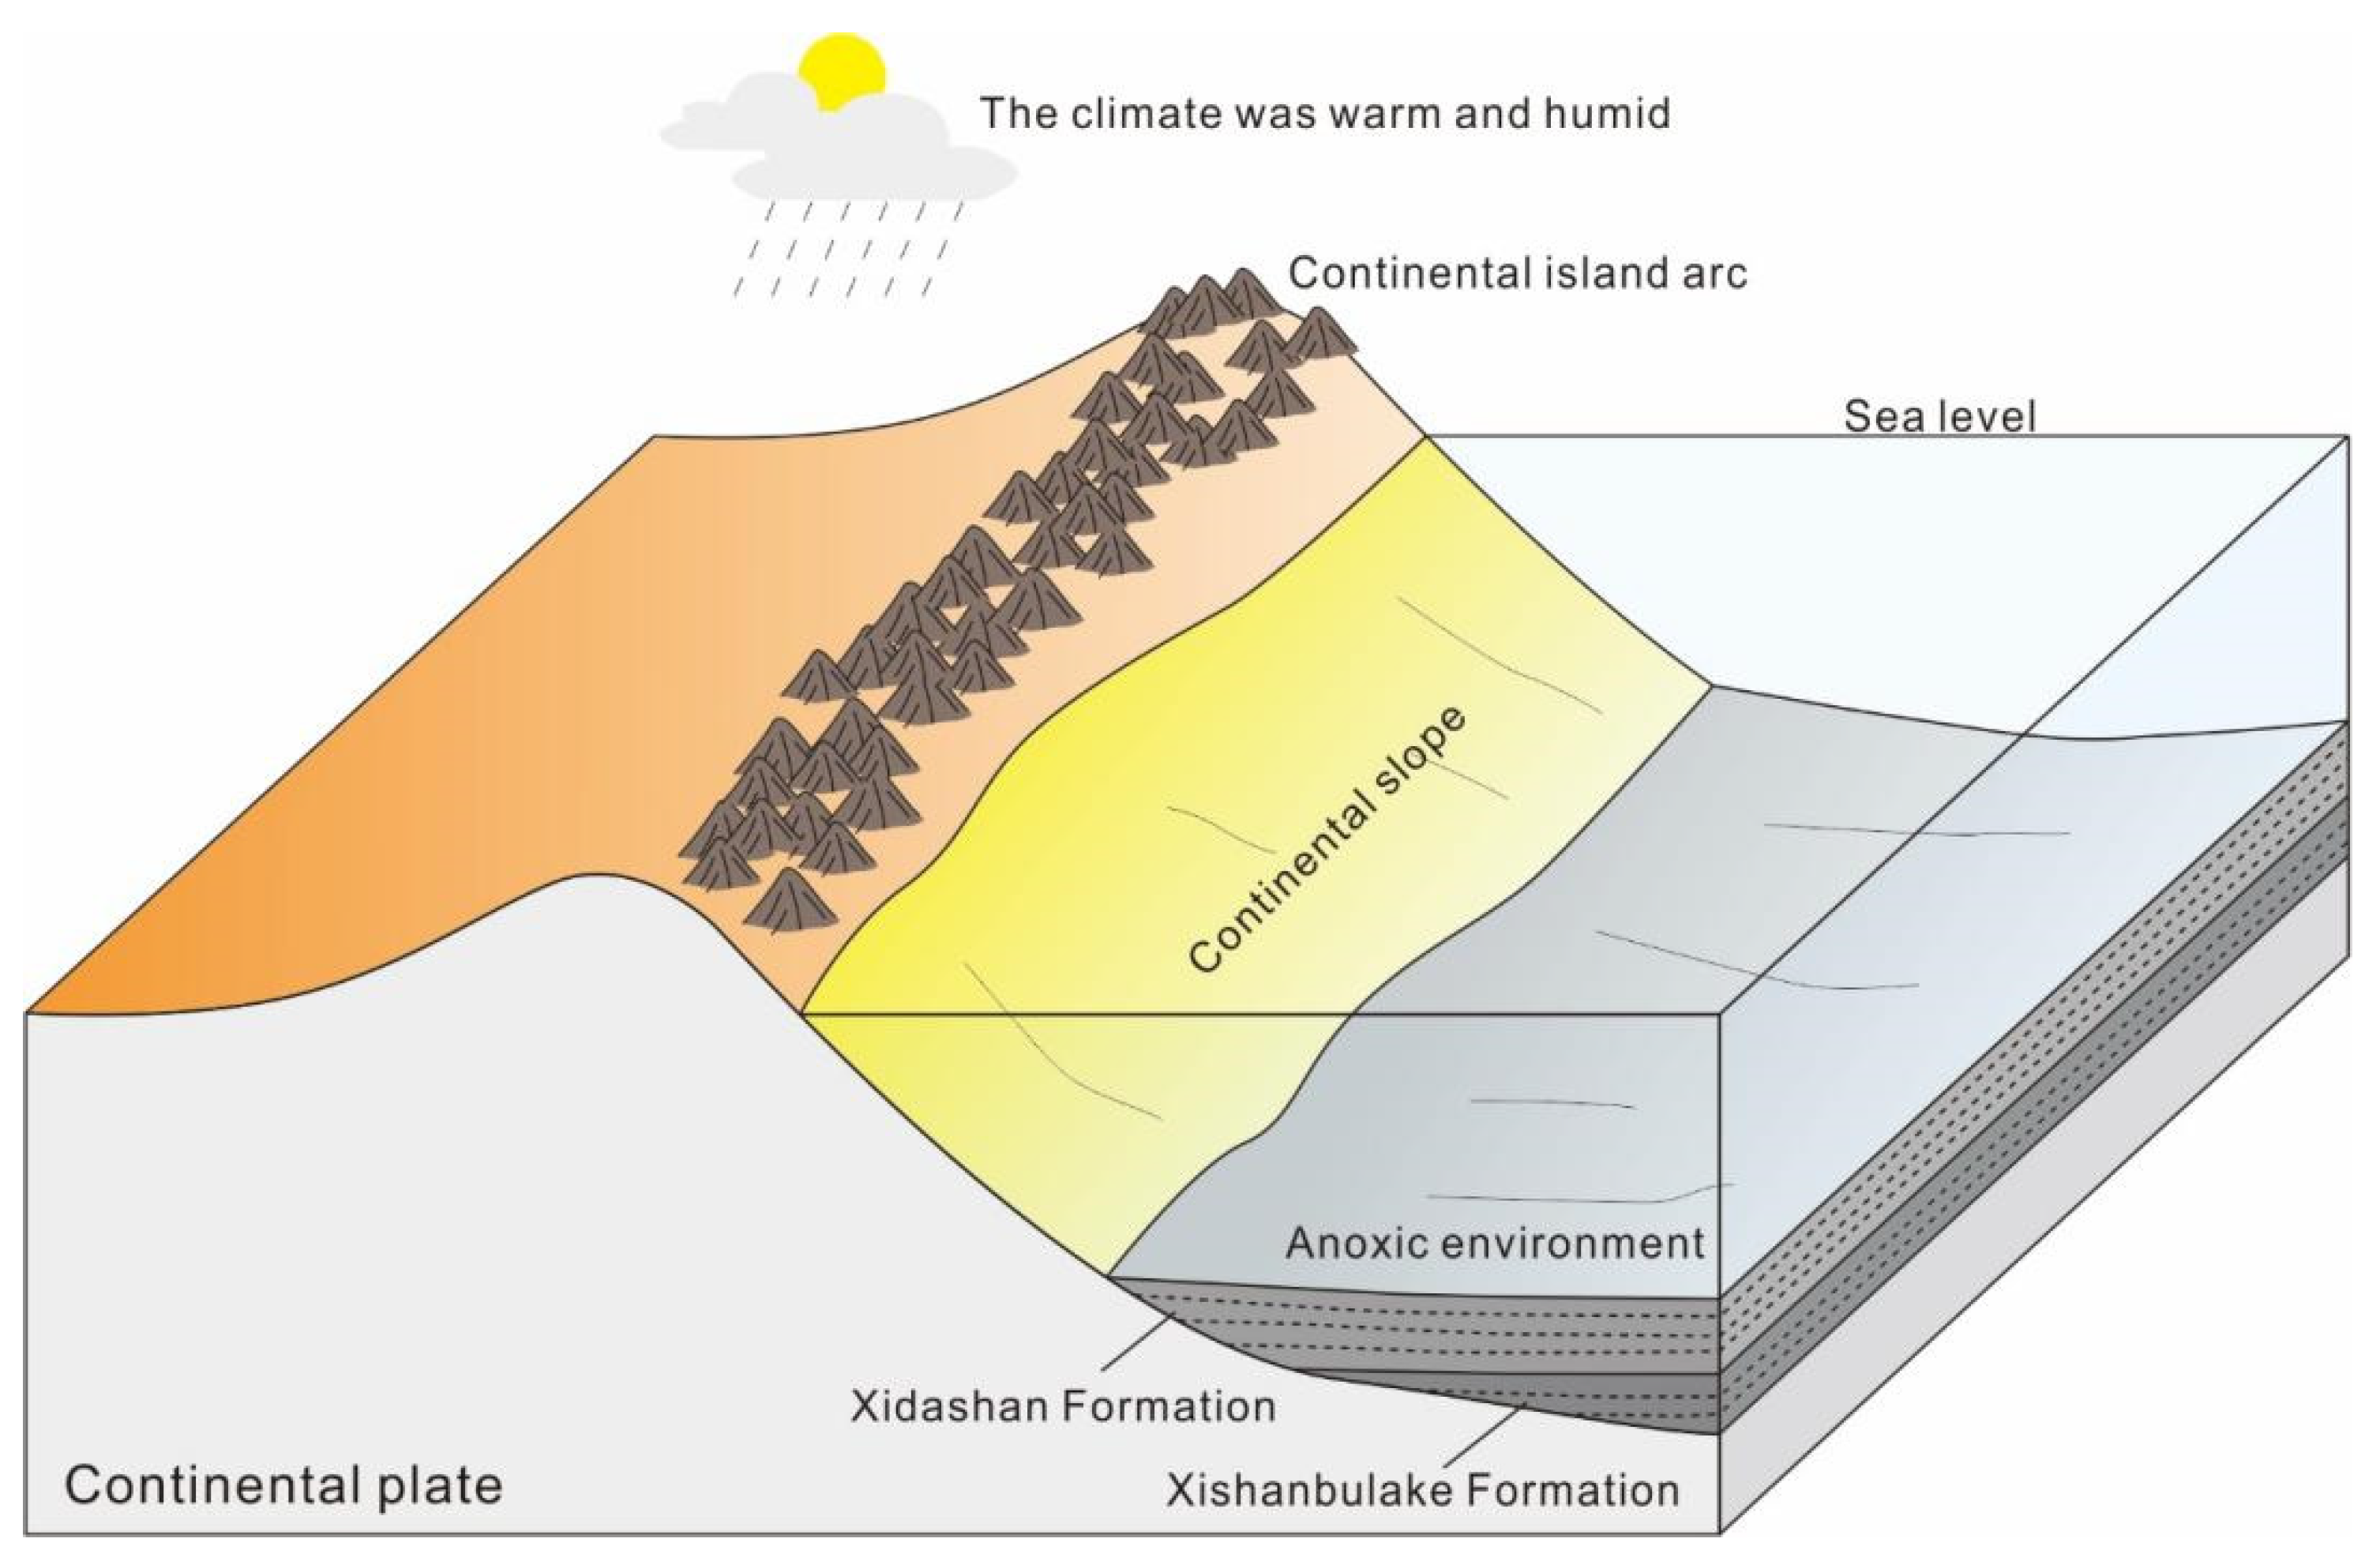
The redox indices of U, Uau, V/Cr, Ni/Co, and V/Sc indicate that most mudstone samples were formed in an anoxic sedimentary environment and that the reducing conditions weakened from the bottom to the top.
(2)
The Sr/Cu, Mg/Ca, and Fe/Mn ratios in the mudstone samples show that the sedimentation period of the Lower Cambrian was mainly characterized by a warm and humid paleoclimate.
(3)
The comprehensive analysis of geochemical parameters, namely, CIA, PIA, and ICV values and Th/U and K/Rb ratios in the Lower Cambrian mudstone all reflect that the Lower Cambrian parent rock in the study area has mainly been subject to low- to medium-degree chemical weathering and that the weathering effect increases from the bottom to the top. The mudstone in the Xishanbulake and Xidashan Formations shares the same parent rock type, which is mainly sedimentary rock rich in felsic minerals. The tectonic setting of the Lower Cambrian mudstone is mainly a continental island arc environment, with characteristics of an ACM.

Author Contributions

Conceptualization, K.S. and J.T.; methodology, J.T. and H.L.; software, J.L. and Y.Z.; validation, J.T. and H.L.; formal analysis, K.S. and X.Z.; investigation, K.S., J.T. and H.L.; resources, J.T. and H.L.; data curation, K.S.; writing—original draft preparation, K.S.; writing—review and editing, J.T.; supervision, J.T., H.L. and X.Z. All authors have read and agreed to the published version of the manuscript.

Funding

This research was funded by the National Science and Technology Major Project of the Ministry of Science and Technology of China (grant number 2017ZX05005002-001).

Data Availability Statement

Not applicable.

Conflicts of Interest

The authors declare no conflict of interest.

References

  1. Nesbitt, H.W.; Young, G.M. Early Proterozoic climates and plate motions inferred from major element chemistry of lutites. Nature 1982, 299, 715–717. [Google Scholar] [CrossRef]
  2. Bhatia, M.R. Rare earth element geochemistry of Australian Paleozoic graywackes and mud rocks: Provenance and tectonic control. Sediment. Geol. 1985, 45, 97–113. [Google Scholar] [CrossRef]
  3. Condie, K.C. Chemical composition and evolution of the upper continental crust: Contrasting results from surface samples and shales. Chem. Geol. 1993, 104, 1–37. [Google Scholar] [CrossRef]
  4. McLennan, S.M.; Hemming, S.; McDaniel, D.K.; Hanson, G.N. Geochemical approaches to sedimentation, provenance, and tectonics. Spec. Pap. (Geol. Soc. Am.) 1993, 284, 21–40. [Google Scholar]
  5. Wang, C.; Wang, Q.; Chen, G.; He, L.; Xu, Y.; Chen, L.; Chen, D. Petrographic and geochemical characteristics of the lacustrine black shales from the Upper Triassic Yanchang Formation of the Ordos Basin, China: Implications for the organic matter accumulation. Mar. Pet. Geol. 2017, 86, 52–65. [Google Scholar] [CrossRef]
  6. Xie, G.; Shen, Y.; Liu, S.; Hao, W. Trace and rare earth element (REE) characteristics of mudstones from Eocene Pinghu Formation and Oligocene Huagang Formation in Xihu Sag, East China Sea Basin: Implications for provenance, depositional conditions and paleoclimate. Mar. Pet. Geol. 2018, 92, 20–36. [Google Scholar] [CrossRef]
  7. Xu, J.; Xia, X.; Huang, C.; Cai, K.; Yin, C.; Lai, C.-K. Changes of provenance of Permian and Triassic sedimentary rocks from the Ailaoshan suture zone (SW China) with implications for the closure of the eastern Paleotethys. J. Asian Earth Sci. 2019, 170, 234–248. [Google Scholar] [CrossRef]
  8. Lin, X.; Zhang, Z.K.; Liu, X.; Chen, N.; Wu, T.; Zhang, Y.; Zhao, P.; Ma, X.; Zhou, Z. Geochemical characteristics of Late Triassic sandstones in the western part of Bayan Har Basin, Northern Tibetan Plateau, Western China: Constraints on provenance, source weathering, tectonic setting, and palaeoenvironment. Geol. J. 2020, 55, 5275–5293. [Google Scholar] [CrossRef]
  9. Li, J.; Tian, J.; Zhang, X.; Liang, Q.; Peng, M. Geochemical characteristics and the constraints on paleoenvironment, provenance, and tectonic setting of Precambrian Xifangshan Formation in the northwestern Tarim Basin, NW China. J. Pet. Sci. Eng. 2022, 208, 109553. [Google Scholar] [CrossRef]
  10. Xu, Z.-Q.; He, B.-Z.; Zhang, C.-L.; Zhang, J.-X.; Wang, Z.-M.; Cai, Z.-H. Tectonic framework and crustal evolution of the Precambrian basement of the Tarim Block in NW China: New geochronological evidence from deep drilling samples. Precambrian Res. 2013, 235, 150–162. [Google Scholar] [CrossRef]
  11. Zhu, G.-Y.; Ren, R.; Chen, F.-R.; Li, T.-T.; Chen, Y.-Q. Neoproterozoic rift basins and their control on the development of hydrocarbon source rocks in the Tarim Basin, NW China. J. Asian Earth Sci. 2017, 150, 63–72. [Google Scholar] [CrossRef]
  12. Zhou, C.; Jiang, S. Palaeoceanographic redox environments for the lower Cambrian Hetang Formation in South China: Evidence from pyrite framboids, redox sensitive trace elements, and sponge biota occurrence. Palaeogeogr. Palaeoclimatol. Palaeoecol. 2009, 271, 279–286. [Google Scholar] [CrossRef]
  13. Gao, Z.; Fan, T. Carbonate platform-margin architecture and its influence on Cambrian-Ordovician reef-shoal development, Tarim Basin, NW China. Mar. Pet. Geol. 2015, 68, 291–306. [Google Scholar] [CrossRef]
  14. Yao, J.; Xiao, S.; Yin, L.; Li, G.; Yuan, X. Basal Cambrian microfossils from the Yurtus and Xishanblaq formations (Tarim, north-west China): Systematic revision and biostratigraphic correlation of Micrhystridium-like acritarchs. Palaeontology 2005, 48, 687–708. [Google Scholar] [CrossRef]
  15. Yao, C.; Ding, H.; Ma, D.; Li, G. Carbon isotope features of the Sugetbrak Section in the Aksu-Wushi Area, Northwest China: Implications for the Precambrian/Cambrian Stratigraphic Correlations. Acta Geol. Sin. 2014, 88, 1535–1546. [Google Scholar] [CrossRef]
  16. Jones, B.; Manning, D.A.C. Comparison of geochemical indices used for the interpretation of palaeoredox conditions in ancient mudstones. Chem. Geol. 1994, 111, 111–129. [Google Scholar] [CrossRef]
  17. Algeo, T.J.; Maynard, J.B. Trace-element behavior and redox facies in core shales of Upper Pennsylvanian Kansas-type cyclothems. Chem. Geol. 2004, 206, 289–318. [Google Scholar] [CrossRef]
  18. Calvert, S.E.; Pedersen, T.F. Geochemistry of Recent oxic and anoxic marine sediments: Implications for the geological record. Mar. Geol. 1993, 113, 67–88. [Google Scholar] [CrossRef]
  19. Bjorlykke, K. Depositional History and Geochemical Composition of Lower Palaeozoic Epicontinental Sediments from the Oslo Region; Bulletin (Norges geologiske undersøkelse: 1984); Universitetsforlaget: Trondheim, Norway, 1974. [Google Scholar]
  20. Wignall, P.B.; Twitchett, R.J. Oceanic Anoxia and the End Permian Mass Extinction. Science. Science 1996, 272, 1155–1158. [Google Scholar] [CrossRef]
  21. Kimura, H.; Watanabe, Y. Ocean anoxia at the Precambrian-Cambrian boundary. Geology 2001, 29, 995–998. [Google Scholar] [CrossRef]
  22. Hu, J.; Li, Q.; Li, J.; Huang, J.; Ge, D. Geochemical characteristics and depositional environment of the Middle Permian mudstones from central Qiangtang Basin, northern Tibet. Geol. J. 2016, 51, 560–571. [Google Scholar] [CrossRef]
  23. Wignall, P.B.; Myers, K.J. Interpreting the benthic oxygen levels in mudrocks, a new Interpreting the benthic oxygen levels in mudrocks, a new Interpreting the benthic oxygen levels in mudrocks, a new approach. Geology 1988, 16, 452–455. [Google Scholar] [CrossRef]
  24. Lerman, A. (Ed.) Lakes-Chemistry. In Geology, Physics; Springer: Berlin/Heidelberg, Germany; New York, NY, USA, 1978. [Google Scholar]
  25. Xu, Q.; Liu, B.; Ma, Y.; Song, X.; Wang, Y.; Chen, Z. Geological and geochemical characterization of lacustrine shale: A case study of the Jurassic Da’anzhai member shale in the central Sichuan Basin, southwest China. J. Nat. Gas Sci. Eng. 2017, 47, 124–139. [Google Scholar] [CrossRef]
  26. Ferguson, J.; Henderson, G.; Kucera, M.; Rickaby, R. Systematic change of foraminiferal Mg/Ca ratios across a strong salinity gradient. Earth Planet. Sci. Lett. 2008, 265, 153–166. [Google Scholar] [CrossRef] [Green Version]
  27. Shaw, T.; Raiswell, R.; Hexel, C.; Vu, H.; Moore, W.; Dudgeon, R.; Smith, K. Input, composition, and potential impact of terrigenous material from free-drifting icebergs in the Weddell Sea. Deep. Sea Res. Part II Top. Stud. Oceanogr. 2011, 58, 1376–1383. [Google Scholar] [CrossRef]
  28. Cox, R.; Lowe, D.R.; Cullers, R.L. The influence of sediment recycling and basement composition on evolution of mudrock chemistry in Southwestern United States. Geochim. Cosmochim. Acta 1995, 59, 2919–2940. [Google Scholar] [CrossRef]
  29. Cullers, R.L.; Berendsen, P. The provenance and chemical variation of sandstones associated with the Mid-continent Rift System. Eur. J. Mineral. 1998, 10, 987–1102. [Google Scholar] [CrossRef]
  30. Armstrong-Altrin, J.S.; Lee, Y.I.; Verma, S.P.; Ramasamy, S. Geochemistry of sandstones from the upper Miocene Kudankulam Formation, southern India; implications for provenance, weathering, and tectonic setting. J. Sediment. Res. 2004, 74, 285–297. [Google Scholar] [CrossRef]
  31. McLennan, S.; Hemming, S.; Taylor, S.; Eriksson, K. Early Proterozoic crustal evolution; Geochemical and Nd-Pb isotopic evidence from metasedimentary rocks, southwestern North America. Geochim. Cosmochim. Acta 1995, 59, 1153–1177. [Google Scholar] [CrossRef]
  32. Cullers, R.L.; Podkovyrov, V.N. The source and origin of terrigenous sedimentary rocks in the Mesoproterozoic Ui group, southeastern Russia. Precambrian Res. 2002, 117, 157–183. [Google Scholar] [CrossRef]
  33. Wronkiewicz, D.J.; Condie, K.C. Geochemistry and mineralogy of sediments from the Ventersdorp and Transvaal supergroups, South Africa; cratonic evolution during the early Proterozoic. Geochim. Cosmochim. Acta 1990, 54, 343–354. [Google Scholar] [CrossRef]
  34. Taylor, S.R.; McLennan, S.M. The Continental Crust: Its Composition and Evolution; Blackwell Scientific Publications: Oxford, UK, 1985; pp. 1–312. [Google Scholar]
  35. Floyd, P.A.; Leveridge, B.E. Tectonic environment of the Devonian Gramscatho basin, south Cornwall: Framework mode and geochemical evidence from turbiditic sandstones. Geol. Soc. 1987, 144, 531–542. [Google Scholar] [CrossRef]
  36. Allègre, C.; Michard, G. Introduction to Geochemistry. Geophysics and Astrophysics Monographs v. 10; Reidel Publishing Company: Boston, UK, 1974; 143p. [Google Scholar]
  37. Roser, B.P.; Korsch, R.J. Determination of tectonic setting of sandstone-mudstone suites using silica content and potassium oxide/sodium oxide ratio. J. Geol. 1986, 94, 635–650. [Google Scholar] [CrossRef]
  38. Bhatia, M.R.; Crook, K.A.W. Trace element characteristics of graywackes and tectonic setting discrimination of sedimentary basins. Contrib. Mineral. Petrol. 1986, 92, 181–193. [Google Scholar] [CrossRef]
Figure 1. Location map of the study area. (a) Geological map of Tarim Basin in China. Modified from Gao and Fan (2015) [13]. (b) Details of Well A, including stratigraphy, lithology, and sample locations.
Energies 15 05400 g001
Table 4. Characteristic trace element content ratio of Lower Cambrian mudstone.
RatiosOCLUCUCCXidashan FormationXishanbulake Formation
Th/Co0.010.031.070.720.50
La/Sc0.100.302.702.416.75
Th/Sc0.940.030.971.101.05
Th/Cr0.000.010.310.100.03
Publisher’s Note: MDPI stays neutral with regard to jurisdictional claims in published maps and institutional affiliations.

