
Individual Phenolic Acids in Distillery Stillage Inhibit Its Biomethanization


Department of Environmental Biotechnology, Faculty of Geoengineering, University of Warmia and Mazury in Olsztyn, Sloneczna St. 45G, 10-709 Olsztyn, Poland
*
Author to whom correspondence should be addressed.
Energies 2022, 15(15), 5377; https://doi.org/10.3390/en15155377
Submission received: 20 June 2022
/
Revised: 22 July 2022
/
Accepted: 22 July 2022
/
Published: 25 July 2022
(This article belongs to the Special Issue Valorization of Wastes for Energy Production by Thermal and Biological Processes)
Abstract
:Polyphenols that are abundant in various organic wastes can inhibit anaerobic degradation of these wastes. This study investigated the effect of the concentration of individual phenolic acids (p-OH benzoic, vanillic, ferulic, sinapic, syringic, and p-coumaric acids) and their mixture on the methane potential of distillery stillage. An increase in phenolic acid concentration adversely affected biogas production and composition, as well as the methane-production rate. The inhibition constants for methane production were 0.5–1.0 g/L of individual phenolic acids and 1.5 g/L of the mixture of these acids. At lower concentrations, the phenolic acids were utilized as a carbon source, but the process was impeded when their concentrations exceeded the threshold value, due to their negative effect on microbial growth. When distillery stillage was spiked with vanillic acid, two-phase methane production was observed. Spiking distillery stillage with vanillic, p-coumaric, syringic, or ferulic acids affected anaerobic digestion the most; 2 g/L of these acids completely inhibited methane production. With 4.0 g/L of all individual phenolic acids, no methane production was observed. As the concentration of these phenolic acids increased from 0.5 to 4.0 g/L, the abundance of methanogenic Archaea, in which acetoclastic methanogens predominated, decreased by about 30 times.
1. Introduction
To achieve sustainable ecological and economic development, renewable energy sources need to be investigated, e.g., by managing waste to produce biogas. Among the substrates for biogas production, by-products from distilleries (distillery stillage) are used because of their widespread availability and high organic content. Annually, 80 million tons of stillage are produced around the world, which causes significant environmental pollution due to its high concentrations of difficult-to-degrade organics and nitrogen, its low pH, and its dark brown color [1]. To utilize this waste, anaerobic processing is commonly used, as the resulting power generation can significantly reduce operating costs when compared to energy-intensive aerobic processing [2].
However, distillery waste requires treatment after bio-methanization and before its potential use as fertilizer, due to its high residual COD, low biodegradability index, and toxicity [3]. Its toxicity is partially due to the content of polyphenols in it [4,5], which are not readily biodegradable and have significant antimicrobial activity [3,5]. Polyphenols reduce the ability of methanogens to produce methane; at phenolic compound concentrations from 120 to 594 mg/L, biogas production was reduced by up to 50% [6]. When treating olive mill wastewater, a polyphenol concentration of 9 g/L significantly limited anaerobic digestion [7]. On the other hand, a polyphenol content of 2.1–21.4 g/kg total solids did not affect the biological methane potential of grape pomace [8]. This could have been related to the fact that anaerobic microorganisms have some degree of tolerance to phenols, and low concentrations may favor anaerobic digestion [9]. It should also be considered that biomass pretreatment causes the solubilization of polyphenols as well as their release [4]. Therefore, to promote biomethane production and to ensure the profitability of biogas plants, methods for accelerating biomethane production from waste containing polyphenols should be further investigated.
Interestingly, however, the presence of polyphenols in distillery stillage can be seen in a positive light, due to the useful properties of these aromatic compounds. They are found not only in stillage, but also in olive-mill waste, wheat straw, fruit and vegetable waste, and wastewater from winemaking [10,11,12,13]. Due to their strong antioxidant activity, they have received much attention as valuable bioactive compounds of commercial interest. As a result, the recovery of polyphenols from waste has started to be investigated with the aim of utilizing them in cosmetics, pharmaceuticals, and food industry products [12].
The quality and quantity of polyphenols in different wastes can vary, depending on the type of plant material from which the waste was generated, the processing technology, the storage conditions, and other factors such as pH, oxygen, temperature, light, metal ion enzymes, etc. [14]. Regarding distillery waste, only the effect on the bio-methanization of complete polyphenols from sugarcane molasses distillery wastewater has been investigated [15]. Polyphenols include phenolic acids and flavonoids. Phenolic acids differ in their activity, concentrations, and proportions depending on the waste type [12]. Depending on the waste type, phenolic acids are present as lignin-bound compounds or in free forms, which determines the method of their recovery. In distillery stillage coming from cereal processing, their free forms predominate [16]. The effects of specific phenolics on bio-methanization were investigated only for brown seaweed [17]; however, in this study, phlorotannin was investigated, which is not a phenolic compound typically found in distillery stillage. Hence, based on literature reports, it is impossible to conclude if bio-methanization is adversely affected by total polyphenols or by specific phenolic acids; thus, it is difficult to decide which method of polyphenol recovery from particular waste should be performed before its anaerobic processing.
Although phenolic acids differ in their antimicrobial activity, depending on their structure, specific information about the effect of the particular acids present in distillery stillage on its bio-methanization potential is lacking. Therefore, the novelty of the study was to investigate the effects on bio-methanization of six phenolic acids (p-OH benzoic, vanillic, ferulic, sinapic, syringic, and p-coumaric acids) representative of those present in distillery stillage generated during alcohol production from cereals. The objectives of the study were to assess the effect of the type and concentration of the individual phenolic acids and their mixtures on (i) the biogas potential of the distillery stillage, (ii) the methane content in the biogas, (iii) the methane production rate, and (iv) the abundance of methanogenic Archaea in the microbial communities of the stillage. The technological and molecular results provide a comprehensive picture of the extent to which phenolic acids inhibit the growth of the microorganisms participating in the bio-methanization of the stillage and affect methane production. These results will help to decide if polyphenols should be recovered prior to stillage fermentation.
2. Materials and Methods
2.1. Characteristics of Substrate
The substrate for methane fermentation was distillery stillage (Table 1) collected from a company located in northeast Poland that produces concentrated unpurified ethyl alcohol from cereals. The total polyphenol content (TPC) in the stillage was 4.56 ± 0.03 mg gallic acid equivalent/g dry mass. The stillage was stored at 6 °C. As an inoculum, anaerobic sludge from the pilot-scale agricultural biogas plant processing cattle slurry and maize silage was used (organic loading rate (OLR) of 2.0 kg VS/(m3·d), retention time of 20 days, 35 °C). To ensure degradation of easily degradable organic matter and to remove dissolved methane, the inoculum collected from the biogas plant was stored with an anaerobic headspace for 3 days at 37 °C.
2.2. Experimental Design for Methane Fermentation
The feedstock for the methane fermentation was a mixture of distillery stillage and inoculum (9.6:90.4, w:w) and was characterized by: 65.9 ± 2.4 g TS/kg, 51.2 ± 1.6 g VS/kg, 23,600 ± 689 mg CODsol/L, 1047.8 ± 149.3 mg VFA/L, 152.6 ± 4.1 mg N-NH4/L, and 116.6 ± 1.2 mg TP/L. The densities of the distillery stillage and inoculum were 1031 and 1014 kg/m3, respectively. In series 1, the effect of individual phenolic acids (p-OH benzoic, vanillic, ferulic, sinapic, syringic, and p-coumaric acids) on bio-methanization was investigated. Individual phenolic acids were added to the feedstock for final phenolic acid concentrations of 0.5, 1.0, 1.5, 2.0, and 4.0 g/L. In series 2, to investigate the effect of a mixture of phenolic acids on bio-methanization, the same phenolic acids were mixed in equal proportions and added to the feedstock to obtain the final total phenolic acid concentrations in the mixture of 0.5, 1.0, 1.5, 2.0, and 4.0 g/L.
The methane production was measured in an automatic methane potential batch-test system (AMPTS II Bioprocess Control, Lund, Sweden). In this system, i.e., in 0.5 L reactors, the volume of the mixture of the inoculum and stillage was 100 mL, which ensured an initial VS content of 5 g/L. The reactors were equipped with a mixing system (100 rpm for 30 s every 10 min). CO2 traps were used. To ensure anaerobic conditions, the samples were purged with nitrogen gas. The incubation time of the feedstock was 21 days at 37 °C. As a control, a sample of feedstock without phenolic acid addition was used. The tests were made in triplicate. Methane production was expressed as volume (L) at normal conditions (temperature and pressure) per kg of VS added initially. Based on methane production obtained from this measurement and the composition of the biogas, biogas production was calculated. Simultaneously, the methane production from the inoculum was measured. To take into account the inoculum’s background and represent the methane potential of the distillery stillage accurately, the methane production from the inoculum was subtracted from the methane production from the feedstock [18]. The maximum theoretical methane potential of the substrate was calculated based on the assumption that 0.35 L of methane can be produced from 1 g of total COD [19].
2.3. Analytical Methods
In samples of stillage before and after fermentation (digestate), the contents of TS, VS, total COD, soluble COD, ammonium nitrogen, VFAs, and alkalinity were measured according to APHA [20], and the TP concentrations were measured with cuvette tests (Hach Lange GMBH, Berlin, Germany). For pH measurement, a pH meter (HANNA Instruments HI 221, Cluji-Napoca, Romania) was used. Total organic carbon (TOC) and dissolved organic carbon (DOC) concentrations were measured with a Fusion analyzer (Teledyne Tekmar, Mason, OH, USA). The concentrations of soluble COD, ammonium nitrogen, VFAs (expressed as acetic acid), TP, alkalinity, and pH were measured in the supernatants obtained after the centrifugation of the distillery stillage (10 min, 8000 rpm). Free ammonia was calculated according to Capson-Tojo et al. [21]. Before and after fermentation, the TPC was determined using the Folin-Ciocalteu method [22].
The biogas composition was assessed by injecting 20 mL gas samples, collected from the headspace of the reactors, into a gas chromatograph (GC, 7890A Agilent, Santa Clara, CA, USA) with a thermal conductivity detector (TCD) operating at 250 °C. Two Hayesep Q columns (80/100 mesh), two columns with molecular sieves (60/80 mesh), and a Porapak Q column (80/100) were used to separate the biogas components. Carrier gases (helium and argon) were used as the mobile phase at a flow rate of 15 mL/min.
2.4. Abundance of Methanogenic Microorganisms
Biomass samples (three replicates collected after fermentation from digestates) were fixed and subjected to fluorescence in in situ hybridization (FISH) [23]. The following molecular probes were used: ARC915 (Archaea; [24]), MSMX860 (Methanosarcinaceae; [25]), MX825 (Methanosaeta; [25]), and MB1174 (Methanobacteriaceae; [25]) under the conditions given in ProbeBase (www.microbial-ecology.net/probebase, accessed on 17 September 2020). The samples were visualized with an epifluorescence microscope (Nikon Eclipse 50I, Tokyo, Japan). To quantify the FISH-defined populations, ImageJ software (http://rsb.info.nih.gov/ij/, accessed on 13 September 2020) was employed; at least 30 fields of view were examined for each probe. To determine the bio-area of the populations in the sample, the ratio of cells targeted by each probe to those stained with DAPI (4,6-diamidino-2-phenylindole) was calculated and expressed as the relative abundance (as a percentage) of all detected microorganisms. The coefficients of variation of all values were 10–15%.
2.5. Data Analysis
First order kinetics was the assumed model for methane production:
where Ct (L CH4/kg VS) was the cumulative methane production at digestion time t (days), C0 (L CH4/kg VS) was the maximal methane production, and k (1/d) was the constant of methane production. C0 and k were estimated using nonlinear regression and the Gauss-Newton algorithm (Statistica 13.1). The rate of methane production (r) was calculated as r = k·C0. In the case of a two-phase course of methane production, the r values were calculated for each phase separately. The goodness of fit of the model to the data was evaluated using the determination coefficient (R2).
Spearman’s rank correlation and Principal Component Analysis (PCA) were calculated to determine the relationships between the operating conditions, biogas/methane production from stillage spiked with various phenolic acids, and microbial abundance using RStudio Version 1.2.1335. The matrix of correlations was visualized with a correlogram using the “corrplot” package. The relationships between the variables were determined using the correlation coefficient (rs). PCA was plotted with the “ggplot2” and “ggfortify” packages. Heat maps show the effect of phenolic acid concentrations on the biogas composition and a distribution of the abundance of Archaea and potential methanogens.
In all analyses, the statistical significance was determined at the 95% confidence interval.
3. Results and Discussion
3.1. Methane Production
The addition of phenolic acids to distillery stillage diminished the methane production, and this decrease depended on the type and concentration of the phenolic acids. The cumulative methane production at the end of the incubation period is shown in Figure 1. Biogas production per kg of VS and kg of fresh mass is given in Table S1.
The anaerobic processing of raw distillery stillage not spiked with phenolic acids (control sample) produced 423 L methane/kg VS after 21 days (Figure 1). Similarly, methane yields were 410, 401–458, 389.1, and 503 L/kg VS after the 30-day incubation of whole-cereal stillage [26], 22-day incubation of whole-corn stillage [27], 30-day incubation of barley stillage [28], and 41-day incubation of barley stillage [29], respectively. In series 1, with concentrations of individual phenolic acids of 0.5 and 1.0 g/L, slightly lower amounts of methane were produced: from 309 L/kg VS with ferulic acid to 406 L/kg VS with sinapic acid. Increasing the phenolic acid concentration significantly decreased methane production. With 1.5 g/L of phenolic acids, the respective amounts of methane produced were 43–61% lower than the amounts in the control sample, depending on the phenolic acid that was used. With 2.0 g/L of p-OH benzoic and sinapic acids, the methane production accounted for 9 and 10% of that measured for the control sample. The acids that had the strongest effects on methane production were vanillic, ferulic, syringic, and p-coumaric acids. Their presence at 2.0 g/L resulted in no methane production. With 4.0 g/L of all acids present individually, methane was not produced.
Changing the phenolic acid concentrations in the distillery stillage changed the average shares of methane and carbon dioxide in the biogas (Figure 2). In series 1, at phenolic acid concentrations of 0.5 and 1.0 g/L, the methane percentage was similar to that in the control sample: from 71.85% for p-coumaric acid to 76.78% for p-OH benzoic acid. At phenolic acid concentrations of 1.5 and 2.0 g/L (for p-OH benzoic and sinapic acids), the methane contribution was lower by 17–25 and 28–30%, respectively, than in the control sample.
In series 2, phenolic acid mixtures at concentrations of 0.5–1.5 g/L had little effect on methane production, whereas mixtures at concentrations of 2.0 and 4.0 g/L reduced methane production by 68 and 94%, respectively, compared to the control sample (Figure 1). The differences in methane and carbon dioxide content were not as marked as in series 1 (Figure 2). At concentrations of 1.5 and 2.0 g/L, the methane content decreased by 12 and 19%, respectively, compared to the control sample. However, at 4.0 g/L, the methane content substantially decreased, and its share was 51.41%. At a given total concentration of phenolic acids, the inhibition of methane production was less with mixtures of the acids than with individual acids. This was particularly visible at 2.0 and 4.0 g/L in mixtures, when methane was still produced. It can be explained by the fact that the concentrations of vanillic, ferulic, syringic, and p-coumaric acids, which inhibited methane production the most, were lower in mixtures than when these acids were present individually. The lower the proportion of these individual phenolic acids in the mixtures, the less they affected methane production. Additionally, the presence of phenolic acids in a mixture can cause them to polymerize or become insoluble. This insolubility may reduce interactions between the compound and cells and thus reduce their inhibitory capacities [30].
The fact that low concentrations of phenolic acids (both individually and in the mixture) had little or no inhibitory effect on biogas and methane production indicates that they could have been converted into methane, as shown by Chapleur et al. [31] during the degradation of phenol-enriched biomass. They reported that concentrations of phenolic compounds above 1 g/L reduced the production of biogas from household waste by 10%, and a further increase in their concentration to 4.0 g/L reduced production by 98%. At phenol concentrations higher than 1 g/L, Dong et al. [9] reported a 50% decrease in methane yield. On the other hand, 0.5 g/L of polyphenols was identified as a concentration that inhibited the anaerobic digestion of olive oil mill wastewater because of a lack of microbial adaptation [32].
The maximum theoretical methane potential of the distillery stillage was 487 L/kg VS. A similar theoretical potential (479 L/kg VS) was obtained for cereal-processing stillage [33], which resulted from the total COD/VS ratio of 1.47 g/g (1.43 g/g in the present study, Table 1). This may be related to the high contribution of proteins (58.5% of dry matter) in such wastes, in comparison with carbohydrates (9.74%) that are converted into alcohol and lipids (8.49%) [34]. In the present study, during the digestion of distillery stillage without phenolic acids, 86.8% of the theoretical methane potential was achieved. The effects of phenolic acids on methane production from distillery stillage as a percentage of the maximum theoretical methane production are given in Table 2. The percentage decreased to about 70% for 0.5 g/L of acids that affected the methane production the most (i.e., vanillic, ferulic, syringic and p-coumaric). At low concentrations of p-OH benzoic and sinapic acids, the methane production was maintained at a high level of about 80% of the maximum. During anaerobic incubation, after the first period of degradation of easily degradable compounds, there was a period in which the substrate became liquefied, which may have resulted in a release of slowly biodegradable compounds that became available to the microorganisms. This could have increased the methane production after several days of digestion. A similar observation was made by Battimelli et al. [35] during the anaerobic biodegradation of slaughterhouse waste in fed-batch reactors. This was explained by the fact that slowly biodegradable compounds were responsible for biogas production, in addition to the biogas produced by the degradation of the substrate, resulting in high biogas potential.
The inhibition of methane fermentation by phenolic acids was also reflected in the kinetics of methane production, as can be observed over the course of methane production over time. In series 1 (0.5–1.5 g/L) (Figure S1a,c–f) and series 2 (0.5–2.0 g/L) (Figure S1g), the methane production increased until the 6th day of measurement, then the curves plateaued. At 2 g/L of p-OH benzoic and sinapic acids (Figure S1a,f) and at 4 g/L of the acid mixture (Figure S1g), a lag phase of several days was seen. In the case of the 0.5–1.5 g/L vanillic acid additive, methane production was divided into two phases (Figure S1b); it stabilized after the 3rd day, while from the 9th day it started to increase and reached a plateau after the 13th day of fermentation. This division of methane production into two phases could have been caused by the fact that vanillic acid can only be utilized by microorganisms that need more time to grow (acetoclastic methanogens) [36]. Additionally, vanillic acid is not completely broken down by methane fermentation microorganisms. Only after vanillic acid was oxidized to ferulic acid could the next phase of methane fermentation take place [37]. The constants of methane production (k) were 0.11–1.38 1/d (Table 3). It varied because of the biological effects of toxicants and ranged from 0.08 to 0.09 l/d [38] or from 0.05 to 0.13 1/d [39] for organic waste biomass.
The inhibition effect of phenolic acids on methane production can be seen in Figure 3, which shows methane production rates (r) in response to phenolic acid concentrations. In the control sample of distillery stillage, the r value was 220 L/(kg VS·d). The addition of 0.5 g/L of phenolic acids (except for p-OH benzoic and sinapic acids) decreased the r value. A further increase in individual phenolic acid concentration to 1.5 or 2.0 g/L (depending on the acid type) led to an r value of 5–80 L/(kg VS·d). The inhibition constant, which is the concentration of the inhibitor (particular phenolic acid) that halves the maximum methane production rate was slightly above 1.0 g/L for p-OH benzoic and sinapic acids, slightly below 1.0 g/L for p-coumaric and vanillic acids, and 0.5 g/L for ferulic and syringic acids. Although hydroxycinnamic acids (including p-coumaric, ferulic, and sinapic acids) are considered to have greater antimicrobial activity than hydroxybenzoic acids (including p-OH benzoic, vanillic, and syringic acids) [40], the type of acid did not have any visible effect on the value of the inhibition constant in the present study. The increasing concentrations of the mixture of phenolic acids resulted in the mildest decrease of the r value, which finally reached about 39 and 3 L/(kg VS·d) at 2.0 and 4.0 g/L (Figure 3g). The inhibition constant for the mixture of acids was calculated to be 1.5 g/L.
The toxic effect of phenolic compounds on anaerobic digestion may result from the size and polarity of their molecules as well as the substituents on the aromatic ring that modify the polarity [6,41]. Compounds with aldehyde groups or nonpolar substituents were highly toxic, while those with carboxyl groups only caused significant inhibition at high concentrations [42]. This was in agreement with the present study, which indicated that syringic and ferulic acids (containing an aldehyde group) had a stronger inhibitory effect on methane production than acids without this group (Figure 1, Figure 2 and Figure 3). All acids with hydroxyl groups on the aromatic ring had slightly increased toxicity, but introducing further hydroxyl groups could create less-inhibitory compounds [43,44]. As a result of molecular interactions, less-toxic compounds (p-OH benzoic acids) could be formed. Aromatic compounds with more or longer alkyl substitutions (ferulic or p-coumaric acid) had stronger inhibitory effects than those with fewer or shorter alkyl substitutions. Thus, in the present study, p-OH benzoic acid had the weakest inhibitory effect, while ferulic acid, with the longest alkyl side chain, had the strongest inhibitory effect. It should be kept in mind that the structure of the alkyl side chain plays an important role in the antimicrobial activity of aromatics. For example, the presence of polar functional groups on an aliphatic side chain often reduces the microbial toxicity of aromatic compounds [45]. According to Wang and Wang [46], -COOH reduces toxicity to a greater extent than OH, which in turn reduces it to a greater extent than -CH2CH2OH. For this reason, in the present study, sinapic acid was less toxic than ferulic, p-coumaric, and syringic acids, which all have similar structures. The low toxicity of sinapic acid is due to its -COOH substituent and three other substituents. The size of the structure does not affect the toxicity of the phenolic acids, because the molecular weights of ferulic, syringic, and sinapic acids are similar, even though sinapic acid had a lower methane inhibitory effect than ferulic and syringic acid. A similar effect can be seen when comparing the inhibitory effect of vanillic and p-coumaric acids, which also have similar molecular weights.
3.2. Characteristics of Digestate
In series 1 and 2, the conversion of organic compounds to methane did not differ significantly between the control and the experiments with phenolic acid concentrations of 0.5, 1.0, and 1.5 g/L (Table S2). However, when the phenolic acid concentrations reached 2.0 g/L, the efficiencies of TS, VS, COD, TOC, and DOC removal were noticeably reduced and further reduced at phenolic acid concentrations of 4.0 g/L.
Despite the low biodegradability of the polyphenols, they could serve as an additional carbon source for some microorganisms. Thus, at lower phenolic acid concentrations, more than 80% of the TPC were anaerobically converted, and about 20% remained in the digestate (Figure 4).
At a phenolic acid concentration of 4.0 g/L, 85–97% of TPC was not degraded and remained in the digestate. The percentage of the TPC that remained in the digestate was strongly negatively correlated with the efficiency of the TOC removal (rs = −0.88), which shows that the increasing concentrations of the phenolic acids limited their use as a carbon source. For these calculations, the TPC in raw stillage without phenolic acid addition was neglected because of the low ratio between a stillage sample and inoculum in the feedstock, which was the same in all experimental variants.
The stability of the methane fermentation process was monitored based on the pH, the alkalinity, and the VFA concentrations (Table S2). Under all the experimental conditions, the pH ranged from 6.85 to 7.42; for fermentative microorganisms and methanogenic archaea, pH should fall within the ranges 5.0–8.5 and 6.5–7.8, respectively [47]. The alkalinity of the fermented stillage decreased from 186 to 127 meq/L (series 1) and from 191 to 134 meq/L (series 2) as the phenolic acid concentrations were increased from 0.5 to 4.0 g/L. Methane production was strongly positively correlated with pH (rs = 0.81–0.94) and alkalinity (rs = 0.86–0.97).
At the lowest concentration of phenolic acids in series 1 and 2, the VFA levels remained low due to their immediate consumption after their production. As the phenolic acid concentrations were increased, the VFA levels increased correspondingly, peaking at 3423.5 and 3075.3 mg/L in series 1 and 2, respectively, with phenolic acid concentrations of 4.0 g/L (Table S2). This increasing accumulation of VFAs may relate to the degradation of phenolic intermediates or may reflect a kinetic uncoupling between the acid producers and consumers. However, the concentrations of VFAs probably did not inhibit methanogenic activity, as they never exceed levels of 3.5–5.0 g/L when this typically occurs [48], because the VFAs were neutralized by the alkalinity, and therefore the pH was almost stable. This is more evident, because, in the present study, the VFA concentrations in the digestates obtained when distillery stillage was spiked with the phenolic acids that affected the methane production the most (vanillic, ferulic, syringic, and p-coumaric acids) were similar to those found for the other acids.
Despite the accumulation of VFAs, ammonium contributed to increasing the buffering capacity and keeping the pH stable [49]. At phenolic acid contents of 0.5 and 1.0 g/L, the concentrations of ammonium nitrogen, produced in anaerobic digestion during the degradation of organic nitrogen, were similar to that in the control sample (Table S2). As the phenolic acid concentration increased, the ammonium concentration increased, reaching levels of 682.7 and 625.4 mg/L in series 1 and 2, respectively, at 4.0 g/L of phenolic acids. A similar increase was observed in the case of phosphorus concentrations, which increased from about 189 mg/L in a control sample and at 0.5 g/L of phenolic acids to 368.6 mg/L at 4.0 g/L of phenolic acids. Lower concentrations of nitrogen and phosphorus in the substrate than in digestates can be explained by the fact that they were not measured in the total substrate but in the centrifuged supernatant. Thus, the substrate was characterized by the concentrations of ammonium nitrogen and phosphates, whereas the final composition of digestates (concerning N and P) resulted from the degradation of organic matter. The total nitrogen (ammonium and organic) in distillery stillage may reach 1.97 g/L [50]; organic nitrogen may account about 88% of the total [33] or above 99% of the total [27], due to high amounts of proteins in cereal-processing waste [34]. In digestates with some concentrations of phenolic acids (above 1.0–1.5 g/L), nitrogen and phosphorus concentrations were higher than in digestates from the substrate (distillery stillage) and inoculum (control sample). Due to the fact that nitrogen and phosphorus are key macronutrients for the growth of anaerobic microorganisms, this increase suggests that less biomass growth was possible, leading to a lower amount of nutrient incorporation in the new biomass cells. This indicates the inhibition of microbial growth by the phenolic acids, more so because, regardless of the type of acid, the increase in their concentration increased the concentration of nitrogen and phosphorus accumulated in the digestate. Nevertheless, the ammonium levels were still below those reported in the literature threshold concentrations that limit methanogenesis. Methane fermentation was inhibited at ammonium nitrogen concentrations higher than 2000 mg/L [51]. In other studies, ammonium nitrogen concentrations above 1000–1500 mg/L were reported as the primary cause of fermentation failure due to inhibition by free ammonia [52]. As free ammonia can easily permeate through cell membranes [52], it is the form of nitrogen that mainly inhibits methanogenesis. In the present study, due to the pH values resulting from the balance between VFAs and ammonium, the free ammonia content was low, up to 13.3 mg/L. Thus, the inhibition of biomass growth resulted in the accumulation of nutrients, and their end concentration did not affect the methane outputs. In summary, the presence of phenolic acids could have affected the growth of microorganisms, thus directly affecting methane production.
From observations of the effect of phenolic acids on bio-methanization, it is not clear which step of the anaerobic process was inhibited to a greater extent by these acids. Thus, for more insight into this question, the abundance of the most sensitive microorganisms in the fermentation chain—the methanogens—was determined in the fermented distillery stillage.
3.3. Abundance of Methanogenic Archaea
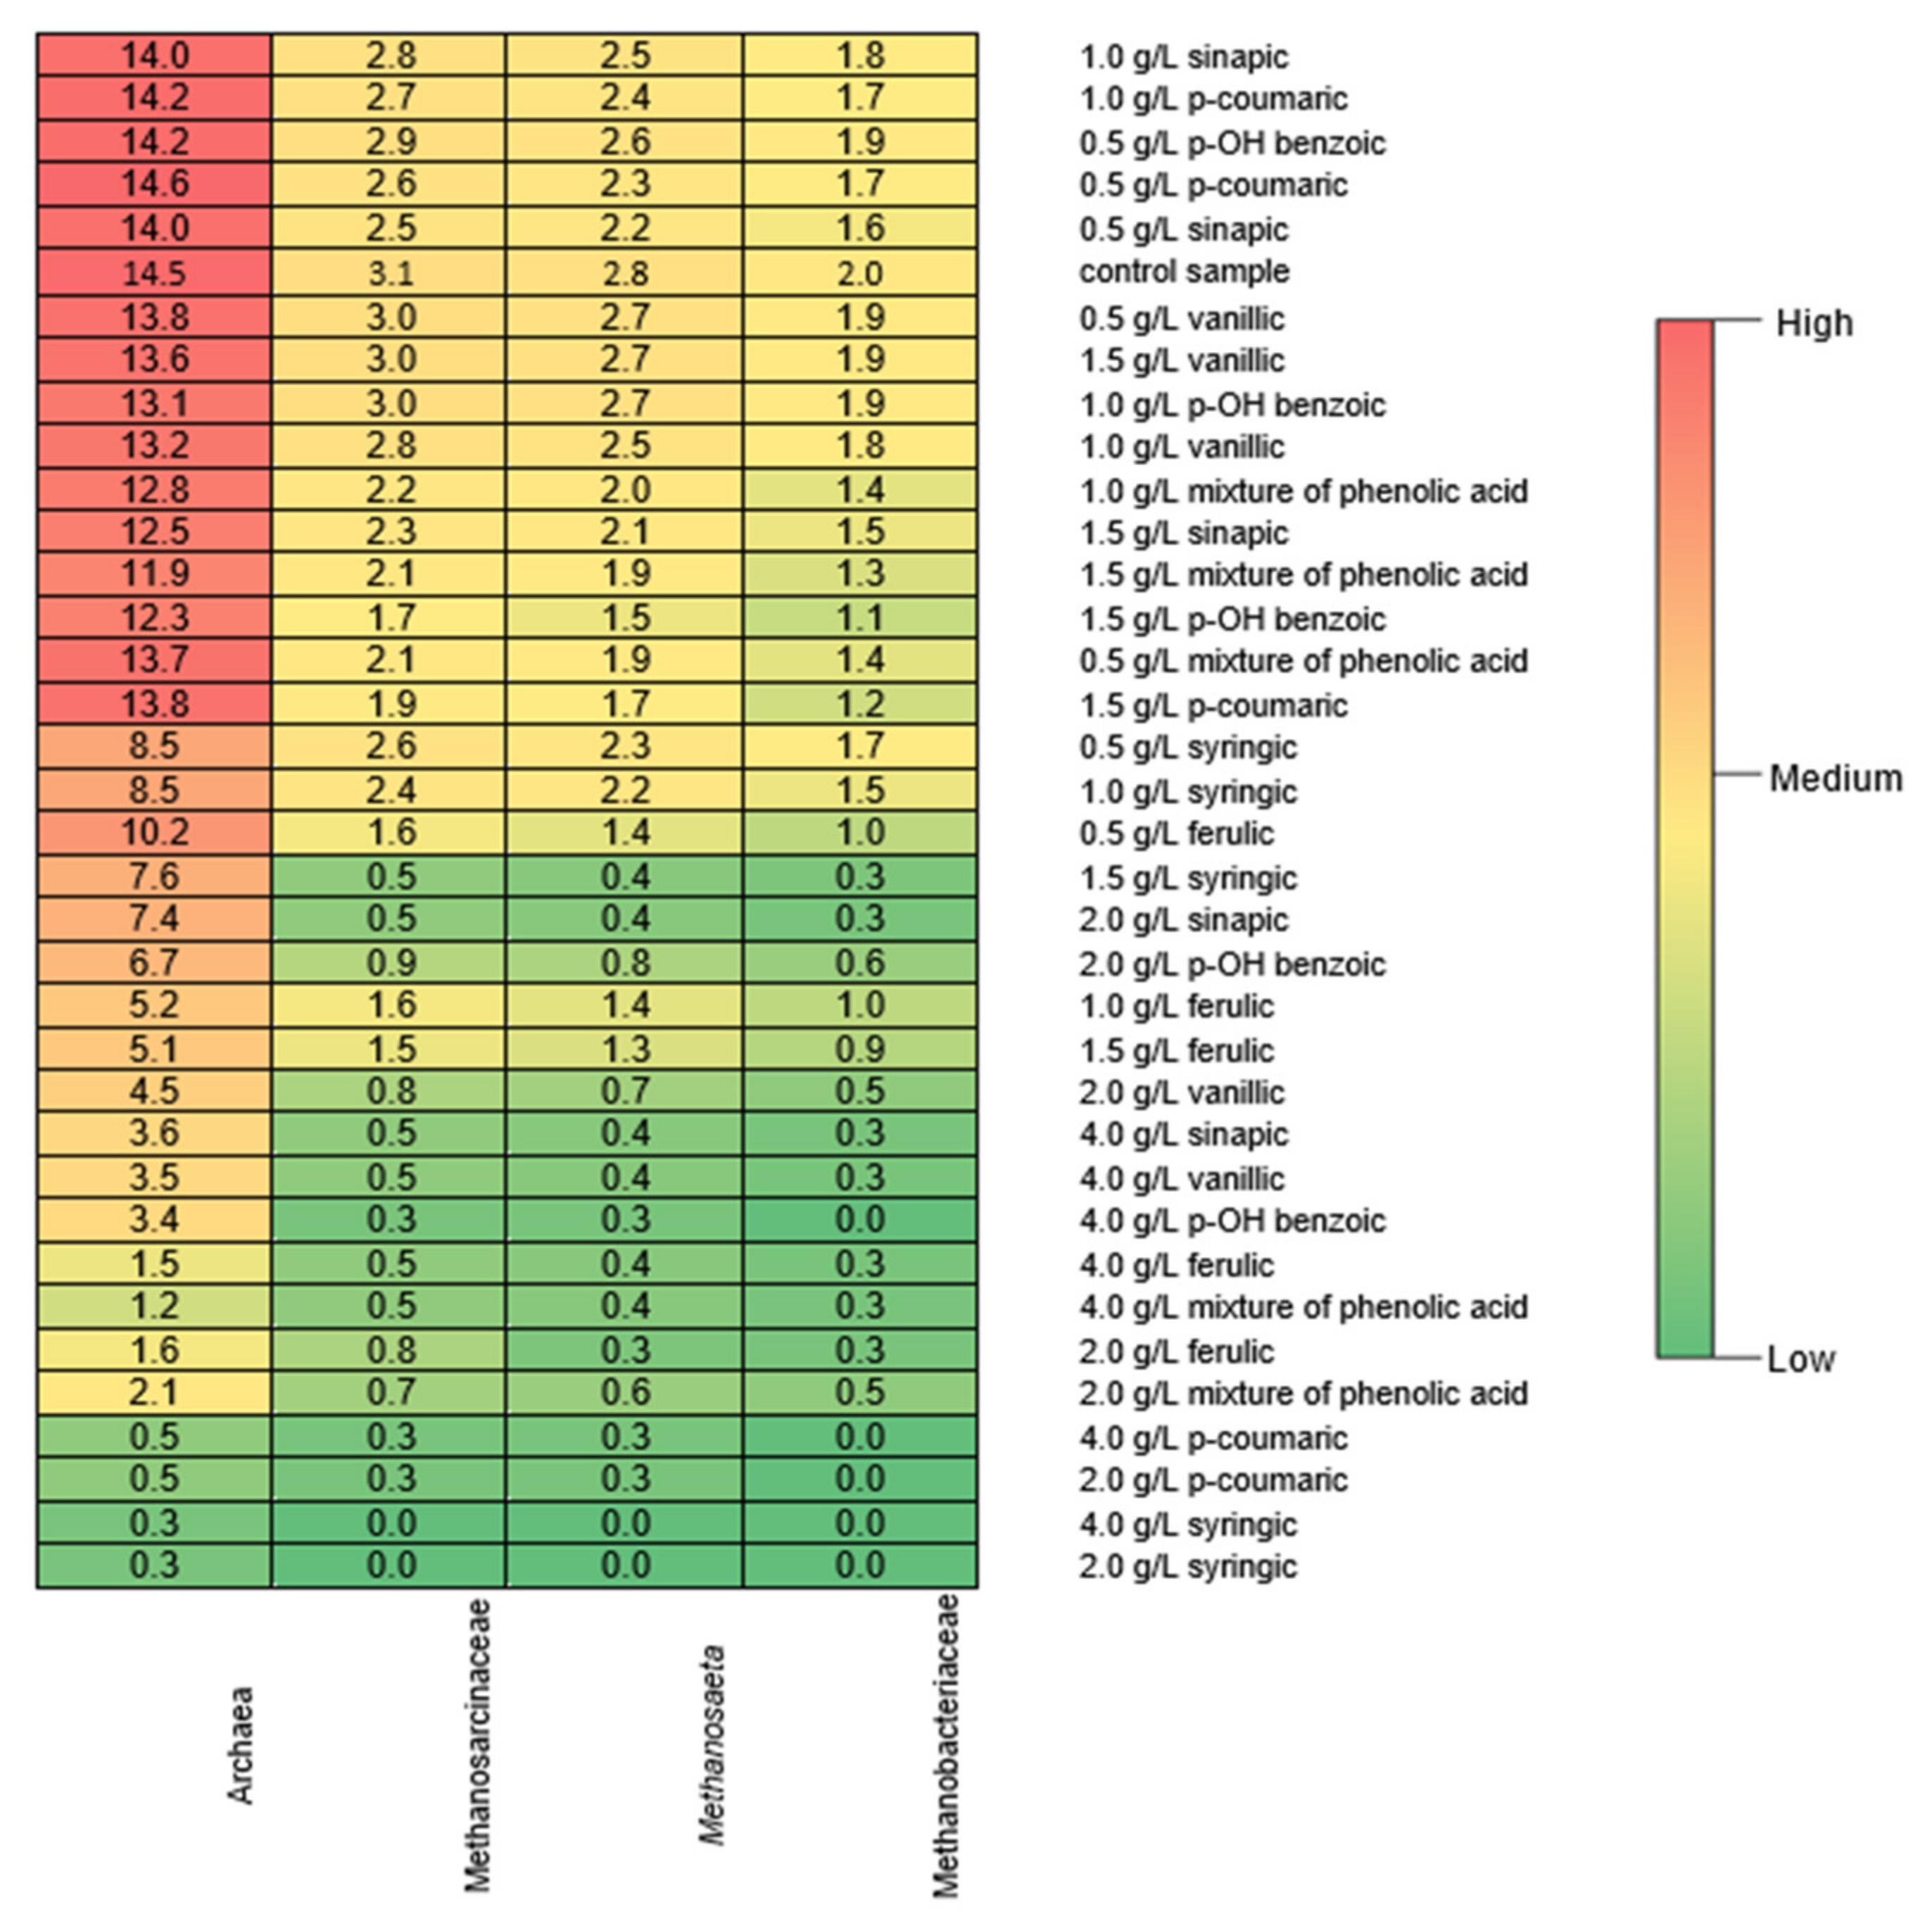
In the control sample, the abundance of Archaea was 14.5%. In the fermented stillage that was spiked with 0.5–1.5 g/L of sinapic, p-coumaric, vanillic, or p-OH benzoic acids or the mixture of acids, their abundance remained at a similar level (Figure 5). However, even at these low concentrations of syringic and ferulic acids, their abundance decreased to 7.6 and 5.1%, respectively. For all the phenolic acids and their mixture, increases in their concentrations to 2.0 and 4.0 g/L reduced the abundance of Archaea. This reduction was most noticeable (up to 30 times) with p-coumaric, syringic, and ferulic acids. Although no strong correlation between the phenolic acid concentration and the abundance of Archaea was observed, phenolic acids significantly affected the quantity and quality of biogas, which was strongly dependent on the abundance of particular Archaea.
In fermented distillery stillage, the acetoclastic methanogens (Methanosarcinaceae and Methanosaeta) and hydrogenotrophic methanogens (Methanobacteriaceae) most commonly present in fermented biomass were detected. Methanosarcinaceae can use hydrogen and carbon dioxide, methylated compounds, and acetate for methane generation [53]. They have a low affinity for acetate but have a shorter doubling time than Methanosaeta. Therefore, in this study, at a high concentration of VFAs, Methanosarcinaceae predominated over Methanosaeta. Methanosarcina is mainly responsible for methane production, because it is resistant to various stressors (a high concentration of ammonium salt or temperature variations) [54]. Therefore, in this study, methane production did not significantly decrease when 0.5–1.0 g/L of phenolic acids was present. Then, the abundances of Methanosarcinaceae, Methanosaeta, and Methanobacteriaceae were 3.0–1.6%, 2.7–1.4%, and 1.9–1.0% of the total microbial population, respectively. At a phenolic acid concentration of 1.5 g/L, a decrease in the abundance of these microorganisms was observed. Similarly, however, changes in the microbial community structure were observed for 0.5 g/L of phenols [55]; the methanogenic activity was maintained with phenol concentrations increasing to 2 g/L. This was related to the increasing abundance of Methanoculleus at the expense of Methanosarcina. In the present study, a large decrease in the Archaea abundance at 2.0 and 4.0 g/L (the abundance as low as 0.5% of total microbial content) resulted in an inhibition of methane production.
The methane production by hydrogenotrophic methanogens utilizes hydrogen [56]. A decrease in the abundance of hydrogenotrophic methanogens (Methanobacteriaceae) because of biomass exposition to phenolic acids (concentrations above 1.5 g/L) in the present study could have increased the hydrogen partial pressure. As a result, the inhibition of acetogenic bacteria could have occurred, which severely disturbs the balance between VFA-producing and VFA-consuming microorganisms [57]. This caused an accumulation of VFAs (above two times higher than in the control series) in the present study. High hydrogen partial pressure could also have been the reason for the inhibition of acetoclastic methanogens. This was proved by Cazier et al. [58] by increasing the abundance of these microorganisms after CO2 addition and could have been the reason for the complete inhibition of methane production in the present study at phenolic acid contents above 2.0 or 4.0 g/L.
In series 1 and 2, the abundance of Methanosarcinaceae and Methanosaeta was higher than that of Methanobacteriaceae; therefore, it can be assumed that the acetoclastic pathways dominated over the hydrogenotrophic pathways in the utilization of distillery stillage containing phenolic acids. These observations indicate that, despite shifts in the microbial community structure, the deterioration of anaerobic digestion performance was observed at phenol concentrations above 2 g/L. In contrast, at concentrations of 2 g/L, shifts in microbial community resulted in the high level of adaptability of archaeal and bacterial communities to toxic compounds [55]. Similarly, the significance of the adaptation to phenols was pointed out in studies on the digestion of olive mill wastewater; methane production increased by 280% because of biomass adaptation [32]. In the batch tests in the present study, the adaptation of methanogenic Archaea to high concentrations of phenolic acids was not observed. However, the present study suggests that the changes in the abundance of methanogens may account for early warning microbial indicators of the inhibition of anaerobic digestion by the presence of polyphenols.
3.4. Statistical Analysis
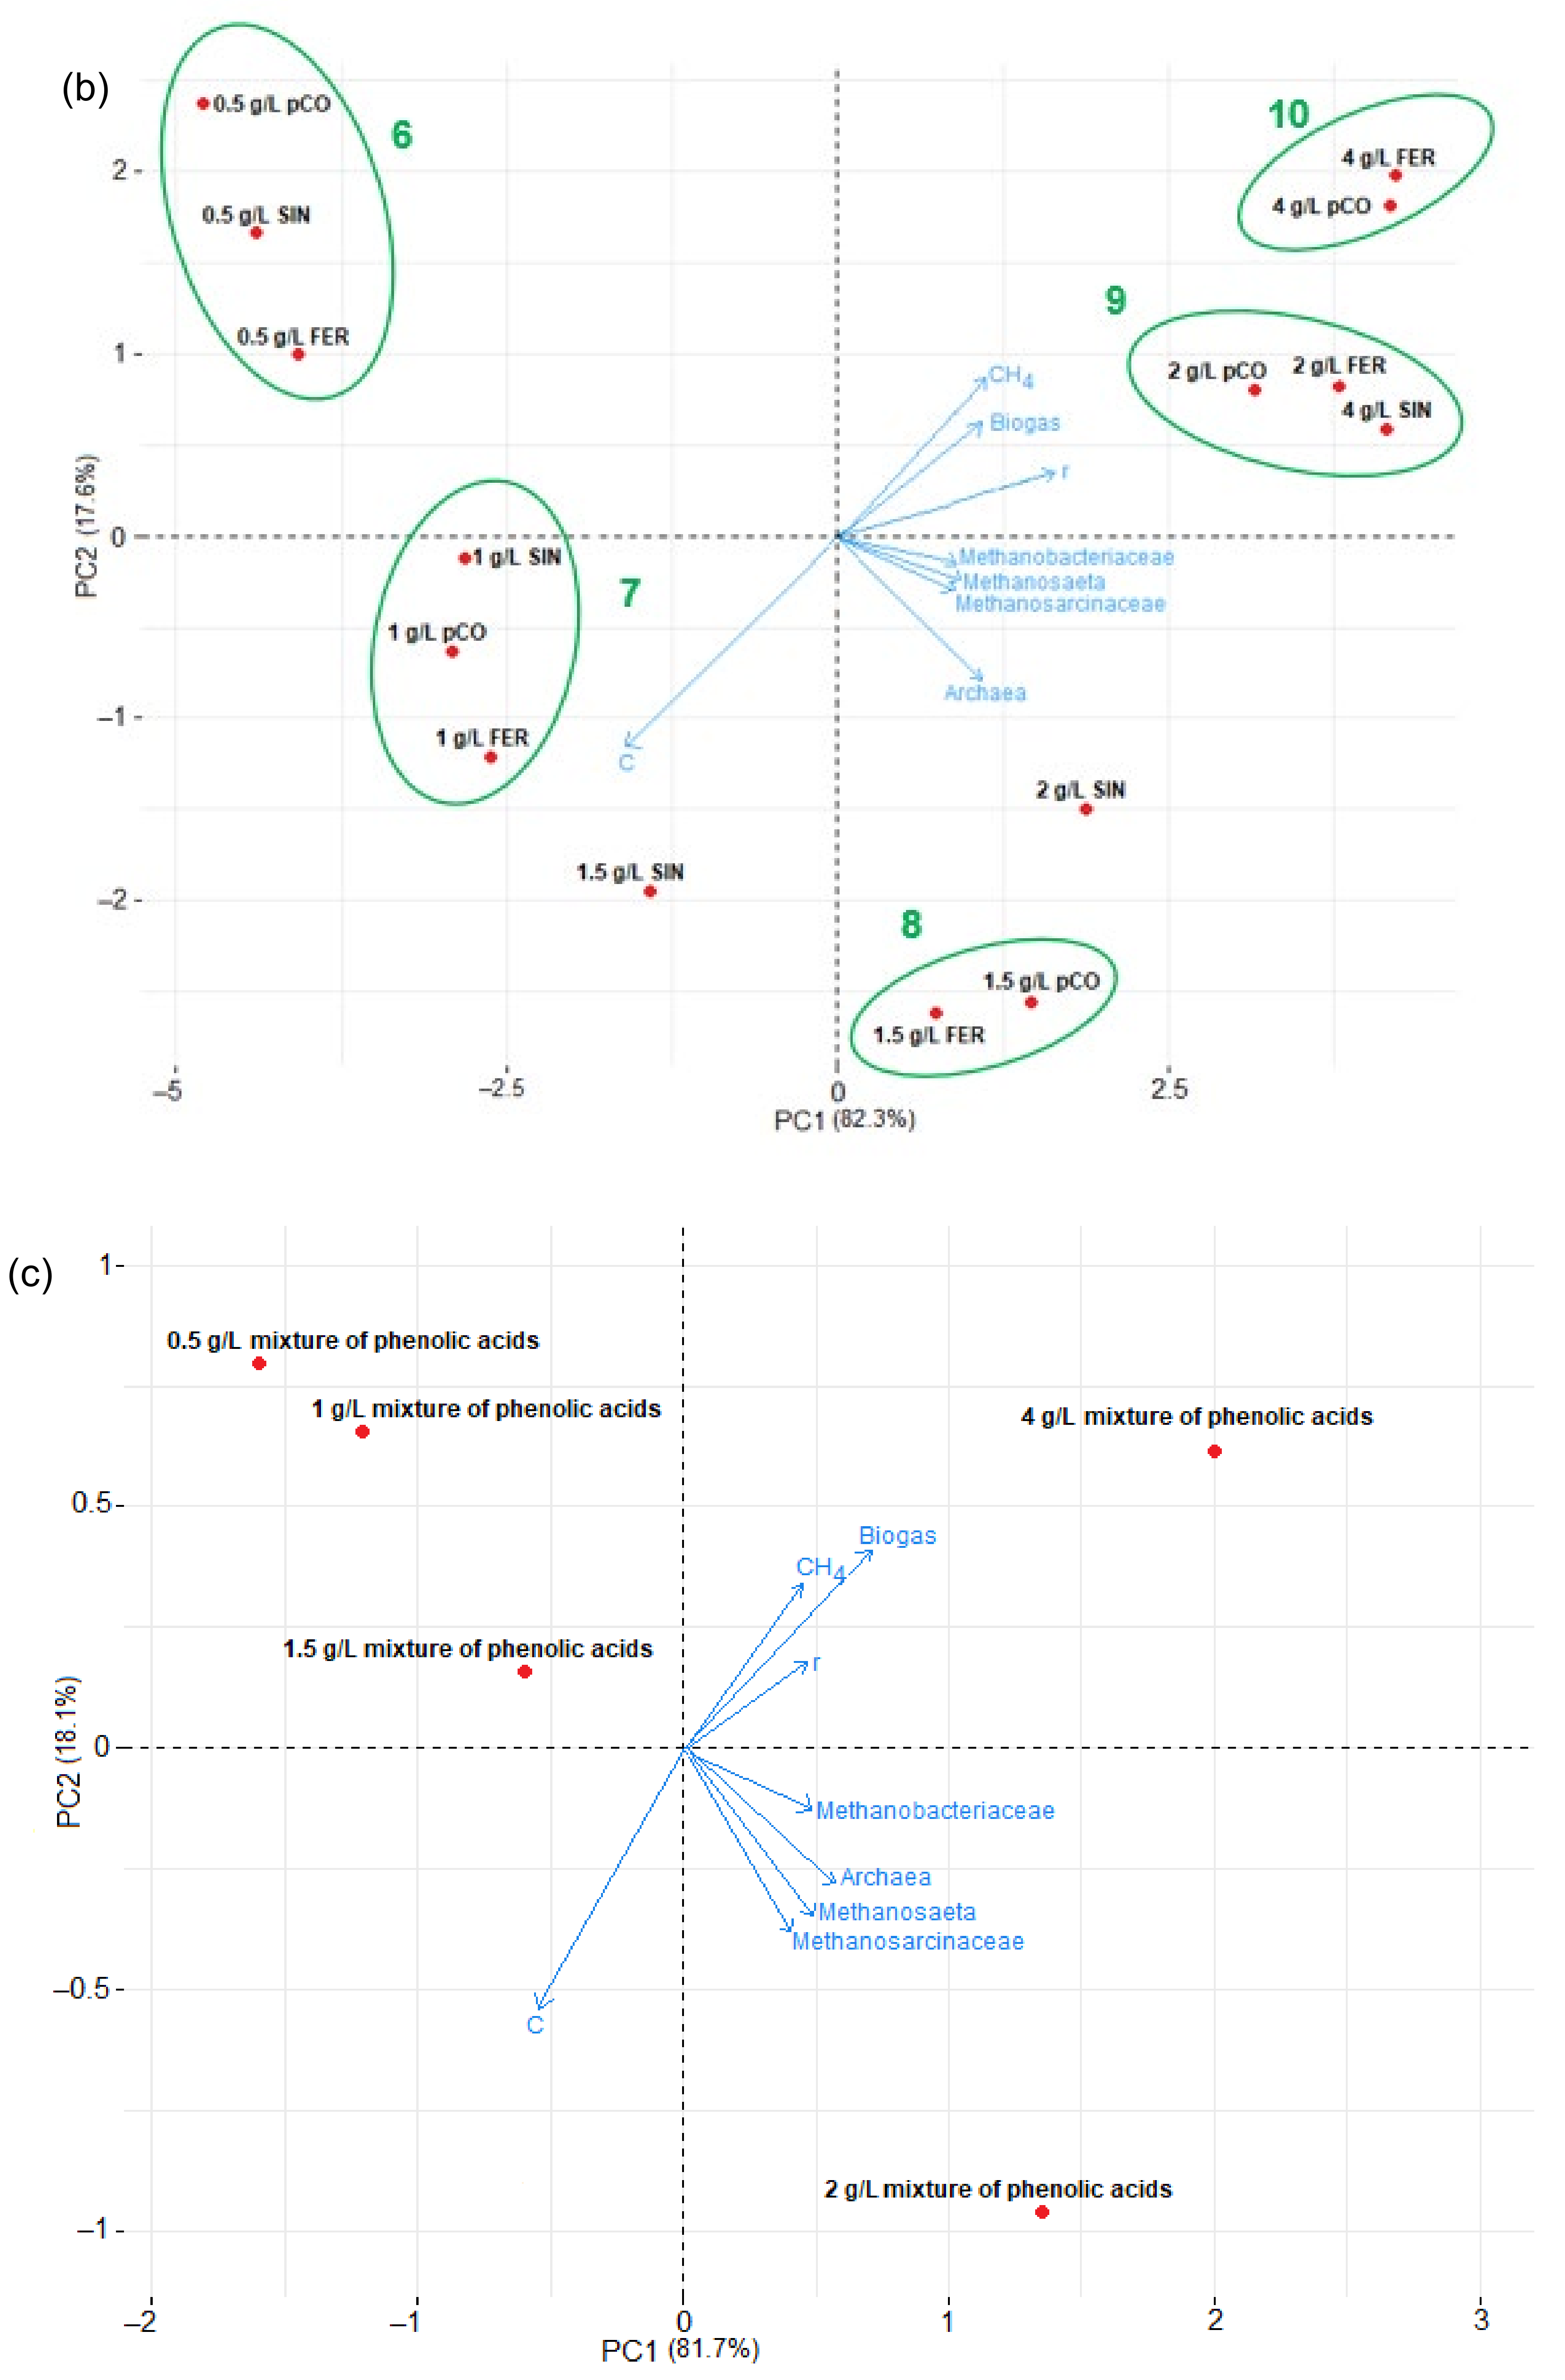
A PCA was performed to show the extent to which phenolic acids inhibit the abundance of the microorganisms participating in the bio-methanization of the distillery stillage and diminish the amount of biogas produced (Figure 6).
The PCA was shown in three plots: hydroxybenzoic acids (Poh—p-OH benzoic acid, VAN—vanillic acid, SYR—syringic acid) (Figure 6a), hydroxycinnamic acids (pCO—p-coumaric acid, FER—ferulic acid, SIN—sinapic acid) (Figure 6b), and a mixture of phenolic acids (Figure 6c). In each group, the variables were reduced to two main components, which together accounted for about 100% of the total variance of the studied variables. PC1 accounted for a substantially larger amount of the variance than PC2 in each case (PC1: 81.7–82.3%; PC2: 17.4–18.1%).
The position of each variable on the chart describes its relationship with the other variables. Variables that are close to each other are highly correlated. Variables on the same side of the plot are positively correlated, and variables on opposite sides are negatively correlated. Therefore, in general, the concentrations of all individual phenolic acids and the mixture of phenolic acids (shown by a blue arrow C) were negatively correlated with methanogen abundance, biogas, and methane production. In the case of the mixture of phenolic acids, the position of blue arrow C relative to the PC1 axis indicates a lower effect of the concentration on the methanogen abundance and methane production compared to the effect of the concentrations of individual phenolic acids. Considering each concentration (0.5–4.0 g/L) separately, pOH, VAN, SYR, SIN, and a mixture of phenolic acids at 2.0–4.0 g/L and pCO and FER at 1.5–4.0 g/L were grouped on the right side of the plot close to PC1, opposite the cluster representing the pOH, VAN, SYR, SIN, and the mixture of phenolic acids at 0.5–1.5 g/L and pCO and FER at 0.5–1.0 g/L which were close to PC2.
In addition, the effect of the phenolic acids on biogas and methane production was also shown by Euclidean cluster analysis. Five clusters were formed in hydroxybenzoic acids: clusters 1 and 2 (0.5–1.0 g/L of phenolic acids), cluster 3 (1.5 g/L of phenolic acids), and clusters 4 and 5 (2.0–4.0 g/L of phenolic acids) (Figure 6a). In the case of hydroxycinnamic acids, five clusters were observed: cluster 6 (0.5 g/L of phenolic acids), cluster 7 (1.0 g/L of phenolic acids), cluster 8 (1.5 g/L of phenolic acids), and clusters 9 and 10 (2.0–4.0 g/L of phenolic acids) (Figure 6b). Using the PCA plot, it is possible to estimate the parameters with the greatest effect on biogas and methane production by their distance from the starting point (0.0) [59]. Clusters 1, 2, 3, 6, and 7 were grouped on the negative side of the plot relative to PC1. The distance from the starting point was in the following order: cluster 3 > cluster 2 > cluster 7 > cluster 6 > cluster 1. Therefore, the effect of bio-methanization was the smallest in cluster 1 compared to the other clusters. Clusters 4, 5, 8, 9, and 10 were grouped on the positive side of the plot relative to PC1. The distance from the starting point was in the following order: cluster 10 > cluster 9 > cluster 5 > cluster 4 > cluster 8. Therefore, the effect of bio-methanization was the highest in cluster 10 compared to the other clusters. The PCA analysis confirmed that hydroxycinnamic acids had a larger effect on biogas and methane production than hydroxybenzoic acids. However, it is worth noting that the farthest from the starting point were SYR, FER, and pCO at 2.0–4.0 g/L. This strongly reflects the fact that SYR, FER, and pCO, due to their structures, had the greatest inhibitory effect on anaerobic digestion, and they inhibited the growth of the microorganisms participating in the bio-methanization of the distillery stillage the most. Synergistic and antagonistic antioxidant interactions can explain why the samples with similar concentrations of total phenolic compounds displayed different activities. The results of the effect of phenolic acids on biogas production from the stillage suggest that the concentration of these bioactive compounds should be controlled. For this purpose, recovering these compounds, pretreatment techniques [4], or the addition of macro- and micronutrients that can increase the Archaea growth, thus accelerating methanogenesis [60], should be considered.
4. Conclusions
This study analyzed the interactions between the types and concentrations of phenolic acids in distillery stillage, the course of methane fermentation, and the microbial community formed during the anaerobic processing of stillage. Phenolic acids affected the microbial growth, inhibited methanogenesis, and decreased the final efficiency and rate of methane production. This effect was more noticeable when individual acids were added to the stillage than when the mixture was added. A total of 0.5–1.0 g/L of an individual phenolic acid and 1.5 g/L of the phenolic acid mixture resulted in decreasing the methane production rate by half. Vanillic, p-coumaric, syringic, and ferulic acids limited methane production the most; 2.0 g/L of these phenolic acids completely inhibited methane production. These results are valuable for determining the maximum allowable levels of phenolic acids in complex microbiological systems that valorize distillery stillage.
Supplementary Materials
The following supporting information can be downloaded at: www.mdpi.com/article/10.3390/en15155377/s1, Figure S1: Time-course of methane production from distillery stillage with (a) p-OH benzoic, (b) vanillic, (c) ferulic, (d) syringic, (e) p-coumaric, (f) sinapic, (g) mixture of phenolic acids; Table S1: Biogas production; Table S2: Characteristics of digestate in series 1 and 2.
Author Contributions
Conceptualization, W.M. and M.Z.; methodology, W.M. and M.Z.; validation, W.M.; formal analysis, W.M. and M.Z.; investigation, W.M. and M.Z.; writing—original draft preparation, W.M. and M.Z.; writing—review and editing, M.Z.; visualization, W.M. and M.Z.; supervision, M.Z.; project administration, M.Z.; funding acquisition, M.Z. All authors have read and agreed to the published version of the manuscript.
Funding
Project financially supported by the Minister of Education and Science under the program entitled “Regional Initiative of Excellence” for the years 2019–2022, Project No. 010/RID/2018/19, amount of funding 12.000.000 PLN.
Institutional Review Board Statement
Not applicable.
Informed Consent Statement
Not applicable.
Data Availability Statement
Not applicable.
Acknowledgments
Wioleta Mikucka is a recipient of a scholarship from the Programme Interdisciplinary Doctoral Studies in Bioeconomy (POWR.03.02.00-00-I034/16-00), which is funded by the European Social Fund.
Conflicts of Interest
The authors declare no competing financial interest.
References
- Fito, J.; Tefera, N.; Kloos, H.; van Hulle, S.W.H. Physicochemical properties of the sugar industry and ethanol distillery wastewater and their impact on the environment. Sugar Tech. 2019, 21, 265–277. [Google Scholar] [CrossRef]
- Jimenez, A.M.; Borja, R.; Martin, A. Aerobic/anaerobic biodegradation of beet molasses alcoholic fermentation wastewater. Process Biochem. 2003, 38, 275–1284. [Google Scholar] [CrossRef]
- Pereira, M.C.; Oliveira, D.A.; Hill, L.E.; Zambiazi, R.C.; Borges, C.D.; Vizzotto, M.; Mertens-Talcott, S.; Talcott, S.; Gomes, C.L. Effect of nanoencapsulation using PLGA on antioxidant and antimicrobial activities of guabiroba fruit phenolic extract. Food Chem. 2018, 240, 396–404. [Google Scholar] [CrossRef] [PubMed]
- Elalami, D.; Carrere, H.; Abdelouahdi, K.; Garcia-Bernet, D.; Peydecastaing, J.; Vaca-Medina, G.; Oukarroum, A.; Zeroual, Y.; Barakat, A. Mild microwaves, ultrasonic and alkaline pretreatments for improving methane production: Impact on biochemical and structural properties of olive pomace. Bioresour. Technol. 2020, 299, 122591. [Google Scholar] [CrossRef]
- Caroca, E.; Serrano, A.; Borja, R.; Jimenez, A.; Carvajal, A.; Braga, A.F.M.; Rodriguez-Gutierrez, G.; Fermoso, F.G. Influence of phenols and furans released during thermal pretreatment of olive mill solid waste on its anaerobic digestion. Waste Manag. 2021, 120, 202–208. [Google Scholar] [CrossRef] [PubMed]
- Hernandez, J.E.; Edyvean, R.G.J. Inhibition of biogas production and biodegradability by substituted phenolic compounds in anaerobic sludge. J. Hazard. Mater. 2008, 160, 20–28. [Google Scholar] [CrossRef]
- El Gnaoui, Y.; Sounni, F.; Bakraoui, M.; Karouach, F.; Benlemlih, M.; Barz, M.; El Bari, H. Anaerobic co-digestion assessment of olive mill wastewater and food waste: Effect of mixture ratio on methane production and process stability. J. Environ. Chem. Eng. 2020, 8, 103874. [Google Scholar] [CrossRef]
- El Achkar, J.H.; Lendormi, T.; Hobaika, Z.; Salameh, D.; Louka, N.; Maroun, R.G.; Lanoisellé, J.-L. Anaerobic digestion of nine varieties of grape pomace: Correlation between biochemical composition and methane production. Biomass Bioenergy 2017, 107, 335–344. [Google Scholar] [CrossRef]
- Dong, D.; Wang, R.; Geng, P.; Li, C.; Zhao, Z. Enhancing effects of activated carbon supported nano zero-valent iron on anaerobic digestion of phenol-containing organic wastewater. J. Environ. Manag. 2019, 244, 1–12. [Google Scholar] [CrossRef]
- Baddi, G.A.; Cegarra, J.; Merlina, G.; Revel, J.C.; Hafidi, M. Qualitative and quantitative evolution of polyphenolic compounds during composting of an olive-mill waste-wheat straw mixture. J. Hazard. Mater. 2009, 165, 1119–1123. [Google Scholar] [CrossRef]
- Serrano, A.; Fermoso, F.G.; Rodríguez-Gutierrez, G.; Fernandez-Bolanos, J.; Borja, R. Biomethanization of olive mill solid waste after phenols recovery through low-temperature thermal pre-treatment. Waste Manag. 2017, 61, 229–235. [Google Scholar] [CrossRef] [PubMed] [Green Version]
- Sagar, N.A.; Pareek, S.; Sharma, S.; Yahia, E.M.; Lobo, M.G. Fruit and vegetable waste: Bioactive compounds, their extraction, and possible utilization. Compr. Rev. Food Sci. Food Saf. 2018, 17, 512–531. [Google Scholar] [CrossRef] [PubMed] [Green Version]
- Barbera, M. Reuse of food waste and wastewater as a source of polyphenolic compounds to use as food additives. J. AOAC Int. 2020, 103, 906–914. [Google Scholar] [CrossRef]
- Ifie, I.; Marshall, L.J. Food processing and its impact on phenolic constituents in food. Cogent Food Agric. 2018, 4, 1507782. [Google Scholar] [CrossRef]
- Kaushik, A.; Basu, S.; Raturi, S.; Batra, V.S.; Balakrishnan, M. Recovery of antioxidants from sugarcane molasses distillery wastewater and its effect on biomethanation. J. Water Process. Eng. 2018, 25, 205–211. [Google Scholar] [CrossRef]
- Mikucka, W.; Zielinska, M.; Bulkowska, K.; Witonska, I. Recovery of polyphenols from distillery stillage by microwave-assisted, ultrasound-assisted and conventional solid-liquid extraction. Sci. Rep. 2022, 12, 3232. [Google Scholar] [CrossRef] [PubMed]
- Hierholtzer, A.; Chatellard, L.; Kierans, M.; Akunna, J.C.; Collier, P.J. The impact and mode of action of phenolic compounds extracted from brown seaweed on mixed anaerobic microbial cultures. J. Appl. Microbiol. 2013, 114, 964–973. [Google Scholar] [CrossRef]
- Oliveira, J.V.; Costa, J.C.; Cavaleiro, A.J.; Pereira, M.A.; Alves, M.M. Effect of Endogenous Methane Production: A Step Forward in the Validation of Biochemical Methane Potential (BMP) Tests. Energies 2022, 15, 4696. [Google Scholar] [CrossRef]
- Tsigkou, K.; Tsafrakidou, P.; Kopsahelis, A.; Zagklis, D.; Zafiri, C.; Kornaros, M. Used disposable nappies and expired food products valorisation through one- & two-stage anaerobic co-digestion. Renew. Energy 2020, 147, 610–619. [Google Scholar] [CrossRef]
- American Public Health Association (APHA). Standard Methods for the Examination of Water and Wastewater, 18th ed.; American Water Works Association (AWWA) and Water Pollution Control Federation (WPCF): Washington, DC, USA, 1992. [Google Scholar]
- Capson-Tojo, G.; Moscoviz, R.; Astals, S.; Robles, A.; Steyer, J.P. Unraveling the literature chaos around free ammonia inhibition in anaerobic digestion. Renew. Sust. Energ. Rev. 2020, 117, 109487. [Google Scholar] [CrossRef]
- Singletion, V.L.; Orthofer, R.; Lamuela-Raventos, R.M. Analysis of total phenols and other oxidation substrates and antioxidants by means of Folin-Ciocalteu reagent. Meth. Enzymol. 1999, 299, 52–178. [Google Scholar] [CrossRef]
- Nielsen, P.H.; Nguyen, H.T.T.; McIlroy, S.; Mielczarek, A.T.; Seviour, R. Identification and quantification of microorganisms in activated sludge and biofilms by FISH. In FISH Handbook for Biological Wastewater Treatment: Identification and Quantification of Microorganisms in Activated Sludge and Biofilms; Nielsen, P.D., Daim, H., Eds.; IWA Publishing: London, UK, 2009; pp. 25–31. [Google Scholar]
- Stahl, D.A.; Amann, R. Development and application of nucleic acid probes in bacterial systematics. In Nucleic Acid Techniques in Bacterial Systematics; Stackebrandt, E., Goodfellow, M., Eds.; John Wiley & Sons Ltd.: Chichester, UK, 1991; pp. 205–248. [Google Scholar]
- Raskin, L.; Poulsen, L.K.; Noguera, D.R.; Rittmann, B.E.; Stahl, D.A. Quantification of methanogenic groups in anaerobic biological reactors by oligonucleotide probe hybridization. Appl. Environ. Microbiol. 1994, 60, 1241–1248. [Google Scholar] [CrossRef] [Green Version]
- Westerholm, M.; Hansson, M.; Schnürer, A. Improved biogas production from whole stillage by co-digestion with cattle manure. Bioresour. Technol. 2012, 114, 314–319. [Google Scholar] [CrossRef] [PubMed]
- Eskicioglu, C.; Kennedy, K.J.; Marin, J.; Strehler, B. Anaerobic digestion of whole stillage from dry-grind corn ethanol plant under mesophilic and thermophilic conditions. Bioresour. Technol. 2011, 102, 1079–1086. [Google Scholar] [CrossRef] [PubMed]
- Kang, X.; Lin, R.; Li, L.; Wu, B.; Deng, C.; O’Shea, R.; Sun, Y.; Murphy, J.D. Assessment of pretreatment and digestion temperature on anaerobic digestion of whiskey byproducts and microbial taxonomy. Energy Convers. Manag. 2021, 243, 114331. [Google Scholar] [CrossRef]
- Kang, X.; Lin, R.; Wu, B.; Li, L.; Deng, C.; Rajendran, K.; Sun, Y.; O’Shea, R.; Murphy, J.D. Towards green whiskey production: Anaerobic digestion of distillery by-products and the effects of pretreatment. J. Clean. Prod. 2022, 357, 131844. [Google Scholar] [CrossRef]
- Wu, L.; Hu, X.; Wang, S.; Hasan, M.M.; Jiang, S.; Zhang, L.; Li, C.Z. Reaction behaviour of light and heavy components of bio-oil in methanol and in water. Fuel 2018, 232, 645–652. [Google Scholar] [CrossRef]
- Chapleur, O.; Madigou, C.; Civade, R.; Rodolphe, Y.; Mazéas, L.; Bouchez, T. Increasing concentrations of phenol progressively affect anaerobic digestion of cellulose and associated microbial communities. Biodegradation 2016, 27, 15–27. [Google Scholar] [CrossRef]
- Calabrò, P.S.; Fòlino, A.; Tamburino, V.; Zappia, G.; Zema, D.A. Increasing the tolerance to polyphenols of the anaerobic digestion of olive wastewater through microbial adaptation. Biosyst. Eng. 2018, 172, 19–28. [Google Scholar] [CrossRef]
- Kaparaju, P.; Serrano, M.; Angelidaki, I. Optimization of biogas production from wheat straw stillage in UASB reactor. Appl. Energy 2010, 87, 3779–3783. [Google Scholar] [CrossRef]
- Djukic-Vukovic, A.P.; Mojovic, L.V.; Vukasinovic-Sekulic, M.S.; Nikolic, S.B.; Pejin, J.D. Integrated production of lactic acid and biomass on distillery stillage. Bioprocess Biosyst. Eng. 2013, 36, 1157–1164. [Google Scholar] [CrossRef] [PubMed]
- Battimelli, A.; Torrijos, M.; Moletta, R.; Delgenès, J.P. Slaughterhouse fatty waste saponification to increase biogas yield. Bioresour. Technol. 2010, 101, 3388–3393. [Google Scholar] [CrossRef] [PubMed]
- Asztalos, J.R.; Kim, Y. Enhanced digestion of waste activated sludge using microbial electrolysis cells at ambient temperature. Water Res. 2015, 87, 503–512. [Google Scholar] [CrossRef] [PubMed]
- Mathew, S.; Abraham, T.E. Bioconversions of ferulic acid, an hydroxycinnamic acid. Crit. Rev. Microbiol. 2006, 32, 115–125. [Google Scholar] [CrossRef] [PubMed]
- Brown, D.; Shi, J.; Li, Y.B. Comparison of solid state to liquid anaerobic digestion of lignocellulosic feedstocks for biogas production. Bioresour. Technol. 2012, 384, 379–386. [Google Scholar] [CrossRef] [PubMed]
- Gunaseelan, V.N. Biochemical methane potential of fruits and vegetable solid waste feedstocks. Biomass Bioenergy 2004, 26, 389–399. [Google Scholar] [CrossRef]
- Sanchez-Maldonado, A.F.; Schieber, A.; Ganzle, M.G. Structure-function relationships of the antibacterial activity of phenolic acids and their metabolism by lactic acid bacteria. J. Appl. Microbiol. 2011, 111, 1176–1184. [Google Scholar] [CrossRef]
- Alara, O.R.; Abdurahman, N.H.; Ukaegbu, C.I. Extraction of phenolic compounds: A review. Curr. Res. Nutr. Food Sci. 2021, 4, 200–214. [Google Scholar] [CrossRef]
- Adeboye, P.T.; Bettiga, M.; Olsson, L. The chemical nature of phenolic compounds determines their toxicity and induces distinct physiological responses in Saccharomyces cerevisiae in lignocellulose hydrolysates. AMB Express 2014, 4, 46. [Google Scholar] [CrossRef] [Green Version]
- Monlau, F.; Sambusiti, C.; Barakat, A.; Quéméneur, M.; Trably, E.; Steyer, J.P.; Carrere, H. Do furanic and phenolic compounds of lignocellulosic and algae biomass hydrolyzate inhibit anaerobic mixed cultures? A comprehensive review. Biotechnol. Adv. 2014, 32, 934–951. [Google Scholar] [CrossRef]
- Kumar, N.; Goel, N. Phenolic acids: Natural versatile molecules with promising therapeutic applications. Biotechnol. Rep. 2019, 24, e00370. [Google Scholar] [CrossRef] [PubMed]
- Olguin-Lora, P.; Puig-Grajales, L.; Razo-Flores, E. Inhibition of the acetoclastic methanogenic activity by phenol and alkyl phenols. Environ. Technol. 2003, 24, 999–1006. [Google Scholar] [CrossRef]
- Wang, L.; Wang, A. Adsorption properties of congo red from aqueous solution onto N,O-carboxymethyl-chitosan. Bioresour. Technol. 2008, 99, 1403–1408. [Google Scholar] [CrossRef]
- Fang, W.; Zhang, P.; Zhang, G.; Jin, S.; Li, D.; Zhang, M.; Xu, X. Effect of alkaline addition on anaerobic sludge digestion with combined pretreatment of alkaline and high pressure homogenization. Bioresour. Technol. 2014, 168, 167–172. [Google Scholar] [CrossRef] [PubMed]
- Dogan, T.; Ince, O.; Oz, N.Y.; Ince, B. Inhibition of volatile fatty acid production in granular sludge from a UASB reactor. Environ. Technol. 2005, 40, 633–644. [Google Scholar] [CrossRef] [PubMed]
- Mao, C.; Feng, Y.; Wang, X.; Ren, G. Review on research achievements of biogas from anaerobic digestion. Renew. Sustain. Energy Rev. 2015, 45, 540–555. [Google Scholar] [CrossRef]
- Yen, H.W.; Yang, Y.C.; Yu, Y.H. Using crude glycerol and thin stillage for the production of microbial lipids through the cultivation of Rhodotorula glutinis. J. Biosci. Bioeng. 2012, 114, 453–456. [Google Scholar] [CrossRef]
- Chen, H.; Wang, W.; Xue, L.; Chen, C.; Liu, G.; Zhang, R. Effects of ammonia on anaerobic digestion of food waste: Process performance and microbial community. Energy Fuels 2016, 30, 5749–5757. [Google Scholar] [CrossRef]
- Chen, Y.; Cheng, J.J.; Creamer, K.S. Inhibition of anaerobic digestion process: A review. Bioresour. Technol. 2008, 99, 4044–4064. [Google Scholar] [CrossRef] [PubMed]
- Karakashev, D.; Batstone, D.J.; Trably, E.; Angelidaki, I. Acetate oxidation is the dominant methanogenic pathway from acetate in the absence of Methanosaetaceae. Appl. Environ. Microbiol. 2006, 72, 5138–5141. [Google Scholar] [CrossRef] [Green Version]
- Dai, X.; Yan, H.; Li, N.; He, J.; Ding, Y.; Dai, L.; Dong, B. Metabolic adaptation of microbial communities to ammonium stress in a high solid anaerobic digester with dewatered sludge. Sci. Rep. 2016, 6, 28193. [Google Scholar] [CrossRef] [PubMed] [Green Version]
- Poirier, S.; Bize, A.; Bureau, C.; Bouchez, T.; Chapleur, O. Community shifts within anaerobic digestion microbiota facing phenol inhibition: Towards early warning microbial indicators? Water Res. 2016, 100, 296–305. [Google Scholar] [CrossRef] [PubMed]
- Alsouleman, K.; Linke, B.; Klang, J.; Klocke, M.; Krakat, N.; Theuerl, S. Reorganisation of a mesophilic biogas microbiome as response to a stepwise increase of ammonium nitrogen induced by poultry manure supply. Bioresour. Technol. 2016, 208, 200–204. [Google Scholar] [CrossRef] [PubMed]
- Zhu, X.; Zhou, P.; Chen, Y.; Liu, X.; Li, D. The role of endogenous and exogenous hydrogen in the microbiology of biogas production systems. World J. Microbiol. Biotechnol. 2020, 36, 79. [Google Scholar] [CrossRef] [PubMed]
- Cazier, E.A.; Trably, E.; Steyer, J.P.; Escudie, R. Reversibility of hydrolysis inhibition at high hydrogen partial pressure in dry anaerobic digestion processes fed with wheat straw and inoculated with anaerobic granular sludge. Waste Manag. 2019, 85, 498–505. [Google Scholar] [CrossRef] [PubMed]
- Hardle, W.; Simar, L. Applied Multivariate Statistical Analysis, 2nd ed.; Springer: Berlin/Heidelberg, Germany, 2007. [Google Scholar]
- Xiao, L.; Zheng, S.; Lichtfouse, E.; Luo, M.; Tan, Y.; Liu, F. Carbon nanotubes accelerate acetoclastic methanogenesis: From bure cultures to anaerobic soils. Soil Biol. Biochem. 2020, 150, 107938. [Google Scholar] [CrossRef]
Figure 1.
Cumulative methane production at the end of the experiments.
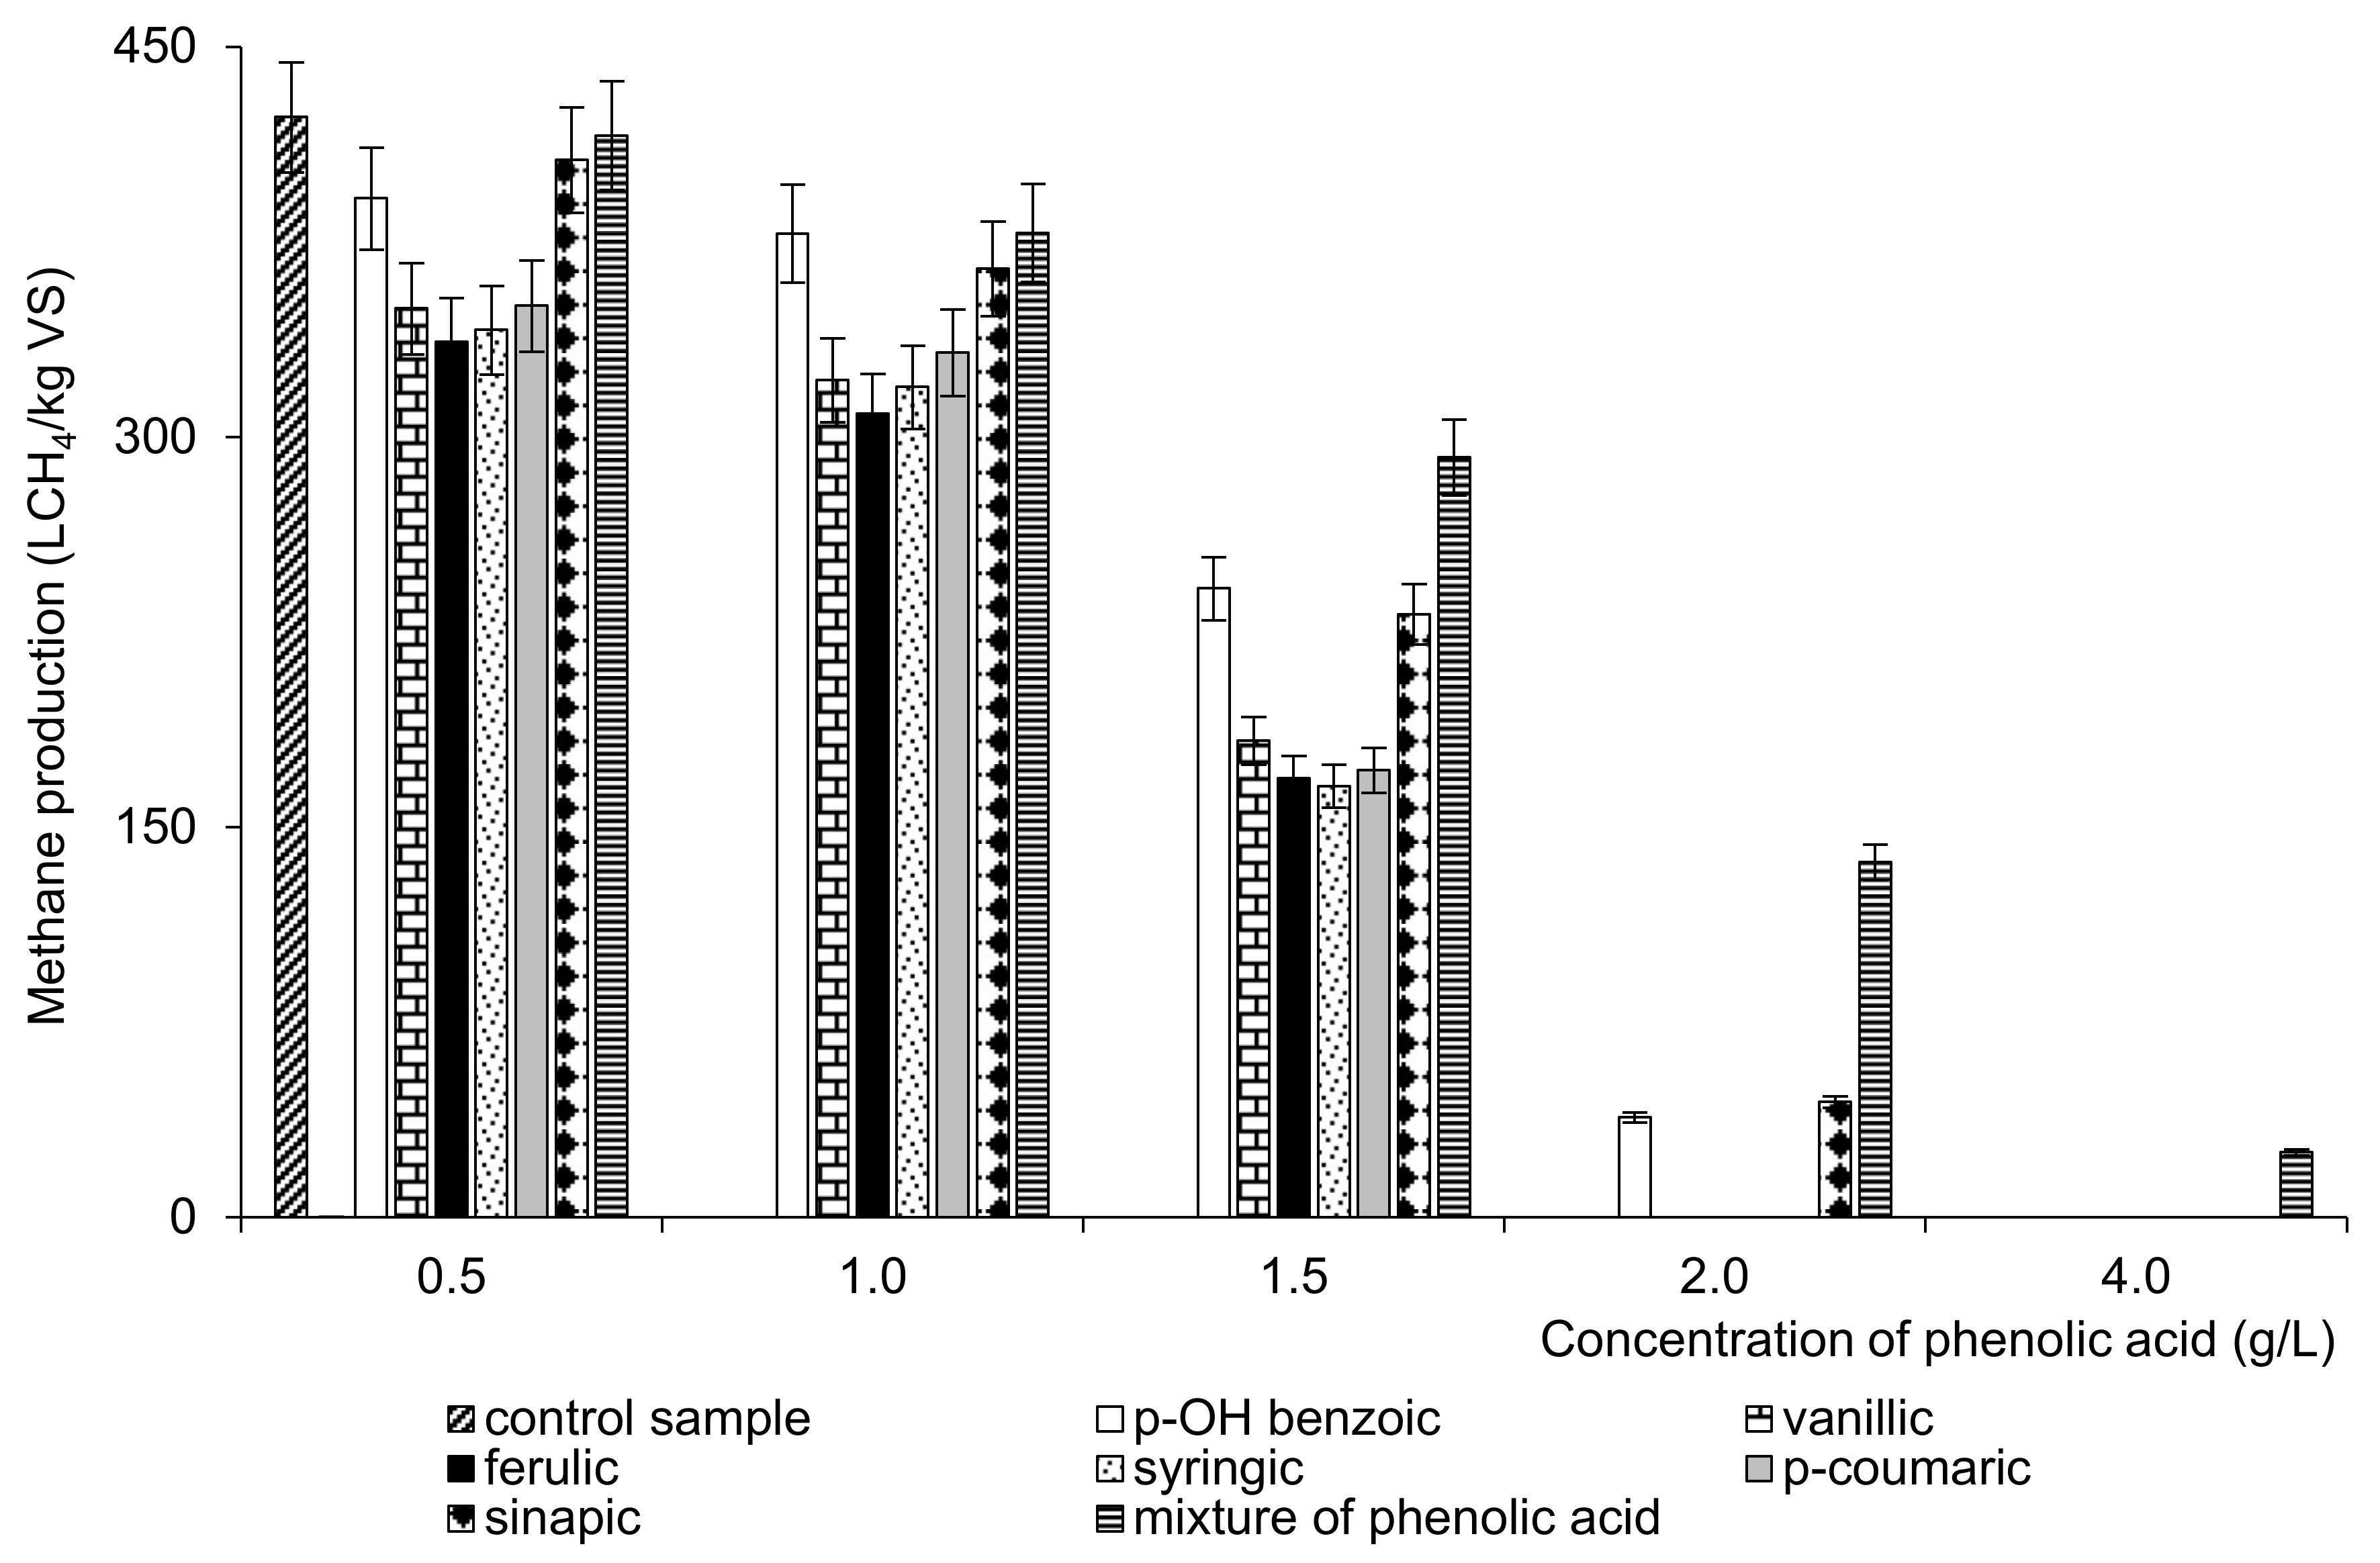
Figure 2.
Percentage of methane and carbon dioxide in the biogas. Grouping was based on hierarchical agglomerative clustering. The percentage of methane and carbon dioxide is represented by a color (light blue means lower value; dark blue means higher value). The color key is indicated in the legend in the top left of the plot, along with the count of the same case in each titer.
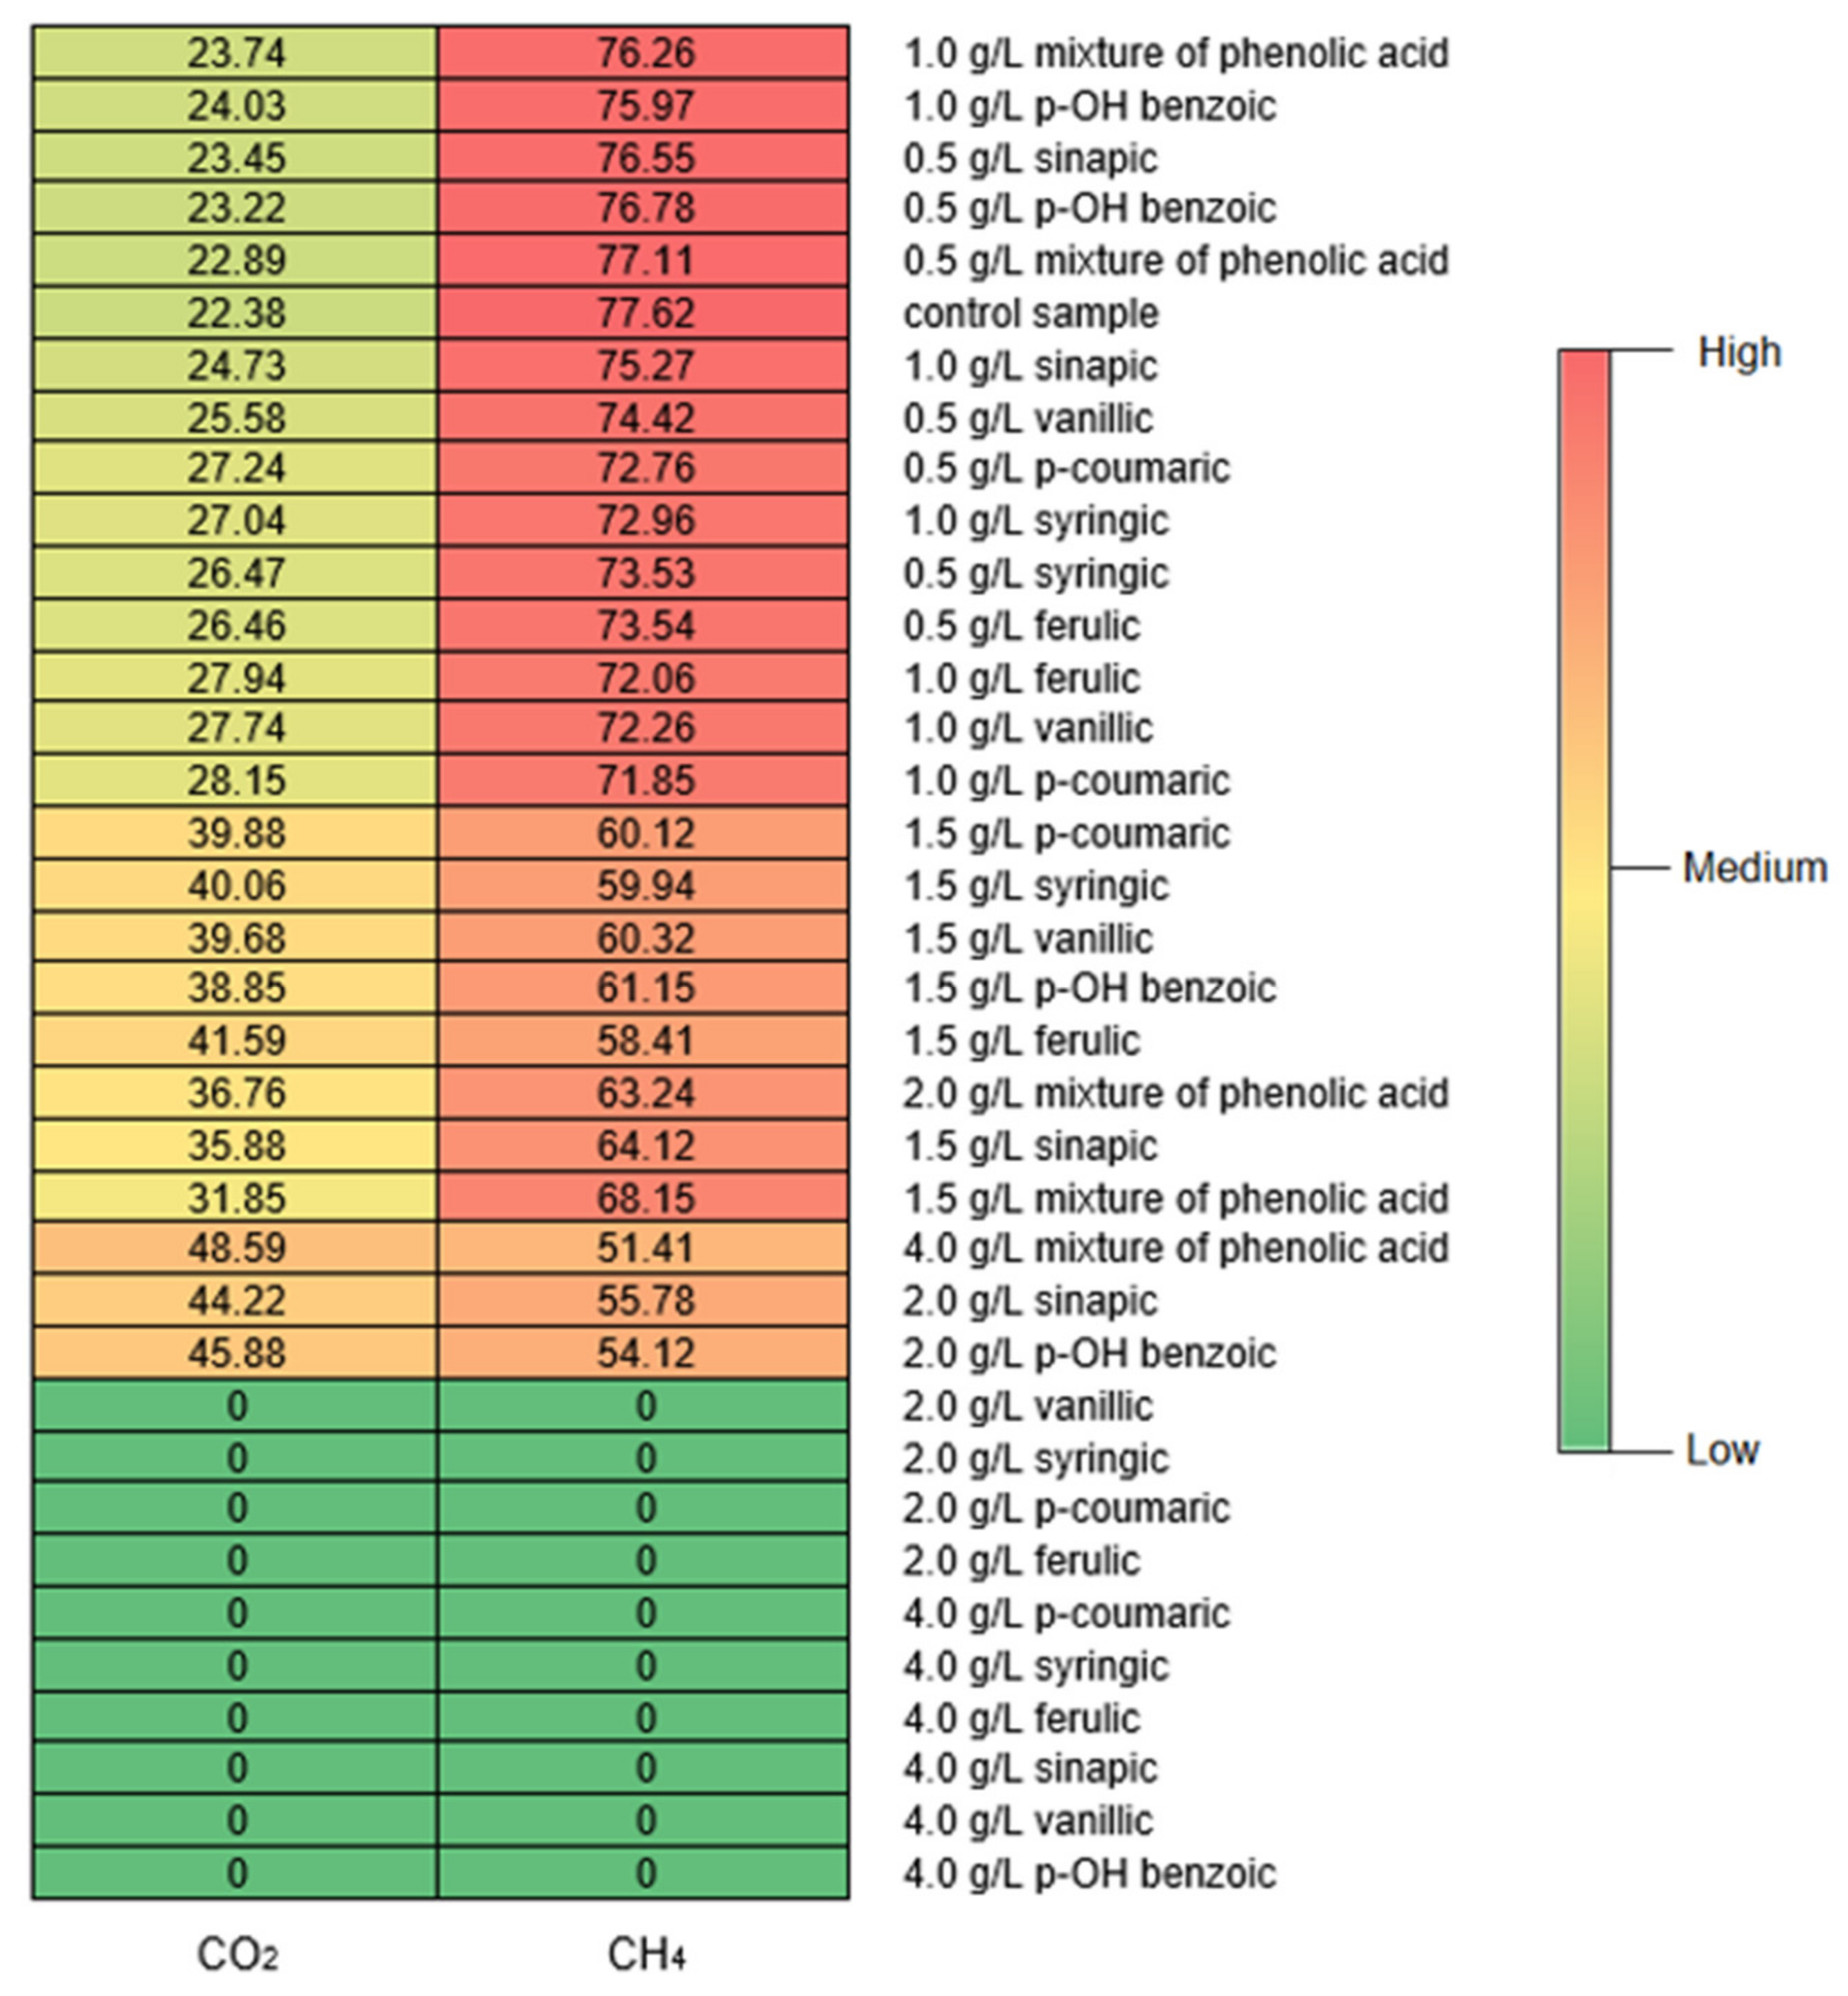
Figure 3.
Methane production rates vs. initial concentrations of phenolic acids; (a) p-OH benzoic, (b) vanillic, (c) ferulic, (d) syringic, (e) p-coumaric, (f) sinapic, (g) a mixture of acids.
Figure 3.
Methane production rates vs. initial concentrations of phenolic acids; (a) p-OH benzoic, (b) vanillic, (c) ferulic, (d) syringic, (e) p-coumaric, (f) sinapic, (g) a mixture of acids.
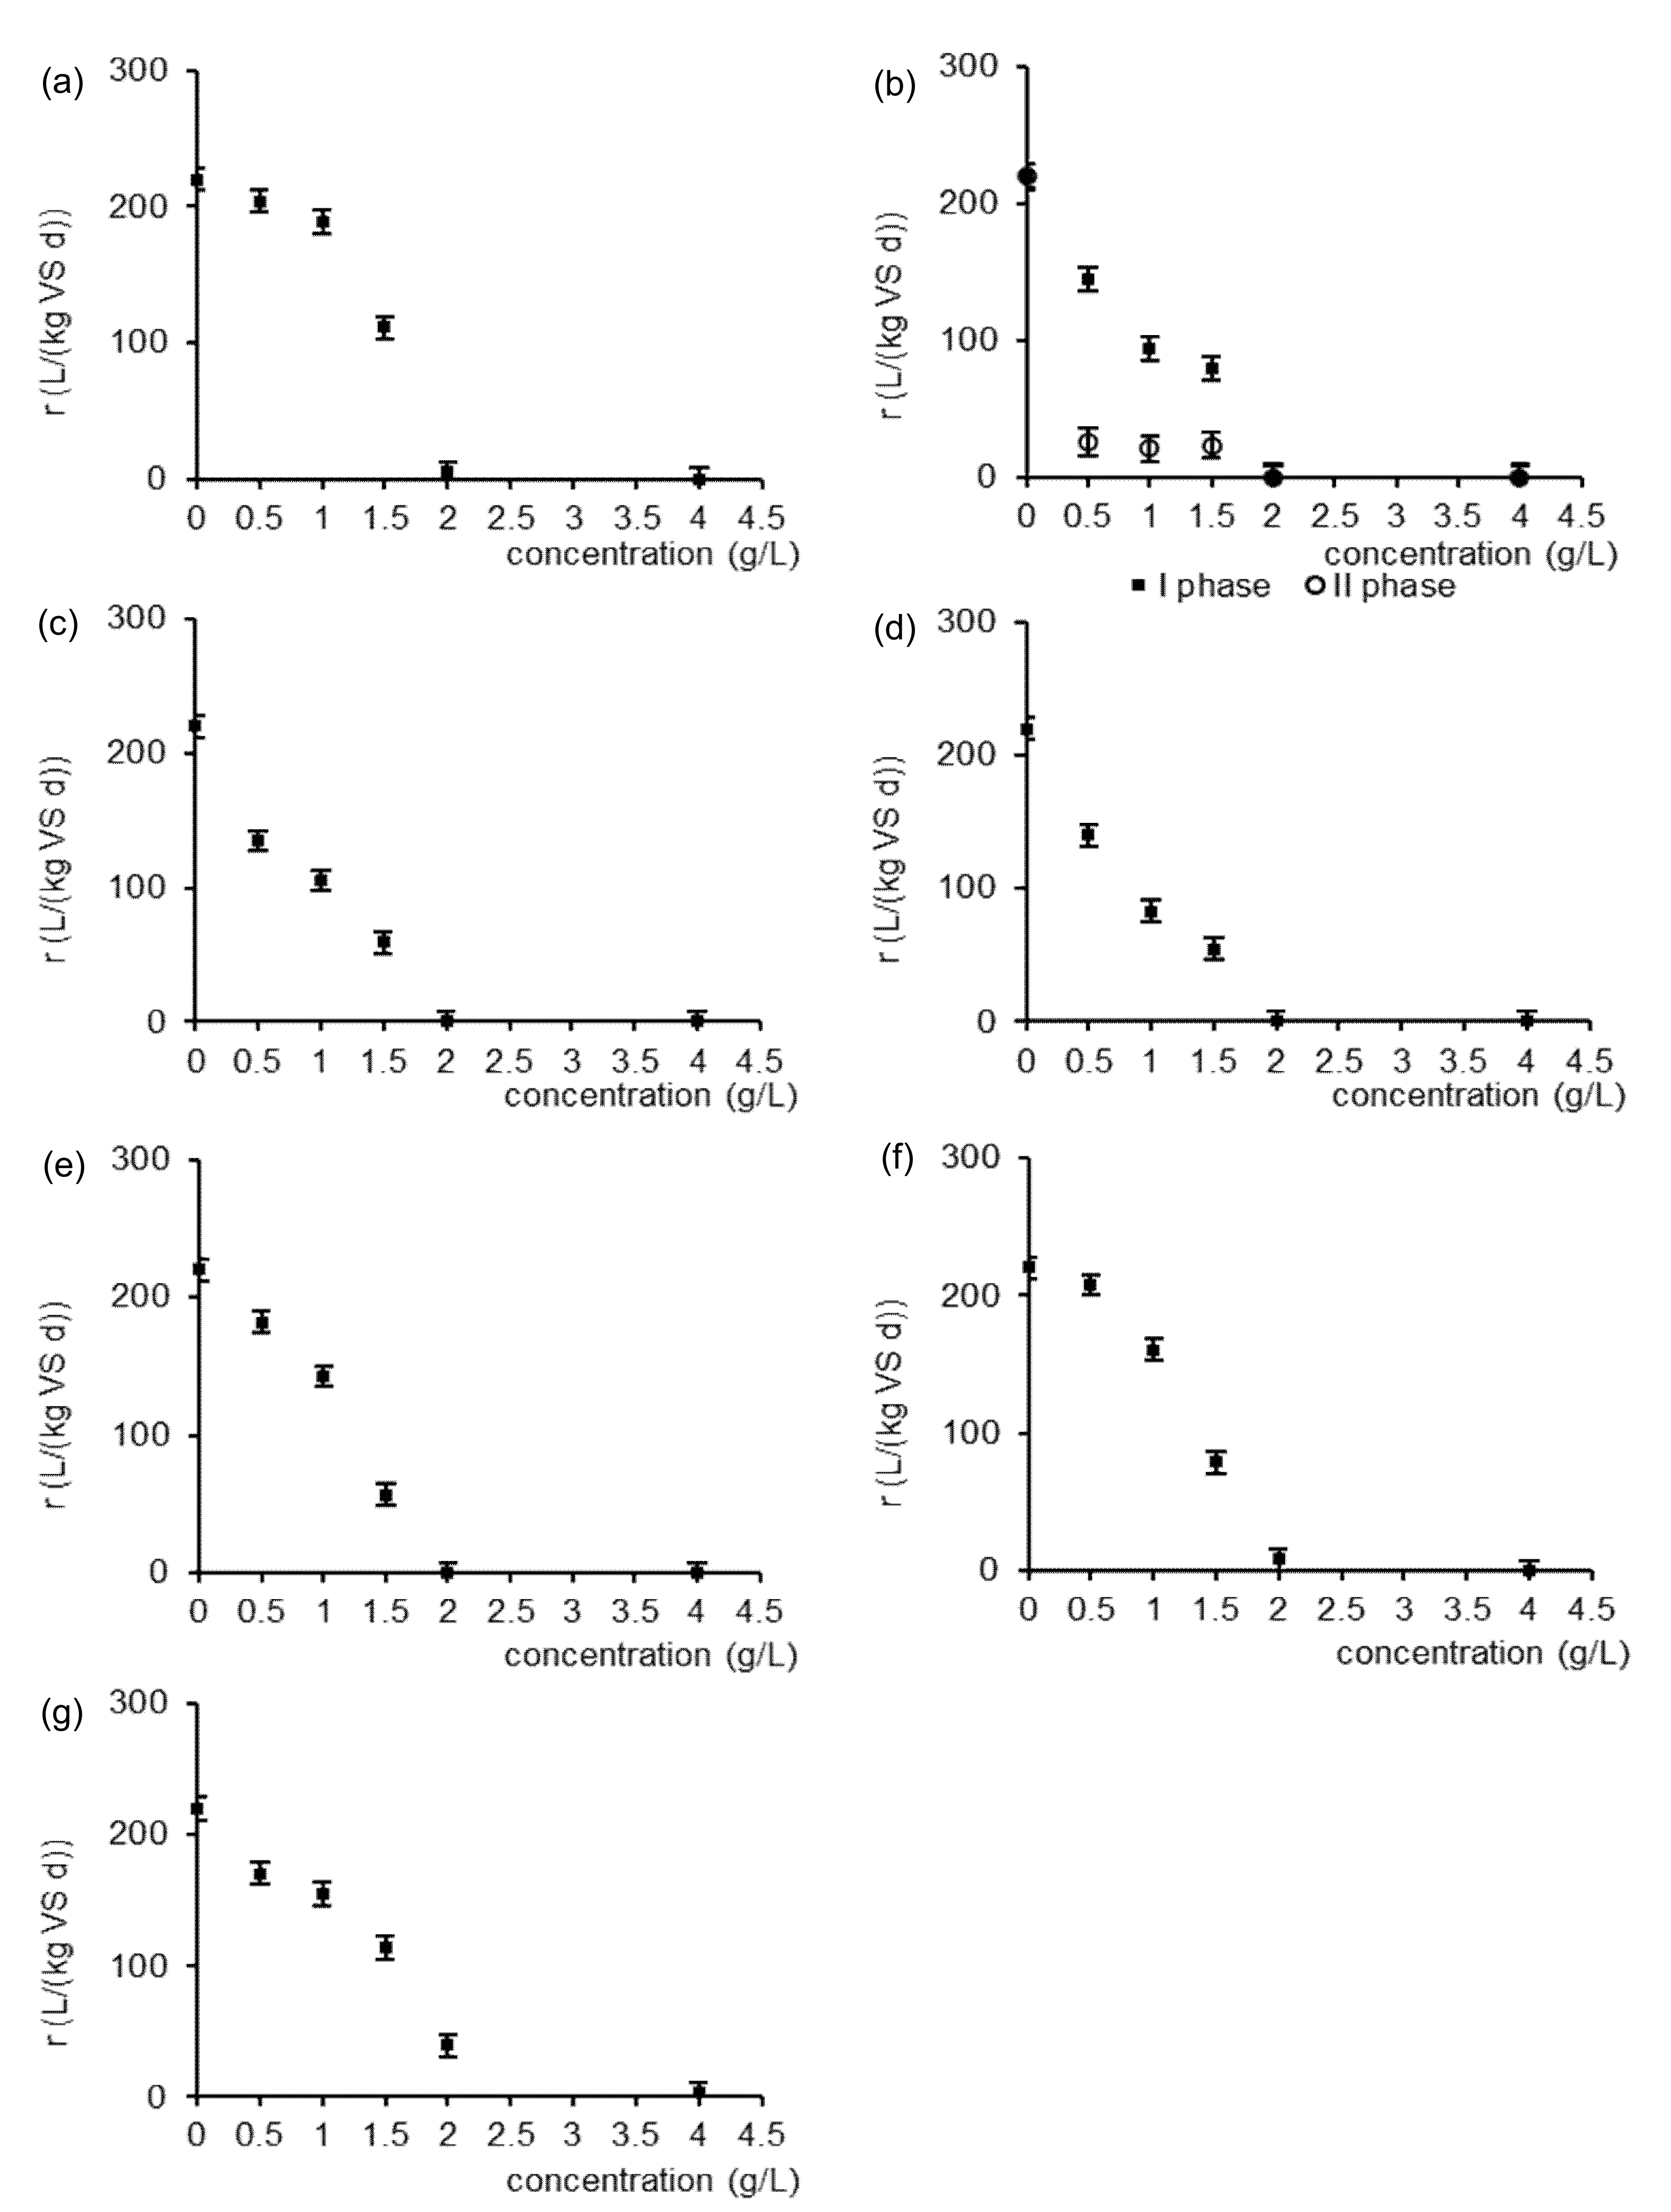
Figure 4.
Percentage of undegraded TPC in digestates.

Figure 5.
Heatmap of the abundance of Archaea and methanogens (%) in digestate. Grouping was based on hierarchical agglomerative clustering. The abundance of Archaea is represented by a color (light blue means lower abundance; dark blue means higher abundance). The color key is indicated in the legend in the top left of the plot along with the count of the abundance of Archaea in each titer.

Figure 6.
PCA of technological and molecular results obtained in anaerobic digestion of distillery stillage depends on the added phenolic acids; (a) hydroxybenzoic acids (pOH—p-OH benzoic acid, VAN—vanillic acid, SYR—syringic acid), (b) hydroxycinnamic acids (pCO—p-coumaric acid, FER—ferulic acid, SIN—sinapic acid), and (c) a mixture of phenolic acids. The red dots indicate the concentrations of compounds. The blue arrows represent the abundance of methanogens, the amount of methane and biogas, the rate of methane production (r), and the concentration of phenolic acids (C).


Table 1.
Characteristics of distillery stillage and inoculum.
| Characteristic | Unit | Distillery Stillage | Inoculum |
|---|---|---|---|
| Total solids (TS) | g/kg | 79.9 ± 3.0 | 61.5 ± 2.9 |
| Ash | g/kg | 3.7 ± 0.4 | 6.1 ± 1.4 |
| Volatile solids (VS) | g/kg | 76.2 ± 2.4 | 55.4 ± 1.9 |
| Organics content | % | 95.4 | 90.1 |
| pH | - | 6.52 ± 0.04 | 7.21 ± 0.01 |
| Total COD | mg/L | 109,000 ± 11,554 | n.m. |
| Soluble COD | mg/L | 43,600 ± 4830 | 8700 ± 347 |
| Volatile fatty acids (VFAs) | mg/L | 789.7 ± 0.8 | 571.2 ± 26.1 |
| Ammonium nitrogen | mg/L | 293.8 ± 4.7 | 162.4 ± 2.5 |
| Total phosphorus (TP) | mg/L | 212.4 ± 0.6 | 331.6 ± 2.0 |
| Alkalinity | meq/L | 182.8 ± 1.4 | 225.2 ± 1.1 |
n.m.—not measured.
Table 2.
Methane potential of distillery stillage spiked with phenolic acids as a percentage of the maximum theoretical methane potential.
Table 2.
Methane potential of distillery stillage spiked with phenolic acids as a percentage of the maximum theoretical methane potential.
| Type of Sample | Percentage of Maximum Theoretical Methane Potential | Type of Sample | Percentage of Maximum Theoretical Methane Potential |
|---|---|---|---|
| control sample | 86.8 | ||
| 0.5 g/L p-OH benzoic | 80.4 | 0.5 g/L ferulic | 69.1 |
| 1 g/L p-OH benzoic | 77.7 | 1 g/L ferulic | 63.4 |
| 1.5 g/L p-OH benzoic | 49.6 | 1.5 g/L ferulic | 34.7 |
| 2 g/L p-OH benzoic | 7.9 | 2 g/L ferulic | 0.0 |
| 4 g/L p-OH benzoic | 0.0 | 4 g/L ferulic | 0.0 |
| 0.5 g/L vanillic | 71.7 | 0.5 g/L syringic | 70.0 |
| 1 g/L vanillic | 66.1 | 1 g/L syringic | 65.5 |
| 1.5 g/L vanillic | 37.6 | 1.5 g/L syringic | 34.0 |
| 2 g/L vanillic | 0.0 | 2 g/L syringic | 0.0 |
| 4 g/L vanillic | 0.0 | 4 g/L syringic | 0.0 |
| 0.5 g/L p-coumaric | 72.0 | 0.5 g/L sinapic | 83.5 |
| 1 g/L p-coumaric | 68.2 | 1 g/L sinapic | 74.9 |
| 1.5 g/L p-coumaric | 35.3 | 1.5 g/L sinapic | 47.6 |
| 2 g/L p-coumaric | 0.0 | 2 g/L sinapic | 9.1 |
| 4 g/L p-coumaric | 0.0 | 4 g/L sinapic | 0.0 |
| 0.5 g/L mixture | 85.4 | ||
| 1 g/L mixture | 77.7 | ||
| 1.5 g/L mixture | 60.0 | ||
| 2 g/L mixture | 28.0 | ||
| 4 g/L mixture | 5.1 |
Table 3.
Parameters of methane production using first-order kinetics.
| Type of Sample | k (1/d) | R2 | C0 (L/kg VS) | Type of Sample | k (1/d) | R2 | C0 (L/kg VS) |
|---|---|---|---|---|---|---|---|
| control sample | 0.52 ± 0.03 | 0.99 | 423 ± 11 | ||||
| 0.5 g/L p-OH benzoic | 0.52 ± 0.02 | 0.99 | 392 ± 9 | 0.5 g/L ferulic | 0.40 ± 0.01 | 0.99 | 337 ± 10 |
| 1 g/L p-OH benzoic | 0.50 ± 0.02 | 0.99 | 378 ± 10 | 1 g/L ferulic | 0.34 ± 0.02 | 0.99 | 309 ± 8 |
| 1.5 g/L p-OH benzoic | 0.46 ± 0.01 | 0.99 | 242 ± 6 | 1.5 g/L ferulic | 0.35 ± 0.01 | 0.98 | 169 ± 6 |
| 2 g/L p-OH benzoic | 0.13 ± 0.01 | 0.99 | 38 ± 1 | 2 g/L ferulic | 0 | 0 | 0 |
| 4 g/L p-OH benzoic | 0 | 0 | 0 | 4 g/L ferulic | 0 | 0 | 0 |
| 0.5 g/L vanillic phase I | 0.98 ± 0.04 | 0.99 | 148 ± 7 | 0.5 g/L syringic | 0.41 ± 0.02 | 0.99 | 341 ± 7 |
| 1 g/L vanillic phase I | 0.72 ± 0.03 | 0.98 | 131 ± 4 | 1 g/L syringic | 0.26 ± 0.01 | 0.99 | 319 ± 8 |
| 1.5 g/L vanillic phase I | 1.38 ± 0.04 | 0.98 | 58 ± 2 | 1.5 g/L syringic | 0.33 ± 0.01 | 0.99 | 166 ± 4 |
| 2 g/L vanillic phase I | 0 | 0 | 0 | 2 g/L syringic | 0 | 0 | 0 |
| 4 g/L vanillic phase I | 0 | 0 | 0 | 4 g/L syringic | 0 | 0 | 0 |
| 0.5 g/L vanillic phase II | 0.13 ± 0.01 | 0.98 | 201 ± 9 | 0.5 g/L p-coumaric | 0.52 ± 0.03 | 0.99 | 350 ± 9 |
| 1 g/L vanillic phase II | 0.11 ± 0.01 | 0.98 | 191 ± 7 | 1 g/L p-coumaric | 0.43 ± 0.02 | 0.99 | 332 ± 7 |
| 1.5 g/L vanillic phase II | 0.19 ± 0.01 | 0.98 | 125 ± 5 | 1.5 g/L p-coumaric | 0.33 ± 0.02 | 0.99 | 172 ± 7 |
| 2 g/L vanillic phase II | 0 | 0 | 0 | 2 g/L p-coumaric | 0 | 0 | 0 |
| 4 g/L vanillic phase II | 0 | 0 | 0 | 4 g/L p-coumaric | 0 | 0 | 0 |
| 0.5 g/L sinapic | 0.51 ± 0.02 | 0.99 | 407 ± 10 | 0.5 g/L mixture | 0.41 ± 0.02 | 0.99 | 416 ± 13 |
| 1 g/L sinapic | 0.44 ± 0.02 | 0.99 | 365 ± 8 | 1 g/L mixture | 0.41 ± 0.01 | 0.99 | 378 ± 8 |
| 1.5 g/L sinapic | 0.34 ± 0.01 | 0.99 | 232 ± 6 | 1.5 g/L mixture | 0.39 ± 0.01 | 0.99 | 292 ± 9 |
| 2 g/L sinapic | 0.19 ± 0.01 | 0.98 | 44 ± 1 | 2 g/L mixture | 0.29 ± 0.01 | 0.99 | 136 ± 4 |
| 4 g/L sinapic | 0 | 0 | 0 | 4 g/L mixture | 0.13 ± 0.01 | 0.99 | 25 ± 1 |
Publisher’s Note: MDPI stays neutral with regard to jurisdictional claims in published maps and institutional affiliations. |
© 2022 by the authors. Licensee MDPI, Basel, Switzerland. This article is an open access article distributed under the terms and conditions of the Creative Commons Attribution (CC BY) license (https://creativecommons.org/licenses/by/4.0/).
Share and Cite
MDPI and ACS Style
Mikucka, W.; Zielinska, M. Individual Phenolic Acids in Distillery Stillage Inhibit Its Biomethanization. Energies 2022, 15, 5377. https://doi.org/10.3390/en15155377
AMA Style
Mikucka W, Zielinska M. Individual Phenolic Acids in Distillery Stillage Inhibit Its Biomethanization. Energies. 2022; 15(15):5377. https://doi.org/10.3390/en15155377
Chicago/Turabian StyleMikucka, Wioleta, and Magdalena Zielinska. 2022. "Individual Phenolic Acids in Distillery Stillage Inhibit Its Biomethanization" Energies 15, no. 15: 5377. https://doi.org/10.3390/en15155377
Note that from the first issue of 2016, this journal uses article numbers instead of page numbers. See further details here.