1. Introduction
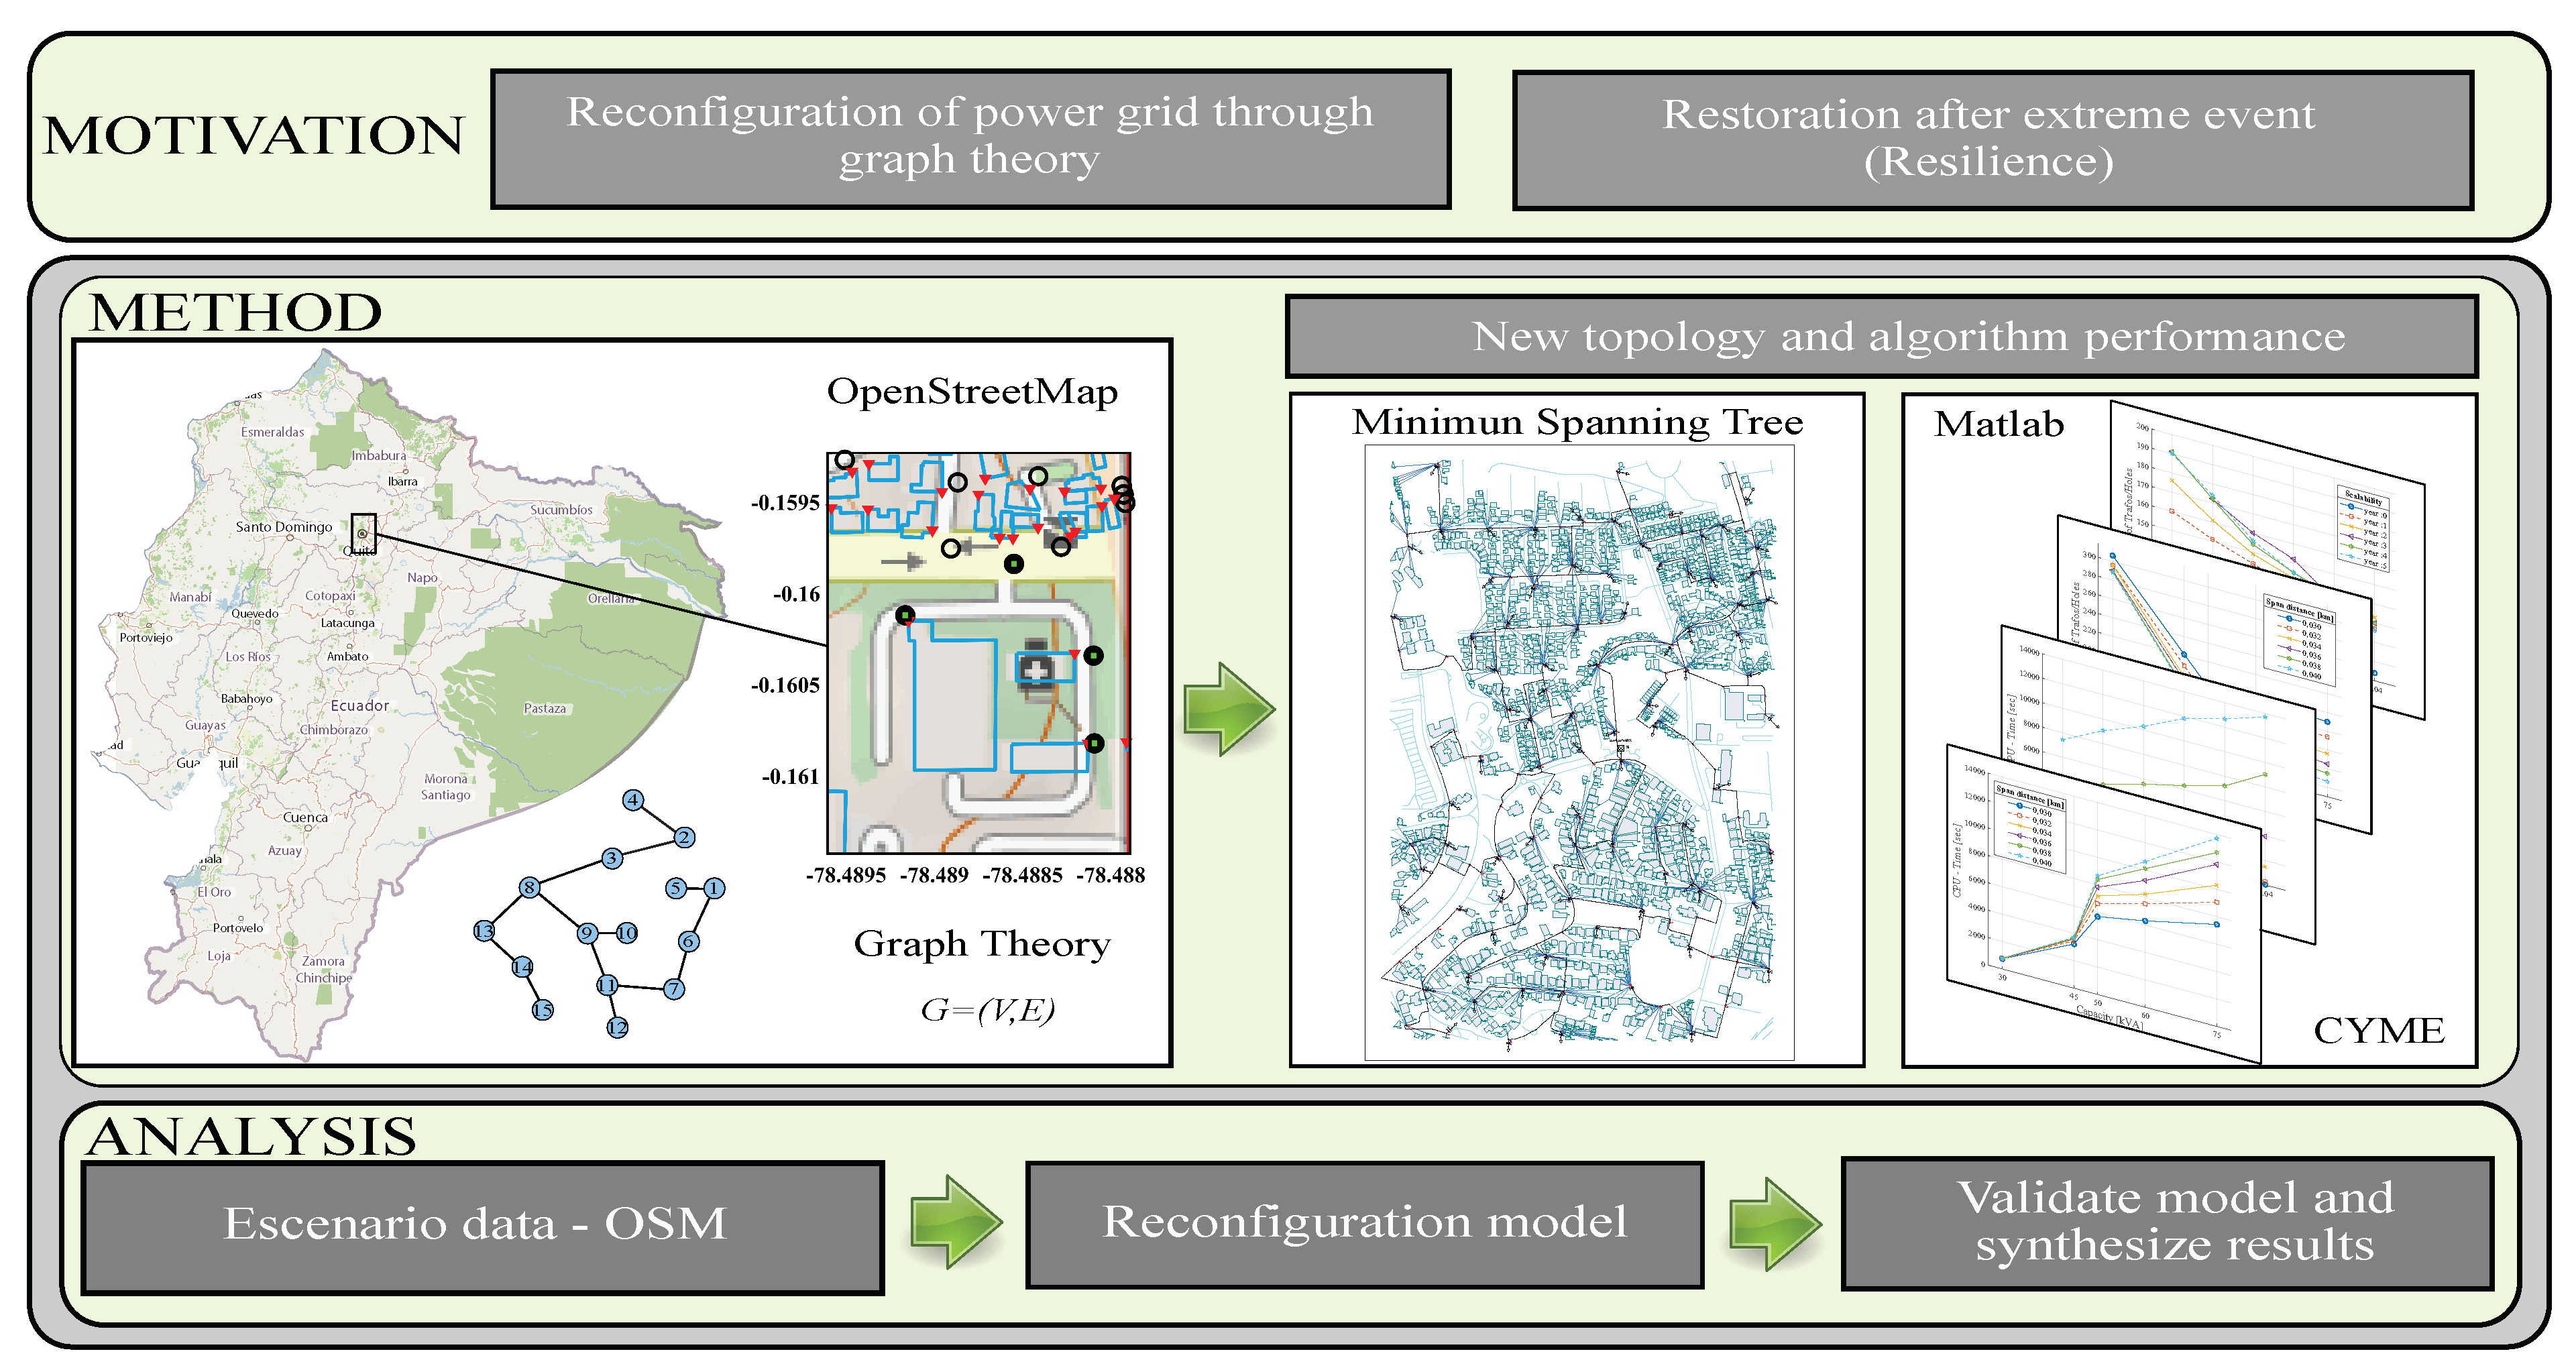
The main aspects of this work are related to the reconfiguration of an electrical network that is required after an extreme event and supported by graph theory to achieve resilience. The proposed heuristic model has the potential to be applied to local utilities considering transformers and the optimal location of the maintenance hole through Prim and Greedy algorithms. Finally, the minimum spanning tree allows reconfiguring the power grid with minimum cost.
The electric power industry has helped the economic progress of the society and the country through the energy matrix [
1]; therefore, electrical systems play a transcendental role in all productive activities. Power systems must be reliable to reduce the number of outages per year. They must also be resilient and recover from adverse conditions. Consequently, utilities are exploring alternatives to strengthen their electrical infrastructure [
2,
3]. Recently, several techniques have been developed to improve electrical distribution networks; due to resilience in the grid, fewer problems related to power quality and grid security arise in the power supply.
Power outages due to extreme conditions have been considered a significant concern by [
4,
5]. Natural disasters, such as earthquakes, can destroy a long stretch of the power grid. In addition, structural damage takes longer to recover from, resulting in temporary long-term failures; furthermore, resilience in power grids is essential to cope with these problems and recover service. Resilience in scientific literature has been defined as the ability of a network to withstand and reduce a disruptive event and recover the lost load supply in a short time [
6]. The resilience of power systems has reduced economic losses from load shedding due to extreme events [
7].
Power distribution networks can consist of overhead power lines or subway cable systems. Overhead networks have a lower degree of resilience. In contrast, cables in subway networks are more protected, and the electrical grid is resilient. Resilience criteria allow anticipating, mitigating, and recovering from adverse conditions as expressed in the following [
8]. Natural catastrophes have a low probability and high impact; therefore, planning models must anticipate and design robust power grids. Damage to service infrastructure following an extreme event often results in islands. Under these conditions, mobile power generation units are often temporarily displaced until service is restored. When the grid infrastructure is unrecoverable, reconfiguration through new connection points is necessary.
A better-structured topology is easier to recover after a contingency. Grid reconfiguration improves the reliability, voltage profile, and electrical losses of electrical systems [
2,
9,
10,
11,
12]. The reconfiguration optimizes the topological structure of the network without changing its radial condition [
13,
14,
15]. In Lei et al. [
6], radial constraints for power grids have been extensively investigated. A radial system has advantages such as simplifying the protection system and reducing short-circuit current. Minimum Spanning Tree (MST) concepts have been used to ensure network planning with radial topology and minimum voltage drop. Therefore, reconfiguration methods are an effective and attractive strategy for utilities.
An optimal reconfiguration is obtained through the minimum spanning tree and graph theory, where the structure of the power grid is graphically represented by vertices and links [
16,
17,
18]. Substations, distribution transformers, and loads represent vertices; on the other hand, subway cables and overhead lines represent links [
19]. The MST searches for the shortest path in a set of nodes, resulting in a subgraph with the minimum weight. Reconfiguration is related to routing and optimization problems and is classified as NP-complete. These problems are combinatorial, use many variables and considerable complexity, and lack a globally optimal solution [
20,
21]. A nondeterministic Turing machine solves the NP-complete problem is computationally feasible time with an approximate solution [
22,
23,
24].
In consequence of the above, the present work proposes a heuristic model to solve the combinatorial problem from a programming platform such as Matlab. The model is tested to a georeferenced scenario. The transformers’ location with the topology of the medium and low voltage networks is presented as a solution. In addition, the reconfiguration results are exported and evaluated through a powerful tool for modeling electrical distribution systems, such as CYMDIST. A graphical summary of this work is shown in
Figure 1.
The remainder of this paper is organized as follows:
Section 2 presents a bibliographic review of related work.
Section 3 presents the problem formulation and the methodology to solve it.
Section 4 contains the results’ analysis and the proposed model’s validation. Finally,
Section 5 concludes the paper.
2. Related Works
Several works have been concerned with the steady-state voltage analysis of the power grid with the penetration of renewable energies in which optimization models have been proposed on ideal models for 9 or 118 busbars. The impact has been mitigated through a relaxed model that evaluates an instance using linear programming [
25]. Additionally, we present works that show the computational complexity when determining the size and location of the distributed generation or reconfiguration of the electric grid, but due to the search space, the model is relaxed to apply linear programming. The relaxation considers eliminating non-radial combinations in scenarios of 33 and 69 busbars, with a variable power factor. The method evaluates local optima using heuristics [
26]. Combinatorial problems known as NP-Complete involve using heuristics to achieve local optima; the application is evidenced in scenarios of 33.85 and 295 bars, respectively, demonstrating the algorithm’s flexibility [
27]. The variation of energy demand is considered in publications that evaluate flexibly in scenarios with distributed generation; however, the stochastic demand does not consider gradual population growth, a situation that includes an essential variation in achieving an efficient, reliable, and resilient network [
28].
In this context, the present work evidences a methodological change since it does not use ideal scenarios based on classical IEEE models and is relaxed to be solved with linear programming. In contrast, the present work proposes scalability and growth of the user population and its respective demand for the electric resource. In this way, it is not only flexibility that is denoted by the variables evaluated, but scalability is also included in the scenario; a situation that transforms the study into an accurate and current study to solve problems of the electricity sector in the sizing and deployment of an electrical distribution network on a geo-referenced scenario as an innovation of other research related to the subject.
Several methods can be applied when an optimization problem is evaluated through heuristics; however, resolution time, geo-referenced scenarios, finite time to achieve local optima, flexibility, and scalability are the variables to determine the novelty and innovation of the method.
Distribution network reconfiguration (DNR) and network resilience have been considered excellent alternatives to improve the energy system’s performance. These subjects are widely discussed in the literature, and several methods have been proposed to solve the problem. The most critical related works are listed as follows.
In [
29,
30], the authors propose a witty decision tool to design and plan power distribution networks based on heuristics data. The model considers the capacity, coverage of the transformers, and the voltage drop across conductors. In addition, the transformers’ position and the conductors’ routing are located on a geo-referenced map.
In [
31], the authors present a methodology to design representative distribution networks geo-referenced on actual data provided by 79 big European distribution system operators. As a result, the models realistically mimic sections of the EU system. In addition, nine representative distribution networks have been designed through the proposed methodology.
In [
32], the author describes a scheduling algorithm to reduce the network feeder based on a minimum spanning tree. Furthermore, the proposed algorithm has been used as an interface for planning feeders from the GIS database and exporting them to the quasi-static analysis tool (CYMDIST). The network reconfiguration through the minimum spanning tree based on the Kruskal algorithm was proposed in [
33,
34].
The cable route optimization through spatial data is promising. In [
35], the author describes an improved method to minimize the investment costs of electrical network construction projects. The algorithm uses a geo-referenced scheme generated by the free and open data source OpenStreetMap. The graphs obtained are used to solve the minimum Steiner tree problem.
In [
36], the authors present a novel algorithm to design power distribution systems based on a minimum spanning tree. The Slime Mold inspires the model. The methodology shows lower costs for urban and suburban electrical networks. In addition, the model can optimize extensive electrical networks under a single simulation in reasonable computation time.
In [
37], the author proposes a novel methodology to evaluate and enable a resilient power distribution system through graph theory. As a result, the simulation shows that network resilience is improved by increasing the number of switches; however, there are more points of failure. Furthermore, the paper presents metrics to quantify resiliency based o network structure parameters.
In [
38], the authors propose a stochastic model based on proactive operational actions to improve the resilience power distribution system. In this, the power system is optimally reconfigured through the model proposed by taking advantage of available resources. The DNR and crew prepositioning are the actions considered against predictable natural hazards, and the algorithm is mathematically formulated in mixed-integer linear programming.
In [
39], the authors present a methodology to restore distribution network service based on graph theory. The modified Prim’s algorithm is used to obtain the minimum spanning tree. In addition, the operation costs and switching equipment state are considered. On the other hand, in [
40] research, the authors present the Prim and Greedy algorithms as restoration strategies for the power system. The power grid is represented as a weighted graph.
Table 1 summarizes the related works selected for this research. It is essential to highlight the evolution of work on a combinatorial problem, that is flexible by configurable variables and scalable to customer demand and, thus, able to achieve the reconfiguration of the electrical distribution network that contributes to the concept of a smart grid.
3. Problem Formulation
Electrical network design has many parameters to consider, such as the capacity of transformers, conductors, cables, and the geo-referenced location of each element, among other things. The sizing of equipment is usually done based on local regulations. In addition, technical requirements such as voltage drop are needed to ensure quality service for users. For network reconfiguration, the parameters to be considered are similar. Extreme events often cause severe disruption to the power system, and sometimes the original network topology cannot be reconstructed by utilities. Furthermore, if the planning model considers an underground network with higher resilience, the location of the maintenance hole is also necessary.
The coordination of medium- and low-voltage network protection is simplified. Active sites are selected from candidate sites considering an optimal location problem, where these should cover all users and are located as close to each other as possible. In these conditions, the voltage drop along conductors and cables is minimal. The reconfiguration of the distribution systems must adopt a radial topology. In addition, there is a reduction in short-circuit current, mitigating the effects on the system after a fault. Several heuristic methods have been used in the literature for routing electrical networks. Minimum spanning tree algorithms allow radial topology to be obtained. In addition, the cost associated with the total routing distance is also minimal.
Planning models use projections of distributed demand in the area to sustain the electricity projects over time. High population growth rates have forced the expansion of the electricity system. According to figures published by the UN, an increase of 84 million people annually worldwide. It is difficult to predict the number of disconnected users after an extreme event, and the number increase with the network expansion is probable over time. Therefore, the proposed planning models must be scalable.
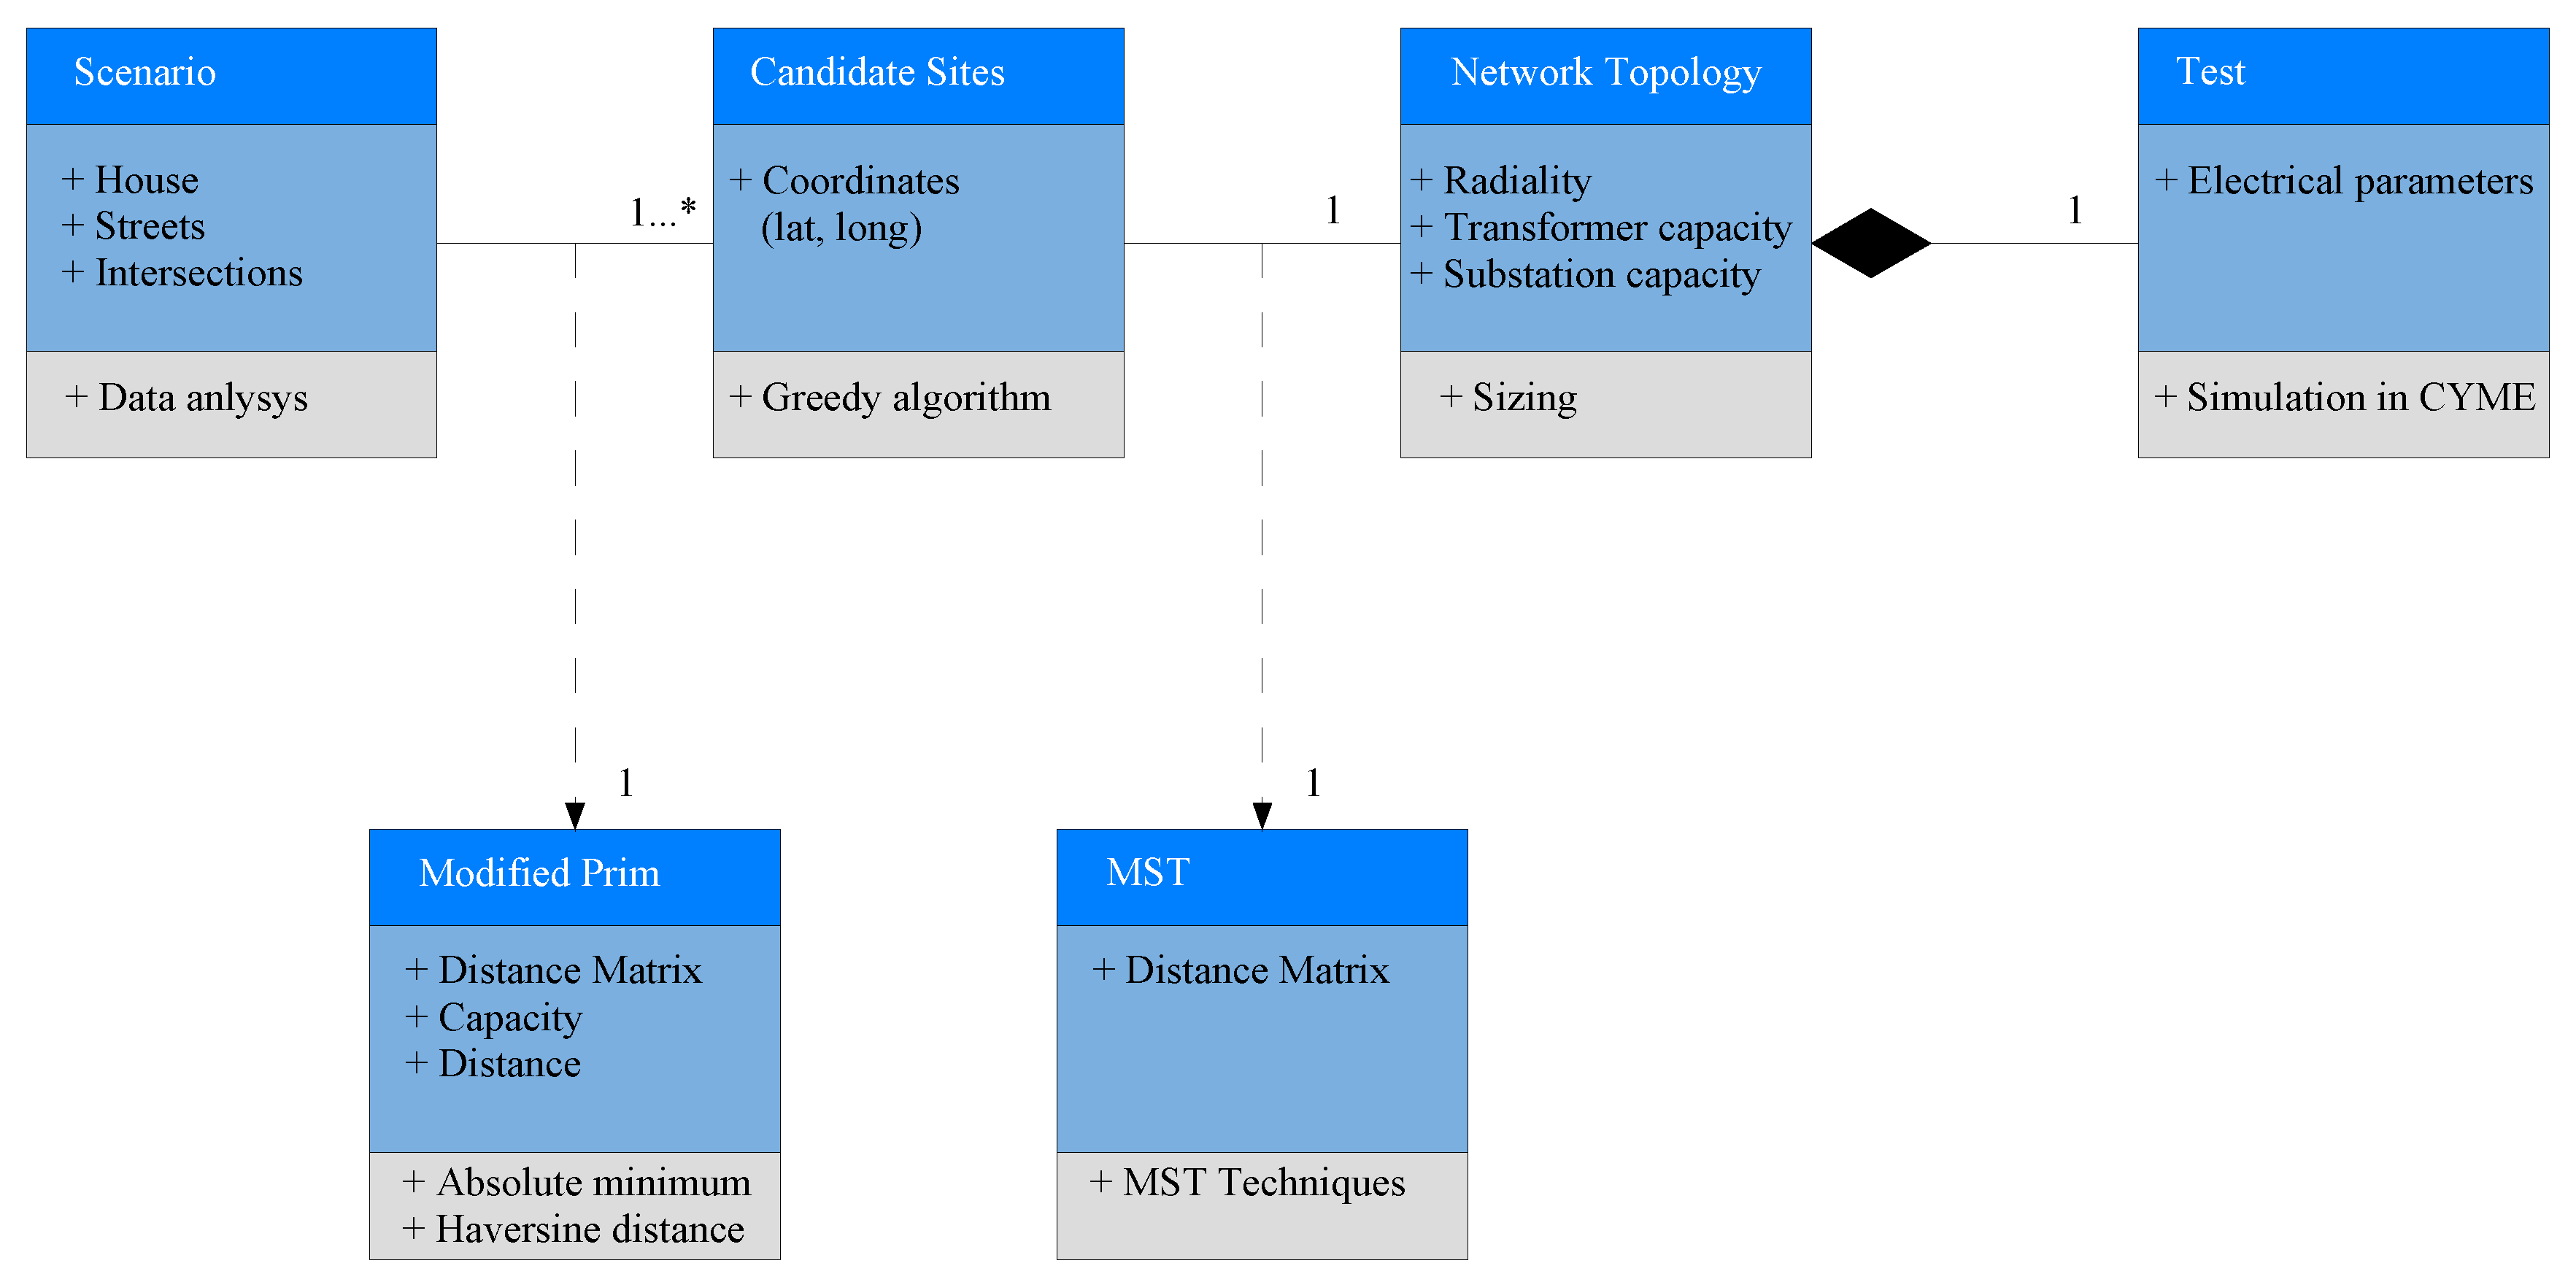
Figure 2 presents a scheme that summarizes the system model to solve the network reconfiguration.
3.1. Proposed Strategy and Methodology
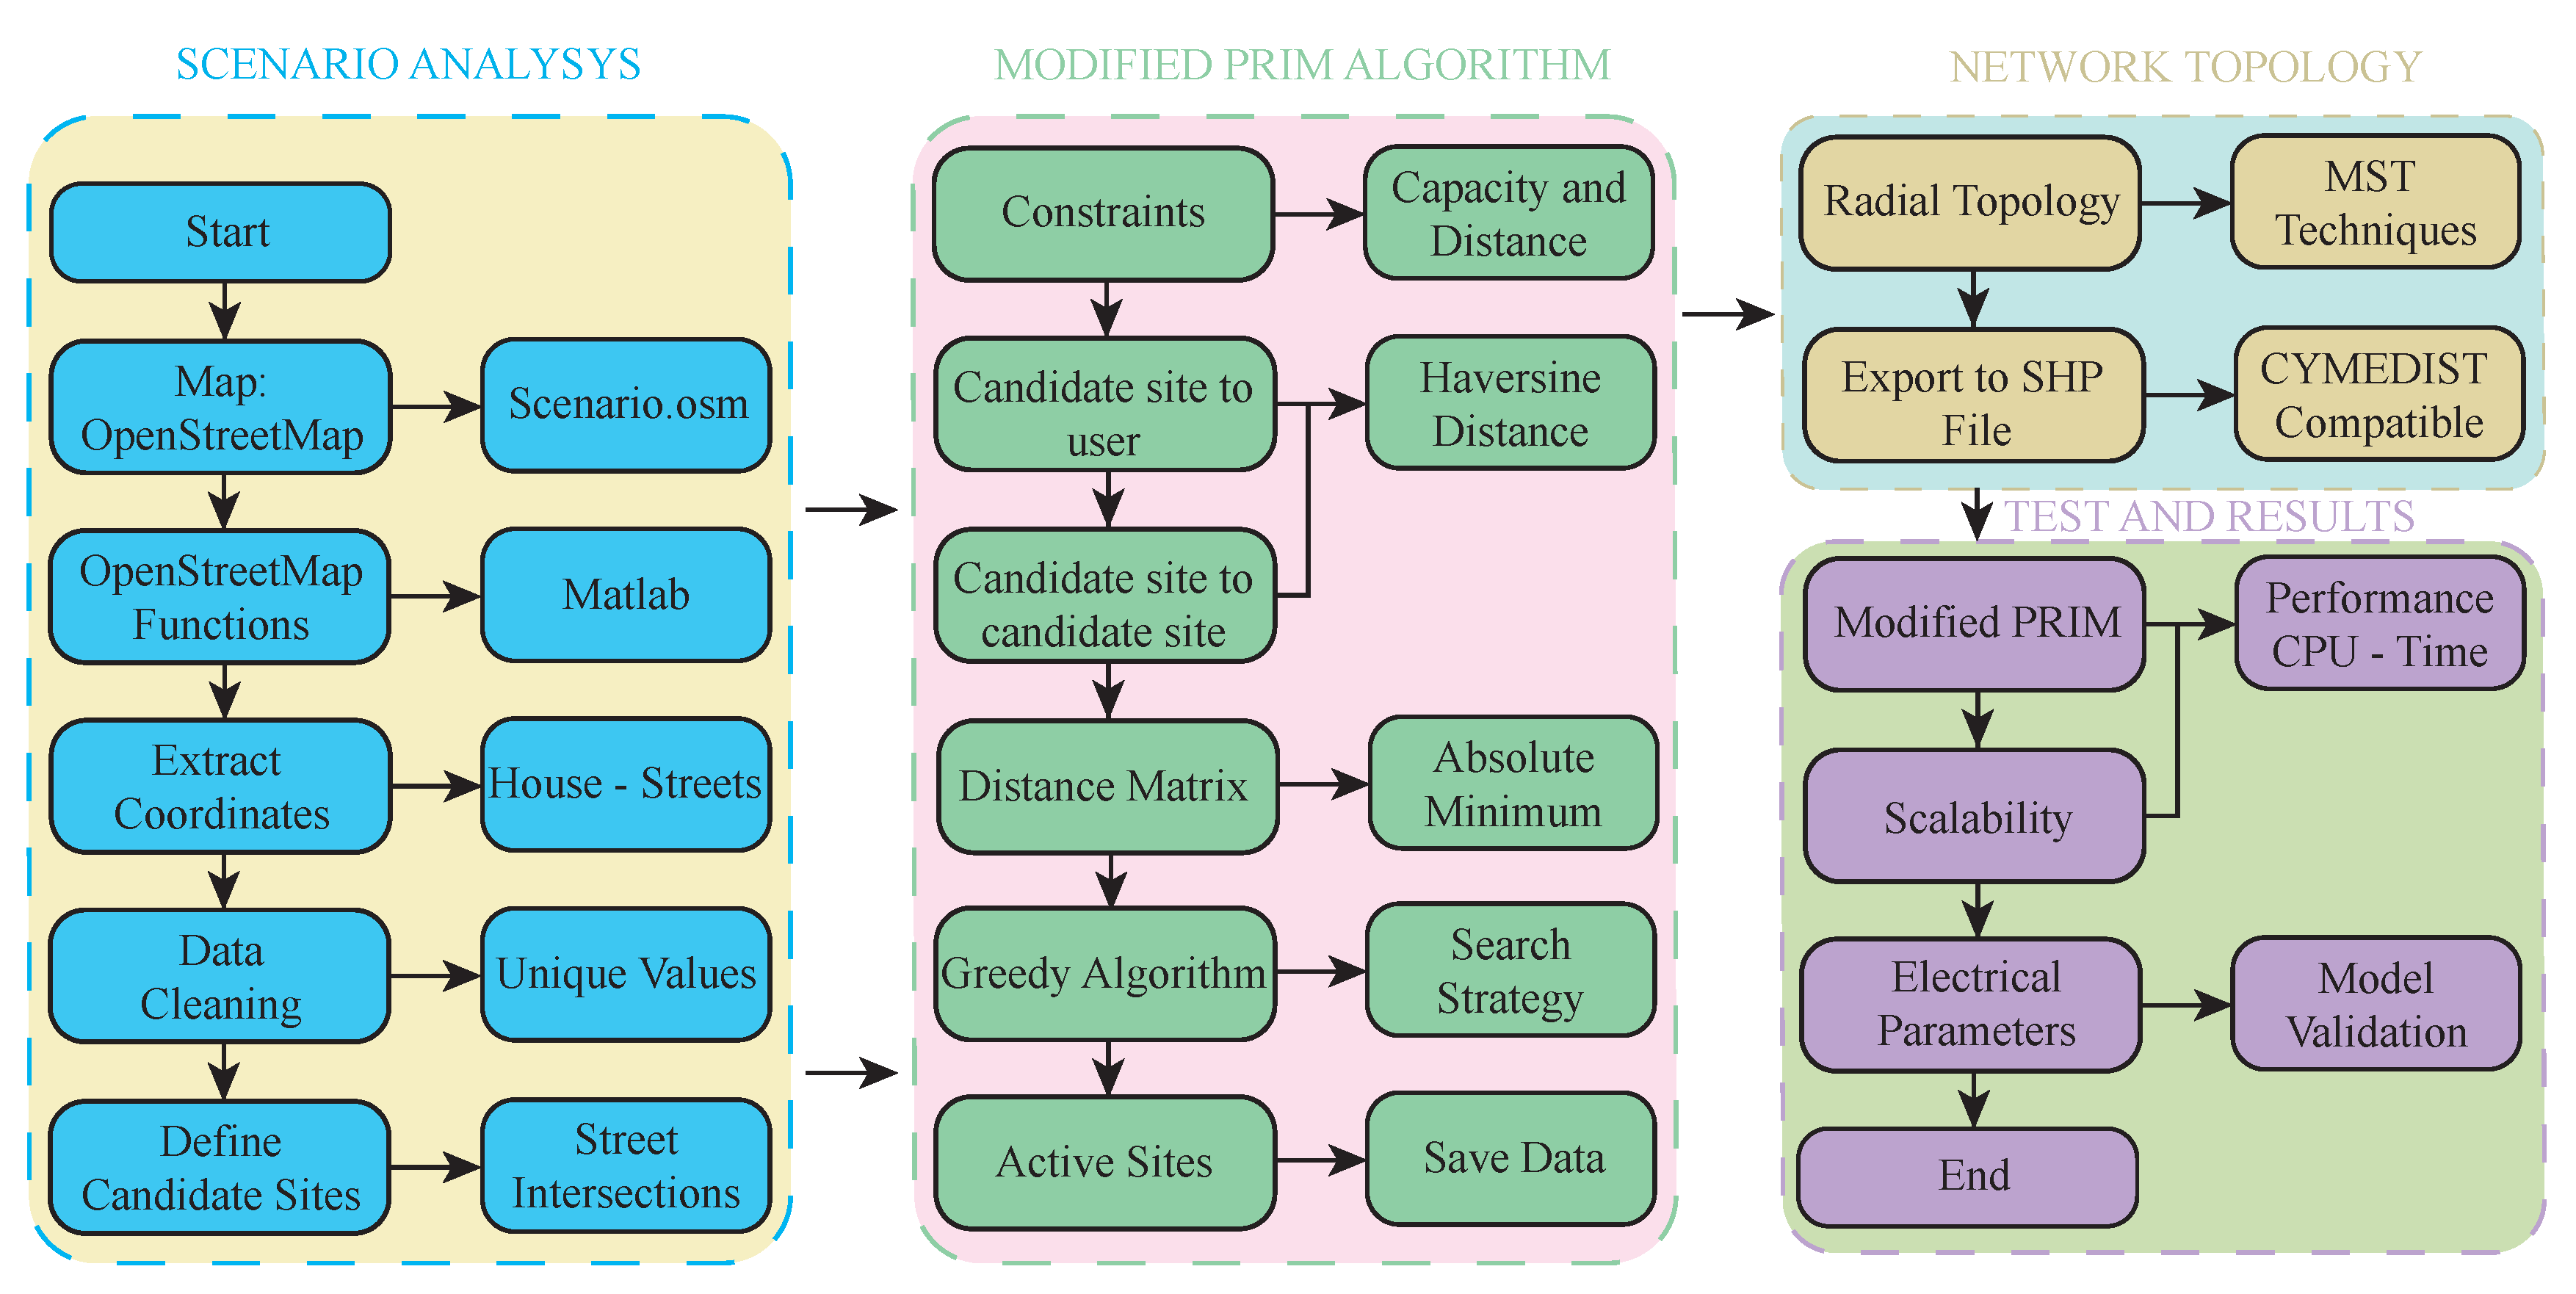
The strategy for solving the reconfiguration and resilience problem based on graph theory has been presented in
Figure 3. The methodology employed is summarized in 4 stages. First, the osm file of the study area is obtained from the free OpenStreetMap database. Street intersections are selected to represent the candidate points for the location of transformers and maintenance holes in the reconfiguration of the network. In addition, the scenario is limited through the geographical coordinates of latitude and longitude. The OpenStreetMap functions in Matlab allow the extraction of building and street information in matrices from the geo-referenced area. Thus, the research handles much information, and data cleaning is required. A clean and without-error database will reduce the computational times of the algorithms used.
In the second stage, active sites are selected based on search algorithms from candidate sites. Capacity and distance constraints have been posed by modifying the Prim algorithm. The distance calculations use the Haversine equation that considers the Earth’s curvature. Thus, no errors in the longitudinal measurements appear with a Euclidean plane equation. As a result, each candidate site generates a matrix with the distances between the candidate point and each user (service point). In the distance matrix, the absolute minimum is searched, repeating the process for each location. The model forms user sets for each candidate site, with the possibility of a single user being part of two or more clusters. Consequently, the Greedy algorithm obtains the smallest number of sets covering all users. The resulting groups represent the active sites and are ideal for transformers and maintenance holes.
The capacity and distance constraints serve two purposes in the model. The capacity constraint limits the number of users connected to a transformer. These supply power up to a nominal value; therefore, it is necessary to restrict the connected load. We ensure that the distribution transformers are not overloaded with the capacity constraint. We seek to ensure that the spans do not exceed a maximum distance with the distance constraint. In addition, limiting the span length allows us to control the voltage drop along conductors and cables; thus, the model ensures to stay within the maximum voltage drop range set by standard IEEE 1547.
In the third stage, the radial topology of the network is constructed based on MST techniques. The model considers a network resilient to extreme events; hence, this work proposes an underground electrical network. The trench route is oriented through the street paths to the intersections connecting all active sites. The proposed model is not exclusive to underground networks; it is applied to overhead and even mixed distribution networks that need a reconfiguration with radial topology. In addition, the proposed approach could be generalized to other types of networks, such as multi-carrier power networks, where independent network topologies can be formed for users who wish to belong to a different utility. The scenario and the network topology are exported from Matlab to Cymdist using an SHP file (vector representation format).
Finally, the performance of the modified Prim algorithm has been evaluated for different values of capacity and distance constraints. Analyzing the electrical parameters in specialized power distribution network software validates the model. In addition, the model’s scalability is verified with population growth over 6 years.
3.2. Problem Formulation
This paper presents a heuristic to find the number, capacity, and optimal location of transformers in distribution network reconfiguration based on graph theory and resilience to extreme events. In addition, the best route is identified for medium and low-voltage networks. The proposed model is scalable and is evaluated in a certain period. However, the grid reconfiguration is not performed every year; otherwise, the scalability results will show the number of transformers necessary each year to reconfigure the grid if an extreme event affects all existing users. This study considers the 6th year, when a population of 1284 users has been reached.
The primary inputs of all transformers are connected in a tree topology through a feeder that delivers power from the distribution substation to distribution transformers. The objective is to reconnect all users after the network infrastructure has been affected by an extreme event. The system requires new connection points; therefore, a new network topology is obtained based on a reconfiguration. The candidate location of transformers and utility maintenance holes are geo-referenced in a real scenario. The streets and intersections are ideal for designing the underground network. The buildings, corners, and roads are extracted from an OpenStreetMap osm file in geographic coordinates (latitude and longitude). Parameters and variables are depicted in
Table 2 for the proposed methodology.
The length of conductors and cables must be optimal to minimize the indirect project costs, and the optimal routes for the medium and low-voltage networks are obtained through the graph theory concepts and minimum spanning tree (MST). The MST in the low-voltage network is found based on the modified Prim algorithm. Furthermore, the medium voltage network topology is routed through the intersection points and streets to build an underground distribution network. A distribution network with these characteristics is resilient to extreme events.
Our planet has an irregular spherical shape, and it is curved. Distances have been calculated through the Haversine equation. Consequently, the calculation of distance considers the curvature of the Earth. The length results between two points in a geo-referenced system are obtained in kilometers. Equations (
1) and (
2) expresses the Haversine formulation for distance calculations considering longitude and latitude.
The substation capacity corresponds to the power flow results obtained in the Cyme simulation and comprises the power delivered to all transformer primaries radially connected to the substation. The substation capacity is defined in Equation (
3) through the network power flow. The model uses two Boolean-type decision variables to implement the modified PRIM algorithm. On the other hand, three restrictions are proposed to limit the capacity, the distance, and the voltage drop of the users connected to each transformer.
Equation (
4) expresses the capacity of the transformers through the power flow of demand and the lines losses that radially connect the transformer’s secondary with the loads.
where,
The cables losses between two nodes are calculated with the following equations:
where,
The optimization model considers the indirect cost related to the driver, defined as meters of driver per unit value in the market. The proposed objective function for the model is shown in Equation (
3), where this indirect cost is minimized. The variable
represents the distance between two connected nodes. The total length of the conductor is obtained by adding up all the sections and multiplying it by their unit value to calculate the total cost.
Equation (
12) corresponds to the transformer’s capacity constraint, where the number of users connected to each transformer is limited. Equation (
13) corresponds to the maximum span distance constraint. This last parameter allows controlling the voltage drop that increases with the length of the conductor. This last parameter allows controlling the voltage drop that increases with the size of the conductor. The service voltage for each user as a function of voltage drop must remain within a normalized maximum and minimum voltage range.
The modified Prim algorithm delivers a solution matrix with the user clusters for each active site. Due to the calculation method and constraints, the solution matrix may show that a user belongs to one or more clusters. This condition is not possible; thus, the set covering problem appears; and this is solved through the Greedy algorithm. The set covering the problem is formulated as follows. Let
be a set of n elements. Let
be subset of
A, i.e., each
. Each element in
A appears in some set. A set covers
C is a set such that
. The objective function to minimize
is defined as follows.
The process of grid reconfiguration through modified Prim is presented in Algorithm 1, and the method to solve the set covering problem through the Greedy model is presented in Algorithm 2.
A laptop has been used to test the model with an Intel Core i5 2-core 2.40 GHz CPU and 12 GB RAM. First, the algorithm performance results through Matlab mathematical software are presented. The following section demonstrates the scalability of the model. Finally, the results of electrical parameters obtained through Cymedist are presented.
| Algorithm 1 Reconfiguration Algorithm. |
Procedure: Step:1 Scenario initialization Vector coordinate of users Vector coordinate of substation Vector coordinate of streets Capacity constraint Distance constraint Calculate: Step:2 Modified Prim 1; whiledo if then if then else 0 end if end if end while Step:3 Primary and secondary grid MST Find transformers location Find primary grid MST Find secondary grid MST Step:4 Transformer and substation sizing Load vector Substation power flow Transformer power flow
|
| Algorithm 2 Greedy Algorithm. |
Procedure: Step:1 Initialization Step:2 Repeat until every element in A is covered whiledo end while
|
3.3. Modified Prim Algorithm Performance
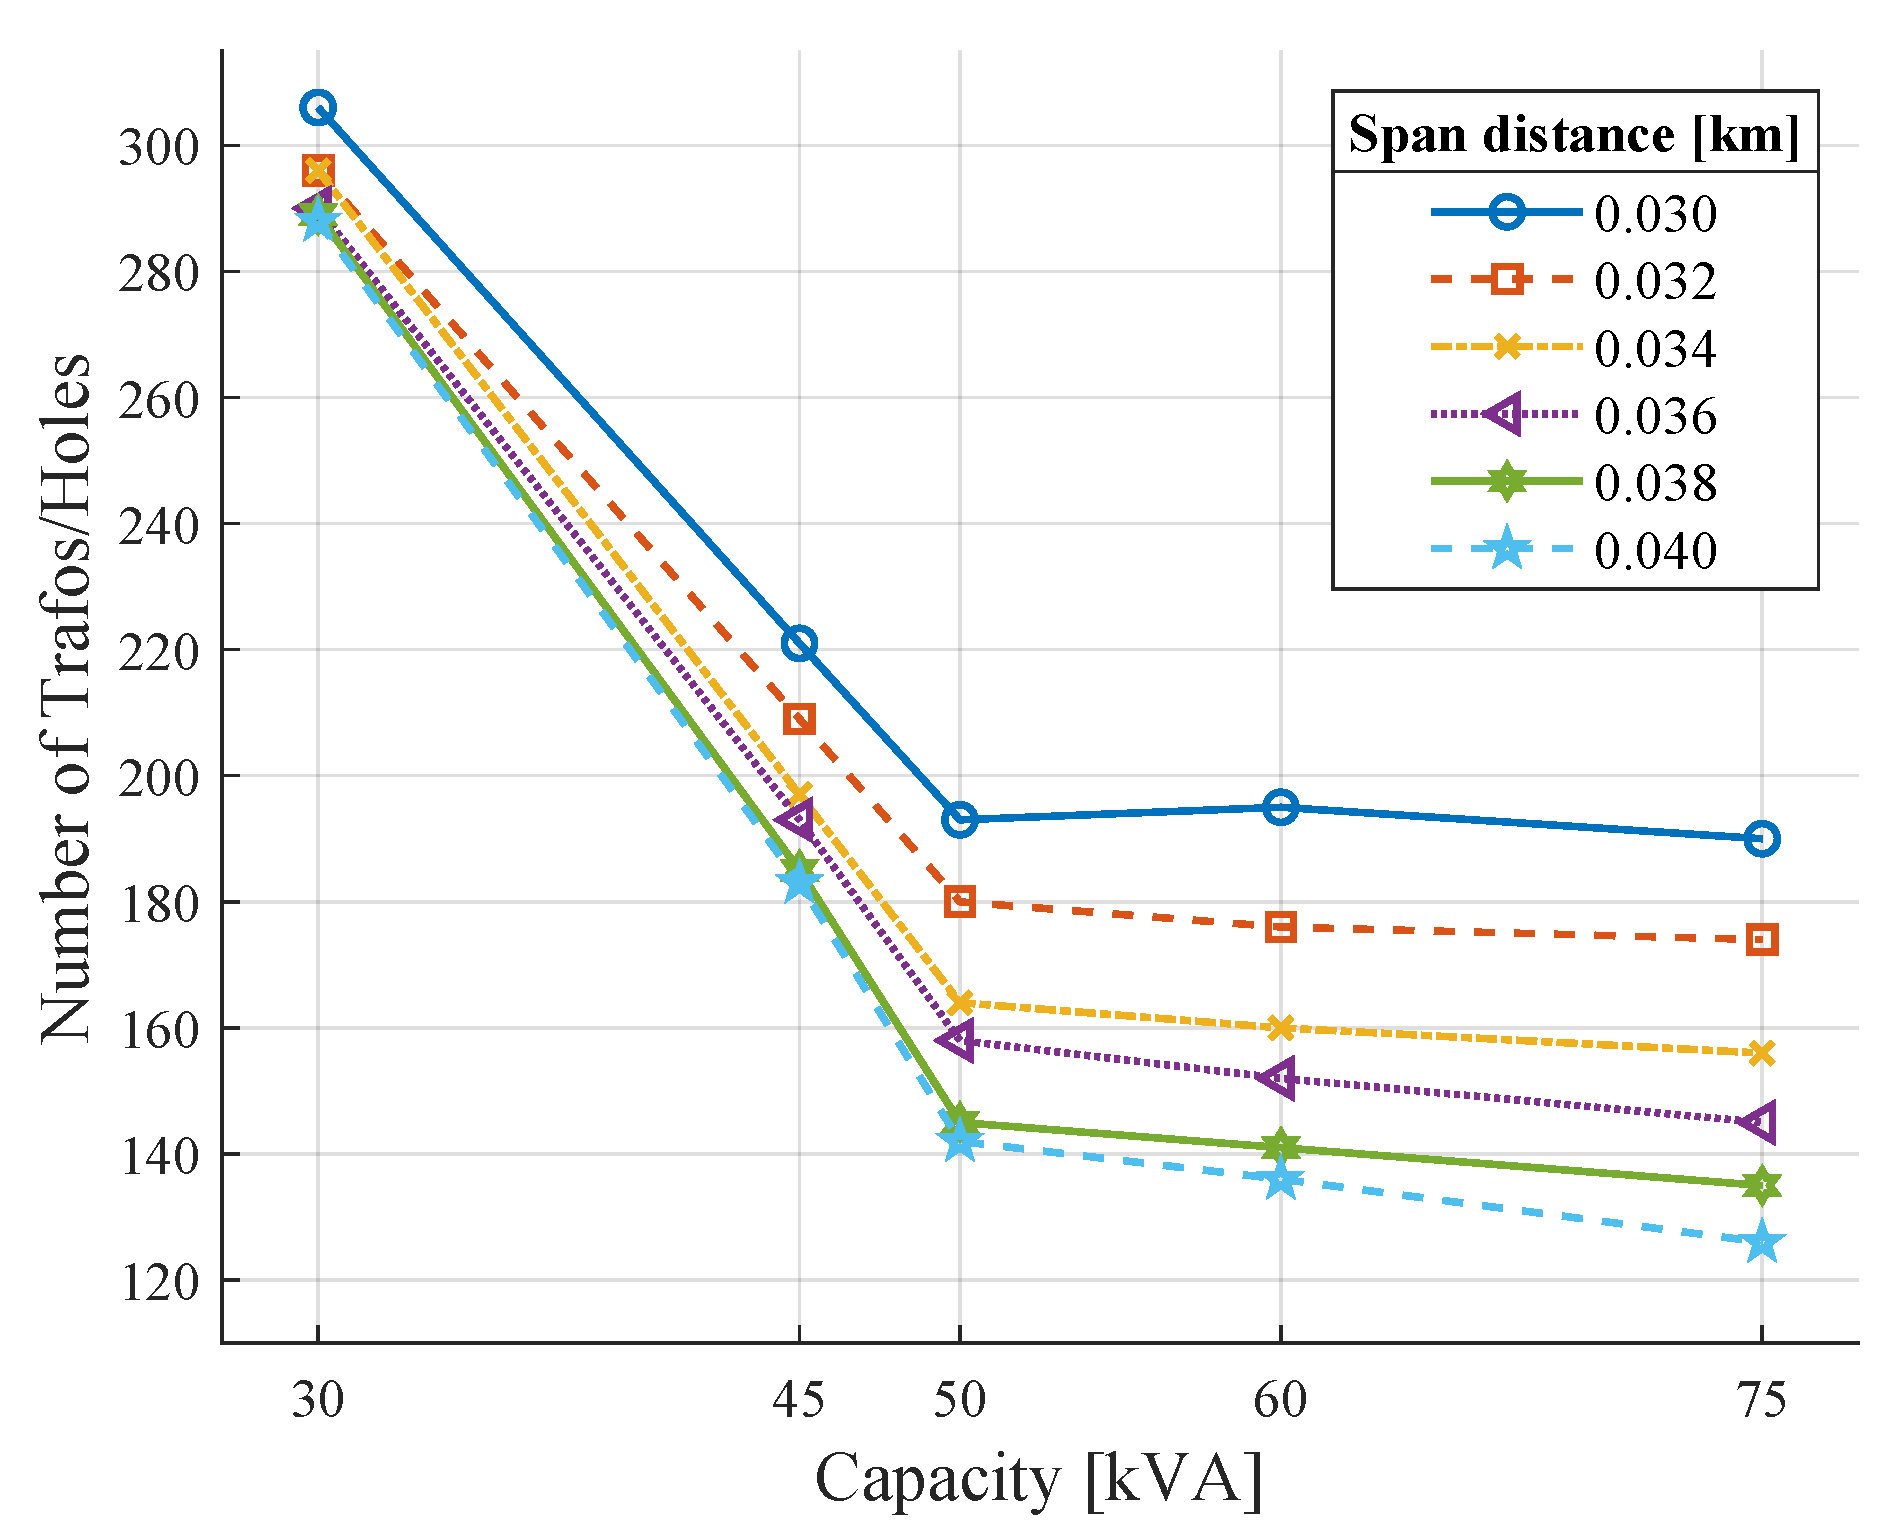
The optimal location and number of transformers and maintenance holes have been obtained through the modified Prim algorithm, and the Greedy algorithm complements the process. The number of transformers and maintenance holes based on the capacity and span length constraints is shown in
Figure 4, where it is clear that a shorter span distance requires locating more components in the network. On the other hand, a longer span of space requires fewer components. This result was already expected because the number of users connected to each transformer changes proportionally with the span distance restriction. In addition, the number of transformers and maintenance holes decreases if the model considers higher capacity transformers that can connect more load.
4. Analysis of Results
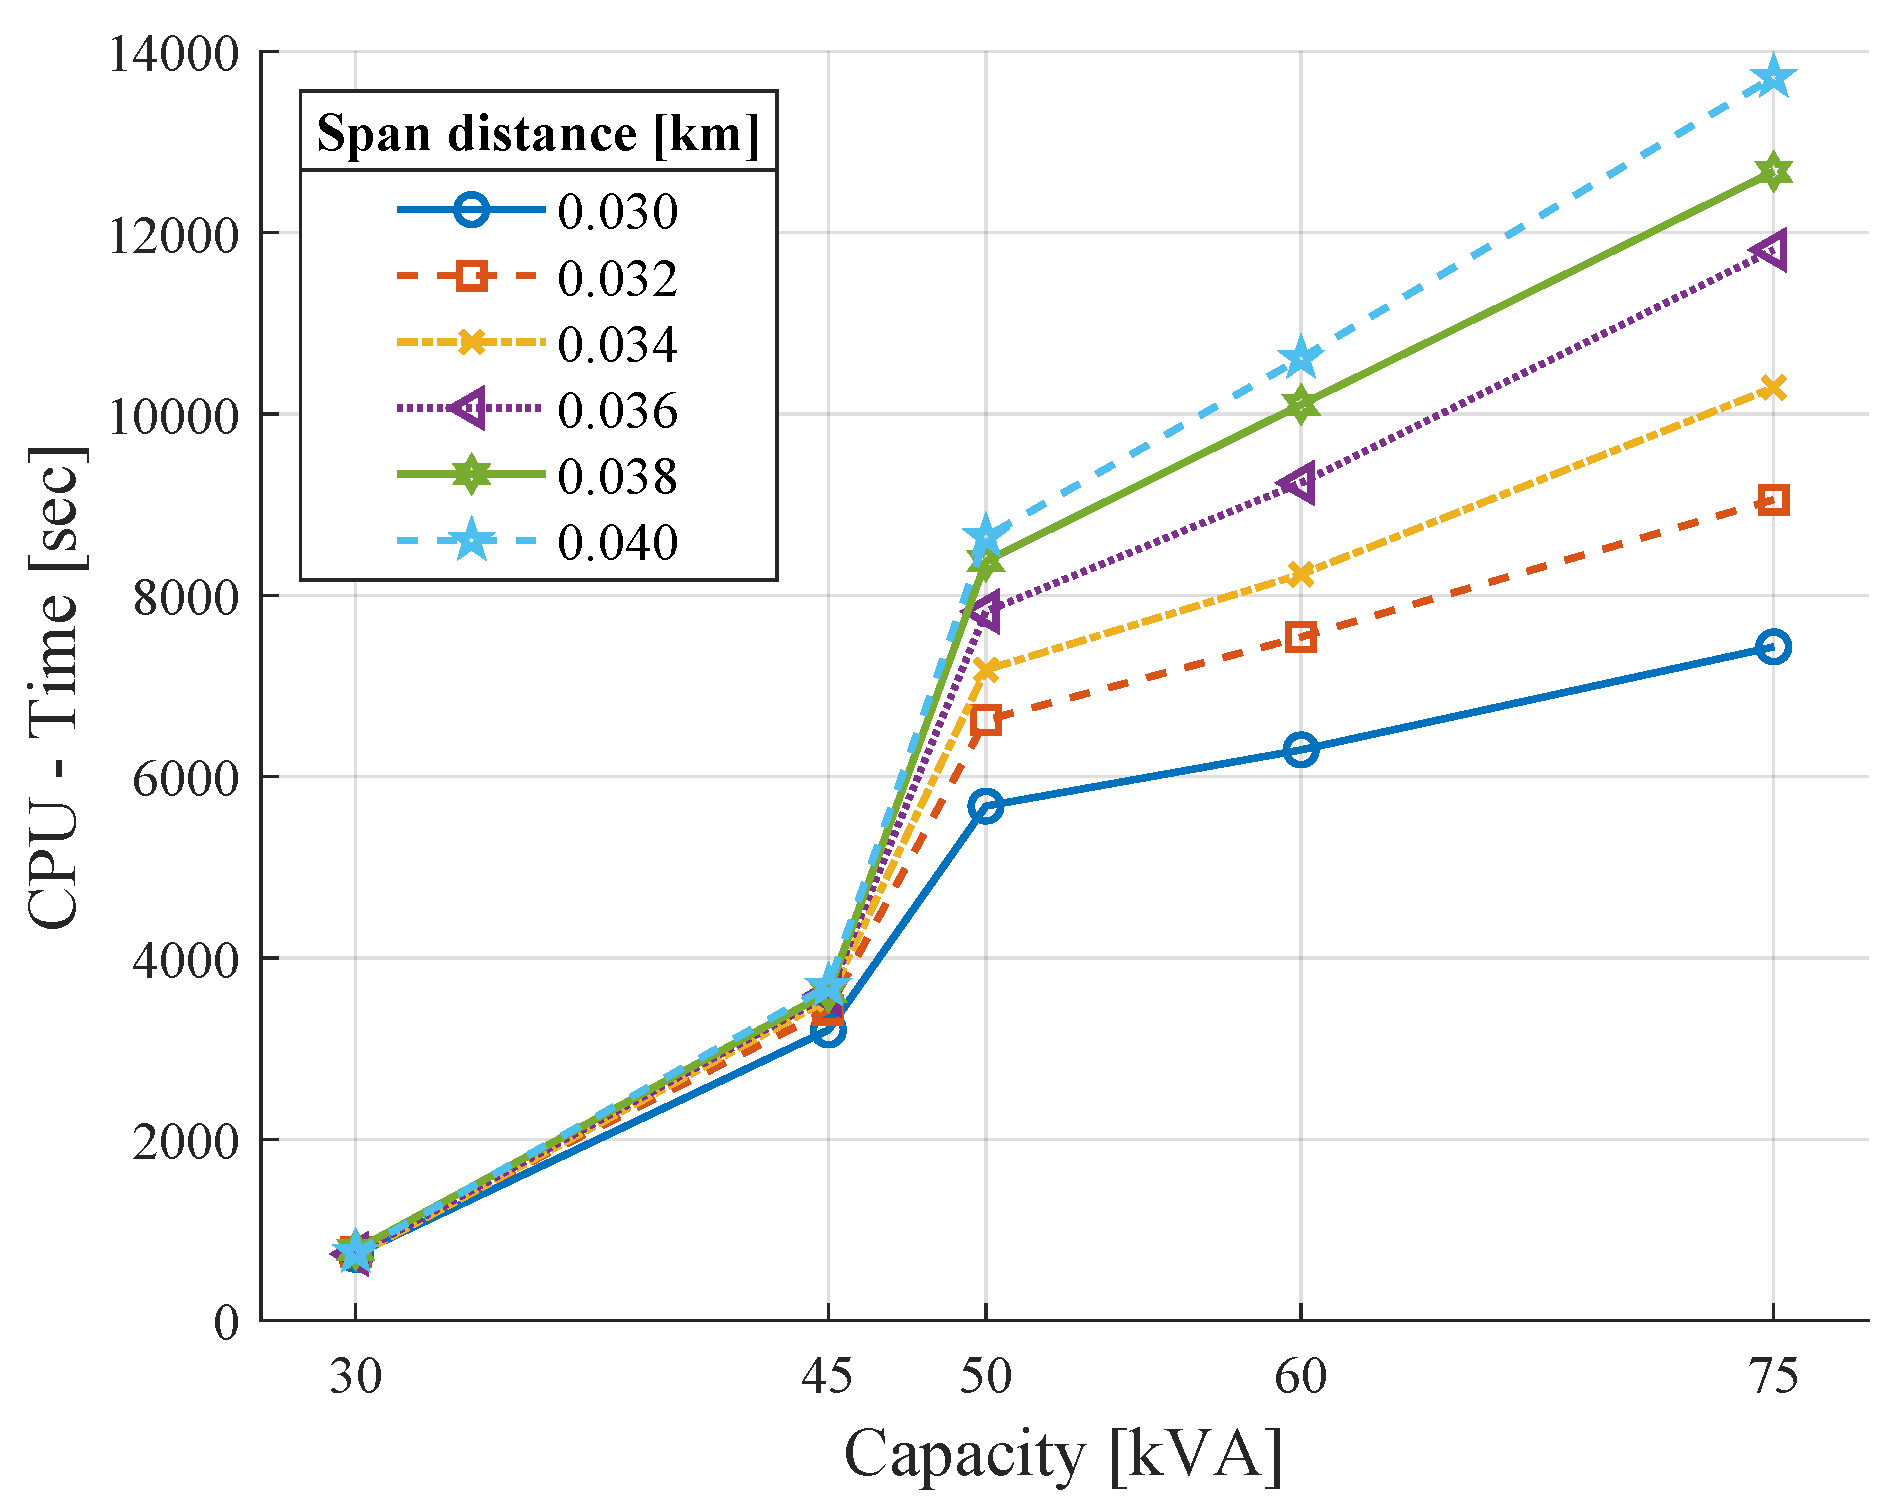
The time of the central processing unit (CPU) when evaluating the model with the capacity and span distance constraints is shown in
Figure 5. Longer processing times have been obtained when transformers’ capacity and span distance increase; otherwise, the CPU time is reduced. The difference between the minimum and maximum processing time is approximately 6000 s.
The model has been evaluated through simulation parameters presented in
Table 3. All candidate locations have been circled. On the other hand, the candidate locations chosen have been marked by a green square within each circle. The radial connection of all candidate locations forms the underground network for the medium- and low-voltage networks. Consequently,
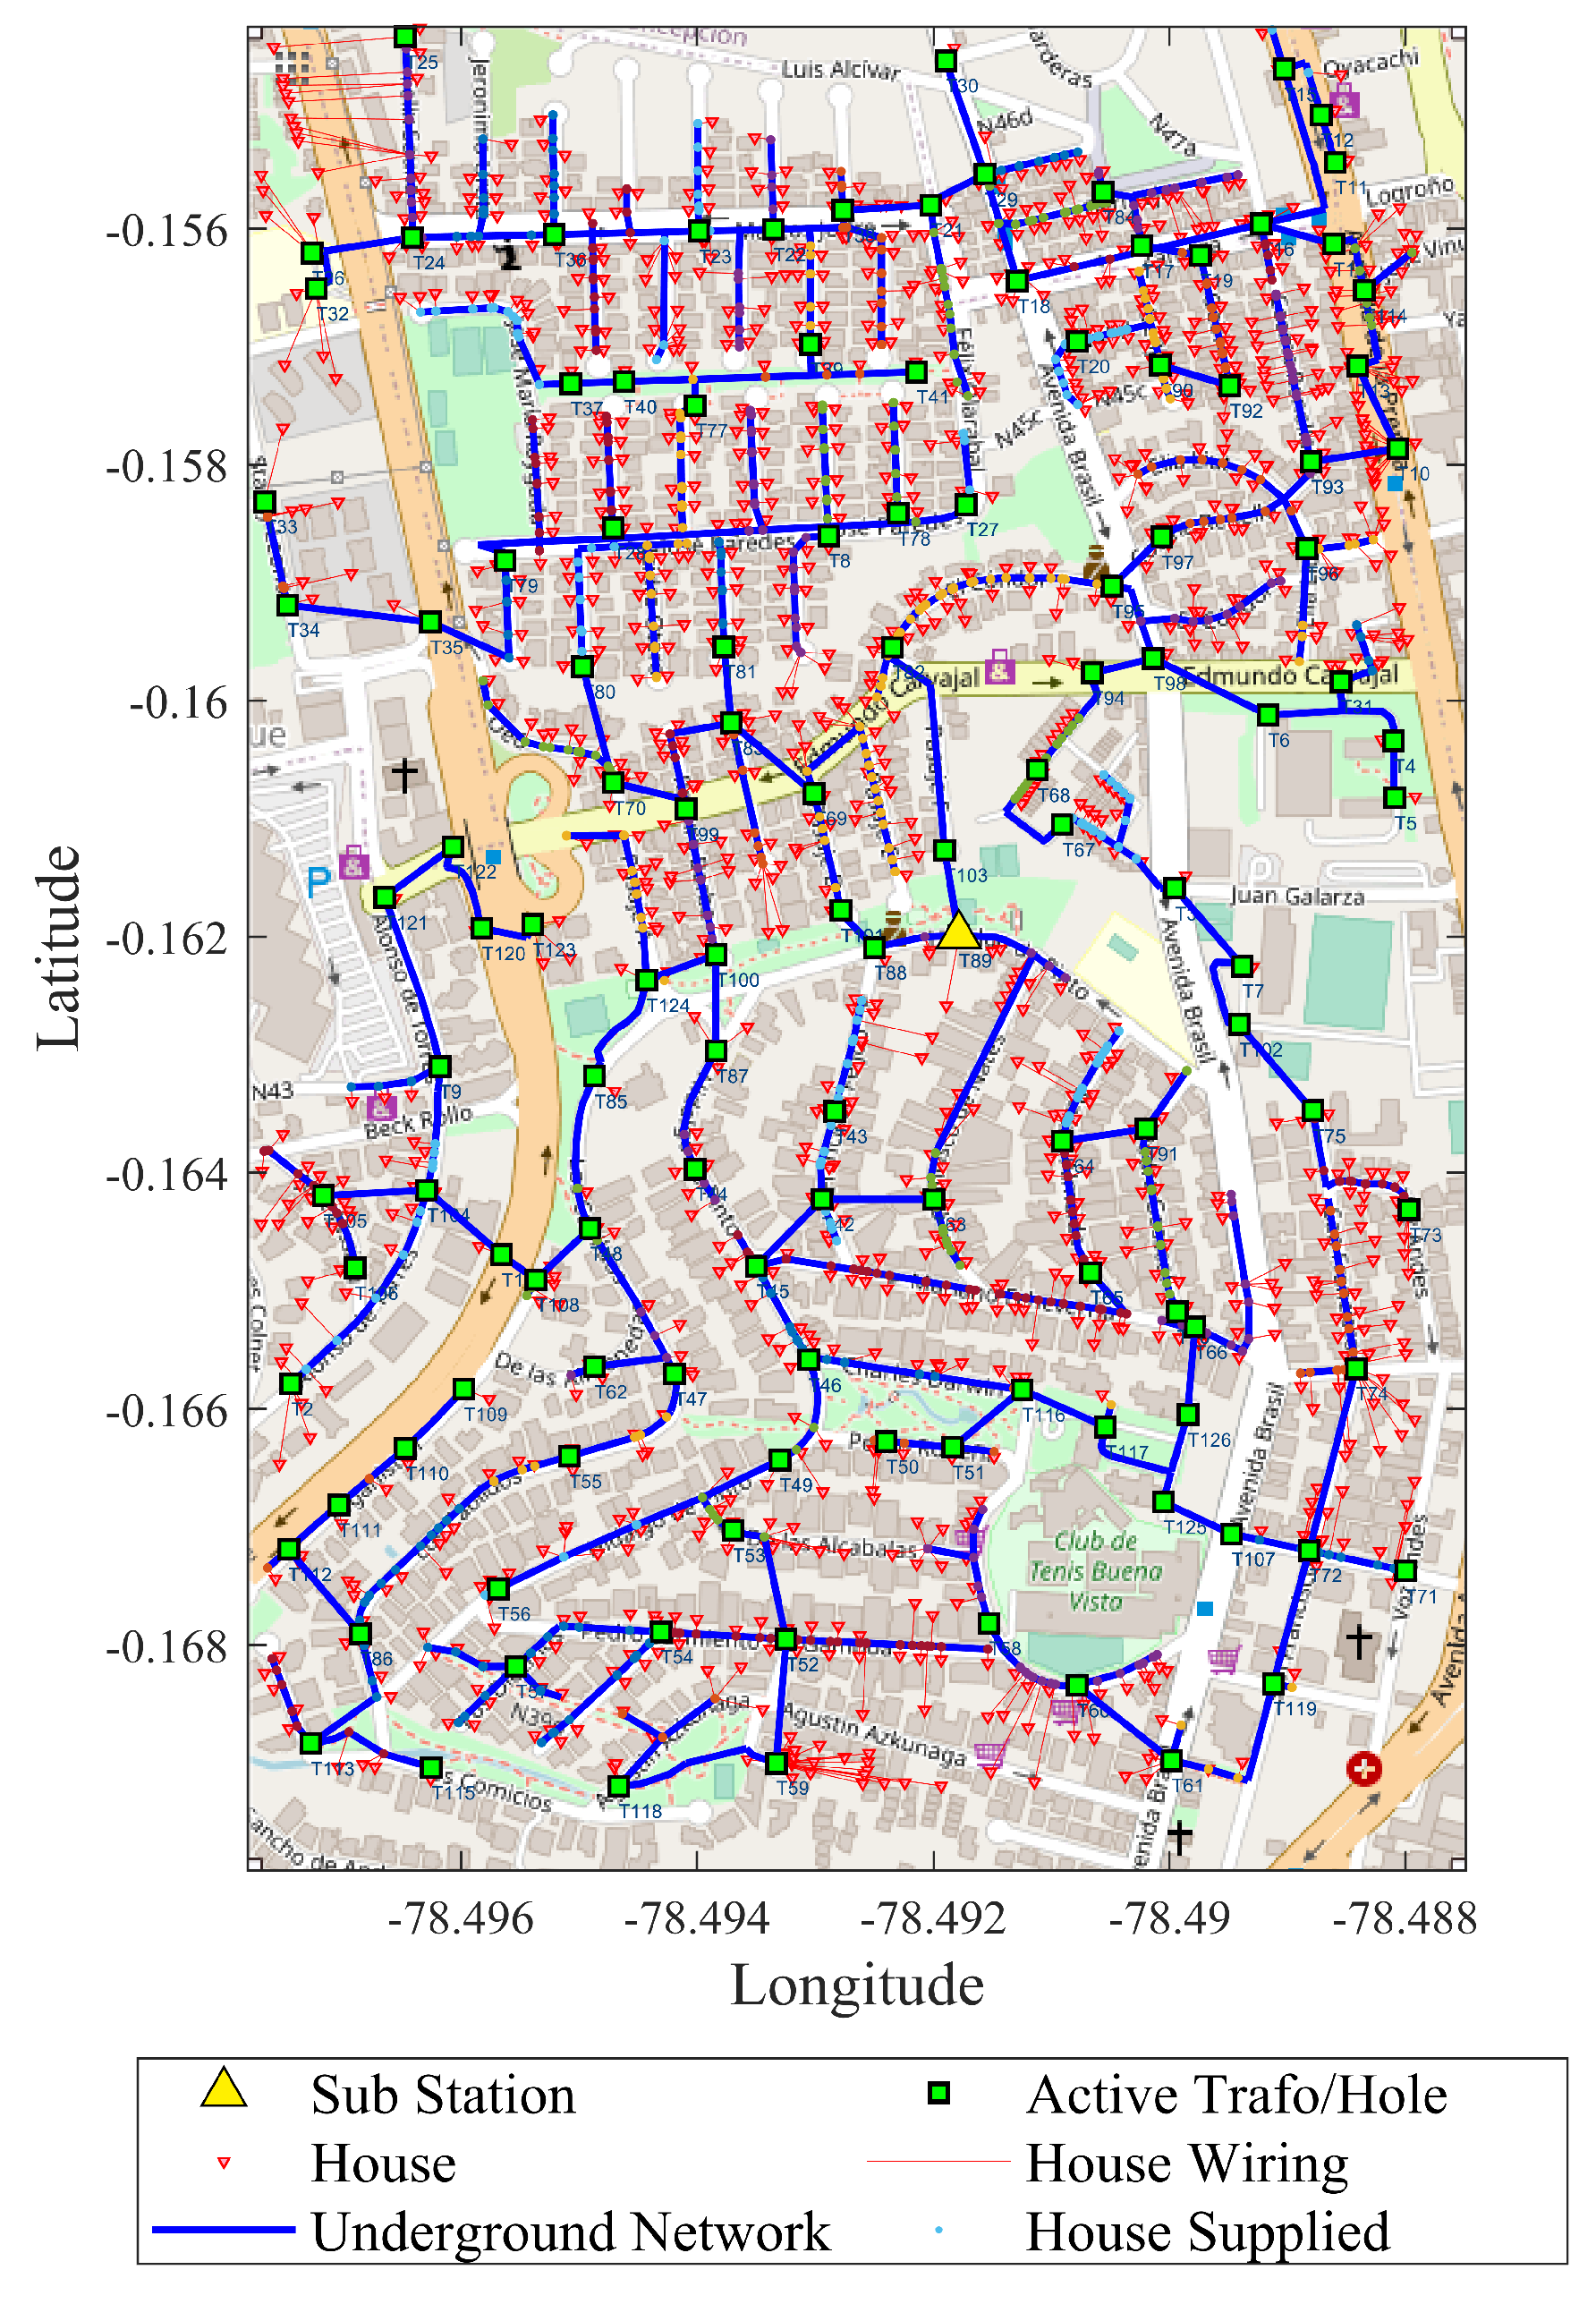
Figure 6 shows the optimal location of transformers and maintenance holes in these conditions.
The radial topology connecting all the chosen sites has been obtained through MST techniques and Haversine distance calculation. Furthermore, the shortest connection distances have been routed along the trajectory of the streets existing in the geographical area to form the underground network trench route.
Figure 7 shows the radial topology for the underground network in the geographical location.
4.1. Model Scalability
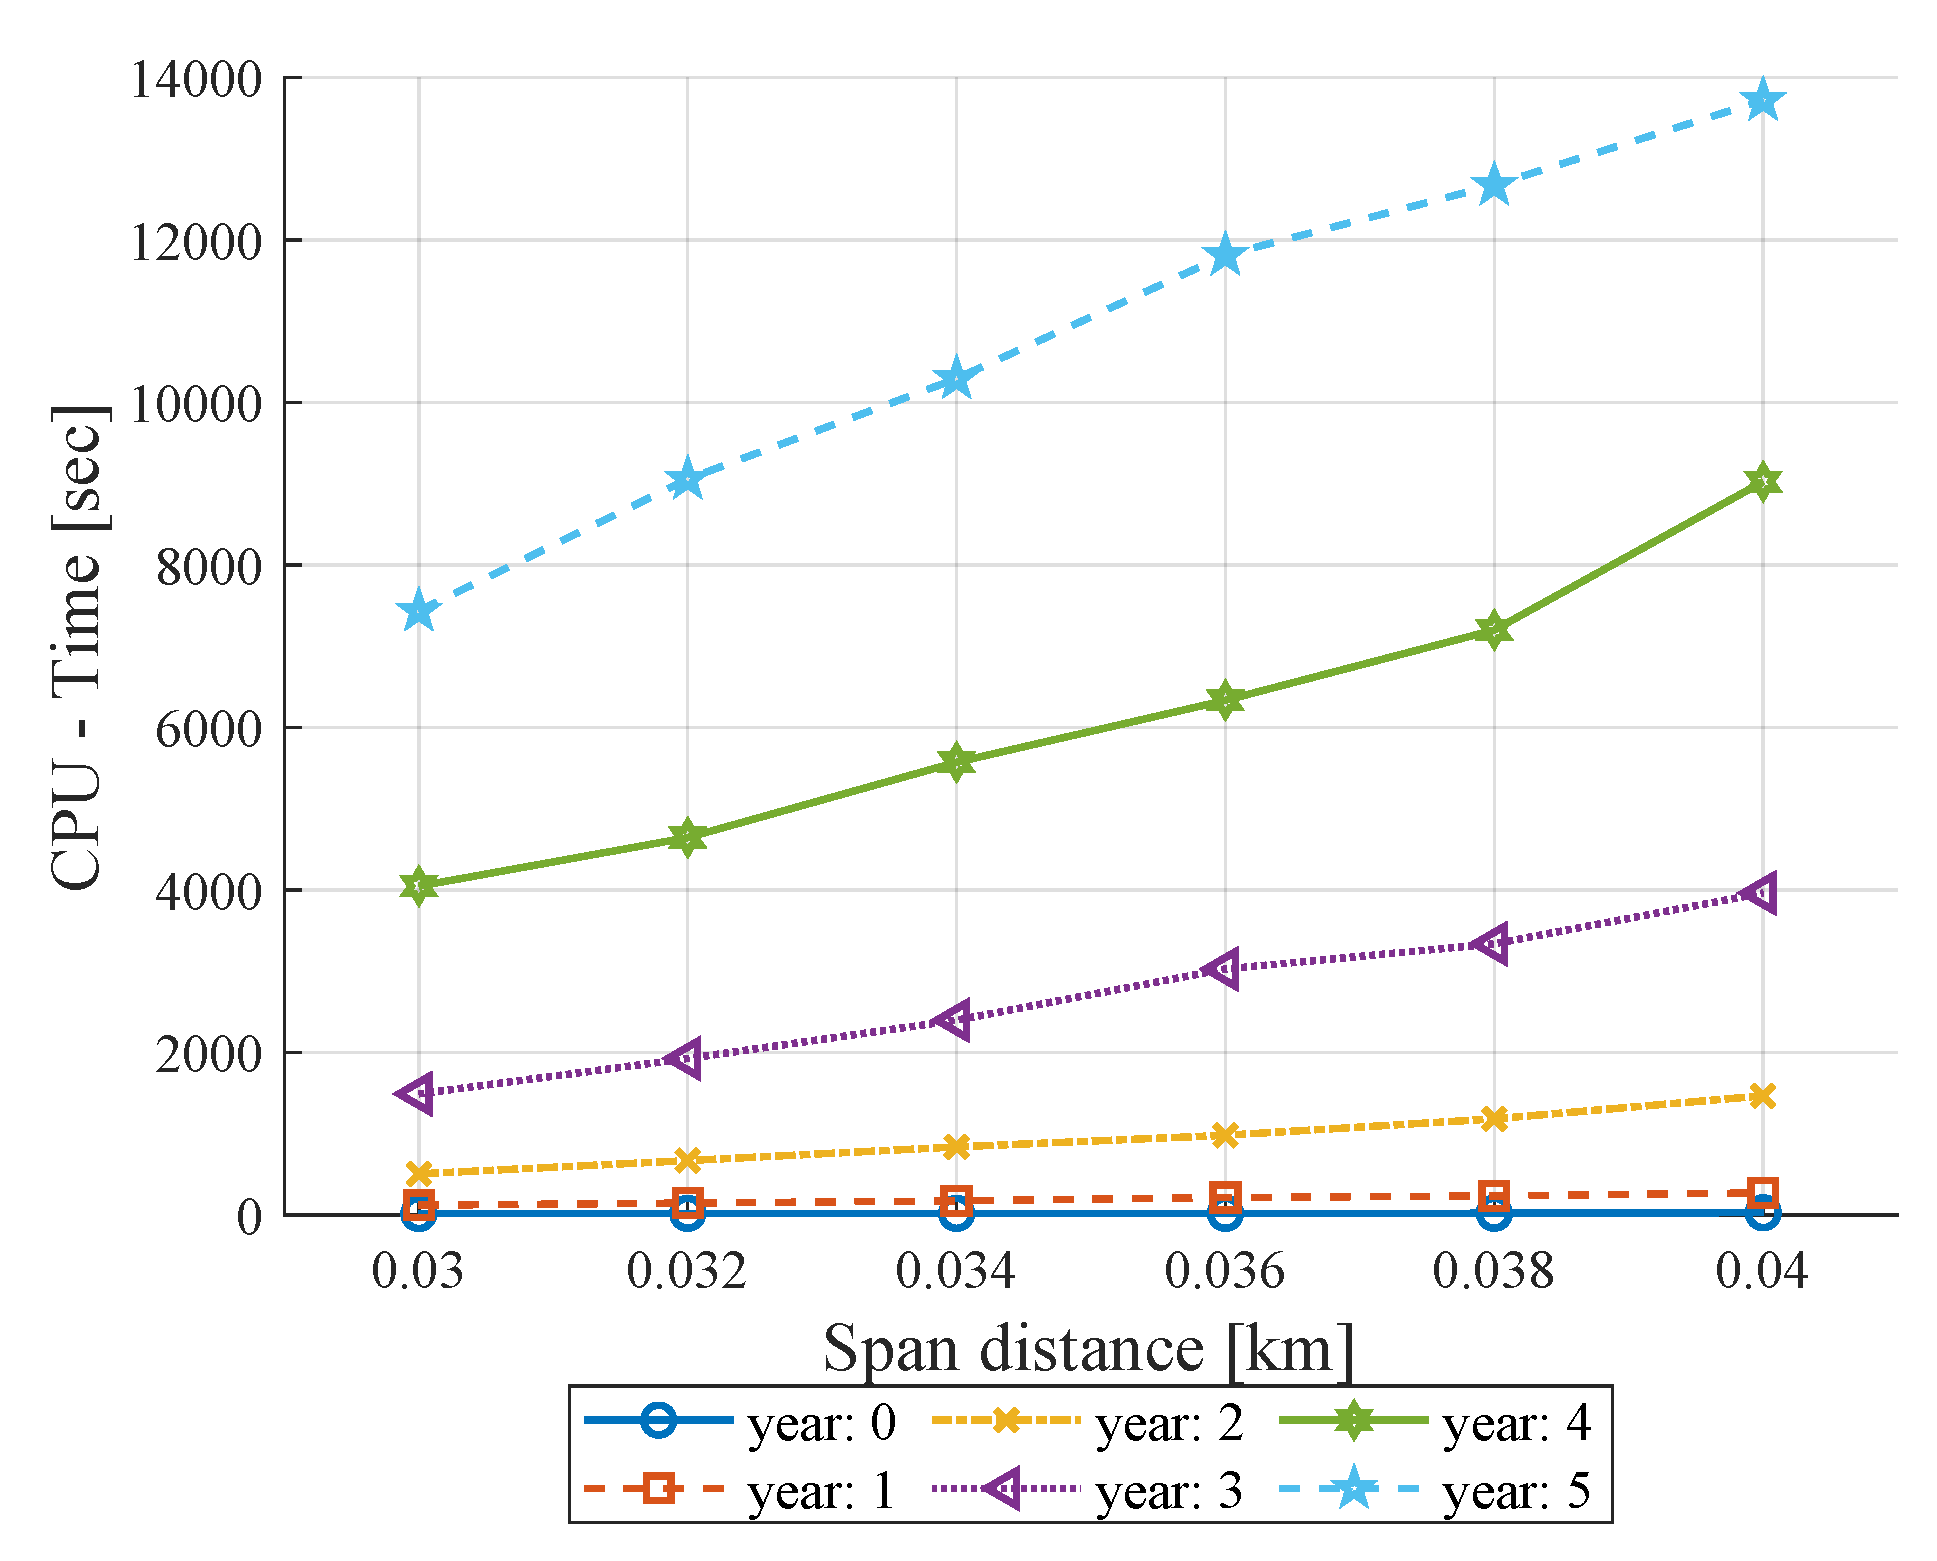
Distribution network planning models must be scalable; thus, the programming algorithms must be flexible to the number of users forming the network. The proposed model is evaluated for 6 years, with an increase of 214 nodes to be reconfigured if an extreme event happens in that year. Although the reconfiguration of an electrical network is not performed every year, it is difficult to predict how many users will be affected by a failure due to any extreme event.
Figure 8 shows the proposed model results for different scenes considering scalability.
The results show that the number of transformers and maintenance holes required for reconfiguration reduces considerably with increasing span distance each year. As the span length increases, there is the possibility of more users connecting to the same transformer. Consequently, fewer transformers are required but have a higher capacity to supply the demand. In the first year, the result for different span distances tends to be constant due to the large dispersion of users. Therefore, the number of candidate sites is maximum to cover the maintenance hole area. In the last 3 years, a lower separation at the reconfiguration nodes; hence, similar results have been obtained for different span distances.
The CPU time when evaluating the model with span distance constraint and the increase of user number to be reconfigured per year is shown in
Figure 9. Longer processing times have been obtained with the span distance increase; otherwise, the CPU time is minimum. When the span distance increases, transformers can group more users; hence, calculating all Haversine distances needed is more time-consuming.
4.2. Simulation Results in Cymdist
The topology based on the proposed heuristic process is tested in the Cymdist power network simulation software.
Figure 10 shows the reconfiguration of the network in the simulation software. Power grid reconfiguration is exported from Matlab to CYME using a shape-file format Shp. These files are characterized by the fact that they store the information of the geographic systems in a geometrical form. Exporting points of interest such as the location of wells or transformers facilitates the implementation of the electrical network. It allows representing the geography of the study area in the CYME environment.
The network design must ensure that each user’s supply receives an adequate voltage level. Typical problems experienced by a customer’s supply depend on the location of each customer concerning the transformer station. When a customer’s power supply is connected close to the transformer, it is often overvoltage.
The voltage control with tap changer transformers and an adequate sizing of the conductor sizes permit the voltage regulation grid. On the other hand, a user connected far away from the transformer usually presents a considerable voltage drop. These conditions represent a poor quality of service.
Demands random vector for the network simulation has been generated.
Figure 11 represents the load distribution in the heat map, and
Table 4 summarizes the load distribution allocated to each group of transformers classified according to their capacity. Electrical distribution networks are unbalanced, and random demand perfectly represents the behavior of a local network.
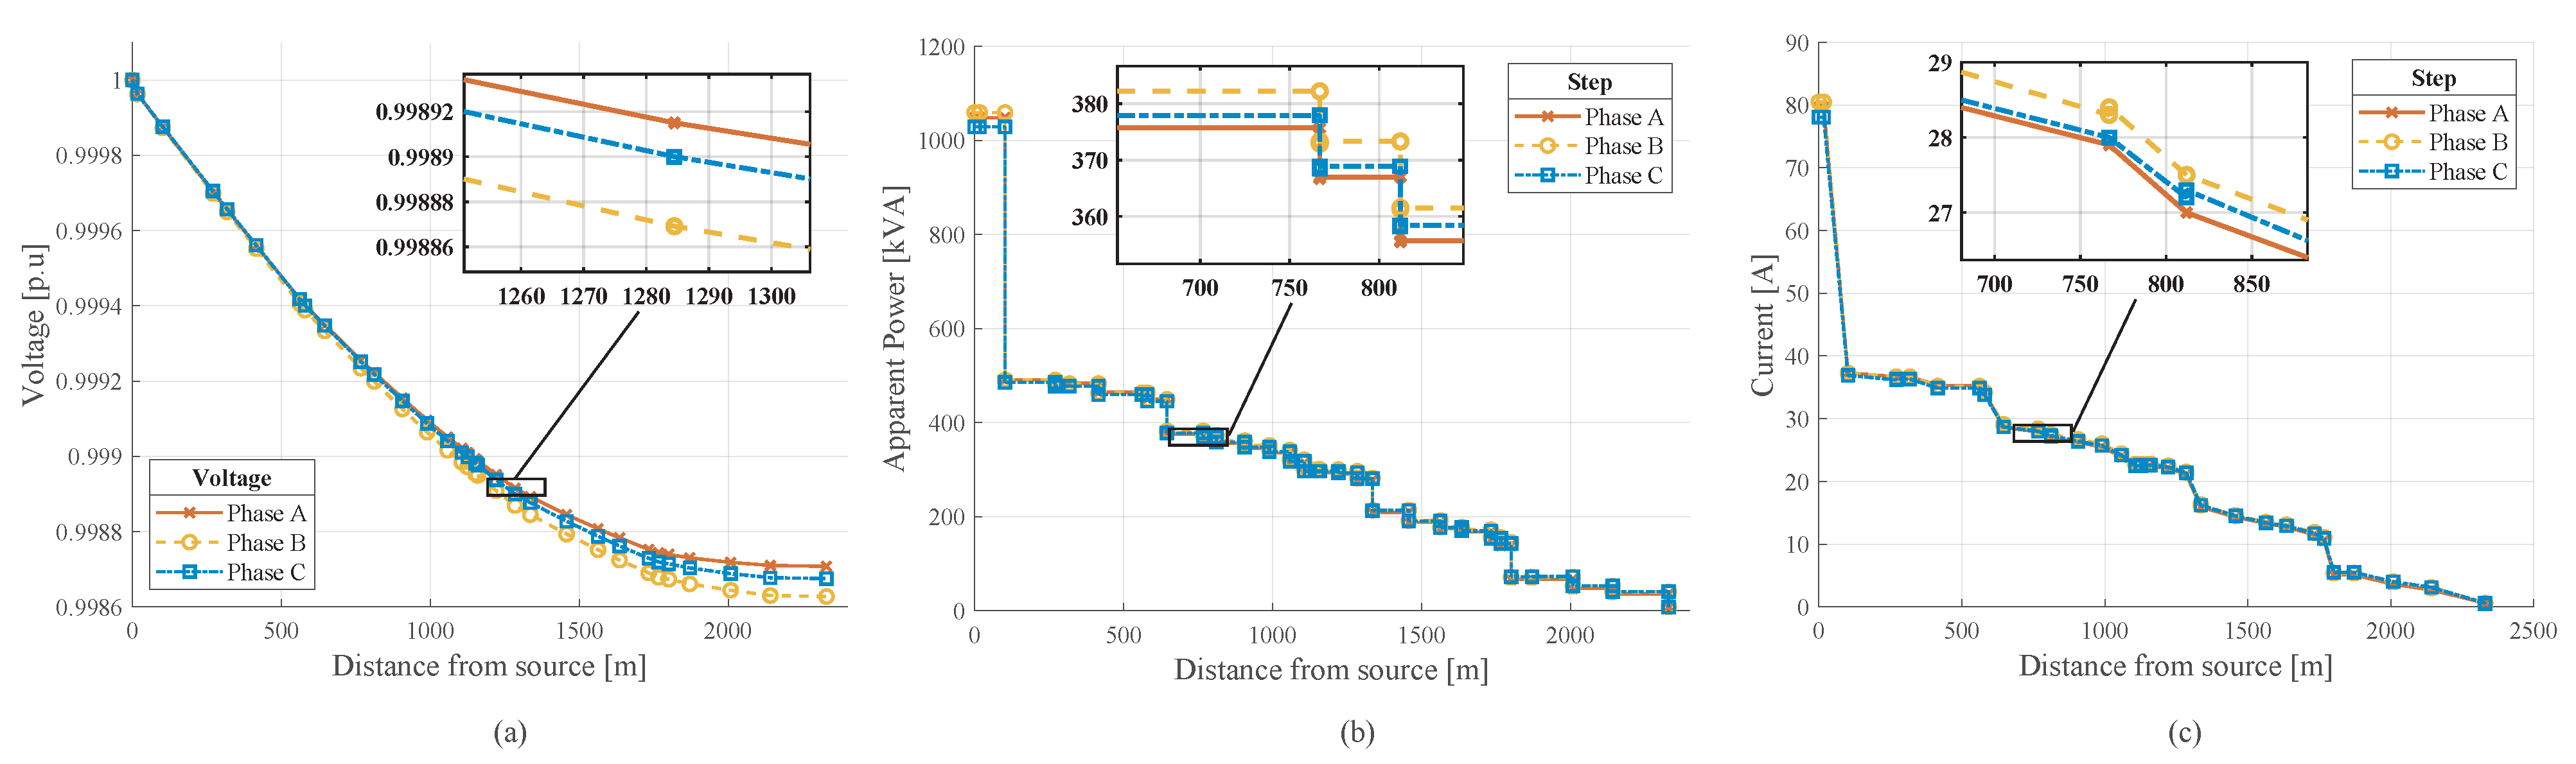
Figure 12 shows the simulation results in Cymdist of the primary feeder. In
Figure 12, the per-unit voltage profile of the more extended length feeder of the network has been obtained. This section comprises approximately 2500 m from the source to the farthest transformer.
The series impedance of the feeder has a linear relationship with length; thus, the voltage drop increases with distance.
Figure 12b,c show the load and current distribution along the primary feeder of the network. The conductor sections close to the source conduct most of the energy flow. Consequently, summation of all the currents flowing from the source to each concentrated load in the model. Therefore, the load and current steps decrease along the feeder.
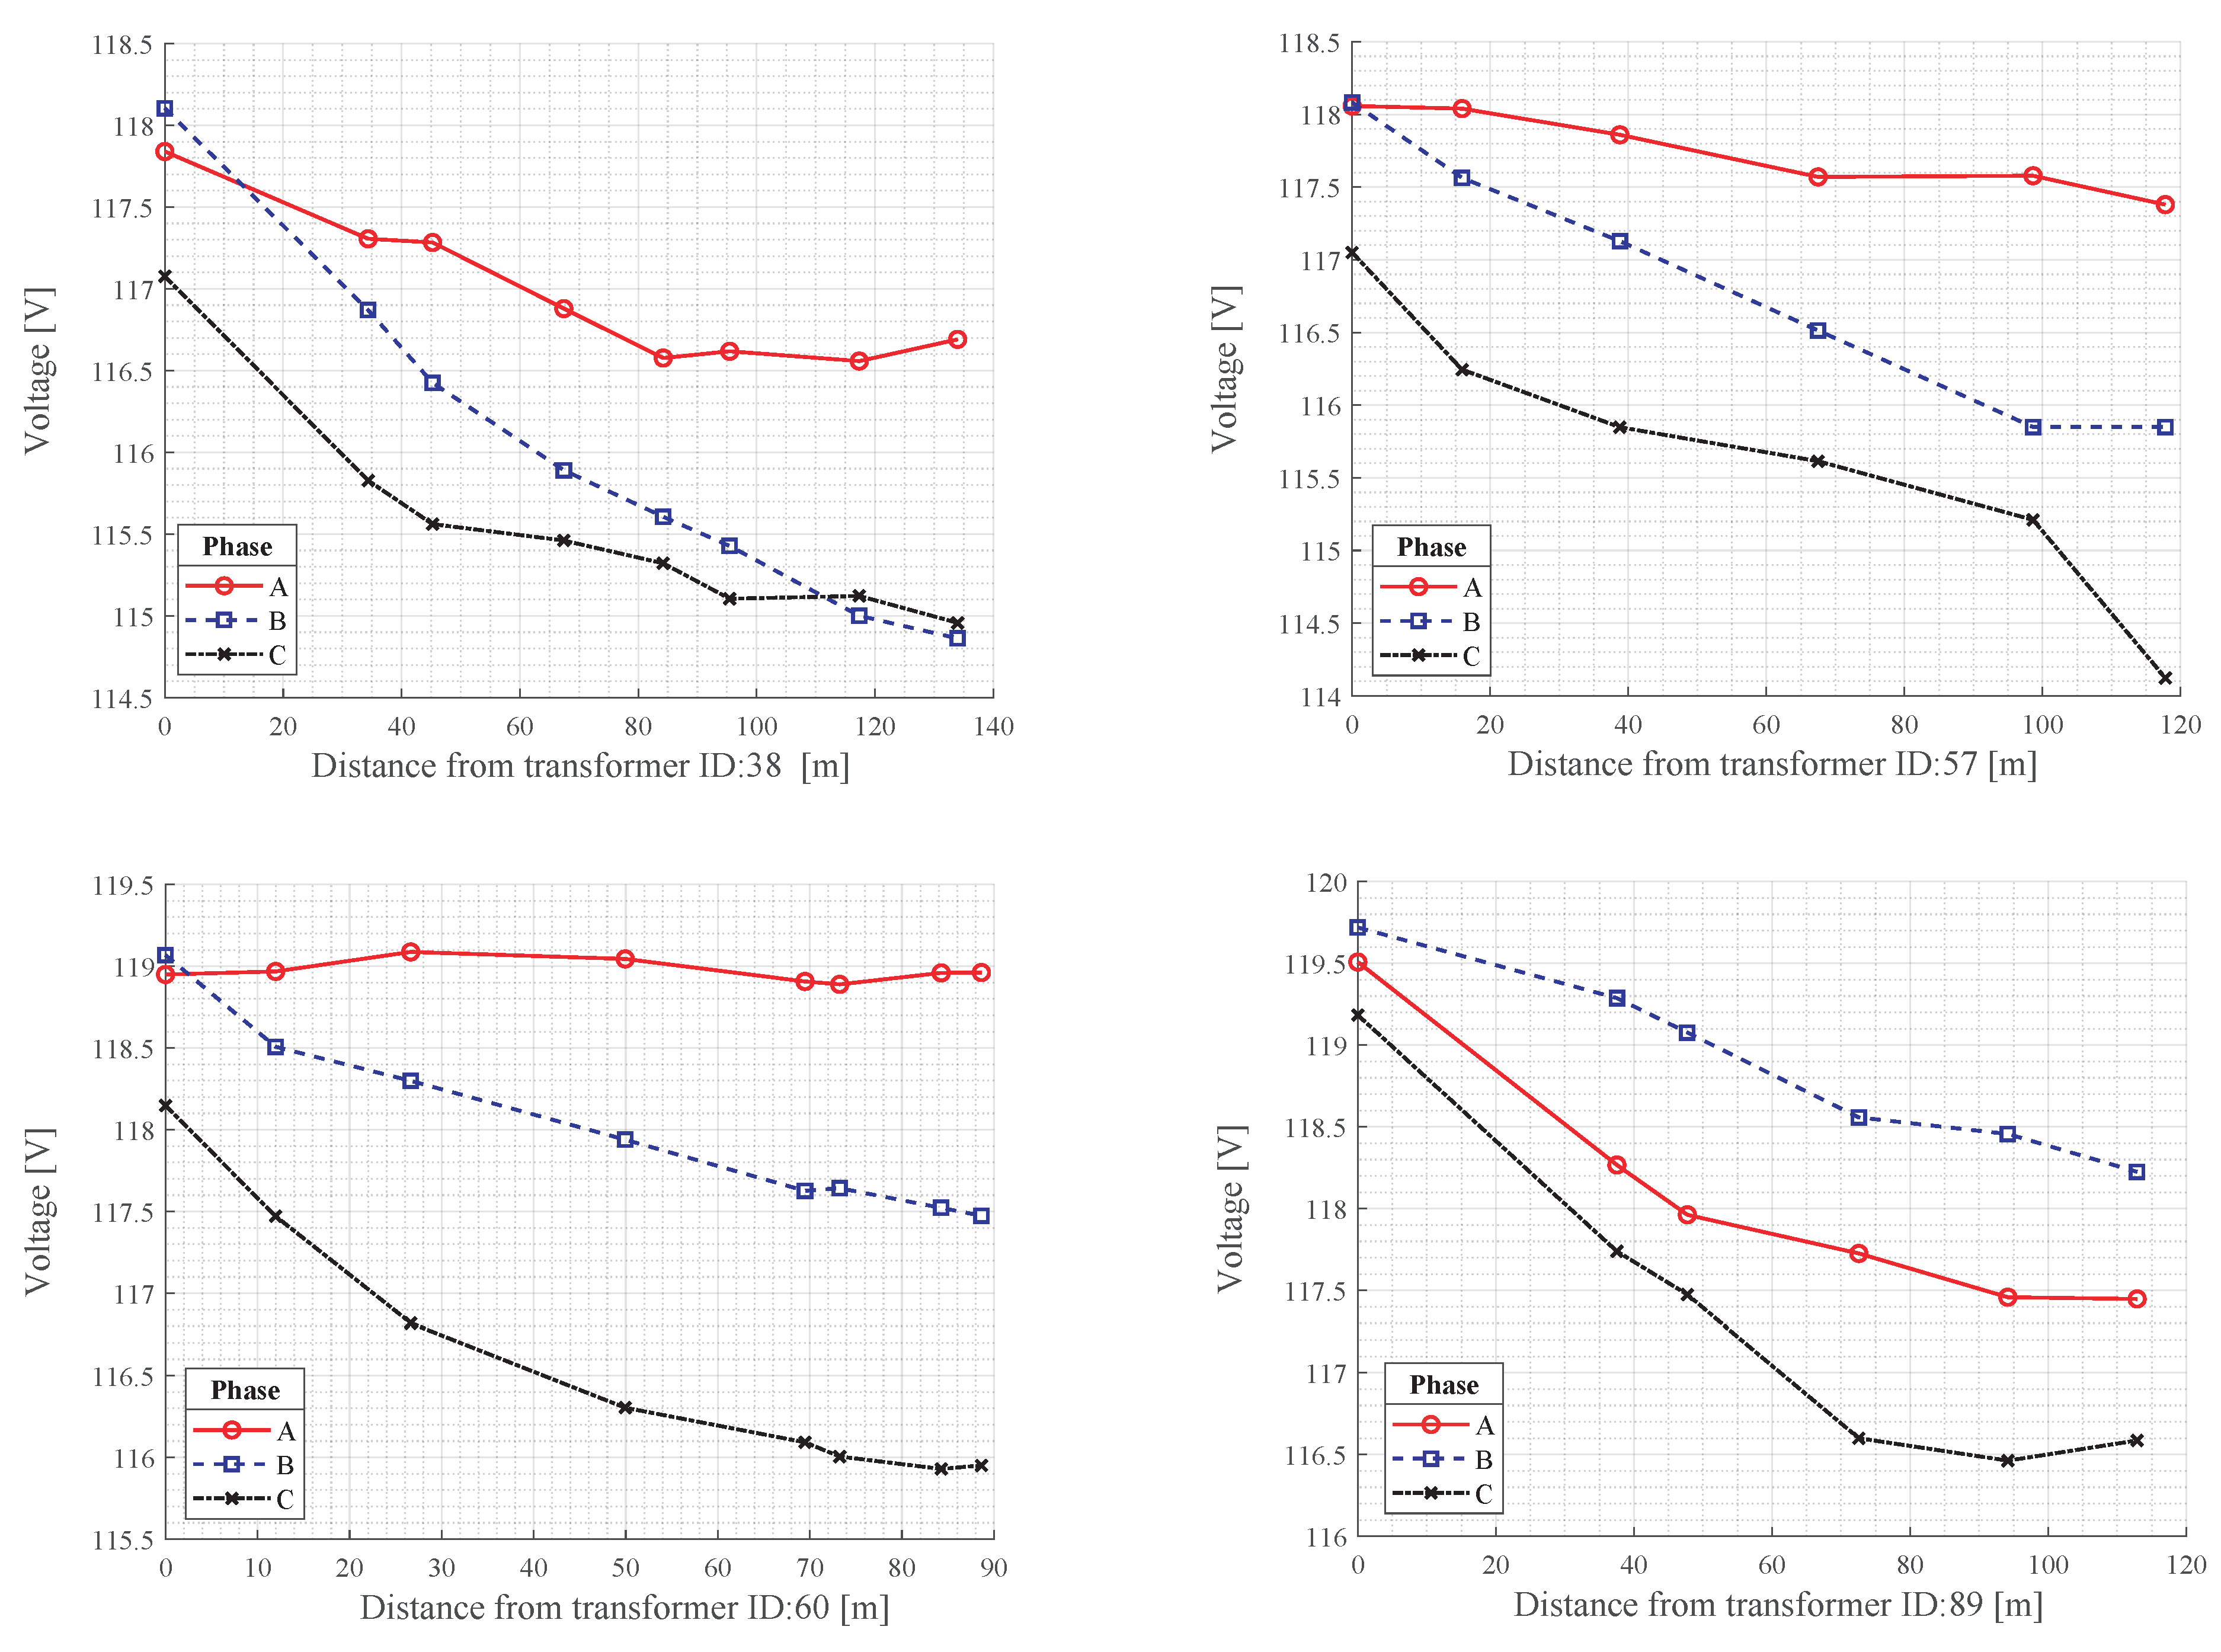
Figure 13 shows the network’s voltage profiles of four transformers. The service voltages are within the range defined by the standard IEEE 1547 of 0.917 p.u. as the minimum value.
Table 5 shows the position of transformers and wells in the geographical area. The results shown in
Table 6 correspond to the power flows of the secondary network lines of each transformer. The cable used for this network is a 3/0 AWG with a rated capacity of 250 A, where line currents obtained do not exceed this capacity.
5. Conclusions
This paper proposed an algorithm capable of reconfiguring power grids through graph theory. It allows restoring power grids after an extreme event in less time. The proposed heuristic is based on a Prim-modified algorithm to determine the optimal location of transformers and maintenance holes in the distribution network. The problem of connecting all transformers primaries in a radial topology feeding to 100% of end-users is addressed throughout MST methods.
The application of the minimum spanning tree technique allows reducing the indirect costs of the model. The number of transformers for reconfiguration is directly related to distance and capacity constraints, where transformers with higher capacity and longer spans cluster more users at the same node. Under these conditions, the number of transformers required is reduced. Therefore, excavation costs, installation, equipment, and materials are reduced, resulting in a viable project.
The fundamental contribution of this research is to provide a powerful tool to be used by utilities to reconfigure resilient power grids with geographical parameters (latitude and longitude). The model has been geo-referenced and exported to CYME through a shape-file format. The specialized distribution network software simulation has verified that the model complies with the technical criteria and standards defined by the local electricity companies. Consequently, the model complies with voltage drops of less than 3.5%. Future work will include power flow studies.


