
Conditions Driving Eco-Innovation in a Catching-Up Country—ICT vs. Industry in Poland


Abstract
:1. Introduction
2. Literature Review
3. Materials and Methods
4. Results

| Real Belonging of Objects | Classification of Objects Based on the Logit Model | ||
|---|---|---|---|
| Predicted: 0 | Predicted: 1 | Correct (%) | |
| Observed: 0 | 326 | 7 | 97.90 |
| Observed: 1 | 20 | 28 | 58.33 |
| Independent Variables | Eco-Innovation (Odds Ratio) |
|---|---|
| SmallF | 1.76 *** |
| MediumF | 1.87 *** |
| LargeF | 2.56 *** |
| R&D_inv | 1.32 * |
| BUIL_inv | 0.67 *** |
| SOUR_insid | 1.46 *** |
| SOUR_maga | 1.50 *** |
| SOUR_sup | 1.47 *** |
| SOUR_confe | 1.40 ** |
| SOUR_assoc | 1.97 *** |
| SOUR_com | 0.58 *** |
| SOUR_univ | 1.47 * |
| SOUR_foreignS | 1.71 ** |
| COOP_foreignS | 0.12 *** |
| SUPP_techinc | 2.02 * |
| SUPP_loanfund | 1.47 ** |
| SUPP_creditfund | 1.86 *** |
| BARR_cost | 1.29 * |
| BARR_fin | 1.40 ** |
| NewTECH_ent | 1.93 *** |
| NewTECH_coun | 2.11 *** |
| NewTECH_glob | 2.62 *** |
| EFF_num | 1.27 * |
| EFF_capa | 1.39 ** |
| EFF_mark | 1.39 ** |
| EFF_law | 1.77 *** |
| EFF_labo | 2.89 *** |
| EFF_mat | 1.53 ** |
| EFF_qual | 2.28 *** |
| Sample | 2645 |
| Wald χ2 | 942.68 |
| R2 Cox–Snell | 0.30 |
| R2 Nagelkerke | 0.48 |
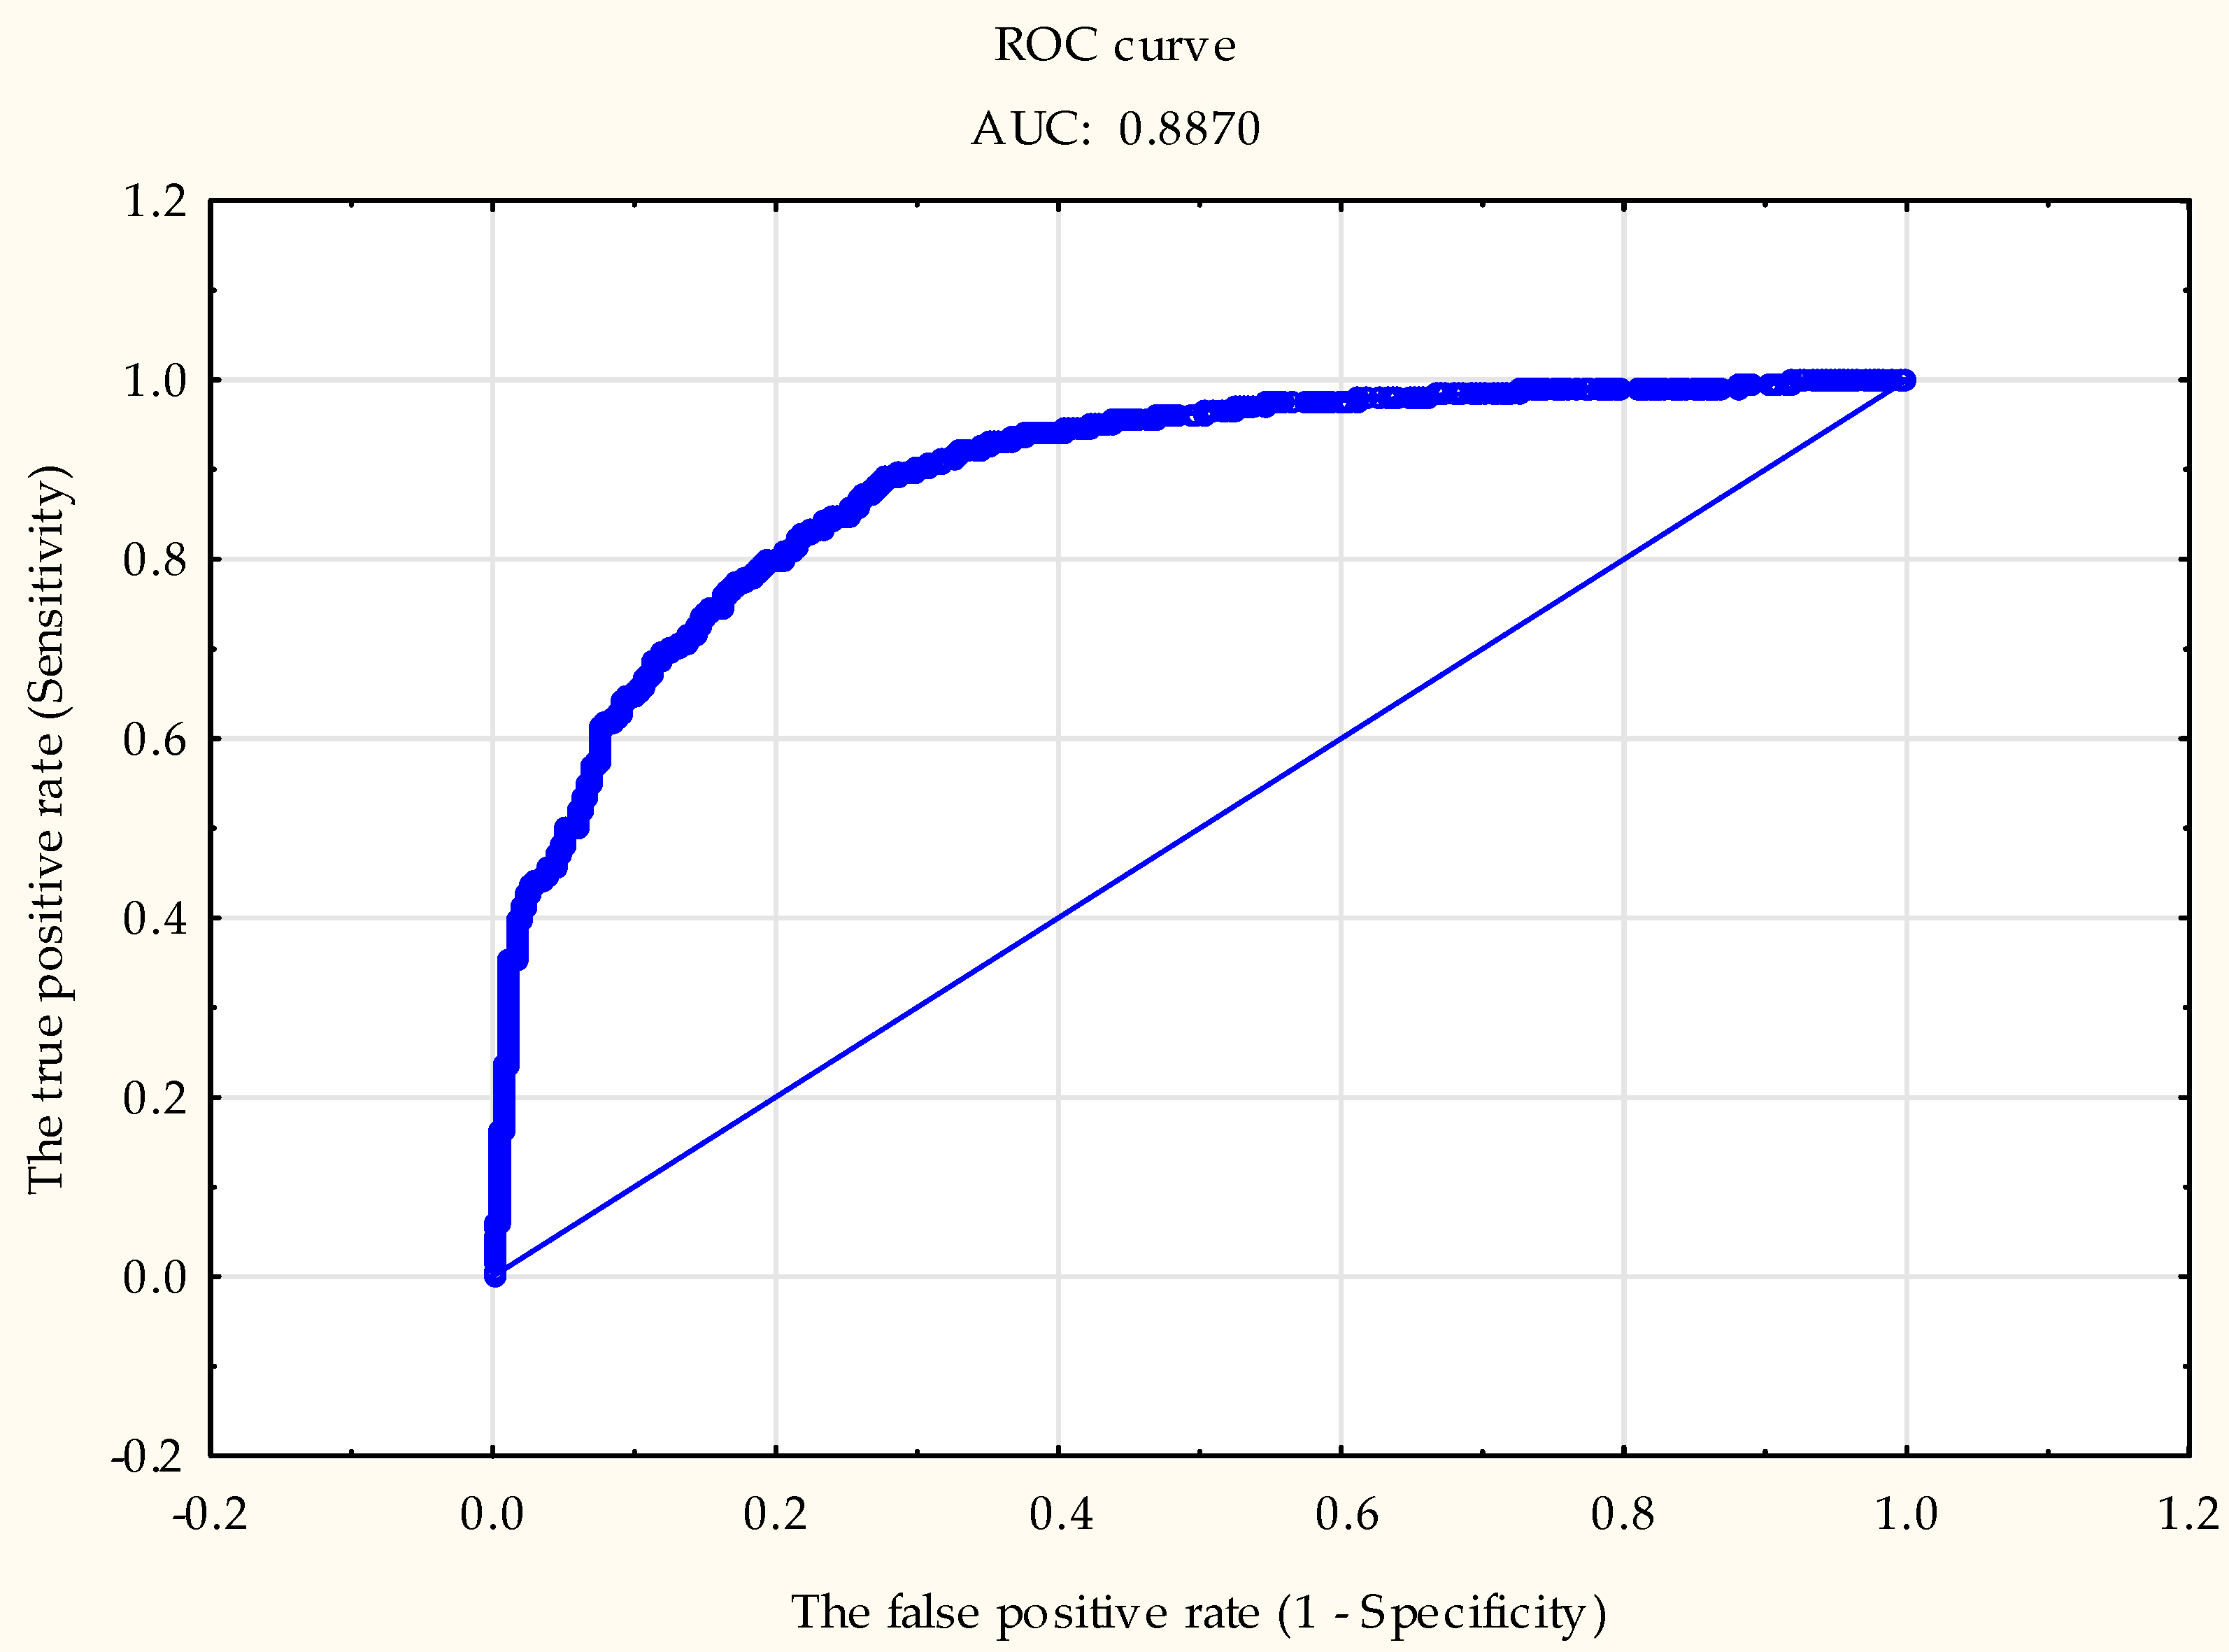
| AUC | 0.89 |
| p-value | 0.00 |
| Hosmer–Lemeshow test | |
| chi-square | 10.44 |
| p-value | 0.24 |
| Real Belonging of Objects | Classification of Objects Based on the Logit Model | ||
|---|---|---|---|
| Predicted: 0 | Predicted: 1 | Correct (%) | |
| Observed: 0 | 2045 | 102 | 95.25 |
| Observed: 1 | 217 | 281 | 56.43 |
5. Discussion
6. Conclusions
Author Contributions
Funding
Institutional Review Board Statement
Informed Consent Statement
Data Availability Statement
Conflicts of Interest
References
- Jäger-Waldau, A.; Kougias, I.; Taylor, N.; Thiel, C. How photovoltaics can contribute to GHG emission reductions of 55% in the EU by 2030. Renew. Sustain. Energy Rev. 2020, 126, 109836. [Google Scholar] [CrossRef]
- Beltrán-Esteve, M.; Picazo-Tadeo, A.J. Assessing environmental performance in the European Union: Eco-innovation versus catching-up. Energy Policy 2017, 104, 240–252. [Google Scholar] [CrossRef]
- Rodríguez-Antón, J.M.; Rubio-Andrada, L.; Celemín-Pedroche, M.S.; Ruíz-Peñalver, S.M. From the circular economy to the sustainable development goals in the European Union: An empirical comparison. Int. Environ. Agreem. 2022, 22, 67–95. [Google Scholar] [CrossRef]
- Puangpronpitag, S. Triple Helix Model and Knowledge-Based Entrepreneurship in Regional Engagement: A Case Study of Thai and UK Universities. Procedia Comput. Sci. 2019, 158, 565–572. [Google Scholar] [CrossRef]
- Lee, Y.H.; Kim, Y.J. Analyzing interaction in R&D networks using the Triple Helix method: Evidence from industrial R&D programs in Korean government. Technol. Forecast. Soc. Change 2016, 110, 93–105. [Google Scholar] [CrossRef]
- Peiro-Signes, A.; Segarra-Oña, M.; Trull-Domínguez, Ó.; Sánchez-Planelles, J. Exposing the ideal combination of endogenous–exogenous drivers for companies’ ecoinnovative orientation: Results from machine-learning methods. Soc. Econ. Plan. Sci. 2022, 79, 101145. [Google Scholar] [CrossRef]
- Demirel, P.; Kesidou, E. Stimulating different types of eco-innovation in the UK: Government policies and firm motivations. Ecol. Econ. 2011, 70, 1546–1557. [Google Scholar] [CrossRef]
- Ivana, S.; Starciuc, N.; Costache, C.; Costache, D. Biodiversity in lignocellulolytic fungi as a source of ecoinnovation in “white biotechnology” for a circular bioeconomy. In Harnessing Tangible and Intangible Assets in The Context of European Integration and Globalization: Challenges Ahead; Chivu, L., IoanFranc, V., Georgescu, G., Andrei, J.V., Eds.; Peter Lang: Bern, Switzerland, 2021; Volume I–II, pp. 1105–1116. [Google Scholar]
- Miret-Pastor, L.; Segarra-Ona, M.D.V.; Peiro-Signes, A. How to rate Ecoinnovation? A tourism sector indicator’s analysis. Tec Empresarial 2011, 5, 15–25. [Google Scholar]
- Trapitsin, S.Y.; Apevalova, Z.V.; Loshchilova, M.A.; Al Leonova, L.; Trofimova, I.B.; Yeroma, M.V. Eco-innovative competencies of mining engineers in the context of environmental management system requirements. In Proceedings of the XVII International Conference of Students and Young Scientists Prospects of Fundamental Sciences Development (Pfsd-2020), Tomsk, Russia, 24–27 April 2020; Book Series SHS Web of Conferences. Volume 80, p. 01016. [Google Scholar] [CrossRef]
- Nemoianu, E.L.; Paraschiv, D.M.; Olaru, C.A.; Voicu-Dorobantu, R. Green Marketing Strategies Applied in the Romanian Construction Sector. Qual. Access Success 2013, 14, 103–106. [Google Scholar]
- Romeni, G.; Appio, F.P.; Martini, A.; Mercat, B.; Jean-Marie, A.; Joubert, C. Enhancing Ecoinnovation Performance: Evidence from a Water Footprint Assessment in the Manufacturing Industry. IEEE Trans. Eng. Manag. 2020, 67, 724–739. [Google Scholar] [CrossRef]
- Statistics Poland. Quarterly National Accounts of Gross Domestic Product 2016–2020; National Accounts Department: Warsaw, Poland, 2021. Available online: https://stat.gov.pl/obszary-tematyczne/rachunki-narodowe/roczne-rachunki-narodowe/rachunki-narodowe-wedlug-sektorow-instytucjonalnych-w-latach-2016-2019,4,16.html (accessed on 20 June 2022).
- Sorli, M.; Stokic, D. Future Trends in Product/Process Innovation. Int. J. Innov. Technol. Manag. 2011, 08, 577–599. [Google Scholar] [CrossRef]
- Balocco, R.; Ciappini, A.; Corso, M. The impact of ICT sourcing on ICT organisation, competences and continuous innovation. Int. J. Technol. Manag. 2012, 60, 179–201. [Google Scholar] [CrossRef]
- Foxon, T.J. A Coevolutionary Framework for Analysing a Transition to a Sustainable Low Carbon Economy. Ecol. Econ. 2011, 70, 2258–2267. [Google Scholar] [CrossRef]
- Andersena, A.D.; Johnson, B. Low-carbon development and inclusive innovation systems. Innov. Dev. 2015, 5, 279–296. [Google Scholar] [CrossRef] [Green Version]
- Sagar, A.D.; Bremner, C.; Grubb, M. Climate Innovation Centres: A partnership approach to meeting energy and climate challenges. Nat. Resour. Forum 2009, 33, 274–384. [Google Scholar] [CrossRef]
- Jakobsen, S.; Clausen, T.H. Innovating for a Greener Future: The Direct and Indirect Effects of Firms’ Environmental Objectives on the Innovation Process. J. Clean. Prod. 2016, 128, 131–141. [Google Scholar] [CrossRef]
- Iizuka, M. Diverse and uneven pathways towards transition to low carbon development: The case of solar PV technology in China. Innov. Dev. 2015, 5, 241–261. [Google Scholar] [CrossRef]
- Aytekin, A.; Ecer, F.; Korucuk, S.; Karamaşa, Ç. Global innovation efficiency assessment of EU member and candidate countries via DEA-EATWIOS multi-criteria methodology. Technol. Soc. 2022, 68, 101896. [Google Scholar] [CrossRef]
- Cherrafi, A.; Elfezazi, S.; Govindan, K.; Garza-Reyes, J.A.; Benhida, K.; Mokhlis, A. A framework for the integration of Green and Lean Six Sigma for superior sustainability performance. Int. J. Prod. Res. 2017, 55, 4481–4515. [Google Scholar] [CrossRef]
- Urbaniec, M. Towards Sustainable Development Through Eco-Innovations: Drivers and Barriers in Poland. Econ. Sociol. 2015, 8, 179–190. [Google Scholar] [CrossRef]
- Chien, F.; Kamran, H.W.; Nawaz, M.A.; Thach, N.N.; Long, P.D.; Baloch, Z.A. Assessment of the prioritization of barriers to green innovations: Small and medium-sized enterprises Nexus. Environ. Dev. Sustain. 2022, 24, 1897–1927. [Google Scholar] [CrossRef]
- De Marchi, V. Environmental innovation and R&D cooperation: Empirical evidence from Spanish manufacturing firms. Res. Policy 2012, 14, 614–623. [Google Scholar] [CrossRef]
- Peñasco, C.; del Río, P.; Romero-Jordán, D. Analysing the Role of International Drivers for Eco-innovators. J. Int. Manag. 2017, 23, 56–71. [Google Scholar] [CrossRef]
- Thollander, P.; Backlund, S.; Trianni, A.; Cagno, E. Beyond barriers—A case study on driving forces for improved energy efficiency in the foundry industries in Finland, France, Germany, Italy, Poland, Spain, and Sweden. Appl. Energy 2013, 111, 636–643. [Google Scholar] [CrossRef] [Green Version]
- Costa-Campi, M.T.; García-Quevedo, J.; Segarra, A. Energy efficiency determinants: An empirical analysis of Spanish innovative firms. Energy Policy 2015, 83, 229–239. [Google Scholar] [CrossRef] [Green Version]
- Trianni, A.; Cagno, E. Dealing with barriers to energy efficiency and SMEs: Some empirical evidences. Energy 2012, 37, 494–504. [Google Scholar] [CrossRef]
- Merlevede, B.; Verbeke, T.; De Clercq, M. The EKC for SO2: Does firm size matter? Ecol. Econ. 2006, 59, 451–461. [Google Scholar] [CrossRef] [Green Version]
- Kesidou, E.; Demirel, P. On the drivers of eco-innovations: Empirical evidence from the UK. Res. Policy 2012, 41, 862–870. [Google Scholar] [CrossRef]
- del Río, P.; Peñasco, C.; Romero-Jordánr, D. What drives eco-innovators?: A critical review of the empirical literature based on econometric methods. J. Clean. Prod. 2016, 112, 2158–2170. [Google Scholar] [CrossRef]
- Lofsten, H. Product innovation processes and the trade-off between product innovation performance and business performance. Eur. J. Innov. Manag. 2014, 17, 61–84. [Google Scholar] [CrossRef]
- Salas-Fumás, V.; Ortiz, J. Innovations’ Success and Failure in the Business Cycle. Sustainability 2019, 11, 4187. [Google Scholar] [CrossRef] [Green Version]
- Spescha, A.; Woerter, M. Innovation and firm growth over the business cycle. Ind. Innov. 2019, 26, 321–347. [Google Scholar] [CrossRef]
- Hervas-Oliver, J.L.; Sempere-Ripoll, F.; Boronat-Moll, C. Technological innovation typologies and open innovation in SMEs: Beyond internal and external sources of knowledge. Technol. Forecast. Soc. Change 2021, 162, 120338. [Google Scholar] [CrossRef]
- Badir, Y.F.; Frank, B.; Bogers, M. Employee-level open innovation in emerging markets: Linking internal, external, and managerial resources. J. Acad. Mark. Sci. 2020, 48, 891–913. [Google Scholar] [CrossRef] [Green Version]
- Horbach, J. Determinants of environmental innovation—new evidence from German panel data sources. Res. Policy 2008, 37, 163–173. [Google Scholar] [CrossRef] [Green Version]
- Torre, A. On the role played by temporary geographical proximity in knowledge transmission. Reg. Stud. 2008, 42, 869–889. [Google Scholar] [CrossRef] [Green Version]
- Wu, Y.; Gu, F.; Ji, Y.; Guo, J.; Fan, J. Technological capability, eco-innovation performance, and cooperative R&D strategy in new energy vehicle industry: Evidence from listed companies in China. J. Clean. Prod. 2020, 261, 121157. [Google Scholar] [CrossRef]
- Comunian, R. Temporary clusters and communities of practice in the creative economy: Festivals as temporary knowledge networks. Space Cult. 2016, 20, 329–343. [Google Scholar] [CrossRef] [Green Version]
- Laursen, K.; Salter, A.J. The paradox of openness: Appropriability, external search and collaboration. Res. Pol. 2014, 43, 867–878. [Google Scholar] [CrossRef] [Green Version]
- Lundvall, B.Å. National innovation systems-analytical concept and development tool. Ind. Innov. 2007, 14, 95–119. [Google Scholar] [CrossRef]
- Tumelero, T.; Sbragia, R.; Evans, S. Cooperation in R & D and eco-innovations: The role in companies’ socioeconomic performance. J. Clean. Prod. 2019, 207, 1138–1149. [Google Scholar] [CrossRef]
- Sáez-Martínez, F.J.; González-Moreno, A.; Díaz-García, C. Environmental orientation as a determinant of innovation performance in young SMEs. Int. J. Environ. Res. 2014, 8, 635–642. [Google Scholar] [CrossRef]
- Tether, B.S.; Tajar, A. Beyond industry–university links: Sourcing knowledge for innovation from consultants, private research organisations and the public science-base. Res. Policy 2008, 37, 1079–1095. [Google Scholar] [CrossRef]
- Cesaroni, F.; Piccaluga, A. The activities of university knowledge transfer offices: Towards the third mission in Italy. J. Technol. Transf. 2016, 41, 753–777. [Google Scholar] [CrossRef]
- Theyel, G. Customer and supplier relations for environmental performance. In Greening the Supply Chain; Sarkis, J., Ed.; Springer: Berlin/Heidelberg, Germany, 2006; pp. 139–149. [Google Scholar] [CrossRef]
- Zhang, F.; Zhang, Z.; Xue, Y.; Zhang, J.; Che, Y. Dynamic Green Innovation Decision of the Supply Chain with Innovating and Free-Riding Manufacturers: Cooperation and Spillover. Hindawi Complex. 2020, 2020, 8937847. [Google Scholar] [CrossRef]
- Asheim, B.T.; Coenen, L. Knowledge bases and regional innovation systems: Comparing Nordic clusters. Res. Policy 2005, 34, 1173–1190. [Google Scholar] [CrossRef]
- Martínez-Ros, E.; Kunapatarawong, R. Green innovation and knowledge: The role of size. Bus. Strategy Environ. 2019, 8, 1045–1059. [Google Scholar] [CrossRef]
- Sharifi, H.; Liu, W.; Ismail, H.S. Higher education system and the ‘open’knowledge transfer: A view from perception of senior managers at university knowledge transfer offices. Stud. High. Educ. 2014, 39, 1860–1884. [Google Scholar] [CrossRef]
- Huggins, R.; Johnston, A.; Steffenson, R. Universities, knowledge networks and regional policy. Camb. J. Reg. Econ. Soc. 2008, 2, 321–340. [Google Scholar] [CrossRef]
- Laursen, K.; Salter, A. Searching high and low: What types of firms use universities as a source of innovation? Res. Policy 2004, 33, 1201–1215. [Google Scholar] [CrossRef]
- Rönnberg-Sjödin, D.; Frishammar, J.; Eriksoon, P.E. Managing Uncertainty and Equivocality in joint process development projects. J. Eng. Technol. Manag. 2016, 39, 13–25. [Google Scholar] [CrossRef]
- Meyer, A.; Hohmann, P. Other thoughts; other results? Remei’s bioRe organic cotton on its way to the mass market. Greener Manag. Int. 2000, 31, 59–70. [Google Scholar]
- Golicic, S.L.; Smith, C.D. A meta-analysis of environmentally sustainable supply chain management practices and firm performance. J. Supply Chain Manag. 2013, 49, 78–95. [Google Scholar] [CrossRef]
- Laursen, K.; Salter, A. Open for innovation: The role of openness in explaining innovation performance among U.K. manufacturing firms. Strateg. Manag. J. 2006, 27, 131–150. [Google Scholar] [CrossRef]
- Benitez, G.B.; Ayala, N.F.; Frank, A.G. Industry 4.0 innovation ecosystems: An evolutionary perspective on value cocreation. Int. J. Prod. Econ. 2020, 228, 107735. [Google Scholar] [CrossRef]
- Ardito, L.; Petruzzelli, A.M.; Dezi, L.; Castellano, S. The influence of inbound open innovation on ambidexterity performance: Does it pay to source knowledge from supply chain stakeholders? J. Bus. Res. 2020, 119, 321–329. [Google Scholar] [CrossRef]
- Power, D.; Jansson, J. Cyclical clusters in global circuits: Overlapping spaces in furniture trade fairs. Econ. Geogr. 2008, 84, 423–448. [Google Scholar] [CrossRef]
- Maskell, P.; Bathelt, H.; Malmberg, A. Building global knowledge pipelines: The role of temporary clusters. Eur. Plan. Stud. 2006, 14, 997–1013. [Google Scholar] [CrossRef]
- Sharma, G.; Bansal, P. Partners for Good: How Business and NGOs Engage the Commercial–Social Paradox. Organ. Stud. 2017, 38, 341–364. [Google Scholar] [CrossRef]
- Bathelt, H.; Golfetto, F.; Rinallo, D. Temporary markets and temporary clusters. In Trade Shows in the Globalizing Knowledge Economy; Bathelt, H., Golfetto, F., Rinallo, D., Eds.; Oxford University Press: Oxford, UK, 2014; pp. 40–55. [Google Scholar] [CrossRef]
- Triguero, A.; Moreno-Mondéjar, L.; Davia, M.A. Drivers of different types of eco-innovation in European SMEs. Ecol. Econ. 2013, 92, 25–33. [Google Scholar] [CrossRef]
- Mazzanti, M.; Zoboli, R. Embedding environmental innovation in local production systems: SME strategies, networking and industrial relations: Evidence on innovation drivers in industrial districts. Int. Rev. Appl. Econ. 2009, 23, 169–195. [Google Scholar] [CrossRef]
- Cainelli, G.; De Marchi, V.; Grandinetti, R. Does the development of environmental innovation require different resources? Evidence from Spanish manufacturing firms. J. Clean. Prod. 2015, 94, 211–220. [Google Scholar] [CrossRef]
- Belderbos, R.; Carree, M.; Lokshin, B. Cooperative R&D and firm performance. Res. Policy 2004, 33, 1477–1492. [Google Scholar] [CrossRef] [Green Version]
- Seuring, S.; Müller, M. From a literature review to a conceptual framework for sustainable supply chain management. J. Clean. Prod. 2008, 16, 1699–1710. [Google Scholar] [CrossRef]
- Campanella, F.; Della Peruta, M.R.; Bresciani, S.; Dezi, L. Quadruple helix and firms’ performance: An empirical verification in Europe. J. Technol. Transf. 2017, 42, 267–284. [Google Scholar] [CrossRef]
- Nieto, M.J.; Santamaría, L. The importance of diverse collaborative networks for the novelty of product innovation. Technovation 2007, 27, 367–377. [Google Scholar] [CrossRef] [Green Version]
- Goldbach, M.; Back, S.; Seuring, S. Co-ordinating sustainable cotton chains for the mass market. Greener Manag. Int. 2003, 43, 65–78. Available online: https://www.jstor.org/stable/pdf/greemanainte.43.65.pdf (accessed on 20 June 2022). [CrossRef]
- Arfi, W.B.; Hikkerova, L.; Sahut, J.M. External knowledge sources, green innovation and performance. Technol. Forecast. Soc. Change 2018, 129, 210–220. [Google Scholar] [CrossRef]
- Luzzini, D.; Amann, M.; Caniato, F.; Essig, M.; Ronchi, S. The path of innovation: Purchasing and supplier involvement into new product development. Ind. Mark. Manag. 2015, 47, 109–120. [Google Scholar] [CrossRef]
- Clauß, T. The influence of the type of relationship on the generation of innovations in buyer–supplier collaborations. Creat. Innov. Manag. 2012, 21, 388–411. [Google Scholar] [CrossRef]
- Li, H.L.; Tang, M.J. Vertical integration and innovative performance: The effects of external knowledge sourcing modes. Technovation 2010, 30, 401–410. [Google Scholar] [CrossRef]
- Rouyre, A.; Fernandez, A.S. Managing Knowledge Sharing-Protecting Tensions in Coupled Innovation Projects among Several Competitors. Calif. Manag. Rev. 2019, 62, 95–120. [Google Scholar] [CrossRef]
- Corsino, M.; Mariani, M.; Torrisi, S. Firm strategic behavior and the measurement of knowledge flows with patent citations. Strateg. Manag. J. 2019, 40, 1040–1069. [Google Scholar] [CrossRef]
- Cainelli, G.; Mazzanti, M.; Montresor, S. Environmental innovations, local networks and internationalization. Ind. Innov. 2012, 19, 697–734. [Google Scholar] [CrossRef] [Green Version]
- Belin, J.; Horbach, J.; Oltra, V. Determinants and specificities of eco-innovations –an econometric analysis for the French and German industry based on the community innovation Survey. Cah. GREThA 2011, 17, 523–543. Available online: http://ideas.repec.org/p/grt/wpegrt/2011-17.html (accessed on 20 June 2022).
- Norberg-Bohm, V. Creating incentives for environmentally enhancing technological change: Lessons from 30 years of US energy technology policy. Technol. Forecast. Soc. Change 2000, 65, 125–148. [Google Scholar] [CrossRef]
- Bossink, B. The interorganizational innovation processes of sustainable building: A Dutch case of joint building innovation in sustainability. Build. Environ. 2007, 42, 4086–4092. [Google Scholar] [CrossRef]
- Huggins, R.; Prokop, D.; Thompson, P. Universities and open innovation: The determinants of network centrality. J. Technol. Transf. 2020, 45, 718–757. [Google Scholar] [CrossRef] [Green Version]
- Freel, M.; de Jong, J.P.J. Market novelty, competence-seeking and innovation networking. Technovation 2009, 29, 873–884. [Google Scholar] [CrossRef]
- Mention, A.L. Co-operation and co-opetition as open innovation practices in the service sector: Which influence on innovation novelty? Technovation 2011, 31, 44–53. [Google Scholar] [CrossRef]
- Rocio Vasquez-Urriago, A.R.; Barge-Gil, A.; Modrego Rico, A. Science and Technology Parks and cooperation for innovation: Empirical evidence from Spain. Res. Policy 2016, 45, 137–147. [Google Scholar] [CrossRef]
- Albahari, A.; Barge-Gil, A.; Pérez-Canto, S.; Modrego, A. The influence of Science and Technology Park characteristics on firms’ innovation results. Reg. Sci. 2016, 97, 253–280. [Google Scholar] [CrossRef]
- Balle, A.R.; Steffen, M.O.; Curado, C.; Oliveira, M. Interorganizational knowledge sharing in a science and technology park: The use of knowledge sharing mechanisms. J. Knowl. Manag. 2019, 23, 2016–2038. [Google Scholar] [CrossRef]
- Sedita, S.R.; Apa, R.; Bassetti, T.; Grandinetti, R. Incubation matters:measuring the effect of business incubators on the innovation performance of start-ups. RD Manag. 2019, 49, 439–454. [Google Scholar] [CrossRef]
- Mansano, F.H.; Pereira, M.F. Business incubators as support mecha-nisms for the economic development: Case of Maringa’s technology incubator. Int. J. Innov. 2016, 4, 23–32. [Google Scholar] [CrossRef]
- Breznitz, S.M.; Zhang, Q.T. Fostering the growth of student start-ups from university accelerators: An entrepreneurial ecosystem perspective. Ind. Corp. Change 2019, 28, 855–873. [Google Scholar] [CrossRef]
- Marques, N.D.; Sbragia, R.; Oliveira, M.D.; Borini, F. Entrepreneur’s background and product innovation Evidences from technology-based incubat-ed firms. Manag. Res. J. Iberoam. Acad. Manag. 2019, 18, 153–169. [Google Scholar] [CrossRef]
- Rubin, T.H.; Aas, T.H.; Stead, A. Knowledge flow in technological business incubators: Evidence from Australia and Israel. Technovation 2015, 41, 11–24. [Google Scholar] [CrossRef]
- Baglieri, D.; Baldi, F.; Tucci, C.L. University technology transfer office business models: One size does not fit all. Technovation 2018, 76–77, 51–63. [Google Scholar] [CrossRef]
- Castillo, F.; Gilless, J.K.; Heiman, A.; Zilberman, D. Time of adoption and intensity of technology transfer: An institutional analysis of offices of technology transfer in the United States. J. Technol. Transf. 2018, 43, 120–138. [Google Scholar] [CrossRef]
- Secundo, G.; De Beer, C.; Fai, F.M.; Schutte, C.S.L. Increasing university entrepreneurialism: Qualitative insights from the technology transfer office. Meas. Bus. Excell. 2019, 23, 253–268. [Google Scholar] [CrossRef]
- Aernoudt, R. Executive forum: Seven ways to stimulate business angels’ investments. Venture Cap. 2005, 7, 359–371. [Google Scholar] [CrossRef]
- Vienna Initiative Working Group. Credit Guarantee Schemes for SME lending in Central, Eastern and South-Eastern Europe. A Report by the Vienna Initiative Working Group on Credit Guarantee Schemes November. 2014. Available online: http://vienna-initiative.com/wp-content/uploads/2014/11/2014_credit_guarantee_schemes_report_en.pdf (accessed on 20 June 2022).
- Zabolotskaya, V.V. Governmental Programs of Small Business Support in the USA. Mirovaya Ekon. I Mezhdunarodnye Otnos. 2019, 63, 15–22. [Google Scholar] [CrossRef]
- Pantic-Dragisic, S.; Soderlund, J. Swift transition and knowledge cycling: Key capabilities for successful technical and engineering consulting? Res. Policy 2020, 49, 1–15. [Google Scholar] [CrossRef]
- Barthelemy, J. The impact of technical consultants on the quality of their clients’ products: Evidence from the Bordeaux wine industry. Strateg. Manag. J. 2017, 38, 1174–1190. [Google Scholar] [CrossRef]
- Rauter, R.; Globocnik, D.; Perl-Vorbach, E.; Baumgartner, R.J. Open innovation and its effects on economic and sustainability innovation performance. J. Innov. Knowl. 2019, 4, 226–233. [Google Scholar] [CrossRef]
- Cheng, C.; Yang, C.; Sheu, C. Environmental Innovation and Business Performance. In Proceedings of the Tenth International Conference on Information and Management Sciences, Tibet, China, 6–11 August 2011; IMS: Hong Kong, China, 2011; Volume 10, pp. 192–198. [Google Scholar]
- Globocnik, D.; Faullant, R.; Parastuty, Z. Bridging strategic planning and business model management—A formal control framework to manage business model portfolios and dynamics. Eur. Manag. J. 2020, 38, 231–243. [Google Scholar] [CrossRef]
- Oke, A. Barriers to innovation management in service companies. J. Change Manag. 2004, 4, 31–44. [Google Scholar] [CrossRef]
- Hölzl, W.; Janger, J. Innovation Barriers across Firms and Countries; WIFO Working Paper; WIFO: Vienna, Austria, 2012; Volume 426, Available online: http://hdl.handle.net/10419/128992 (accessed on 20 June 2022).
- Sandberg, B.; Aarikka-Stenroos, L. What makes it so difficult? A systematic review on barriers to radical innovation. Ind. Mark. Manag. 2014, 43, 1293–1305. [Google Scholar] [CrossRef]
- Pereira Cabral, B.; Lage de Sousa, F.; Canêdo-Pinheiro, M. Assessing the impacts of innovation barriers: A qualitative analysis of Brazil’s natural resources industry. Resour. Policy 2020, 68, 101736. [Google Scholar] [CrossRef]
- Álvarez, R.; Crespi, G.A. Heterogeneous effects of financial constraints on innovation: Evidence from Chile. Sci. Public Policy 2015, 42, 711–724. [Google Scholar] [CrossRef] [Green Version]
- Torres de Oliveira, R.; Gentile-Lüdecke, S.; Figueira, S. Barriers to innovation and innovation performance: The mediating role of external knowledge search in emerging economies. Small Bus. Econ. 2022, 58, 1953–1974. [Google Scholar] [CrossRef]
- Zahler, A.; Goya, D.; Caamaño, M. The primacy of demand and financial obstacles in hindering innovation. Technol. Forecast. Soc. Change 2022, 174, 121199. [Google Scholar] [CrossRef]
- Frenkel, A. Barriers and Limitations in the Development of Industrial Innovation in the Region. Eur. Plan. Stud. 2003, 11, 115–137. [Google Scholar] [CrossRef] [Green Version]
- De Fuentes, C.; Dutrenit, G.; Santiago, F.; Gras, N. Determinants of innovation and productivity in the service sector in Mexico. Emerg. Mark. Finance Trade 2015, 51, 578–592. [Google Scholar] [CrossRef] [Green Version]
- Mohnen, P.; Mairesse, J.; Dagenais, M. Innovativity: A Comparison Across Seven European Countries. Econ. Innov. New Technol. 2006, 15, 391–413. [Google Scholar] [CrossRef] [Green Version]
- D’Este, P.; Iammarino, S.; Savona, M.; von Tunzelmann, N. What hampers innovation? Revealed barriers versus deterring barriers. Res. Policy 2012, 41, 482–488. [Google Scholar] [CrossRef]
- OECD. Eurostat Oslo Manual. Guidelines for Collecting and Interpreting Innovation Data, 3rd ed.; OECD: Paris, France, 2005; Available online: https://www.conicyt.cl/wp-content/uploads/2014/07/Manual-de-Oslo.pdf (accessed on 20 June 2022).
- OECD. Eurostat, Oslo Manual 2018: Guidelines for Collecting, Reporting and Using Data on Innovation: The Measurement of Scientific, Technological and Innovation Activities, 4th ed.; OECD Publishing: Paris, France; Eurostat: Luxembourg, 2018. [Google Scholar] [CrossRef]
- Fahrmeir, L.; Kneib, T.; Lang, S.; Marx, B. Regression: Models, Methods and Applications; Springer: Berlin, Germany, 2013; p. 663. ISBN 9783642343322. [Google Scholar]
- Ward, M.D.; Ahlquist, J.S. Maximum Likelihood for Social Science: Strategies for Analysis; Cambridge University Press: Cambridge, UK, 2018; p. 36. ISBN 9781316636824. [Google Scholar]
- Wasserstein, R.L.; Lazar, N.A. The ASA’s Statement on p-Values: Context, Process, and Purpose. Am. Stat. 2016, 70, 129–133. [Google Scholar] [CrossRef] [Green Version]
- Hosmer, D.W.; Lemeshow, S. Applied Logistic Regression; Wiley: New York, NY, USA, 2013; ISBN 9780470582473. [Google Scholar]
- Pampel, F.C. Logistic Regression: A Primer; Sage University Papers Series on Quantitative Applications in the Social Sciences; C.A. Sage Publications: New York, NY, USA, 2000. [Google Scholar]
- Melo, F. Area under the ROC Curve. In Encyclopedia of Systems Biology; Dubitzky, W., Wolkenhauer, O., Cho, K.H., Yokota, H., Eds.; Springer: Berlin/Heidelberg, Germany, 2013. [Google Scholar] [CrossRef]
- Scarpellini, S.; Portillo-Tarragona, P.; Marin-Vinuesa, L.M.; Moneva, J.M. Green patents in the manufacturing sector: The influence of businesses’ resources and capabilities. Universia Bus. Rev. 2017, 56, 18–35. [Google Scholar] [CrossRef]
- Dost, M.; Badir, Y.F.; Sambasivan, M.; Umrani, W.A. Open-and-closed process innovation generation and adoption: Analyzing the effects of sources of knowledge. Technol. Soc. 2020, 62, 101309. [Google Scholar] [CrossRef]
- Silva, M.; Howells, J.; Khan, Z.; Meyer, M. Innovation ambidexterity and public innovation Intermediaries: The mediating role of capabilities. J. Bus. Res. 2022, 149, 14–29. [Google Scholar] [CrossRef]
- Baldwin, J.; Lin, Z. Impediments to advanced technology adoption for Canadian manufacturers. Res. Policy 2002, 31, 1–18. [Google Scholar] [CrossRef]
- Tourigny, D.; Le, C. Impediments to innovation faced by Canadian manufacturing firms. Econ. Innov. New Technol. 2004, 13, 217–250. [Google Scholar] [CrossRef]
- Amara, N.; Landry, R.; Becheikh, N.; Ouimet, M. Learning and novelty of innovation in established manufacturing SMEs. Technovation 2008, 28, 450–463. [Google Scholar] [CrossRef]
- Macurova, P.; Peterkova, J.; Czerna, K. Analysis of Types, Intensity, Methods and Effects of Process Innovations. Qual. Innov. Prosper. Kval. Inovacia Prosper. 2019, 23, 74–89. [Google Scholar] [CrossRef] [Green Version]
| Groups of Determinants | Theoretical Support |
|---|---|
| Company size | [24,25,26,27,28,29,30,31,32] |
| Business cycle | [2,34,35] |
| Internal resources of the company (R&D activities, internal knowledge) | [25,36,37,38,41,42] |
| Level of novelty of the created innovations | [71,84,85] |
| Innovation cooperation | [25,26,42,49,58,59,64,67,68,69,70,71,72,73,74,75,76,77,78,79,80,81,82,83] |
| Institutional support for innovation | [86,87,88,89,90,91,92,93,94,95,96,97,98,99,100,101] |
| Sources of innovative activity | [36,37,42,45,46,47,48,49,50,51,52,65,66] |
| Effects of innovative activity | [6,7,102,103,104,110,113] |
| Barriers to innovative activity | [105,106,107,108,109,110,111,112,113] |
| Variables | Description |
|---|---|
| Dependent Variable | |
| ECO_INN | Nominal variable; 0: lack of eco-innovation; 1: ecoinnovation |
| Independent Variables | |
| Enterprises Attributes | |
| BUIL_inv | Dummy variable; 1: new building investment; 0: otherwise |
| R&D_inv | Dummy variable; 1: R&D investment; 0: otherwise |
| Innovation Novelty | |
| NewTECH_ent | Dummy variable; 1: new technology to the enterprise only; 0: otherwise |
| NewTECH_coun | Dummy variable; 1: new technology to the country; 0: otherwise |
| NewTECH_glob | Dummy variable; 1: global new technology; 0: otherwise |
| Sectoral and Science | |
| COOP_sup | Dummy variable; 1: inn. cooperation with supplier; 0: otherwise |
| COOP_com | Dummy variable; 1: inn. cooperation with competitor; 0: otherwise |
| COOP_foreignS | Dummy variable; 1: inn. cooperation with foreign science unit; 0: otherwise |
| COOP_group | Dummy variable; 1: inn. cooperation within capital group; 0: otherwise |
| Support System | |
| SUPP_techinc | Dummy variable; 1: cooperation with technology incubator; 0: otherwise |
| SUPP_loanfund | Dummy variable; 1: cooperation with local or regional loan fund; 0: otherwise |
| SUPP_creditfund | Dummy variable; 1: cooperation with credit guarantee fund; 0: otherwise |
| SUPP_traincentr | Dummy variable; 1: cooperation with training and consulting centre; 0: otherwise |
| Source of the New Knowledge | |
| SOUR_insid | Dummy variable; 1: Source: inside the firm; 0: otherwise |
| SOUR_maga | Dummy variable; 1: Source: magazine and publication; 0: otherwise |
| SOUR_sup | Dummy variable; 1: Source: supplier; 0: otherwise |
| SOUR_com | Dummy variable; 1: Source: competitor; 0: otherwise |
| SOUR_cus | Dummy variable; 1: Source: customer; 0: otherwise |
| SOUR_confe | Dummy variable; 1: Source: conference and trade fair; 0: otherwise |
| SOUR_assoc | Dummy variable; 1: Source: scientific and technology association; 0: otherwise |
| SOUR_univ | Dummy variable; 1: Source: university; 0: otherwise |
| SOUR_foreignS | Dummy variable; 1: Source: foreign scientific institutes; 0: otherwise |
| Barier for Innovation | |
| BARR_cost | Dummy variable; 1: Barrier: cost of new technology; 0: otherwise |
| BARR_fin | Dummy variable; 1: Barrier: lack of money; 0: otherwise |
| Effect of innovation | |
| EFF_mat | Dummy variable; 1: reduction in materials and energy consumption; 0: otherwise |
| EFF_num | Dummy variable; 1: increasing the number of different products; 0: otherwise |
| EFF_capa | Dummy variable; 1: increasing production capacity; 0: otherwise |
| EFF_mark | Dummy variable; 1: entering a new market; 0: otherwise |
| EFF_law | Dummy variable; 1: fulfilment of regulations and standards; 0: otherwise |
| EFF_labo | Dummy variable; 1: reducing unit labour costs; 0: otherwise |
| EFF_qual | Dummy variable; 1: improvement in the quality of products; 0: otherwise |
| Control Variables | |
| SmallF | Dummy variable; 1: small firm; 0: otherwise |
| MediumF | Dummy variable; 1: medium firm; 0: otherwise |
| LargeF | Dummy variable; 1: large firm; 0: otherwise |
| t | Time variable |
| Independent Variables | Eco-Innovation (Odds Ratio) |
|---|---|
| BUIL_inv | 5.26 *** |
| SOUR_maga | 6.07 *** |
| SOUR_com | 2.42 ** |
| SOUR_cus | 2.37 * |
| COOP_sup | 7.35 *** |
| COOP_com | 0.04 *** |
| COOP_group | 0.04 ** |
| SUPP_creditfund | 6.79 *** |
| SUPP_traincentr | 2.52 * |
| NewTECH_coun | 3.65 ** |
| EFF_mat | 9.04 *** |
| Sample | 383 |
| Wald χ2 | 127.61 |
| R2 Cox–Snell | 0.28 |
| R2 Nagelkerke | 0.54 |
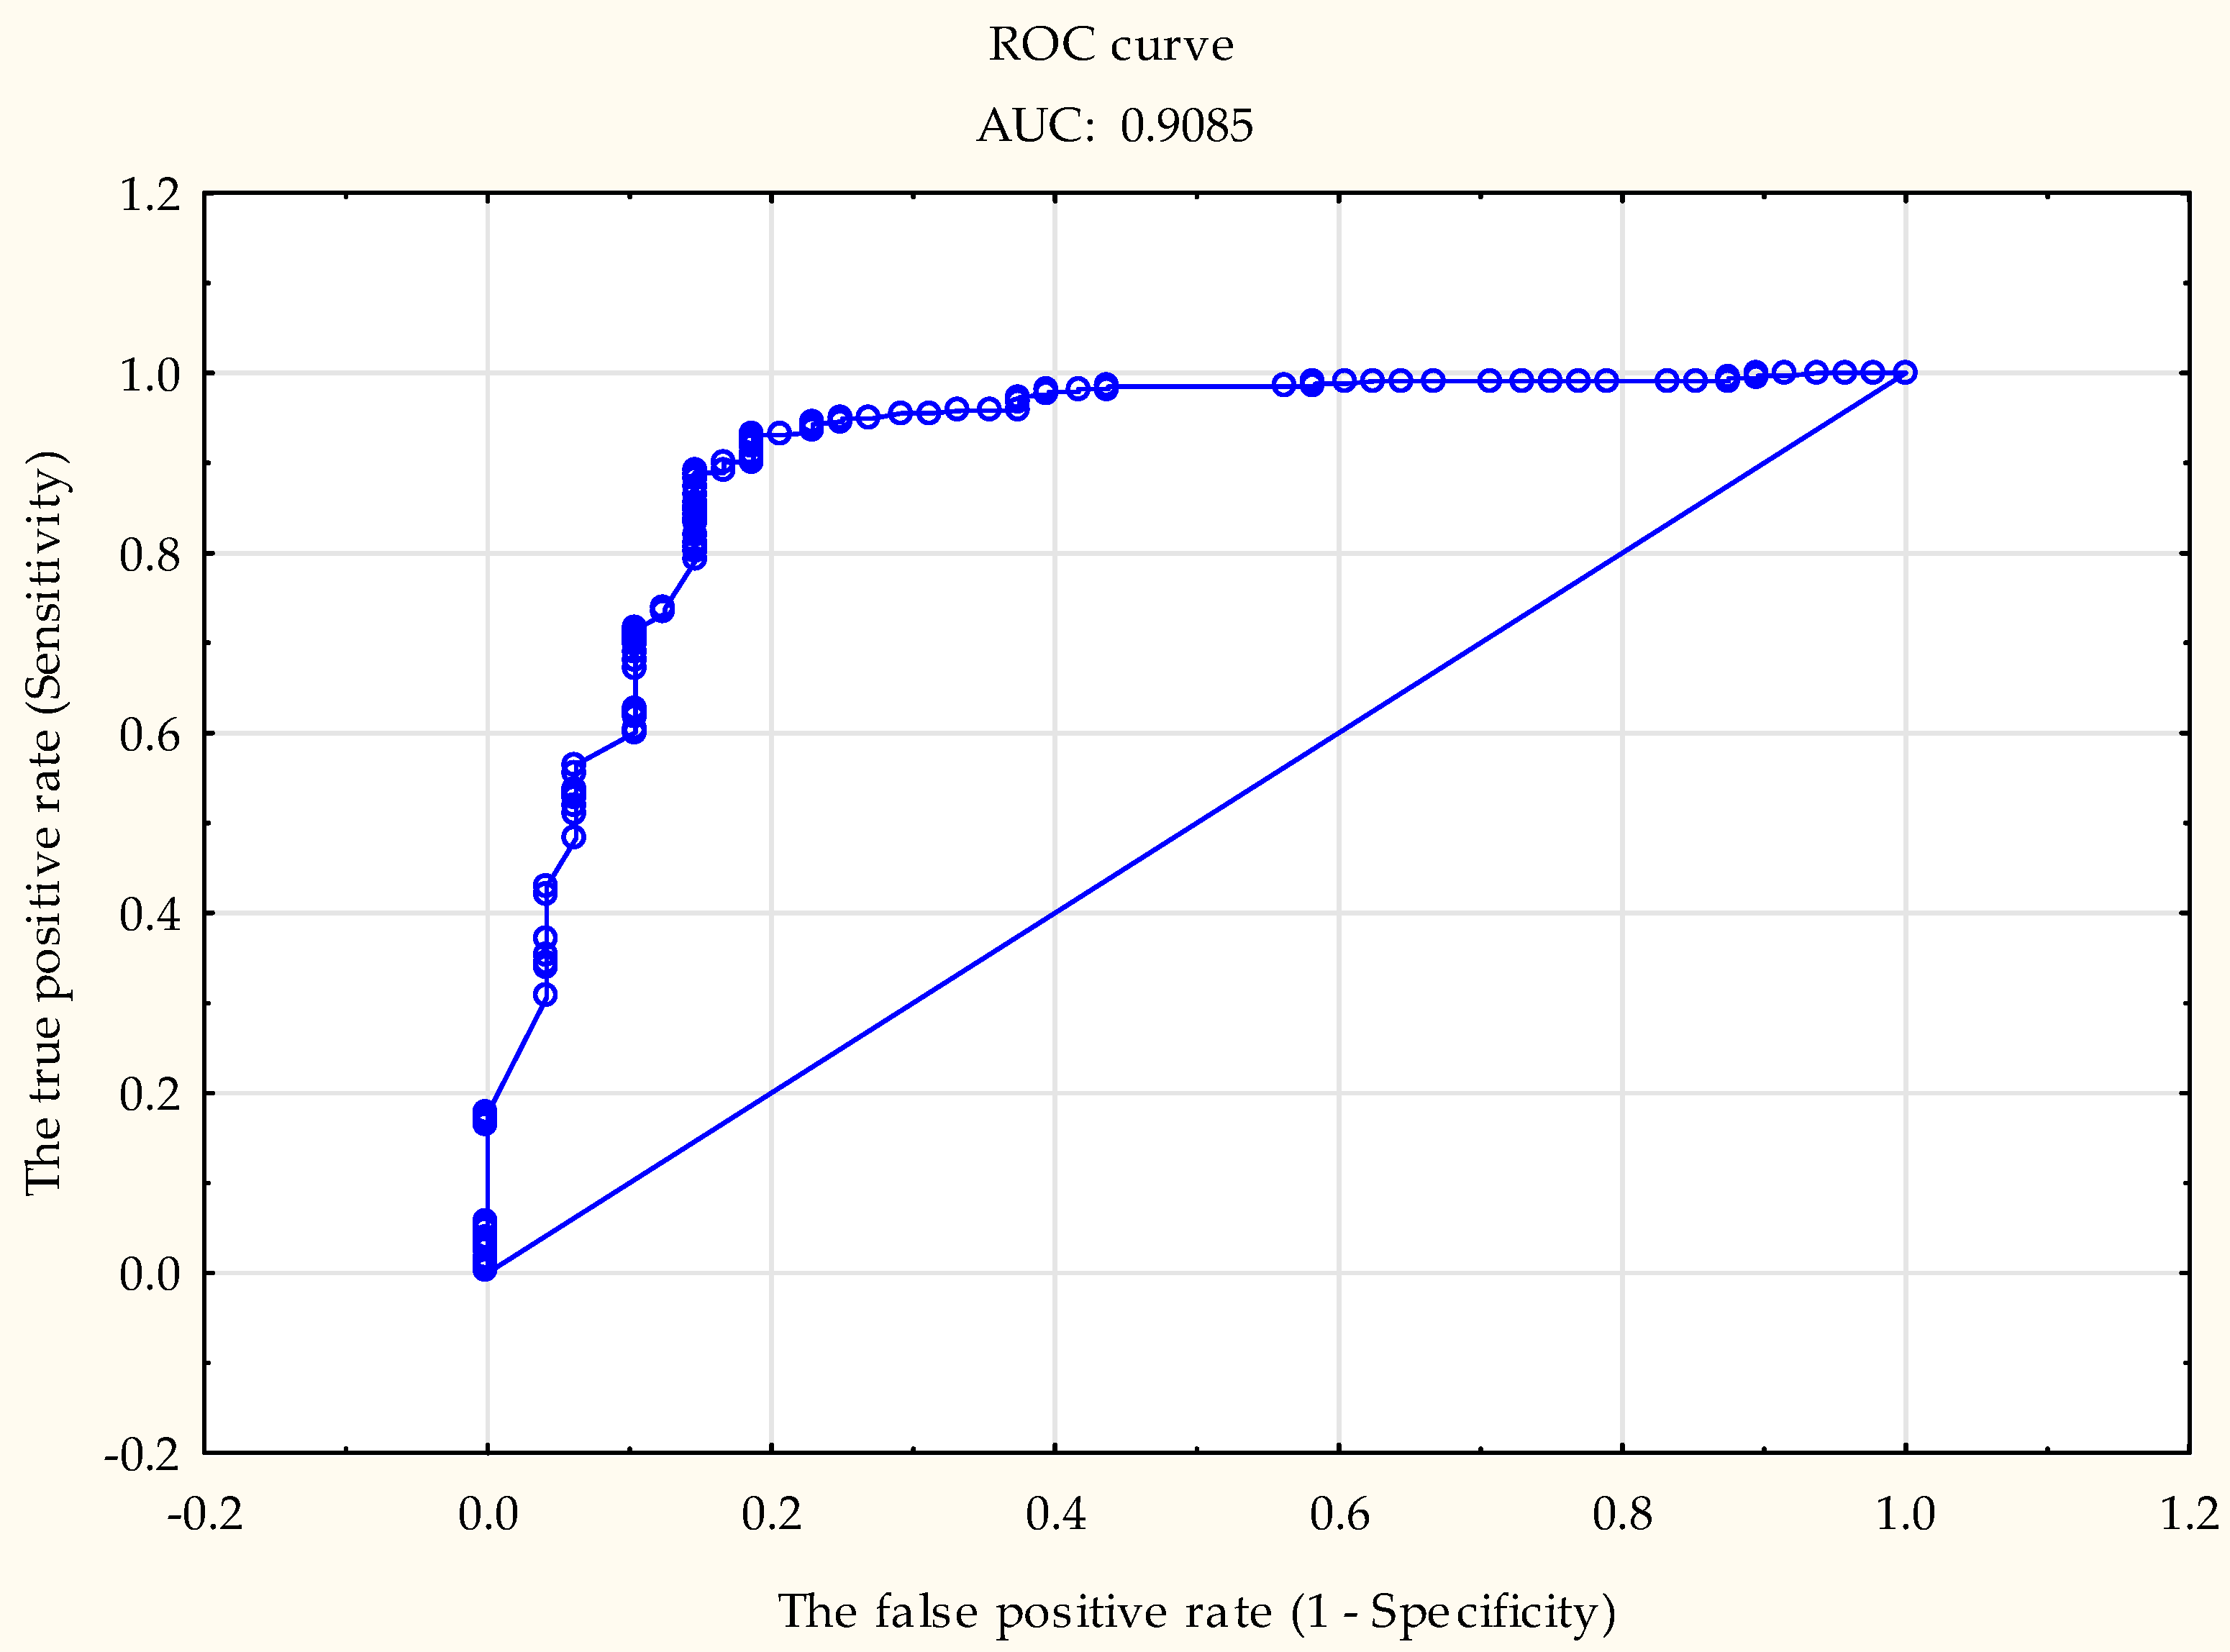
| AUC | 0.91 |
| p-value | 0.00 |
| Hosmer–Lemeshow test | |
| chi-square | 9.93 |
| p-value | 0.19 |
Publisher’s Note: MDPI stays neutral with regard to jurisdictional claims in published maps and institutional affiliations. |
© 2022 by the authors. Licensee MDPI, Basel, Switzerland. This article is an open access article distributed under the terms and conditions of the Creative Commons Attribution (CC BY) license (https://creativecommons.org/licenses/by/4.0/).
Share and Cite
Świadek, A.; Gorączkowska, J.; Godzisz, K. Conditions Driving Eco-Innovation in a Catching-Up Country—ICT vs. Industry in Poland. Energies 2022, 15, 5318. https://doi.org/10.3390/en15155318
Świadek A, Gorączkowska J, Godzisz K. Conditions Driving Eco-Innovation in a Catching-Up Country—ICT vs. Industry in Poland. Energies. 2022; 15(15):5318. https://doi.org/10.3390/en15155318
Chicago/Turabian StyleŚwiadek, Arkadiusz, Jadwiga Gorączkowska, and Karolina Godzisz. 2022. "Conditions Driving Eco-Innovation in a Catching-Up Country—ICT vs. Industry in Poland" Energies 15, no. 15: 5318. https://doi.org/10.3390/en15155318
APA StyleŚwiadek, A., Gorączkowska, J., & Godzisz, K. (2022). Conditions Driving Eco-Innovation in a Catching-Up Country—ICT vs. Industry in Poland. Energies, 15(15), 5318. https://doi.org/10.3390/en15155318