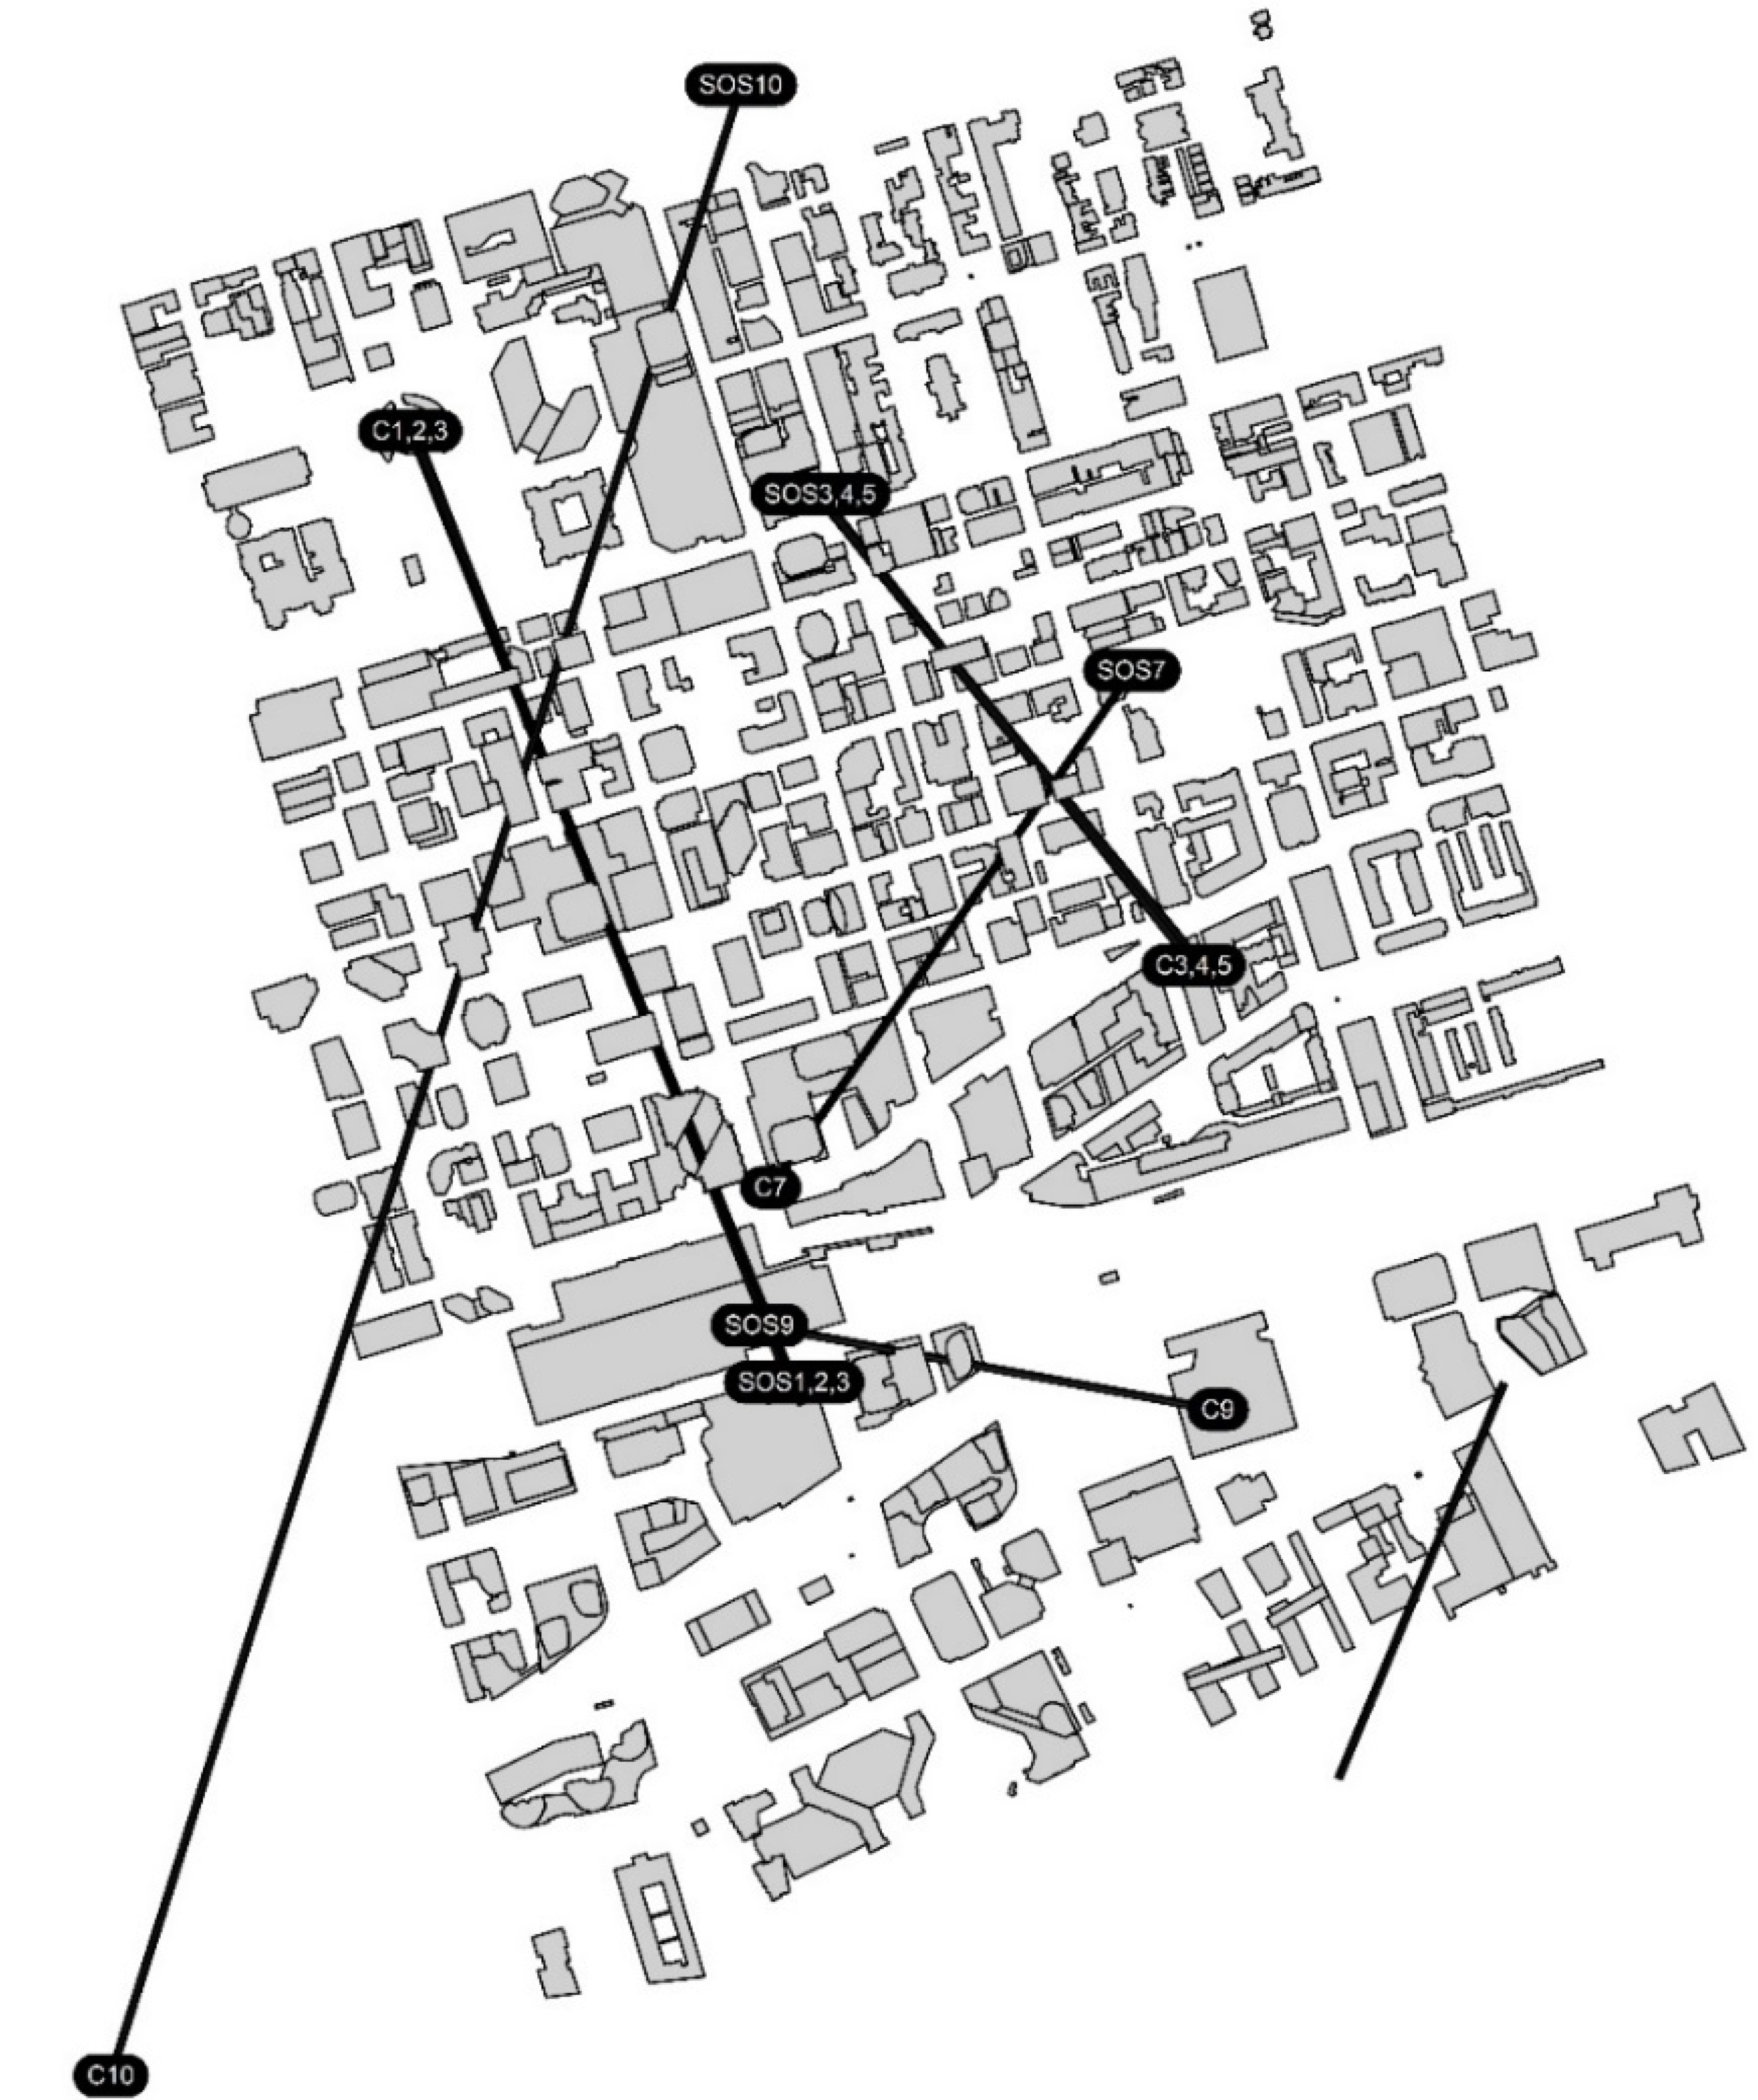
Abstract
Promising massive emissions reduction and energy savings, the utilization of autonomous unmanned aerial vehicles (UAVs) in last-mile parcel delivery is continuously expanding. However, the limited UAV range deters their widescale adoption to replace ground modes of transportation. Moreover, real-world data on the impact of different parameters on the operation, emissions, and energy consumption is scarce. This study aims to assess the impact of airspace planning and discretization on the energy consumption of autonomous UAVs. We utilize a novel open-source comprehensive UAV autonomous programming framework and a digital-twin model to simulate real-world three-dimensional operation. The framework integrates airspace policies, UAV kinematics, and autonomy to accurately estimate the operational energy consumption via an experimentally verified energy model. In the simulated case study, airspace is discretized by both a traditional Cartesian method and a novel dynamic 4D discretization (Skyroutes) method. This allows for the comparison of different routing and trajectory planning algorithms for ten missions. The results show a variation in the energy consumption by up to 50%, which demonstrates the criticality of airspace discretization and planning on UAV charging infrastructure design, greenhouse gas emissions reduction, and airspace management.
1. Introduction and Background
Autonomous aerial electric mobility solutions promise a significant reduction in operation costs and response time compared to a delivery truck while eliminating greenhouse gases (GHGs) emissions [1]. Aside from entertainment, photogrammetry, remote sensing, and movie making, autonomous unmanned aerial vehicles (UAVs) are being utilized in a variety of civil and military tasks. These include exploration, surveillance, land mapping, patrolling, and most recently, transportation and emergency management [2,3,4].
The UAV energy requirements determine the key performance metrics of range, cost, and emissions [5]. That said, UAVs’ relatively small size limits their payload capacity, sacrificing the size of the onboard batteries, which in turn decreases their range [6]. These limitations necessitate the establishment of extra launching locations, depots, and charging stations, thereby increasing the delivery time dramatically, rendering UAVs impractical for full replacement of ground transport. Additionally, environmental performance is negatively impacted by the increase in operational GHG emissions [7,8]. Significant advancements in UAV technologies are not expected soon [9]. Hence, obtaining the most energy-efficient UAV trajectory while avoiding obstacles and maintaining payload integrity has been highlighted by the literature as the biggest challenge to adopting a fully autonomous UAV system [5,10].
Collectively, the current literature mainly offers two types of estimations as recently reviewed [11]. First, several optimization models that propose UAV or truck-UAV delivery systems incorporate the energy consumption only indirectly as a fixed limitation on UAV coverage (range limit) [12,13,14]. Second, incorporating energy consumption models based on the UAV kinematics [1,6,7,15,16,17,18].
With the variation in the parameters considered in these UAV energy consumption models, the results obtained are widely divergent for identical delivery operations, leading to significant uncertainty in the estimated UAV ranges and emissions [19]. An accurate estimation of UAV energy consumption based on all parameters ensures feasible, as well as efficient, operating decisions for full UAV adoption. To focus on these different parameters, Figure 1 summarizes the different correlations between all parameters.
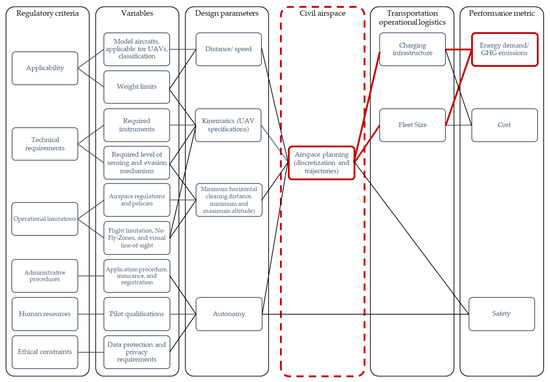
Figure 1.
Regulatory criteria correlation to performance metrics.
To create the most efficient possible plan, it is necessary to consider all of the design parameters. First, the speed of UAV travel. The optimal energy consumption would allow the UAV to consume the least amount of energy while travelling the maximum distance possible [6]. This relies solely on the geometrical configuration of the trajectory. A stable straight-line trajectory allows a higher speed, while changes in the roll and/or pitch angles require extra thrust and lower speeds, thereby consuming more energy. Second, the UAV kinematics refers to the UAV hardware or specifications ‘architecture’ that allows the UAV to carry the required payload and safely traverse the assigned trajectory. Third, the limitations implied by the applicable UAV regulations. The current UAV regulations globally include a minimum clearing distance around public and private property (e.g., people, buildings, and structures), as well as a minimum and maximum flight altitude limitation [20]. These limitations determine the allowable airspace volume for operation, thereby impacting the geometrical configuration of the trajectory. Fourth, the autonomous operation which dictates accounting for externalities such as weather conditions, no-fly zones (NFZs), and safety requirements.
On the other end, the accurate estimation of the UAV operations’ energy consumption and GHG emissions relies on the operational logistics, namely, the fleet size and the number of infrastructure charging stations needed to achieve full coverage. Both logistical estimates rely on the UAV trajectory simulations integrating all design parameters.
2. Literature Review
Significant research has been conducted combining some of the UAV variables and design parameters to achieve energy-efficient trajectories. For instance, trajectory planning algorithms and optimization heuristics, as well as advancements in older solving techniques such as graph traversal/search methods and routing algorithms [21]. Trajectory planning itself can be defined as finding a kinematically viable solution to the problem of UAV routing. In this case, the solution domain is a discretized airspace that takes into consideration all the different design parameters.
Most trajectory planning, routing algorithms, and heuristics rely on graph-solving methods. Hence, the traditional Cartesian method in airspace discretization has been widely adopted [22,23]. After the airspace volume is transformed into a Cartesian point cloud, geofencing is applied. A geofence is a virtual static or dynamic (changing) perimeter applied to any given airspace either in positive (keep-in) or negative (keep-out). The keep-in geofence is the allowable airspace volume for trajectories. While the keep-out is a volumetric restriction to certain extents where UAVs are not allowed to fly.
Each discretization method produces a different type of solving domain, hence, limiting the applicability of a trajectory solver. This interdependency between discretization and solving techniques to simulate the 3D trajectories of autonomous UAVs in a replica of a real-life operational environment while integrating all design parameters relies on the existence of an adequate computational tool [24]. This tool must enable highly detailed airspace 3D model discretization integrating all design parameters.
A few studies aimed at establishing a multi-objective autonomous UAV simulation platform are highlighted in Table 1. Since all platforms capable of comparing different discretization and trajectory planning permutations are proprietary; all studies presented in the literature depended on an assumed/generalized flight pattern, averaged speed profile, and Euclidean distance rather than applying the energy model in real-life contexts. Therefore, it can be confidently argued that the wide variation of energy consumption estimates in the autonomous UAV literature is a result of integrating certain variables and UAV design parameters in each of the proposed models, different UAV types being modeled, and a variety of assumed operations [11,14,19,25]. Thus, current research has not reached a consensus on a unified standard for UAV energy consumption, and therefore existing models fall short of providing realistic energy assessment frameworks.

Table 1.
UAV integrated simulation platforms available in the literature.
Unlike 2D path planning, trajectory planning in 3D environments utilized in these simulation platforms has great potential to yield better UAV energy consumption. However, the computation complexity increases exponentially with dynamic and kinematic constraint integration. Over the past decade several proposed algorithms were implemented in 3D environments including Visibility Graph [33]; randomly sampling search algorithms such as rapidly exploring random tree (RRT) [34] and Probabilistic Roadmap [35]; optimal search algorithms like the Dijsktra’s algorithm [36], Astar [37], and Dstar [37]; and bio-inspired planning algorithms. Many comparisons on the energy efficiency indices of trajectories converged by different algorithms can be found in the literature, such as in [38].
However, as it relates to airspace discretization, which precedes and determines the applicable algorithms, the worldwide literature can be classified into government-led and industry-led airspace discretization initiatives [39]. In general, the concepts proposed can be further grouped into two main directions. The first direction does not structurally separate the airspace and depends solely on the detect-and-avoid mechanisms without further details on discretizing the airspace. Examples of this direction are NASA, FAA, DLR U-Space, and SESAR U-Space [40,41,42,43]. The second direction proposes a separated structured airspace where UAVs are allocated an operational airspace volume. For instance, UTFC, MITRE, METROPOLIS, ONERA, and Singapore UTM [44,45,46,47,48]. Published details on the discretization schemes vary from high-level to more descriptive. The literature is focused mainly on airspace capacity estimations and safety rather than the other design variables mentioned in Figure 1 in a multivariant optimization [39]. While a few studies attempted to study this notion on a smaller scale in a two-dimensional plane [49]; in all cases, there is an evident gap in the literature on the operational differences between their respective discretization methodologies from an energy consumption standpoint on a realistic 3D scale, calling for essential further investigation.
To that end, this study is the first to consider the impact of airspace discretization on UAV energy consumption.
The key contributions of this paper are to:
- Propose a flexible energy consumption model based on the work in [1,6]. First, analytically simplified expressions for quadcopter kinematics and dynamics are deduced, and Newton-Euler equations are used to derive differential equations for stabilization and control. The energy modelling accuracy is experimentally verified by real-life flight data.
- Illustrate an open-source framework for autonomous UAV simulations. The framework utilizes a real-time 3D geospatial mining framework for LiDAR data to create a dynamically updated digital-twin model. This model enables the identification of viable airspace volumes in densely populated 3D environments based on the airspace policy/regulations. It also accounts for externalities (e.g., NFZs and weather updates).
- Assess the impact of two types of air-space discretization and their respective trajectory planning methods on the overall energy consumption of ten UAV missions. First, a traditional Cartesian discretization method with geofencing paired with the Dijkstra and Astar modified RRT algorithms. The classic and deterministic Dijkstra is utilized as the most widely accepted benchmarking algorithm for comparison [50], while the Astar modified RRT algorithm overcomes the computational complexity of both pure RRT and Astar algorithms representing one of the best energy optimal trajectory-finding methods [51]. Second, a novel dynamic 4D discretization ‘Skyroutes’ method proposed by the authors, Skyroutes is a combined discretization and trajectory planning algorithm based on disturbed fluid paths networks.
Combined, the overarching aim is to highlight the significant impact of airspace planning (discretization and trajectories) on the energy demand of UAVs.
3. Materials and Study Area
3.1. Study Area
Toronto City is one of the biggest urban centers in Canada, with a population density of 4334.4 P/km2 [52]. The city has an annual average of 40.9 days of snow with an accumulation of 122 cm snow blanket. During those severe weather periods, several roads are inaccessible, making it challenging to deliver via ground transport. Specifically, the old city of Toronto has been selected as the case study area since it is one of the most challenging areas due to the dense high-rise buildings and airfields (Figure 2a). Toronto provides an ideal testbed for comparing several potential UAV traffic network and infrastructure design methodologies. The most obstacle-rich section within Toronto is selected for this study, covered in clusters 50 and 51, East York patch, with an approximate area of 3.16 km2, presented in Figure 2b.
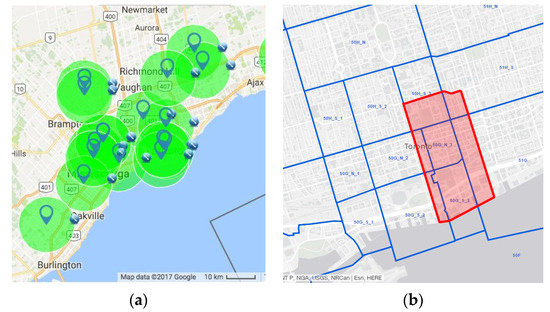
Figure 2.
The study area (a)—(left) Macroscale Toronto city map showing all airfields.; (b)—(right) Study area in old Toronto [53,54].
3.2. Materials
In this study, the city is divided into clusters or volumetric patches according to several parameters, including urban density and maximum land area. A central supply depot holding sufficient delivery UAVs is allocated at the core of each assigned coverage zone ‘city patch’.
We utilize open-source map platforms, namely OpenStreetMap (OSM), which includes most 2D data layers for the study area [55]. The OSM is integrated with a 3D GIS model and LiDAR data collected by the municipal division of the city of Toronto [56]. The resultant model is utilized in the simulations. as shown in Figure 3.

Figure 3.
3D digital-twin showing a zoom in on the Toronto city hall.
UAV flight stability relies considerably on the core weather conditions, namely, ambient air temperature, wind speed, counter-flight wind gusts, rainfall, and snowfall. The climate data provided by the government of Canada are utilized in the simulations. As presented in Figure 4, the city of Toronto’s air temperature is always below 35 degrees Celsius, which is a favorable flight temperature for most UAV types. On the other hand, wind speeds may exceed the recommended safe limit of 34 km/h, however, the simulation framework is designed to suspend operations at this limit. In addition, flights during extreme rain and snow (over 30 mm precipitation) are also suspended. Figure 5 shows days where precipitation is recorded; this is updated hourly online via meteorological data.
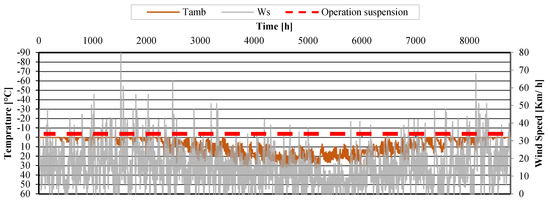
Figure 4.
Outdoor ambient air temperature and wind speed condition.
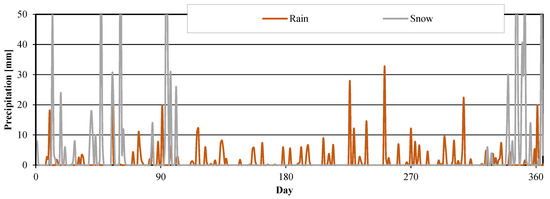
Figure 5.
Total rainfall and snowfall in Toronto city.
For task assignment (TA), a digital-twin mining framework similar to neural networks is proposed and illustrated in Figure 6, after the data source is given, the autonomous UAV mission allocation loop within the framework is provided with two coordinate points (latitude, longitude, and altitude), the demand destination (DEM), and the nearest available UAV’s depot location, respectively, for each mission.
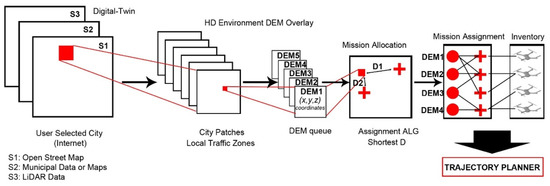
Figure 6.
Proposed digital-twin mining framework.
4. Methods
The operational framework consists of four sequential processes as shown in Figure 7. In the first process, the system obtains two streams of input for a set of variables through an online connection. The first stream of input relates to mission planning and TA that includes the coordinates for both the UAVs’ initial takeoff and destination for each mission solved by the TA algorithm. Subsequently, these locations are transformed from the latitude, longitude, and altitude format to a Cartesian (x, y, and z) relative coordinates system within the digital-twin model.
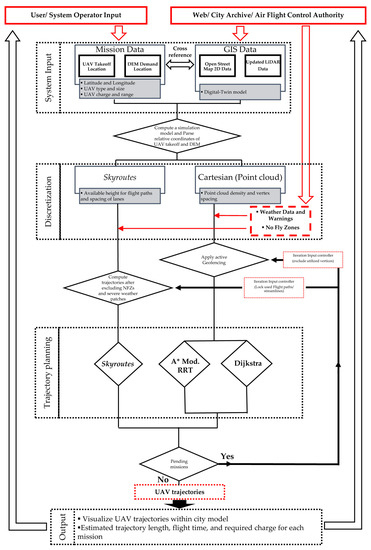
Figure 7.
Autonomous UAV simulation framework illustration.
The second stream of input relates to the digital-twin model loading. Subsequently, it is interpreted into physical obstacles and available airspace volume as a part of the computational memory optimization procedure. The digital-twin model is regularly updated to account for any real-time change, such as demolition, building construction equipment like cranes, and NFZs. The second process starts by computing two airspace discretization methods for the airspace volume in the digital-twin model. First, the Cartesian point cloud method, and second, the Skyroutes segmental domain.
The third process is mission trajectory planning. The process starts when the system has acquired all needed input and the airspace within the digital-twin model is discretized. Depending on the selected algorithm/heuristic, the framework loads the matching discretization that would provide the appropriate solution domain, whether for the Cartesian graph or the segmental domain. The routing starts from the initial UAV location through the most energy-efficient possible trajectory towards the destination within the given constraints. The procedure loops back after each iteration of solutions to the first input process for queued missions, this ensures that each UAV is assigned its own flight trajectory without interference.
The fourth process is the final system output at the end of the procedure; the framework visualizes the missions’ trajectories and outputs the sequential waypoints’ coordinates.
Coding Platform: to allow additions and modifications to the framework, the open-source XML code is free and open to public use. We utilize Python and C# languages coupled with Rhinoceros [57], which is a capable visualization platform. Python allows automated processing of several data sets including digital-twin city model data, UAV kinematic model, and weather data with practical robust performance.
Airspace Discretization: In a dense urban context, spacing between tall buildings can be less than three meters wide. Applying a tight point cloud (waypoint vertices) leads to a computationally challenging graph-solving problem due to the significantly large size of the solving domain. On the other hand, a wider point cloud results in less available solutions and more unutilized tight airspace volumes. To solve this challenge, we adopt a dynamic discretization technique, which is similar in concept to computational fluid dynamics (CFD) meshing in building simulations [58]. The dynamic mesh accommodates and changes according to the model space, in narrow spaces or around obstacles, the mesh gets tighter (i.e., the spacing between graph vertices gets smaller) and vice versa, in wider or obstacle-free areas, the mesh spacing gets wider as illustrated in Figure 8b.
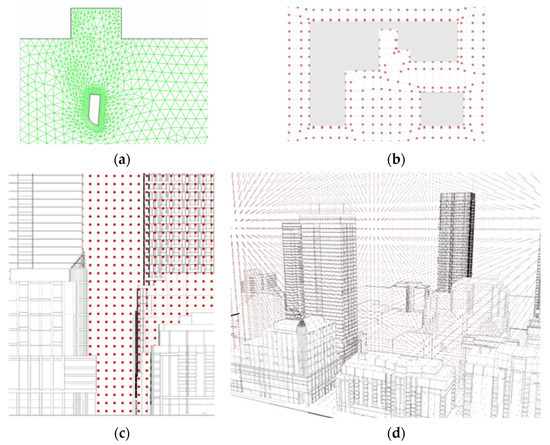
Figure 8.
Cartesian discretization deployed in the study area. (a) CFD meshing; (b) Dynamic discretization; (c) Cross Sectional View; (d) 3D View.
UAV Kinematics: Before proceeding with UAV motion simulations, we illustrate the coding of governing quadrotor physics. Mainly, the method of calculating the power required by each rotor to propel the UAV. Thereafter, the UAV energy consumption is calculated by accounting for different forces, torque, and thrust. Here, we assume that all electric brushless UAV rotors are identical. The time derivative () for the body-frame yaw, pitch, and roll angles is (φ, θ, Ψ) T. The rotational axial vector, also known as the angular velocity or ‘rotational speed (RPM)’ is (v), while the matrix of rotation for inertial and body UAV frames is (M) [59]. We deduct both by matrices as follows:
To calculate the torque τ (N.m) and the rotor voltage V (volts), respectively:
where the constants of torque and proportionality back electromotive force are Cτ and Cp, respectively. The electric current I is the operational rotor input (in ampere) in motion state and Iidle in idle state. We also account for the coil resistance in R (ohm), and obtain the motor power P (in Watt) by:
Since the system is assumed in this study to operate only under steady wind conditions, we deduct the thrust T (in Newton) by:
where the loft velocity is when the UAV is at an idle air position. Since the rotors’ thrust and the square of angular velocity are proportional, we can deduct the overall constant C:
where ρair is the density of air and equals an assumed average of 1.225 kg/m3 in this case; the area of each rotor is a (in m2).
The combined model for rotational motion is coded in Python based on Euler’s equation:
where is the angular velocity vector and I is the inertia. From the rotor matric M that was given previously in Equation (2), the linear motion can be deducted:
where ẋi is the path of the UAV, g is the acceleration due to gravity and equals 9.81 (m/s2); m is the UAV mass; and Fd is the drag force. By assuming symmetry of the UAV, the inertial matrix is simplified from Equations (8) and (9) and formulated as:
by solving Equations (10) and (11), the final formula can be expressed as:
The energy consumption from the onboard batteries is cumulated with each time step depending on the velocity along the UAV mission trajectory as follows:
where is the battery-to-propeller (BTP) and motor power transfer efficiency; is the trajectory segment length. The total energy consumption by each UAV for the entire mission trajectory in kWh is calculated by:
where is a conversion factor from Joules to kWh (). The calculation model was experimentally verified against real-life UAV flights in [1].
Trajectory Planning: we utilize three trajectory planning algorithms. The first two, are both graph search algorithms, hence, the Cartesian discretization is utilized as the solving domain.
First, for the Dijkstra, the UAVs are assumed in an n-dimensional Euclidean space. The UAVs are restricted by global constraints; hence, it can be deducted by utilizing LaValle’s method:
where u is a control signal, u: [0, tf] → U, U ⊂ Sn, and x(t) ∈ qfree = Sn/qob, where qob is a set in the case study boundary of the selected patch; and qfree is the available free Cartesian points; the geometry sets (n − 1) represent the built environment obstacles. To find u that avoids obstacles and gives the shortest available route for the UAV from qint (UAV mission initiation location) to qdem (UAV destination):
where is a vector-valued function. By applying a cost function to satisfy the shortest distance objective according to Bellman’s equation, it can be deducted:
where S(β) is a sphere created at (0, 0) of radius β; point (0, 0) is assumed the origin point of the point cloud ‘mesh vertices’ with reference to actual coordinates qd = {xi ∈ qfree|1≤ i ≤ N}. By excluding all mesh vertices included within obstacle boundaries, qfree becomes the remnant mesh for solving. By applying a linear interpolation approximation to Equation (16):
where is an approximation at point qi, αi ≥ 0; this can be put in a final formula:
Second, whereas in a typical RRT, the whole model space is populated with a point cloud and is considered for the solution, the Astar transforms the search into a function of the range of vertices confined along the direct path between qint and qdem. This becomes the point-populated domain and the function is formulated as follows:
where ∈ Q is the initiation point vector; ∈ U is the destination vector; vt is a random process disturbance appropriately determined; Dt is the measurement vector, and qi is a random component of the qt tree.
Similar to the Dijkstra algorithm, the Astar algorithm contains an open list of the potential waypoints qfree vertices, in addition to a closed list of all the visited vertices, and a simple cost equation for solving as follows:
where the subscript i stands for the vertex call number in the RRT; Ti is the total cost (path length to minimize from qint to qdem) similar to Equation (16); Ci is the current ith cost from qint to current vertex; Ei is the estimated cost of ith vertex from the current vertex to the qdem destination vertex.
Third, unlike the Dijkstra and the Astar modified RRT algorithms, the novel Skyroutes algorithm depends on a segmental discretization. The UAV flight trajectories are considered as lanes parallel to and above the existing street network based on fluid computation. To model the built environment obstacles of the case study within the numerical derivation, a unified simple formula is utilized to model all obstacles in the digital twin:
where q = (x, y, z) is defined as the UAV inertial frame location coordinates within the Cartesian referencing system; the six parameters (a, b, c, d, e, and f) describe the simplified geometrical volume of obstacles. The orthogonal grid of UAV lanes is modeled by:
where d(q) is the distance between qint the UAV initial takeoff location and qsos the destination.
Depending on the elevation (z component) of UAV flight lanes and the number of obstacles (Bobs) breaching this height plane in the study area, the streamlined grid of UAV lanes is modified to avoid the obstacles through the matrix M (q):
where n (q) is the normal vector to the UAV trajectory; t(q) is the tangential vector to the UAV trajectory; ρq and σq are the orientation of tangential velocity functions. The finalized UAV trajectory waypoints are obtained by the recursive integration in the following formula:
where (qt) is the UAV location (xt, yt, zt) at time t. The algorithm in pseudocode is as follows (Algorithm 1):
| Algorithm 1: Pseudocode for the Skyroutes Algorithm | |
| 1: | Initialize: function Disturbed Fluid (Grid, source): |
| 2: | Initialization input//assigned UAV location as initial vertex, input qint vertex in the point cloud. |
| 3: | Initialization input//demand location as destination vertex, input qdem vertex in the point cloud. |
| 4: | plane [Q]: = (clone origin plane x, y, new elevation Z)//Construct plane on elevation Z. |
| 5: | Create Grid [G1]:= true; for {var x = 0; x < grid size x}; {var y = 0; y < grid size y}//Assign a streamline grid of polylines in both x and y directions of plane Q with equal spacing. For all geometry in model space compute Bounding Box; Boolean, True if the geometry collides//Test all model geometry for collision with the plane Q. |
| 6: | Previous vertex in optimal path from source//previous[v]: = undefined. |
| 7: | Get Tangents (T1, T2, Tx)//Interpolate tangent Points. |
| 8: | Point new T1 = T1 + vPerp * offset distance; Point new Tx = Tx + vPerp * offset distance; Interpolate curve (new T1, new Tx)//Offset set lines S to number of x, y lines in Grid [G1]. |
| 9: | Break existing Grid [G1] and weld new interpolated curves, then new deformed grid [G2]. |
| 10: | End for. |
| 11: | Set grid paths [G2] as path search list and each path as (P1, P2, Px). |
| 12: | For all qint, qdem assign path u//Assign the shortest set of paths as route [u] for each mission from qint to qdem. |
| 13: | Remove u from G2//When a path is assigned to a UAV mission trajectory, remove it from the search list [G2]. |
| 14: | End for |
| 15: | Output visualizes trajectories. |
| 16: | End Function. |
5. Results
For the assessment simulation missions, the missions’ locations, assumptions for external conditions, UAV specs, and other computational parameters are outlined in Table 2. The ten missions illustrated are designed to assess the impact of different discretization methods. In addition, two sub-objectives are tested through the ten missions.

Table 2.
Main parameters for simulation missions.
- Scenario 1—The first two sets of missions 1 and 2; and 3, 4, 5, and 6 share almost identical take-off and demand destinations, these missions are assigned to compare the resultant trajectory and energy consumption of UAVs performing simultaneous missions on the same path while maintaining a collision-free trajectory.
- Scenario 2—Missions 7, 9, and 10 are assigned to test complex urban obstacle avoidance with a variation in urban blocks, building envelope complexity, geometric shapes, and sizes.
It should be noted that several parameters are held consistent across all scenarios to facilitate an adequate comparison between the discretization methods and the associated trajectory planning.
The results for the compared trajectory planning simulations for the ten missions are presented in Figure 9. All three algorithms have successfully converged into full trajectories (in red) while avoiding obstacles and reaching the demand destinations. The results illustrate significant geometrical variations in the generated trajectories between Cartesian-based solutions in A (Dijkstra) and B (Astar Modified RRT) compared to the Skyroutes in C.
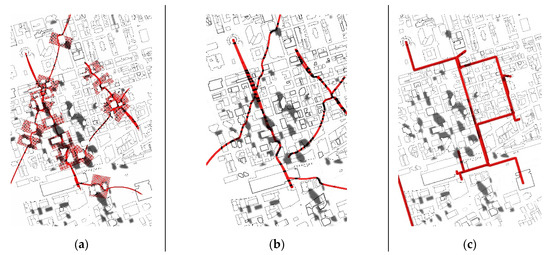
Figure 9.
Results for assigned missions’ trajectory planning in the study area layout, scale 1:4000. (a) Dijkstra Algorithm; (b) A* Mod RRT Algorithm; (c) Skyroutes.
Figure 10 and Figure 11 highlight that the UAV maneuvers requiring changes in horizontal angle (pitch and roll) along the converged trajectories are significantly less for the Skyroutes algorithm. As for the vertical angle change, the Dijkstra solutions illustrate minimized change in the UAV pitch angles along the trajectory compared to the Astar modified RRT. However, the Skyroutes trajectories eliminate the pitch change along the trajectory except for initial ascend and end descend. This occurs as the take-off and landing are above or below the regulatory minimum flight altitude of 30 m.
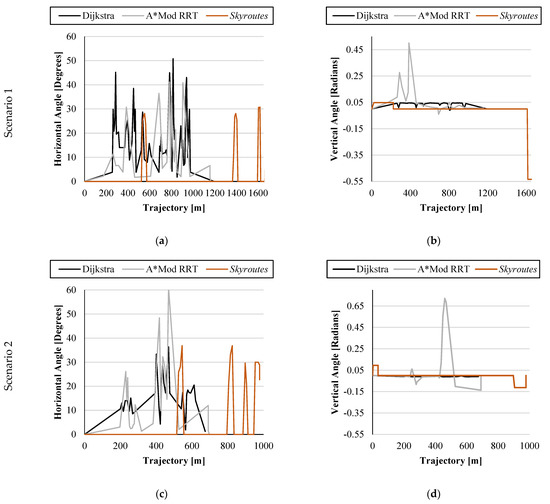
Figure 10.
Resolved UAV trajectory variables for scenarios 1 and 2. (a) Mission 1 trajectory horizontal angle profile; (b) Mission 1 trajectory vertical angle profile; (c) Mission 4 trajectory horizontal angle profile; (d) Mission 4 trajectory vertical angle profile.
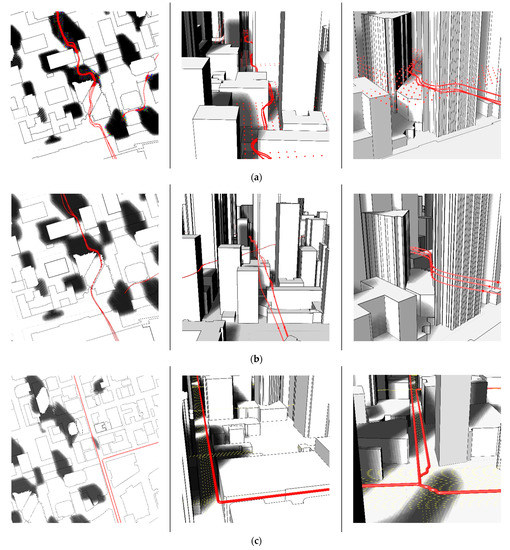
Figure 11.
Zoomed in trajectory solutions visualizations comparison. (a) Dijkstra Algorithm; (b) A*Modified RRT Algorithm; (c) Skyroutes.
Regarding the compared airspace discretization methods, on one hand, the Cartesian-based solutions utilize the entire free air space volume as the allowed flight zone. However, this method populates airspace pockets in tight urban canyons with vertices that form isolated patches that can’t be connected to form feasible trajectories, hence, consuming extra computational memory.
On the other hand, the segmental discretization omits this redundancy by only discretizing connected airspace, which would yield a feasible solution while saving computational time and memory. Furthermore, for Cartesian-based solutions A (Dijkstra) and B (Astar Modified RRT), the results show that a denser solving domain (i.e., more dense discretization) resulted in a smoother flight trajectory, however, significantly increased the solution time, and required more computing memory. This is not the case for the Skyroutes method, where the trajectory tends to be a straight line for most parts of the missions, hence, the waypoint density can be increased to one-meter intervals with no significant computational power required.
The resulting geometrical variation of the trajectories holds the key to answering this energy consumption research query. The utilized airspace discretization determines the solving method/algorithm/heuristic, which in turn leads to significant variation in the UAV trajectory characteristics.
First, is the variation in trajectory length; for Cartesian-based algorithms A and B, the converged trajectories are up to 10% lengthier compared to 2D Euclidean shortest path ESP (Figure 12). The Dijkstra algorithm produces slightly shorter trajectories relative to the Astar modified RRT algorithm due to the nature of non-deterministic solutions in RRTs. The converged trajectories by algorithm C (Skyroutes) are lengthier by up to 52%.
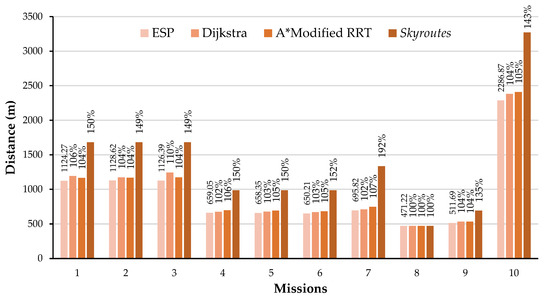
Figure 12.
Generated trajectory length compared to ESP for all missions.
Second, the differences in trajectory geometry noted in the results leading to additional UAV maneuvers reflect on the kinematics of the UAVs. Since specific thrust only depends on the velocity change across the trajectory. The UAV rotors allow the execution of these mid-air maneuvers by changing the thrust to adjust bearing and velocity. Figure 13 illustrates the change in the UAV thrust for mission one across the three compared trajectory planning solutions. The trajectories converged by the Dijkstra and the modified Astar RRTs show continuous thrust fluctuations throughout the trajectory length, therefore consuming more power from the onboard batteries. However, the Skyroutes trajectories show a change in thrust only at the angled corners along the trajectory, and a constant thrust along the smooth segments of the generated trajectory. Although the trajectories converged by Skyroutes are lengthier, the more regular geometrical form allows for a higher constant UAV speed and less thrust demand, consequently, consuming up to 50% less energy compared to the Dijkstra and Astar modified RRT solutions (Figure 14).
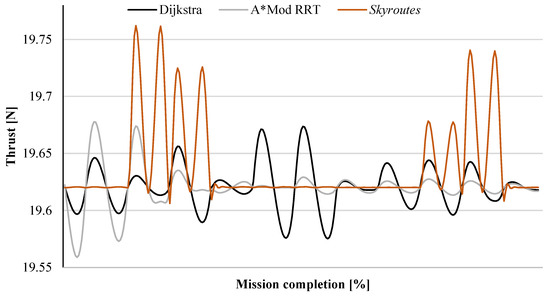
Figure 13.
UAV Thrust comparison for mission one.
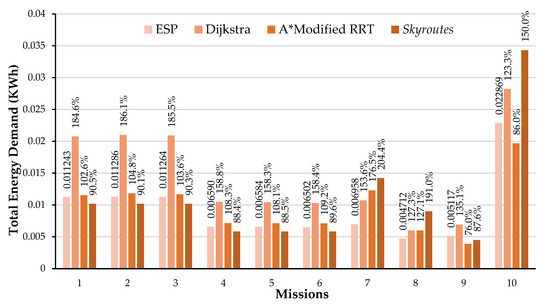
Figure 14.
Energy demand compared to ESP averaged estimates for all missions.
While the literature has capitalized solely on the length of the converged trajectory as the sole determinant of the UAV energy consumption, the results prove that this is misleading and significantly inaccurate.
Integrating the kinematic model into the framework allowed for a precise estimate of the energy consumption along the converged trajectories. The trajectory’s geometrical configuration that maximizes UAV velocity/speed can eventually overrule the impact of increased trajectory length, ultimately leading to lower overall energy consumption. The airspace discretization has a significant impact on the UAV energy consumption by broadly determining the characteristics of resultant trajectories.
6. Discussion and Conclusions
This study has presented a novel simulation-based framework to precisely assess the real-world impact of civil airspace discretization on the energy demand of UAVs in transportation operations in dense urban contexts. Furthermore, the study compared the characteristics of converged trajectories in correlation to the overall energy consumption and quality of the solution.
Unlike previous attempts in the literature, the proposed framework integrated all the four subdomains impacting the UAV design parameters in a single model. These include applicable airspace policies, kinematics, autonomy, and externalities. In general, the results and discussion support the hypothesis that realizing the energy efficiency benefits of a fully autonomous UAV operation is highly sensitive to airspace discretization. The proposed framework can be further developed to function as a planning tool that aids experts, air control planners, and legislators in designing a UAV system that will achieve the environmental benefits of GHG emissions reduction.
The digital-twin integration proved robustness for an accurate trajectory planning ability within the framework, specifically where tight urban situations required a highly detailed 3D model for the obstacles to navigate the missions safely while allowing comparing a variety of discretization and trajectory planning techniques while applying airspace regulations and externalities.
For dense urban contexts, airspace discretization impacted the converged UAV trajectories significantly. As it relates to the trajectory length, first, traditional Cartesian discretization allowed the utilization of efficient solving algorithms like the Dijkstra and the Astar modified RRTs in the digital-twin 3D environment. The converged trajectories illustrated a slight variation from the ESP estimates. Second, the proposed Skyroutes discretization converged trajectories illustrated a wider variation compared to ESP. All results show that ESP estimations in the literature would yield inaccurate and unrealistic estimates of energy consumption, and hence, utilization range.
That said, the trajectory length variance failed to give precise predictions for the overall UAV energy demand as the flight trajectory geometry determines the active navigational velocity, in turn, dictating a change in thrust. In general, the Skyroutes solutions show significantly better results compared to the Cartesian-based solutions (Dijkstra and Astar modified RRTs). The simple geometrical configuration of the Skyroutes trajectories gives a uniform solution of straight lines which translates into a uniform thrust without the need for excessive maneuvers. Although the converged Skyroutes trajectories are on average 25% lengthier than the Dijkstra and Astar modified RRTs trajectories, the added length is compensated for with the minimized change in thrust yielding up to 50% less overall energy consumption. However, this variation does not apply to missions executed in less dense contexts of the study area, and indeed more simulation environments (e.g., varying degree of obstacle density) are required to generalize the results.
The results also show that the optimal airspace design parameters can only be tailored to each study area on a case-by-case basis. Due to the sensitivity of the energy performance to the city airspace characteristics, a permutation simulation analysis of varying design parameters is inevitable to reach the energy-optimal discretization. The proposed framework can successfully achieve this goal. Furthermore, serve in the charging infrastructure optimization goals. The reduced energy consumption and charging station network would yield a significantly extensive coverage and decrease GHG emissions.
More specifically, the results of this study also highlight a pathway for advancements in short-range and proximity-based UAV applications. For instance, site inspection and monitoring, retrofitting applications, cinematography, human-robot/interaction-based applications, surveillance, and monitoring [60,61,62,63]. UAVs facilitate inspection at a considerably closer range due to their small size, nimbleness, and capability of carrying LiDAR, Thermal, and high-definition cameras. However, these applications require operation in tight/dense urban situations where energy-optimal airspace discretization is key for a successful mission execution. The results of this study should be incorporated as a possible solution for specific cities for urban tasks or rural areas for mapping and agricultural applications [64,65] as part of a further integrated decision support system and policy evaluation.
Lastly, it should be noted that the range of UAVs was not considered in our study as a constraint in the proposed simulations and it was assumed that the flying range of UAVs is sufficient to perform all missions. Therefore, we recommend that future studies should adopt the framework to address the different limitations of UAV integration in sustainable smart cities.
Author Contributions
Conceptualization, M.E. and M.M.; methodology, M.E.; software, M.E.; validation, M.E.; formal analysis, M.E.; investigation, M.E.; resources, M.E.; data curation, M.E.; writing—original draft preparation, M.E.; writing—review and editing, M.M.; visualization, M.E.; supervision, M.M.; project administration, M.M.; funding acquisition, M.M. All authors have read and agreed to the published version of the manuscript.
Funding
This research was funded by the Natural Sciences and Engineering Research Council of Canada (NSERC) Grant No: RGPIN-2018-05994.
Institutional Review Board Statement
Not applicable.
Informed Consent Statement
Not applicable.
Data Availability Statement
The LiDAR and weather data are available at (https://mdl.library.utoronto.ca/collections/geospatial-data/toronto-lidar-2015) accessed on 1 March 2022 and (https://climate.weather.gc.ca/historical_data/search_historic_data_e.html) accessed on 1 March 2022.
Conflicts of Interest
The authors declare no conflict of interest and the funders had no role in the design of the study; in the collection, analyses, or interpretation of data; in the writing of the manuscript, or in the decision to publish the results.
Nomenclature
| V | Voltage (V) |
| P | Power consumption (W) |
| V | Angular velocity (RPM) |
| M | Matrix of rotation |
| FB | Body frame |
| FI | Inertial frame |
| I | Electric current (amp) |
| Cτ | Torque proportionality constant |
| CP | Back electromotive force constant |
| T | Thrust |
| VL | Loft air velocity (m/s) |
| A | area (m2) |
| F | Force (N) |
| M | Mass (kg) |
| I | Inertia (kg.m2) |
| Approximation value for point xi | |
| QINT | UAV initial takeoff location point |
| QDEM | Demand location point within referenced mesh |
| QFREE | Obstacle free point cloud vertices |
| QRAND | A random point cloud vertex |
| TI | Total cost function |
| CI | Current cost function |
| EI | Estimate cost function |
| DT | Measurement vector |
| TAMB | Outdoor ambient air temperature (°C) |
| WS | Average wind velocity (m/s) |
| Greek Letters | |
| ψ | Roll angle (degrees) |
| θ | Pitch angle (degrees) |
| φ | Yaw angle (degrees) |
| ρAIR | Air density (kg/m3) |
| β | Radius of virtual vertex sphere (m) |
References
- Elsayed, M.; Mohamed, M. The impact of airspace regulations on unmanned aerial vehicles in last-mile operation. Transp. Res. Part D Transp. Environ. 2020, 87, 102480. [Google Scholar] [CrossRef]
- Zheng, X.; Wang, F.; Li, Z. A multi-UAV cooperative route planning methodology for 3D fine-resolution building model reconstruction. ISPRS J. Photogramm. Remote Sens. 2018, 146, 483–494. [Google Scholar] [CrossRef]
- Colomina, I.; Molina, P. Unmanned aerial systems for photogrammetry and remote sensing: A review. ISPRS J. Photogramm. Remote Sens. 2014, 92, 79–97. [Google Scholar] [CrossRef] [Green Version]
- Mahony, R.; Kumar, V. Aerial Robotics and the Quadrotor. IEEE Robot. Autom. Mag. 2012, 19, 19. [Google Scholar] [CrossRef]
- Zhang, K.; Lu, L.; Lei, C.; Zhu, H.; Ouyang, Y. Dynamic operations and pricing of electric unmanned aerial vehicle systems and power networks. Transp. Res. Part C Emerg. Technol. 2018, 92, 472–485. [Google Scholar] [CrossRef]
- Stolaroff, J.K.; Samaras, C.; O’Neill, E.R.; Lubers, A.; Mitchell, A.S.; Ceperley, D. Energy use and life cycle greenhouse gas emissions of drones for commercial package delivery. Nat. Commun. 2018, 9, 1–3. [Google Scholar]
- Figliozzi, M.A. Lifecycle modeling and assessment of unmanned aerial vehicles (Drones) CO2e emissions. Transp. Res. Part D Transp. Environ. 2017, 57, 251–261. [Google Scholar] [CrossRef]
- Kuby, M.; Lim, S. The flow-refueling location problem for alternative-fuel vehicles. Soc.-Econ. Plan. Sci. 2005, 39, 125–145. [Google Scholar] [CrossRef]
- Morbidi, F.; Cano, R.; Lara, D. Minimum-energy path generation for a quadrotor UAV. In Proceedings of the 2016 IEEE International Conference on Robotics and Automation (ICRA), Stockholm, Sweden, 16–21 May 2016; pp. 1492–1498. [Google Scholar]
- Thibbotuwawa, A.; Nielsen, P.; Zbigniew, B.; Bocewicz, G. Energy consumption in unmanned aerial vehicles: A review of energy consumption models and their relation to the UAV routing. In Proceedings of the International Conference on Information Systems Architecture and Technology, Nysa, Poland, 16–18 September 2018; Springer: Cham, Switzerland, 2018; pp. 173–184. [Google Scholar]
- Zhang, J.; Campbell, J.F.; Sweeney, I.I.D.C.; Hupman, A.C. Energy consumption models for delivery drones: A comparison and assessment. Transp. Res. Part D Transp. Environ. 2021, 90, 102668. [Google Scholar] [CrossRef]
- Kitjacharoenchai, P.; Ventresca, M.; Moshref-Javadi, M.; Lee, S.; Tanchoco, J.M.; Brunese, P.A. Multiple traveling salesman problem with drones: Mathematical model and heuristic approach. Comput. Ind. Eng. 2019, 129, 14–30. [Google Scholar] [CrossRef]
- Chiang, W.-C.; Li, Y.; Shang, J.; Urban, T.L. Impact of drone delivery on sustainability and cost: Realizing the UAV potential through vehicle routing optimization. Appl. Energ. 2019, 242, 1164–1175. [Google Scholar] [CrossRef]
- Murray, C.C.; Chu, A.G. The flying sidekick traveling salesman problem: Optimization of drone-assisted parcel delivery. Transp. Res. Part C Emerg. Technol. 2015, 54, 86–109. [Google Scholar] [CrossRef]
- Kirschstein, T. Comparison of energy demands of drone-based and ground-based parcel delivery services. Transp. Res. Part D Transp. Environ. 2019, 78, 102209. [Google Scholar] [CrossRef]
- Murray, C.C.; Raj, R. The multiple flying sidekicks traveling salesman problem: Parcel delivery with multiple drones. Transp. Res. Part C Emerg. Technol. 2019, 110, 368–398. [Google Scholar] [CrossRef]
- Poikonen, S.; Golden, B. Multi-visit drone routing problem. Comput. Oper. Res. 2019, 113, 104802. [Google Scholar] [CrossRef]
- Dorling, K.; Heinrichs, J.; Messier, G.G.; Magierowski, S. Vehicle Routing Problems for Drone Delivery. IEEE Trans. Syst. Man. Cybern. Syst. 2016, 47, 70–85. [Google Scholar] [CrossRef] [Green Version]
- ElSayed, M.; Mohamed, M. The Uncertainty of Autonomous Unmanned Aerial Vehicles’ Energy consumption. In Proceedings of the 2020 IEEE Transportation Electrification Conference & Expo (ITEC), Chicago, IL, USA, 23–26 June 2020; pp. 8–13. [Google Scholar]
- Stöcker, C.; Bennett, R.; Nex, F.; Gerke, M.; Zevenbergen, J. Review of the Current State of UAV Regulations. Remote Sens. 2017, 9, 459. [Google Scholar] [CrossRef] [Green Version]
- Coutinho, W.P.; Battarra, M.; Fliege, J. The unmanned aerial vehicle routing and trajectory optimization problem, a taxonomic review. Comput. Ind. Eng. 2018, 120, 116–128. [Google Scholar] [CrossRef] [Green Version]
- Kopardekar, P.H. Unmanned Aerial Systems Traffic Management (UTM): Safely Enabling UAS Operations in Low-Altitude Airspace; UTM ASSURE Meeting 12 October 2016 No. ARC-E-DAA-TN36261; NASA: Washington, DC, USA, 2016. [Google Scholar]
- Dill, E.T.; de Haag, M.U. 3D multi-copter navigation and mapping using GPS, inertial, and LiDAR. NAVIGATION. J. Inst. Navig. 2016, 63, 205–220. [Google Scholar] [CrossRef]
- Yao, P.; Wang, H.; Su, Z. UAV feasible path planning based on disturbed fluid and trajectory propagation. Chin. J. Aeronaut. 2015, 28, 1163–1177. [Google Scholar] [CrossRef] [Green Version]
- Barmpounakis, E.N.; Vlahogianni, E.I.; Golias, J.C. Unmanned Aerial Aircraft Systems for transportation engineering: Current practice and future challenges. Int. J. Transp. Sci. Technol. 2016, 5, 111–122. [Google Scholar] [CrossRef]
- Wills, L.; Kannan, S.; Sander, S.; Guler, M.; Heck, B.; Prasad, J.; Schrage, D.; Vachtsevanos, G. An open platform for reconfigurable control. IEEE Control Syst. 2001, 21, 49–64. [Google Scholar] [CrossRef]
- Jager, R. Test and Evaluation of the Piccolo II Autopilot System on a One-Third Scale Yak-54. Ph.D. Thesis, University of Kansas, Lawrence, KS, USA, 2008. [Google Scholar]
- Tisdale, J.; Ryan, A.; Zennaro, M.; Xiao, X.; Caveney, D.; Rathinam, S.; Hedrick, J.K.; Sengupta, R. The software architecture of the Berkeley UAV platform. In Proceedings of the 2006 IEEE Conference on Computer Aided Control System Design, Munich, Germany, 4–6 October 2006; pp. 1420–1425. [Google Scholar]
- Pastor, E.; Lopez, J.; Royo, P. UAV Payload and Mission Control Hardware/Software Architecture. IEEE Aerosp. Electron. Syst. Mag. 2007, 22, 3–8. [Google Scholar] [CrossRef]
- Al-Kaff, A.; Moreno, F.M.; Hussein, A. ROS-Based Approach for Unmanned Vehicles in Civil Applications. Stud. Comput. Intell. 2018, 778, 155–183. [Google Scholar] [CrossRef]
- Yakıcı, E. Solving location and routing problem for UAVs. Comput. Ind. Eng. 2016, 102, 294–301. [Google Scholar] [CrossRef]
- Chow, J. Dynamic UAV-based traffic monitoring under uncertainty as a stochastic arc-inventory routing policy. Int. J. Transp. Sci. Technol. 2016, 5, 167–185. [Google Scholar] [CrossRef]
- Schøler, F.; la Cour-Harbo, A.; Bisgaard, M. Generating configuration spaces and visibility graphs from a geometric workspace for UAV path planning. In Proceedings of the AIAA Guidance, Navigation, and Control Conference, Portland, OR, USA, 8–11 August 2011. [Google Scholar]
- Yang, K.; Sukkarieh, S. Real-time continuous curvature path planning of UAVS in cluttered environments. In Proceedings of the Mechatronics and Its Applications, ISMA 2008, 5th International Symposium, Amman, Jordan, 27–29 May 2008; pp. 1–6. [Google Scholar] [CrossRef]
- Yan, F.; Liu, Y.-S.; Xiao, J.-Z. Path Planning in Complex 3D Environments Using a Probabilistic Roadmap Method. Int. J. Autom. Comput. 2013, 10, 525–533. [Google Scholar] [CrossRef]
- Musliman, I.A.; Alias, A.R.; Volker, C. Implementing 3D network analysis in 3D-GIS. Int. Arch. ISPRS 37 Part B 2008, 37, 913–918. [Google Scholar]
- De Filippis, L.; Guglieri, G.; Quagliotti, F. Path planning strategies for UAVS in 3D environments. J. Intell. Robot. Syst. 2012, 65.1, 247–264. [Google Scholar] [CrossRef]
- Carsten, J.; Ferguson, D.; Stentz, A. 3d field d: Improved path planning and replanning in three dimensions. In Proceedings of the 2006 IEEE/RSJ International Conference on Intelligent Robots and Systems, IEEE, Beijing, China, 9–15 October 2006. [Google Scholar]
- Bauranov, A.; Rakas, J. Designing airspace for urban air mobility: A review of concepts and approaches. Prog. Aerosp. Sci. 2021, 125, 100726. [Google Scholar] [CrossRef]
- NASA. UTM: Air Traffic Management for Low-Altitude Drones; NASA: Washington, DC, USA, 2018. [Google Scholar]
- FAA. Urban Air Mobility (UAM), Concept of Operations V1.0; US Department of Transportation Office of NextGen: Washington, DC, USA, 2020. [Google Scholar]
- Dagi, G. Concept for Urban Airspace Integration DLR; U-Space Blueprint; German Aerospace Center-Institut of Flight Guidance: Cologne, Germany, 2017. [Google Scholar]
- SESAR Joint Undertaking. U-Space Blueprint; SESAR Joint Undertaking: Luxembourg, 2017. [Google Scholar]
- Jang, D.-S.; Ippolito, C.A.; Sankararaman, S.; Stepanyan, V. Concepts of Airspace Structures and System Analysis for UAS Traffic flows for Urban Areas. In Proceedings of the AIAA Information Systems-AIAA Infotech @ Aerospace, Grapevine, TX, USA, 9–13 January 2017. [Google Scholar] [CrossRef] [Green Version]
- Lascara, B.; Lacher, A.; DeGarmo, M.; Maroney, D.; Niles, R.; Vempati, L. Urban Air Mobility Airspace Integration Concepts; MITRE: Bedford, MA, USA, 2019. [Google Scholar]
- Sunil, E.; Hoekstra, J.M.; Ellerbroek, J.; Bussink, F.; Nieuwenhuisen, D.; Vidosavljevic, A.; Kern, S. Metropolis: Relating airspace structure and capacity for extreme traffic densities. In Proceedings of the 11th USA/Europe Air Traffic Management Research and Development Seminar (ATM2015), Lisbon, Portugal, 23–26 June 2015. [Google Scholar]
- Le Tallec, C.; Le Blaye, P. Low Level RPAS Traffic Identification and Management. In Proceedings of the EUCASS, Milano, Italy, 3 July 2017. [Google Scholar]
- Low, K.H.; Gan, L.; Mao, S. A Preliminary Study in Managing Safe and Efficient Low-Altitude Unmanned Aircraft System Operations in a Densely Built-Up Urban Environment; Air Traffic Management Research Institute, School of Mechanical and Aerospace Engineering Nanyang Technological University: Singapore, 2014. [Google Scholar]
- Ahmed, S.; Mohamed, A.; Harras, K.; Kholief, M.; Mesbah, S. Energy efficient path planning techniques for UAV-based systems with space discretization. In Proceedings of the 2016 IEEE Wireless Communications and Networking Conference, Doha, Qatar, 3–6 April 2016; pp. 1–6. [Google Scholar] [CrossRef]
- Miao, H.; Yu-Chu, T. Dynamic robot path planning using an enhanced simulated annealing approach. Appl. Math. Comput. 2013, 222, 420–437. [Google Scholar] [CrossRef] [Green Version]
- Zammit, C.; van Kampen, E.-J. Comparison Between A* and RRT Algorithms for 3D UAV Path Planning. Unmann. Syst. 2021, 10, 129–146. [Google Scholar] [CrossRef]
- Statistics Canada. Available online: https://www12.statcan.gc.ca/census-recensement/2016/ (accessed on 19 May 2022).
- Google Maps. Available online: https://www.google.com/maps/place/Toronto,+ON/ (accessed on 19 September 2018).
- ESRI ArcGIS Online. Available online: https://www.arcgis.com/ (accessed on 19 September 2018).
- Open Street Map. Available online: https://www.openstreetmap.org/ (accessed on 19 September 2018).
- City of Toronto. Available online: http://www.toronto.ca/wps/ (accessed on 19 September 2018).
- Rhinoceros 3D. Available online: https://www.rhino3d.com/ (accessed on 19 September 2018).
- El Sayed, M. Optimizing thermal performance of building-integrated photovoltaics for upgrading informal urbanization. Energy Build. 2016, 116, 232–248. [Google Scholar] [CrossRef]
- Luukkonen, T. Modelling and control of quadcopter. Independent research project in applied mathematics, Espoo 2011, 22, 22. [Google Scholar]
- Bonatti, R.; Wang, W.; Ho, C.; Ahuja, A.; Gschwindt, M.; Camci, E.; Kayacan, E.; Choudhury, S.; Scherer, S. Autonomous aerial cinematography in unstructured environments with learned artistic decision-making. J. Field Robot. 2020, 37, 606–641. [Google Scholar] [CrossRef] [Green Version]
- Bn, P.K.; Patil, A.K.; Chai, Y.H. On-site 4-in-1 alignment: Visualization and interactive cad model retrofitting using uav, lidar’s point cloud data, and video. Sensors 2019, 19, 3908. [Google Scholar]
- Patrikar, J.; Moon, B.G.; Scherer, S. Wind and the city: Utilizing uav-based in-situ measurements for estimating urban wind fields. In Proceedings of the 2020 IEEE/RSJ International Conference on Intelligent Robots and Systems (IROS), Las Vegas, NV, USA, 24 October 2020–10 February 2021; pp. 1254–1260. [Google Scholar]
- Pavan Kumar, B.N.; Balasubramanyam, A.; Patil, A.K.; Chethana, B.; Chai, Y.H. GazeGuide: An eye-gaze-guided active immersive UAV camera. Appl. Sci. 2020, 10, 1668. [Google Scholar]
- Christiansen, M.P.; Laursen, M.S.; Jørgensen, R.N.; Skovsen, S.; Gislum, R. Designing and testing a UAV mapping system for agricultural field surveying. Sensors 2017, 17, 2703. [Google Scholar] [CrossRef] [Green Version]
- Radoglou-Grammatikis, P.; Sarigiannidis, P.; Lagkas, T.; Moscholios, I. A compilation of UAV applications for precision agriculture. Comput. Netw. 2020, 172, 107148. [Google Scholar] [CrossRef]
Publisher’s Note: MDPI stays neutral with regard to jurisdictional claims in published maps and institutional affiliations. |
© 2022 by the authors. Licensee MDPI, Basel, Switzerland. This article is an open access article distributed under the terms and conditions of the Creative Commons Attribution (CC BY) license (https://creativecommons.org/licenses/by/4.0/).
