Article

Statistical Analysis of the Variability of Energy Efficiency Indicators for a Multi-Family Residential Building

by
Anna Życzyńska
1,
Zbigniew Suchorab
2,*,
Dariusz Majerek
3 and
Violeta Motuzienė
4
1
Faculty of Civil Engineering and Architecture, Lublin University of Technology, 40 Nadbystrzycka Str., 20-618 Lublin, Poland
2
Faculty of Environmental Engineering, Lublin University of Technology, 40B Nadbystrzycka Str., 20-618 Lublin, Poland
3
Faculty of Fundamentals of Technology, Lublin University of Technology, 38 Nadbystrzycka Str., 20-618 Lublin, Poland
4
Department of Building Energetics, Vilnius Gediminas Technical University, 11 Saulėtekio Str., 10223 Vilnius, Lithuania
*
Author to whom correspondence should be addressed.
Energies 2022, 15(14), 5042; https://doi.org/10.3390/en15145042
Submission received: 14 June 2022 / Revised: 2 July 2022 / Accepted: 6 July 2022 / Published: 11 July 2022
(This article belongs to the Special Issue Internal Environment and Thermal Performance of Buildings)

Abstract

:
During the building design phase, a lot of attention is paid to the thermal properties of the external envelopes. New regulations are introduced to improve energy efficiency of a building and impose a reduction of the overall heat transfer coefficient; meanwhile, this efficiency is more influenced by the efficiency of the heating system and the type of fuels used. This article presents a complex analysis including the impact of: heat transfer coefficient of the envelope, efficiency of building service systems, the type of energy source, and the fuel. The analysis was based on the results of simulation tests obtained for an exemplary multi-family residential building located in Poland that is not equipped with a cooling system. The conducted calculations gave quantitative evaluation of the influence of particular parameters on building energy performance and showed that the decrease of heat transfer coefficient of building boundaries, in accordance to the Polish regulation for 2017 and 2021, gave only 11% of reduction on usable energy demand index. On the other hand, it was found that modification of the heating system and heat source can significantly influence the values of the final and primary energy consumption at the level of 70%. The application of heat pumps has a greater influence on the final and primary energy consumption for heating indices than other parameters, such as the building’s envelopes.

1. Introduction

The European Union (EU) is committed to developing a sustainable, competitive, secure, and decarbonized energy system by 2050. This is because the building stock is responsible for approximately 36% of all CO2 emissions in the EU and its share is continuously increasing within the past decades [1,2,3]. Thermal performance of the building envelope is an important part of the overall heating energy efficiency. Hence, as emphasized in Directive (EU) 2018/844 [4], it is important to ensure that the measures to improve the energy performance of buildings do not focus only on the building envelope, but include all relevant elements and technical systems in a building [5,6]. Member States shall set additional requirements for the technical systems of existing and new buildings as well as their optimization.
According to EU Buildings Datamapper [7], residential buildings in different countries constitute 59–89% of the building stock. Poland is one of the largest EU countries where total building floor area is 1511 Mm2 [8] and residential buildings account for about 67% of the entire building stock.
As the residential sector is one of the largest heat recipients on a country scale, the issues related to the energy consumption in housing sector are still relevant, as demonstrated by the conduct of a common energy policy of states, improvement of existing and introduction of new legal regulations at international and national level both for energy and waste policy [9,10]. This sector still faces many unsolved energy performance-related problems. Half of the residential buildings were built before 1980 and the majority of buildings are uninsulated or insulated at sub-optimal levels. The (deep) renovation rate is currently very low. Energy Performance Certificates (EPCs) are mandatory in Poland, yet the share of issued EPCs for the residential stock is just about 4%. Energy audits are rarely conducted in single-family houses due to their high cost. Heating energy consumption of residential buildings is still around 40% above the average of the EU and share of nearly zero-energy buildings (nZEB) [11,12] in new construction for residential buildings is one of the lowest (about 50% lower than the EU average).
In Poland, many multi-family residential buildings without mechanical ventilation with heat recovery are still being built. In this type of the buildings, the heating and ventilation needs account for the largest share of heat demand. On the other hand, different measures to solve these problems are applied in the case of newly designed buildings, including continuous improvement of requirements in the field of thermal insulation of building partitions and energy efficiency of the applied technical systems and devices, as well as the implementation of the modern technologies. Moreover, in the present geopolitical situation, when fossil fuels are becoming increasingly expensive and their combustion is not environmentally friendly, there is a growing interest in the use of renewable energy sources for heat production, while obtaining electricity, e.g., from photovoltaic cells or wind farms [13,14,15,16]. It should be emphasized here that in Poland, nearly all buildings are equipped with heat meters. However, it is required that energy consumption should be monitored in detail, technical systems should be properly managed and their performance parameters controlled, which should ultimately lead to rational energy management in the building [17,18].
The analysis of the methodology to prepare the building energy certificates and related standards indicate that many parameters affect the value of the building indicator for non-renewable annual primary energy consumption for heating (PEH). The value of the PEH index depends on the value of the building indicators of usable, final energy and primary energy factor [3,19,20,21]. The building usable energy demand, expressed through the usable energy demand, is influenced by: climatic conditions related to the location of the building, its orientation relative to world directions, internal heat gains and building envelope parameters, such as thermal insulation of building partitions, protection properties against wind, building glazing, shading of transparent partitions and their ability to transmit solar radiation [18,22,23,24].
The value of the building final energy consumption for heating (FEH) is directly affected by the total efficiency of the heating system and the demand of auxiliary energy for pumps (parasitic energy) [3]. However, for a given value of the FEH index, the value of the primary energy PEH directly depends on the method of supplying energy to the building and the energy source [25]. This article attempts to analyze the magnitude of the impact of changing individual parameters on the values of energy indicators, based on simulation calculations.
Contrary to the considerations which take into account only the factors related to the shape of the building or only heat sources and the efficiency of heating systems, the goal of the article is a complex and quantitative assessment of the influence of the building parameters such as overall heat transfer coefficients (U-values) resulting from legal acts in a given period of erecting facilities, cardinal direction, glazing degree, shadow affect and solar heat gain coefficient (g-value) on the building energy indicators (EUH, FEH and PEH). In addition, as part of a comprehensive analysis, the impact on the energy efficiency of heating systems with different heat sources, fuel types, heating medium temperatures, as well as the use of renewable heat sources, was checked.

2. Materials and Methods

The building considered within the presented investigation is presented in Figure 1. It has a cuboid shape, three heated floors above ground and the full unheated basement. Its heated area is Af = 841.5 m2, storey height—2.8 m3, and the A/V shape ratio—0.51 1/m. The analysis concerns only the energy demand required to cover the energy demand related to the heating of the object.
Calculations of the heating energy demand were carried out for the standard design weather data (average monthly temperatures from long period observations) and standard indoor conditions based on Polish technical and construction regulations (20 °C). Using these values, the number of degree-days (presented below) was defined. The calculations were based on the algorithm used to determine the energy performance of a building contained in the Polish legal acts [26,27] which implement the EPBD directive [28].
Knowing the value of the annual useable energy demand for heating and ventilation (QH,nd), calculated using various combinations of building orientation and parameters of partitions forming its external envelope, the following relationships were used in further calculations:
Annual, final energy consumption for heating and ventilation [26]:
Q k , H = Q H , n d η H , t o t   [ kWh / a ]
where: QH,nd—annual useable energy demand for heating and ventilation [kWh/a], ηH,tot—average seasonal total efficiency of the heating system [-].
Average seasonal total efficiency of the heating system calculated as a product of the seasonal efficiencies [-] of: heat generation (ηH,g), heat distribution (ηH,d), heat accumulation (ηH,s), heat adjustment and utilization (ηH,e).
Average seasonal total efficiency of the heating system calculated as a product of the seasonal efficiencies [-] of: heat generation (ηH,g), heat distribution (ηH,d), heat accumulation (ηH,s), heat adjustment and utilization (ηH,e) [26]:
η H , t o t = η H , g η H , d η H , s η H , e   [ - ]
Annual demand for final auxiliary energy for the heating system [26]:
E e l , a u x , H = q e l , H , i t e l , i A f 10 3   [ kWh / a ]
where: qel,H, i—demand for unit power [W/m2], tel,i—number of operating hours during the year, Af—surface of the rooms with controlled temperature.
Annual unit demand for final auxiliary energy for the heating system:
E e l , a u x , H , j e d . =   E e l , a u x , H A f   [ kWh / ( m 2 · a ) ]
Annual demand for non-renewable primary energy for the heating system, including the auxiliary energy and the coefficients of the non-renewable primary energy input wH and wel [26]:
Q p , H = Q k , H w H + E e l , a u x , H w e l   [ kWh / a ]
Annual usable energy demand index for heating and ventilation referred to the unit of the area with a design air temperature equal to 20 °C [26]:
U E H = Q H , n d A f   [ kWh / ( m 2 · a ) ]
This index represents the building energy demand for heat conductivity through the external envelope and ventilation air heating. It does not cover the type and efficiencies of the building services, but is essential for the evaluation of the final and primary energy consumption indices.
Annual final energy consumption index for heating and ventilation referred to the unit of the area with a design air temperature [26]:
F E H = Q k ,   H A f   [ kWh / ( m 2 · a ) ]
Annual primary energy index for heating and ventilation referred to the unit of the area with design air [26].
P E H = Q p , H A f   [ kWh / ( m 2 · a ) ]
Assumptions for the calculation of the annual usable energy consumption index for heating (UEH) are the following:
  • Building location in the Eastern Poland, where outdoor design parameters are:
  • Average temperature of the winter period months equal 2.8 °C.
  • Number of days of winter period duration equal 222 days.
  • Number of degree-days for the location equals to 3825.2 (day∙K)/a.
  • Solar radiation zone: 1200 kWh/m2.
  • Values of the overall heat transfer coefficients of the partitions (U) were considered in two groups—A and B. In the case of group, the U-values are boundary values according to the national legal acts, in force in Poland until 2021 (since 2017), in the case of B group—in force since 2021 (Table 1).
  • Values of the overall heat transfer coefficients of the partitions not covered by the requirements in the discussed case are the following, in the unheated zone of the building, covered by the calculation: wall in the ground—0.481 W/(m2∙K), floor on the ground—0.880 W/(m2∙K), external wall—0.484 W/(m2∙K)
  • Unit internal heat gains 6.5 W/m2.
  • The proportion of the transparent surface in the entire window 0.7.
  • Orientation relative to cardinal directions: N-S and E-W.
  • Building glazing: minimum P1 and maximum P2, determined according to the requirements of Polish technical and building regulations [29]. Both values were calculated as the available values for the analyzed building model. P1 represents the building glazing level that provides minimal room lightning; on the other hand, P2—maximal allowed glazing level combined with the solar heat gains.
  • No moving shading devices.
  • Shading coefficient from external elements: 0.9 (e.g., building in the city center) and 1.0 (e.g., in the open air).
  • Solar transmittance (g-value) for glazed surfaces: 0.75 (e.g., double glazing), 0.7 (e.g., triple glazing), 0.64 (e.g., glazed unit with one coating and argon space), 0.50 (e.g., special glass).
As a result of the combination of the individual parameters, 32 cases were obtained in each of the group A and B requirements in the field of the overall heat transfer coefficients of the building partitions. For each of them, simulation of the energy demand for usable energy was carried out and the UEH indicator of the building was determined.
For the calculation of FEH and PEH indicators of the building, seven variants (v1–v7) of the heating were considered. The description of heating systems is included in Table 2.
  • values of average seasonal partial efficiency of the individual heating system elements and seasonal average total efficiency of the heating system in the individual variants are presented in Table 3.
  • average seasonal accumulation efficiency in each variant ηH,s = 1.0
  • values of coefficients of non-renewable primary energy input for individual heating systems were determined according to [26] and are given in Table 3
  • value of the coefficient of non-renewable primary energy input for the purposes of determining the primary electric energy factor wel = 3.0
  • values of unit coefficients of the final and primary auxiliary electric energy demand for individual variants are presented in Table 3.

3. Results

In the first stage of investigation, the usable energy demand was evaluated for 32 cases (n). In order to determine the influence of U-value on usable energy demand, two parameters were considered (QH,nd and UEH). All measures of position, such as minimum, maximum, and mean are lower for the 2021 technical specification than for 2017 (see Table 4). Comparisons of means of both indicators between technical specifications show statistical significance of differences, based on t-Student test for independent samples. Dispersion of energy consumption are similar for two policies and distributions of them are normal (see Figure 2).
Regardless which value was examined, it can be noted that there is quite a wide range of energy demand in each technical specification. For the regulations of 2017, the relative difference calculated as Δ Q u = max Q u min Q u max Q u 100 % is 20.74% of the annual usable energy demand. For the 2021 technical specification, the relative difference of both values is similar (20.89%).
Then, the question what indicators affect such a wide range of energy consumption arises. For further analysis, the linear models were applied to show the relationship of QH,nd and UEH with some indicators characterizing the building. Two statistical tests were used to verify whether the relationships of QH,nd and UEH to cardinal direction, glazing degree, shadow effect and solar gain coefficient are correct: the Ramsey RESET test [30] and the RAINBOW test [31].
Table 5, which summarizes all estimated models, shows that each indicator is statistically significant. Moreover, it can be said that cardinal direction N-S is better than E-W in terms of energy consumption, while higher glazing degree (P2) causes higher energy consumption. It can also be said that less shading for a residential building is better and higher g-value has a positive effect. The best combination of building parameters in terms of energy consumption is the building arrangement in the north-south system, with the smallest glazing surface, not shaded and with the highest energy transmission of solar radiation. The gain, consisting in lower energy demand (expressed in both QH,nd and UEH) caused by the selection of appropriate building parameters, is shown in Table 6.
One fact is also worth mentioning, namely that the relative difference in terms of energy demand between two policies reaches 11.12% (difference of means was compared to the mean level for 2017 policy—calculation based on Table 4).
A similar analysis was performed for annual final energy factor for heating and annual primary energy factor for heating, but this time heating variants (7) were attached to the list of differentiating factors. That is why the amount of variants increased to 224 (32 × 7).
Again, energy consumption (expressed by FEH and PEH) is higher for the 2017 policy than 2021 (see Table 7) and the difference is statistically significant in each case. This time, variances of both indicators are higher, which can be seen in Figure 3 and distributions deviate from normality. The relative differences (calculated in the same way as for QH,nd and UEH) for FEH and PEH reached 77.05% and 77.89%, respectively, for the 2017 technical specification. For the 2021 policy relative, differences are quite similar, i.e., 76.49% and 77.76%, respectively. Such a large increase in relative differences between FEH, PEH and QH,nd, UEH is caused by inclusion of the heating systems into the analysis. Nevertheless, to ensure that the heating system is actually such an important factor, it is necessary to fit the models describing the relationship between energy consumptions (FEH, PEH) and parameters of building.
For all models, the first heating variant (v1) was set as a reference, the rest of the indicators have the same references as in previous models.
According to Table 8, all indicators are statistically significant. Still, N-S cardinal direction, smaller glazing degree, and shadow effect with the highest energy transmission of solar radiation are the most beneficial setups for building parameters in each policy. Marginal effects of all mentioned indicators are smaller than the heating variant impact. The greatest difference in FEH for the 2017 technical specification is between v4 and v5 variants, equals 63.69 kWh/(m2∙a). This value referred to maximal annual final energy factor for heating is equal to 71.70%, which confirms the heating system importance. Similar analysis for PEH shows the gain exceeds 73.10% between the v3 and v5 variants. It is interesting that the v5 heating system is the worst for FEH and the best for PEH in both policies (see Table 9).
In order to conduct the sensitivity analysis of the applied models, the one-at-a-time (OAT) approach was used [32]. The main idea of this approach is to estimate the effect of particular explanatory variable keeping the rest variable constant, changing variable of interest within the range of it, and monitoring changes in output. Since the variables present in the model are of different scales, they were standardized before performing the sensitivity analysis. Then, comparison of model parameters is possible (Table 10).
Since U E H = Q H , n d A f all standardized coefficients are the same as QH,nd. In both cases (technical specifications 2017 and 2021) the most important prediction is solar heat gain coefficient. Shadow effect is the least significant.

4. Discussion

In the examined model of the building, shape indicators and heat transfer coefficients of partitions, as well as the parameters affecting the radiation gains characteristic of many multi-family residential buildings were assumed. Simulations were conducted for the temperature zone covering about one-third of the Polish area. Therefore, the obtained results of simulation calculations can be referred to similar buildings located in the places with a similar number of degree days, not just in Poland.
The analysis of usable energy calculations indicates that the change of the U coefficients of the partitions from the values given in group A (2017 requirements) to the values given in group B (2021 requirements) leads to a decrease in the average value of the UE index by 11.12%. However, in a given group, the variability of the UE index due to other parameters is as follows: change of orientation from N-S to E-W means an increase in the UE index from 4.37% to 4.61%, change in glazing from the minimum (P1) to maximum (P2) in the group A caused an increase of 4.50% and in group B 3.49%, an increase in shading causes an increase in UE by about 3%, a change in the solar radiation transmission coefficient of the glass from 0.75 to 0.50 causes an increase in UE in group A by 10.7 % in group B by 11.30%. The above-mentioned solution reduces heat gains in the summer period, which improves the comfort of using the rooms, but it is irrelevant in the calculations of the energy consumption index in buildings not equipped with air conditioning.
With different combinations of parameters in a given group of U coefficients, the following extreme values of the EU index were obtained: in group A the minimum value is 46.32 kWh/(m2∙a), and the maximum is 58.44 kWh/(m2∙a), while in group B, the minimum value is 41.11 kWh/(m2∙a), maximum 51.97 kWh/(m2∙a), which is about 20% in both groups.
The charts presented in Figure 2 indicate that the difference in the UE value due to the improvement of thermal insulation of building partitions with some combinations of other parameters can be maintained on the same level.
The considered variants of heating systems are the solutions that can be used in multi-family residential buildings. The assumed partial efficiencies are typical for individual variants described in Table 2. In most cases, the total efficiency of the heating system is less than 1.0, which causes the index of the annual final energy demand for heating and ventilation (FEH) to be higher than the UE indicator. Only in the case of variants v4 and v7, in which heat pumps were used, the value of the ηH,tot coefficient, is greater than 1.0, which means that the FEH index is smaller than the UE indicator. The analyzed range of the ηH,tot coefficient, tot from a minimum of 0.586 in the v5 variant to a maximum of 2.555 in the v4 variant causes very high variability of the FEH index (including auxiliary electricity). In group A, this ratio varies from a minimum value of 23.19 kWh/(m2∙a) to a maximum of 101.02 kWh/(m2∙a), while in group B from a minimum value of 21.15 kWh/(m2∙a) to a maximum of 89.97 kWh/(m2∙a). The type of heating system can generate a variation of around 71%. The calculation results indicate that the use of technical systems with higher efficiency can level the differences resulting from the building envelope parameters. This means that with a less favorable combination of parameters affecting the UE indicator, the use of a system with correspondingly higher efficiency may cause that the FEH index will be lower than in the case of a more favorable combination of parameters. Such high variability of the FEH indicates a very significant impact of the energy efficiency of a given technical solution of a heating system on one of the key indicators of the energy performance of a building. It also means that in a building with good thermal insulation of building partitions, but equipped with a low-efficiency heating system, low final energy demand indicators (FEH) cannot be obtained.
In the national guidelines, the energy standard of a building is defined by the non-renewable primary energy index PE. In a residential building without a cooling system, the most significant for the PE index value is the energy component necessary to meet the demand for heating and ventilation, i.e., PEH. For a given FEH index value, the PEH value depends on the coefficient of non-renewable primary energy input wH. The variability of this factor is very large and results from the method of energy production, the fuel used, and the energy supply system to the building. Designers usually have no influence on the value of this factor. First of all, their values are given in national legal acts. Second, in many cases the designer cannot choose any heat source or centralized system, much less the type of fuel used due to formal and technical barriers. The analysis shows how much influence the wH factor has on the PEH index, with the same standard of building thermal insulation (in a given group A or B) in the considered variants
With the same standard of thermal insulation of the building (in a given group A or B), the variability of the considered variants was approx. 73%. In many cases, low FEH value resulted in high PEH and vice versa. The lowest values of the PEH index are found in the v5 variant, in which biomass is used as fuel (then the value of wH is 0.2). Similar observations were made in the previous research that the authors of this article presented in monograph [33]. In group A of U coefficients, when analyzing the seven adopted variants, value of this indicator varies from the minimum value of 19.68 kWh/(m2∙a) to the maximum value of 88.99 kWh/(m2∙a), while in group B from the minimum value of 19.90 kWh/(m2∙a) to a maximum of 80.47 kWh/(m2∙a). It ought to be noted that the lowest PEH values are not associated with the lowest values in the FEH value set. This means that a building properly designed in terms of thermal insulation and equipped with a high-efficiency heating system does not have to be characterized with a low PEH index value. Nevertheless, a building is assessed in the national regulations by the value of the annual primary energy index and it is the key parameter of energy performance. In summary, the energy quality of designed or existing buildings should be assessed through the final energy index (FEH), while considering the building in terms of its impact on the environment through the index of non-renewable primary energy.

5. Conclusions

A thorough analysis of the obtained results from the heat consumption measurement and theoretical calculations enables to draw the following conclusions:
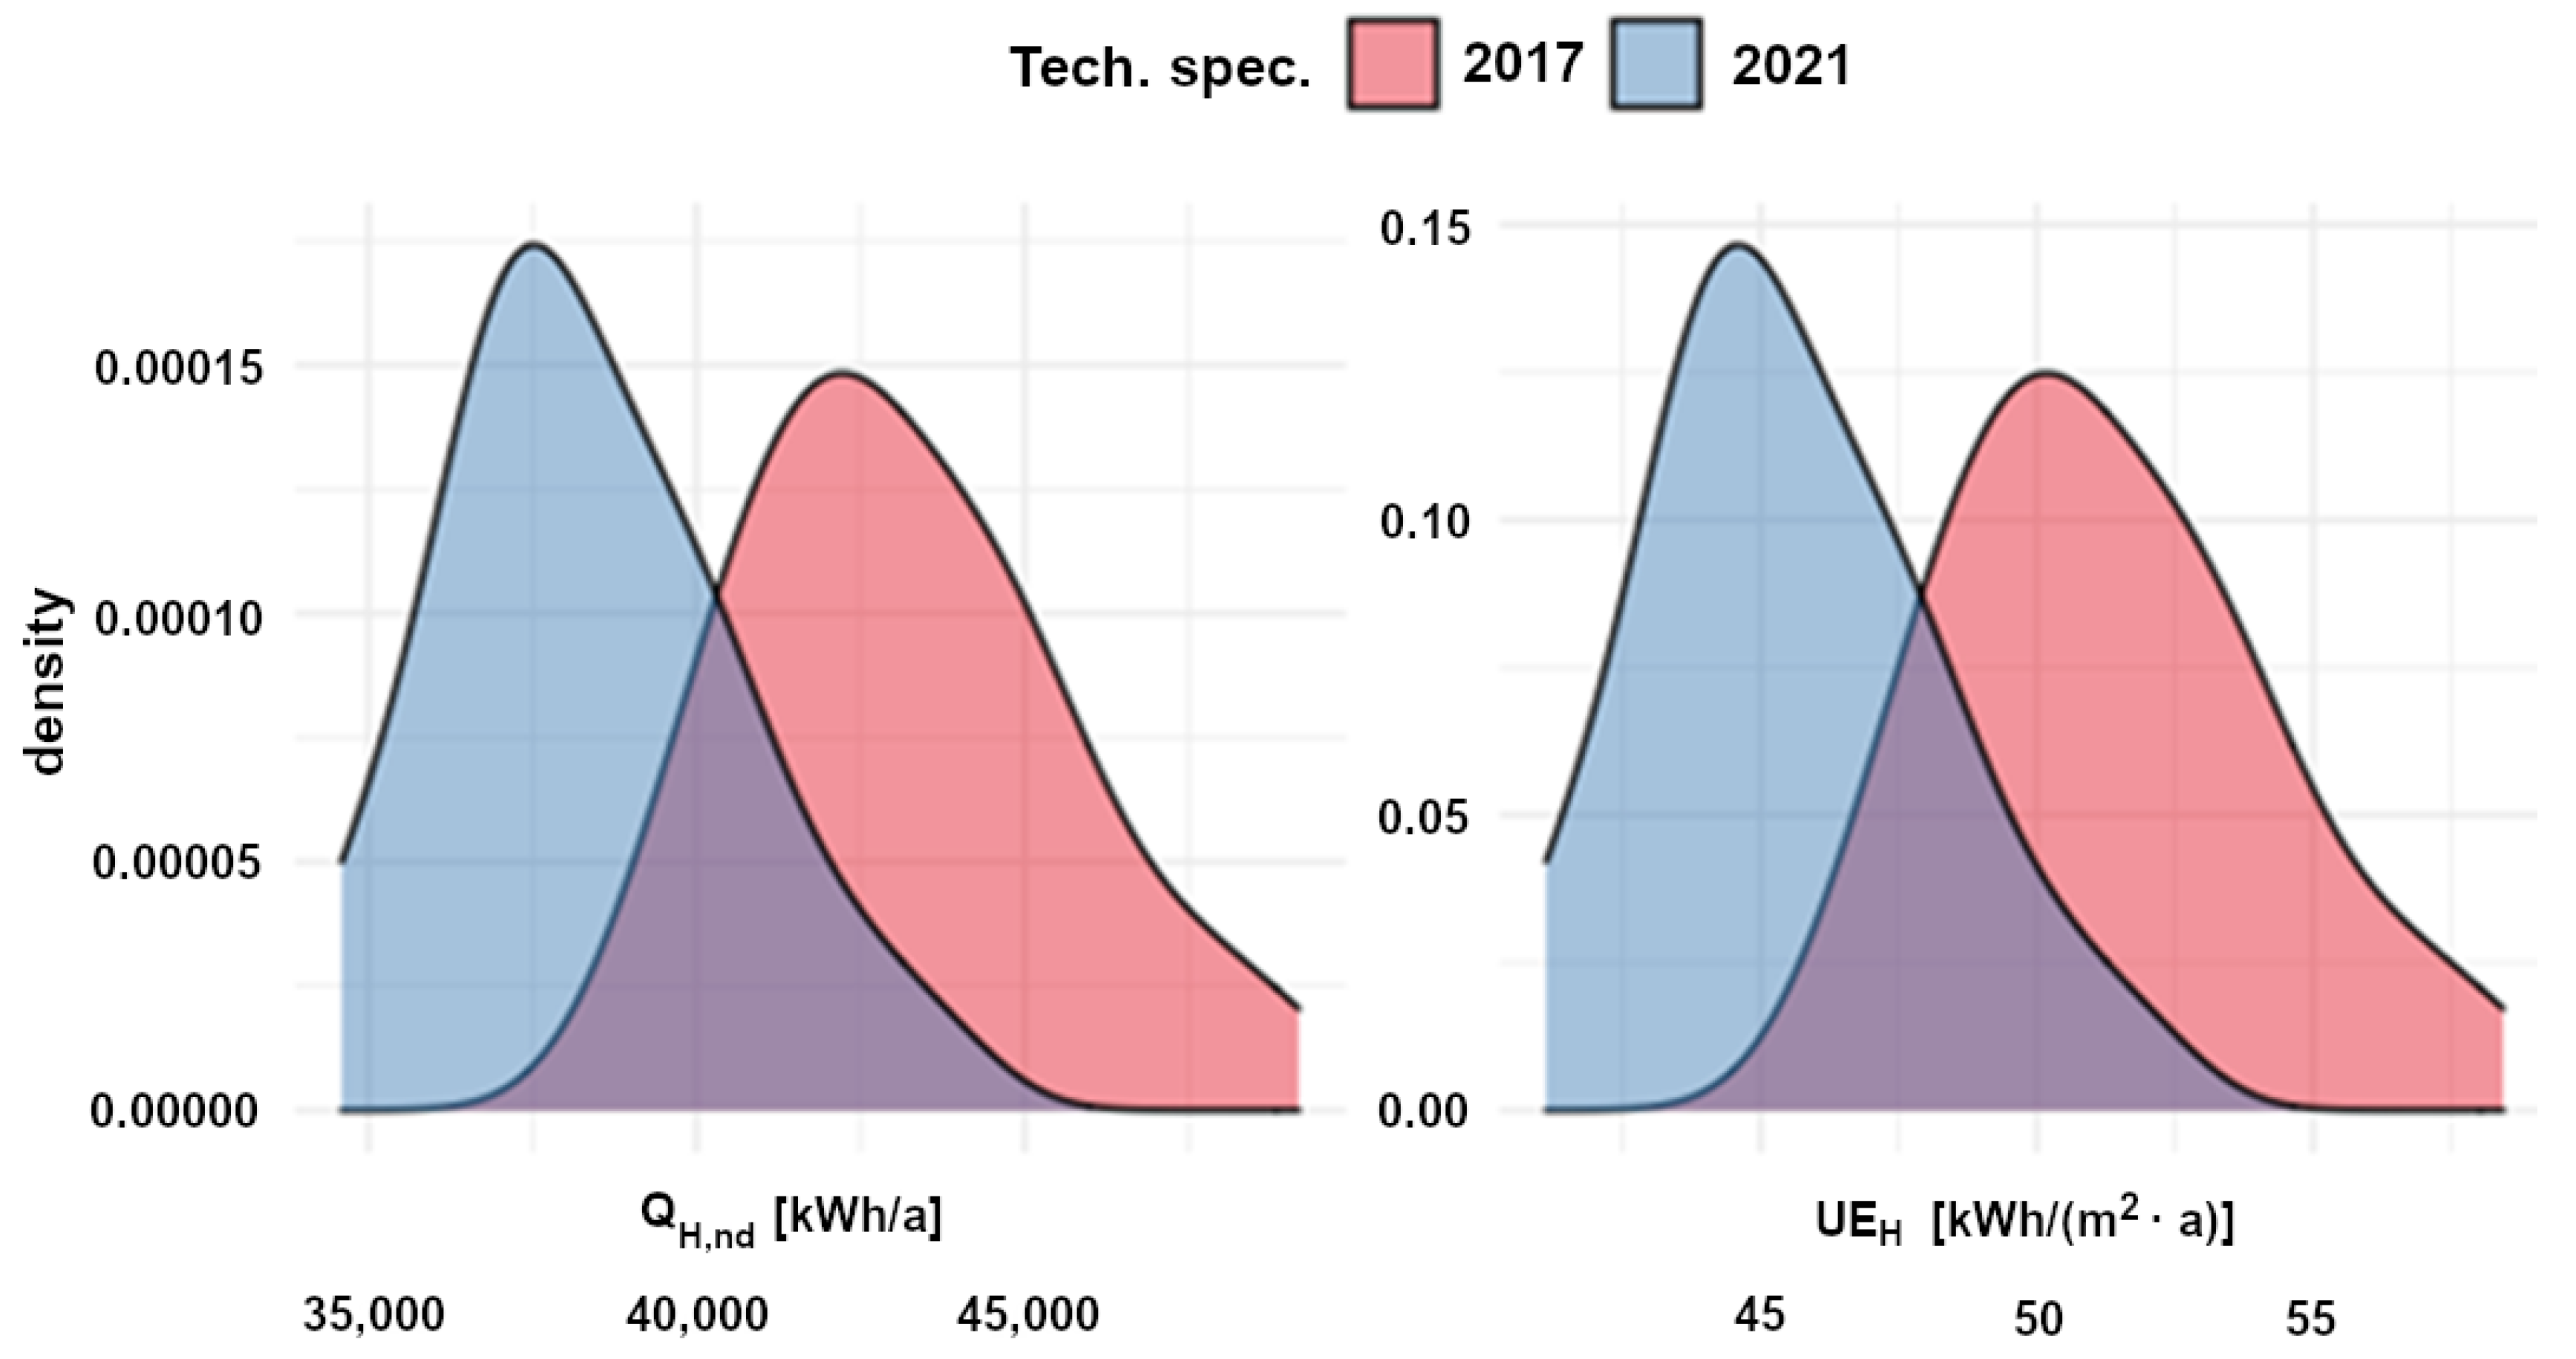
  • The change of policy for the value of the overall heat transfer coefficients considering the requirements for 2017 and 2021 reduces the demand for usable energy demand by only 11.12% This enables to conclude that the energy saving potential associated to the building envelope is practically exploited.
  • The impact of the parameters influencing solar heat gains, such as building glazing, shading of transparent partitions, was only at the level of about 3–5%. The only exception where the changes in solar heat gain (ability to transmit solar radiation) coefficient that influenced UEH index more significantly (11.30%).
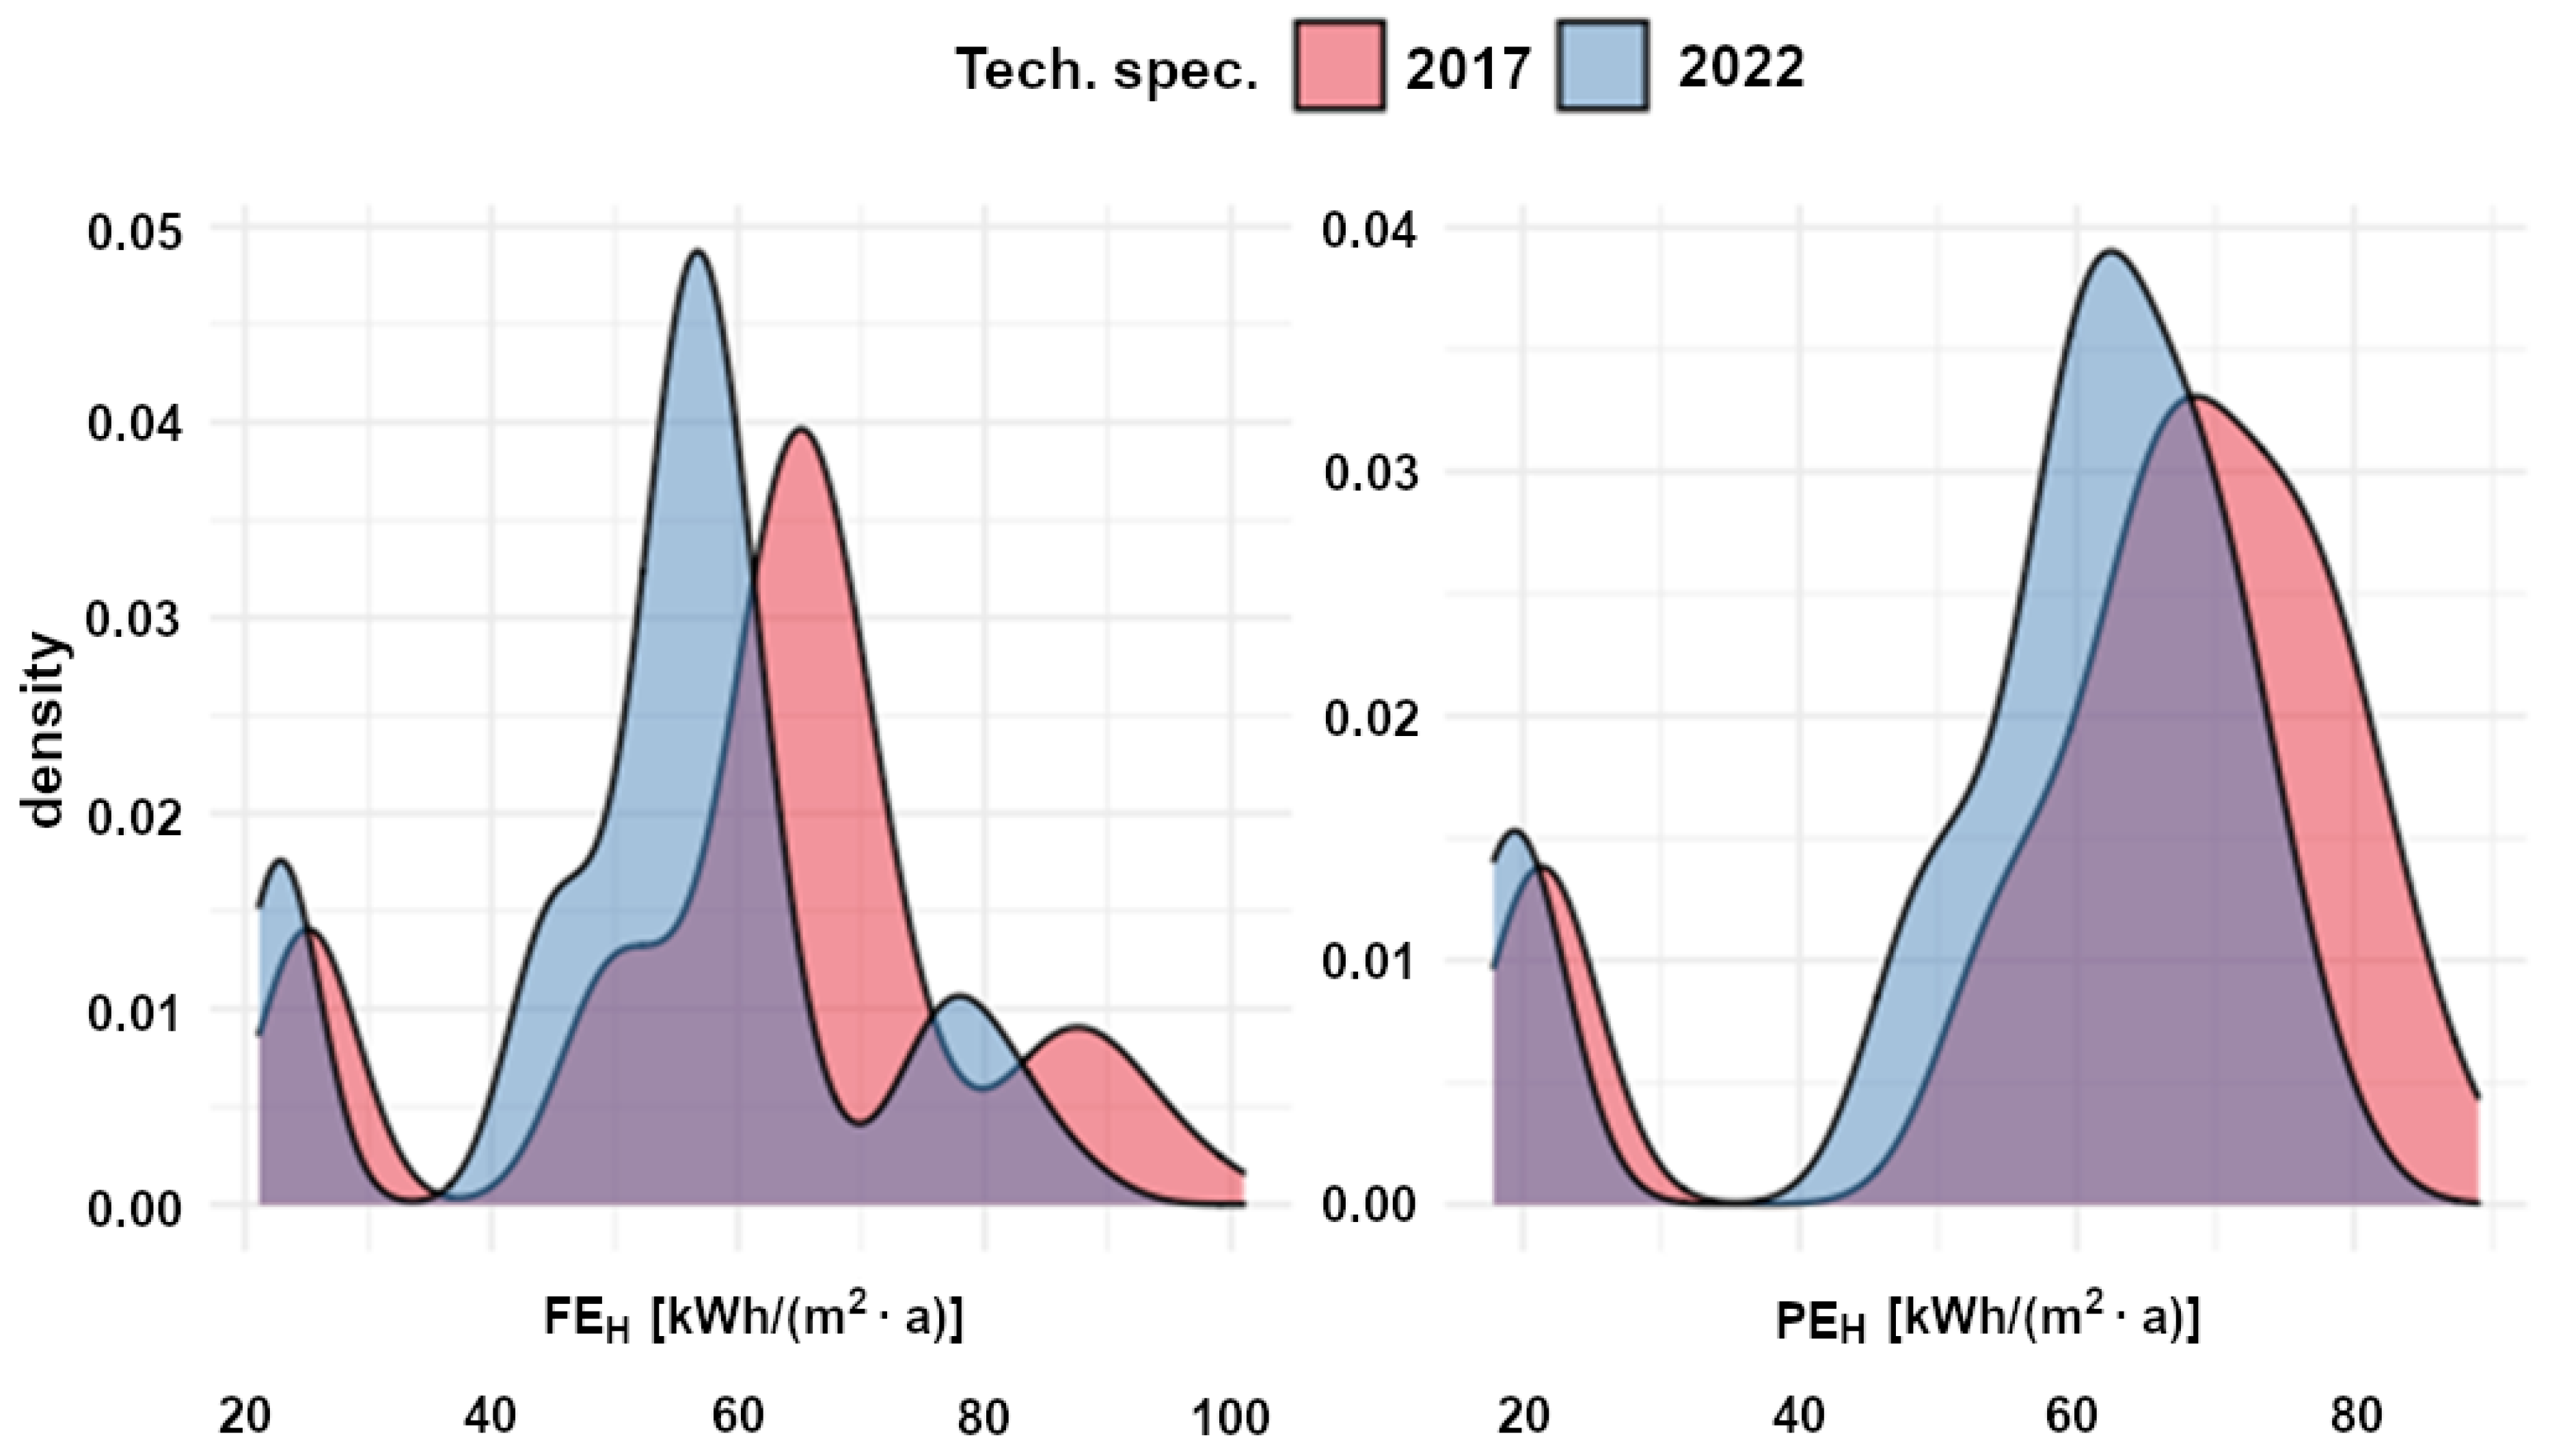
  • The heating system has the greatest impact, which in this case differentiated these primary and final energy indices at the level of approx. 70% for variant 5 (biomass boiler).
  • The application of the heat pumps has a greater influence on FEH and PEH indices than other parameters, mainly the buildings envelopes.
  • Final energy for heating (FEH) index should be used to assess the planned or existing building in terms of energy quality, i.e., their solids together with equipment in a technical heating system. Obtaining a low value of this factor is primarily associated with the use of good architectural solutions and technical systems at the same time as the building equipment.
From the conducted investigation, it can be finally concluded that improvement of the thermal parameters of the building external partitions becomes ineffective after reaching the lower but close to the boundary level of heat transfer coefficients presented in legal acts. Taking into the consideration the environmental impact of the building performance, it seems more reasonable to improve the quality of the building services, mainly heating system and heat source.
In addition, it should be noted that an important aspect related to energy consumption is investment and operating costs, which should be analyzed in order to make the right decisions regarding the scope of technical solutions. The issue of profitability is influenced by many additional factors, such as fuel prices, costs of equipment, and technical solutions. In the case of specific solutions, energy analyses should be carried out in conjunction with analyses of economic profitability.
The obtained results of simulation calculations can be referred to similar buildings located not just in Poland, but also in the places with a similar number of degree-days.

Author Contributions

Conceptualization, A.Ż. and Z.S.; methodology, A.Ż.; software, D.M. and Z.S.; validation, D.M. and A.Ż.; formal analysis, A.Ż., V.M. and D.M.; investigation, A.Ż.; resources, A.Ż.; data curation, A.Ż. and D.M.; writing—original draft preparation, Z.S., A.Ż. and V.M.; writing—review and editing, D.M.; visualization, D.M. and Z.S.; supervision, V.M.; project administration, A.Ż.; funding acquisition, A.Ż. All authors have read and agreed to the published version of the manuscript.

Funding

This research was financially supported by Ministry of Science and Higher Education in Poland within the statutory research of scientific units under subvention for science programs.

Institutional Review Board Statement

Not applicable.

Informed Consent Statement

Not applicable.

Data Availability Statement

Data are contained within the article.

Conflicts of Interest

The authors declare no conflict of interest.

References

  1. Pérez-Lombard, L.; Ortiz, J.; González, R.; Maestre, I.R. A review of benchmarking, rating and labelling concepts within the framework of building energy certification schemes. Energy Build. 2009, 41, 272–278. [Google Scholar] [CrossRef]
  2. Reis, J.A.; Escórcio, P.C.C. Energy certification in St. António (Funchal)—Statistical analysis. Energy Build. 2012, 49, 126–131. [Google Scholar] [CrossRef]
  3. Cao, X.; Dai, X.; Liu, J. Building energy-consumption status worldwide and the state-of-the-art technologies for zero-energy buildings during the past decade. Energy Build. 2016, 128, 198–213. [Google Scholar] [CrossRef]
  4. European Union. Directive (EU) 2018/844 of the European Parliament and of the Council of 30 May 2018 amending Directive 2010/31/EU on the energy performance of buildings and Directive 2012/27/EU on energy efficiency. Off. J. Eur. Union 2018, 156, 75–91. [Google Scholar]
  5. Ahmad, M.W.; Mourshed, M.; Mundow, D.; Sisinni, M.; Rezgui, Y. Building energy metering and environmental monitoring—A state-of-the-art review and directions for future research. Energy Build. 2016, 120, 85–102. [Google Scholar] [CrossRef] [Green Version]
  6. Dall’O’, G.; Galante, A.; Torri, M.D.C. A methodology for the energy performance classification of residential building stock on an urban scale. Energy Build. 2012, 48, 211–219. [Google Scholar] [CrossRef]
  7. EU Buildings Datamapper. Share of Non-Residential in Total Building Floor Area; 2013. Available online: https://ec.europa.eu/energy/eu-buildings-datamapper_en (accessed on 13 June 2022).
  8. iBRoad, Individual Building Renovation Roadmaps. Factsheet: Poland, Current Use of EPCs and Potential Links to iBRoad; 2020. Available online: http://ibroad-project.eu/wp-content/uploads/2018/01/iBROAD_CountryFactsheet_POLAND.pdf (accessed on 13 June 2022).
  9. Piotrowska, E.; Borchert, A. Energy consumption of buildings depends on the daylight. E3S Web Conf. 2017, 14, 1029. [Google Scholar] [CrossRef] [Green Version]
  10. Saleem, M.; Blaisi, N.I.; Alshamrani, O.S.D.; Al-Barjis, A. Fundamental investigation of solid waste generation and disposal behaviour in higher education institute in the Kingdom of Saudi Arabia. Indoor Built Environ. 2018, 28, 927–937. [Google Scholar] [CrossRef]
  11. Zhang, S.-C.; Yang, X.-Y.; Xu, W.; Fu, Y.-J. Contribution of nearly-zero energy buildings standards enforcement to achieve carbon neutral in urban area by 2060. Adv. Clim. Chang. Res. 2021, 12, 734. [Google Scholar] [CrossRef]
  12. Li, H.; Li, Y.; Wang, Z.; Shao, S.; Deng, G.; Xue, H.; Xu, Z.; Yang, Y. Integrated building envelope performance evaluation method towards nearly zero energy buildings based on operation data. Energy Build. 2022, 268, 112219. [Google Scholar] [CrossRef]
  13. Cuevas-Figueroa, G.; Stansby, P.K.; Stallard, T. Accuracy of WRF for prediction of operational wind farm data and assessment of influence of upwind farms on power production. Energy 2022, 254, 124362. [Google Scholar] [CrossRef]
  14. Zhang, B.; Xu, G.; Zhang, Z. A holistic robust method for optimizing multi-timescale operations of a wind farm with energy storages. J. Clean. Prod. 2022, 356, 131793. [Google Scholar] [CrossRef]
  15. Helseth, L. Harvesting energy from light and water droplets by covering photovoltaic cells with transparent polymers. Appl. Energy 2021, 300, 117394. [Google Scholar] [CrossRef]
  16. Zhang, F.; Han, C.; Wu, M.; Hou, X.; Wang, X.; Li, B. Global sensitivity analysis of photovoltaic cell parameters based on credibility variance. Energy Rep. 2022, 8, 7582–7588. [Google Scholar] [CrossRef]
  17. Csoknyai, T.; Hrabovszky-Horváth, S.; Georgiev, Z.; Jovanovic-Popovic, M.; Stankovic, B.; Villatoro, O.; Szendrő, G. Building stock characteristics and energy performance of residential buildings in Eastern-European countries. Energy Build. 2016, 132, 39–52. [Google Scholar] [CrossRef]
  18. Hajian, H.; Ahmed, K.; Kurnitski, J. Dynamic heating control measured and simulated effects on power reduction, energy and indoor air temperature in an old apartment building with district heating. Energy Build. 2022, 268, 112174. [Google Scholar] [CrossRef]
  19. Holzmann, A.; Adensam, H.; Kratena, K.; Schmid, E. Decomposing final energy use for heating in the residential sector in Austria. Energy Policy 2013, 62, 607–616. [Google Scholar] [CrossRef]
  20. Le Truong, N.; Dodoo, A.; Gustavsson, L. Final and primary energy use for heating new residential area with varied exploitation levels, building energy performance and district heat temperatures. Energy Procedia 2019, 158, 6544–6550. [Google Scholar] [CrossRef]
  21. Życzyńska, A.; Suchorab, Z.; Majerek, D. Influence of thermal retrofitting on annual energy demand for heating in multi-family buildings. Energies 2020, 13, 4625. [Google Scholar] [CrossRef]
  22. Wei, S.; Jones, R.; de Wilde, P. Driving factors for occupant-controlled space heating in residential buildings. Energy Build. 2014, 70, 36–44. [Google Scholar] [CrossRef] [Green Version]
  23. Laskari, M.; de Masi, R.-F.; Karatasou, S.; Santamouris, M.; Assimakopoulos, M.-N. On the impact of user behaviour on heating energy consumption and indoor temperature in residential buildings. Energy Build. 2021, 255, 111657. [Google Scholar] [CrossRef]
  24. Haq, M.A.U.; Rao, G.S.; Albassam, M.; Aslam, M. Marshall–Olkin Power Lomax distribution for modeling of wind speed data. Energy Rep. 2020, 6, 1118–1123. [Google Scholar] [CrossRef]
  25. Ballarini, I.; Corrado, V. Application of energy rating methods to the existing building stock: Analysis of some residential buildings in Turin. Energy Build. 2009, 41, 790–800. [Google Scholar] [CrossRef]
  26. Regulation of The Polish Minister of Infrastructure of 27 February 2015 Concerning the Methodology for Calculating the Energy Performance of the Building or Part of a Building and the Preparation of Certificates of Energy Performance. Available online: http://prawo.sejm.gov.pl/isap.nsf/DocDetails.xsp?id=WDU20150000376 (accessed on 13 June 2022).
  27. Act of August 29, 2014 on the Energy Performance of Buildings. Available online: https://isap.sejm.gov.pl/isap.nsf/download.xsp/WDU20140001200/U/D20141200Lj.pdf (accessed on 13 June 2022).
  28. European Union. Directive 2010/31/EU of the European Parliament and of the Council of 19 May 2010 on the energy performance of buildings. Off. J. Eur. Union 2010, 153, 13–35. [Google Scholar]
  29. Regulation of the Polish Ministry of Transport, Construction and Maritime Economy of 13 August 2013 Amending the Regulation on the Technical Conditions to Be Met by Buildings and Their Location. Available online: http://isap.sejm.gov.pl/isap.nsf/download.xsp/WDU20130000926/O/D20130926.pdf (accessed on 1 February 2021).
  30. Ramsey, J.B. Tests for specification errors in classical linear least-squares regression analysis. J. R. Stat. Soc. Ser. B Methodol. 1969, 31, 350–371. [Google Scholar] [CrossRef]
  31. Utts, J.M. The rainbow test for lack of fit in regression. Commun. Stat. Theory Methods 1982, 11, 2801–2815. [Google Scholar] [CrossRef]
  32. Murphy, J.M.; Sexton, D.M.H.; Barnett, D.N.; Jones, G.S.; Webb, M.J.; Collins, M.; Stainforth, D. Quantification of modelling uncertainties in a large ensemble of climate change simulations. Nature 2004, 430, 768–772. [Google Scholar] [CrossRef]
  33. Zyczynska, A. Wydawnictwo Analiza Zmiennosci Charakterystyki Energetycznej na Przykladzie Budynku Wielorodzinnego; Wydawnictwo Politechniki Lubelskiej: Lublin, Poland, 2019; ISBN 978-83-7947-390-8. [Google Scholar]
Figure 1. Schematic view of the investigated building (red color—heated area, grey color—unheated basement).
Energies 15 05042 g001
Figure 2. Distribution of QH,nd and UEH for 2017 and 2021 technical specification.
Energies 15 05042 g002
Figure 3. Distribution of FEH and PEH for the 2017 and 2021 technical specifications.
Energies 15 05042 g003
Table 1. Boundary values of the overall heat transfer coefficients U according to [29].
Type of the PartitionValue of the Overall Heat Transfer
Coefficient U
W/(m2·K)
A GroupB Group
external walls0.230.20
flat-roof0.180.15
ceiling above the basement0.250.25
windows1.10.9
doors1.51.3
Table 2. Characteristics of the heating systems.
Variant SymbolVariant Description
v1individual, compact heating station with housing with nominal power up to 100 kW; heating with panel radiators with central and individual control, thermostatic valves with 1 K proportional band; heating from a local heat source, pipes well insulated in unheated space.
v2condensing gas boiler with a nominal power of up to 50 kW, operating parameters 70/55 °C; heating with panel radiators with central and individual control, thermostatic valves with proportional integration with adaptive and optimization function; heating from a local heat source, pipes well insulated in unheated space.
v3condensing gas boiler with a nominal power of up to 50 kW, operating parameters 55/45 °C; underfloor water heating with central and individual control with a proportional controller; individual gas boiler in each apartment (boiler located in the kitchen).
v4compressor ground/water heat pump, electrically driven—80% coverage; peak condensing gas boiler—20% coverage; operating parameters 55/45 °C; underfloor water heating with central and local control with a proportional controller; heating from a local heat source, pipes well insulated in the heated space.
v5biomass boiler, automatic, power of up to 100 kW; heating with panel radiators with central and individual control, thermostatic valves with proportional-integrating performance and adaptive and optimization function; heating from a local heat source (boiler room, common for all flats) in the basement of the building, pipes well insulated in unheated space.
v6condensing gas boiler with a nominal power of up to 50 kW, operating parameters 55/45 °C; heating with panel radiators with central and individual control, thermostatic valves with proportional-integrating performance as well as adaptive and optimization function; heating from a local heat source (boiler room, common for all flats), pipes well-insulated in the heated space.
v7absorption glycol/water heat pump, gas-powered—80% coverage; peak condensing gas boiler—20% coverage; operating parameters 55/45 °C; underfloor water heating with central and individual control with proportional-integrating controller; heating from a local heat source (boiler room, common for all flats), pipes well insulated in the heated space.
Table 3. Average seasonal efficiencies of the heating system, coefficients of non-renewable primary energy input and auxiliary electric energy input.
Variant
Symbol
Average Seasonal Efficiency ofCoefficient of the Non-Renewable Primary Energy
Input
Coefficient of Auxiliary Electric Energy
ProductionRegulationTransferTotalFinalPrimary
ηH,gηH,eηH,dηH,totwHkWh/(m2·a)
v10.980.890.900.7850.81.133.39
v20.910.930.900.7621.11.293.87
v30.940.891.000.8371.14.0612.18
v42.990.890.962.5552.625.0615.18
v50.700.930.900.5860.21.293.87
v60.940.930.960.8391.11.293.87
v71.310.890.961.1191.14.6613.98
Table 4. Descriptive statistics of QH,nd and UEH for the 2017 and 2021 technical specification.
Technical SpecificationsVariablenMinMeanMaxSD
2017QH,nd3238,97843,17149,1792488
2017UEH3246.3251.3058.442.96
2021QH,nd3234,59438,36943,7292220
2021UEH3241.1145.6051.972.64
Table 5. The linear models describing the dependence of QH,nd and UEH on set of predictors.
Dependent Variable
QH,ndUEHQH,ndUEH
20172021
(1)(2)(3)(4)
cardinal direction (N-S)−1930.75 ***−2.29 ***−1810.69 ***−2.15 ***
(166.04)(0.20)(157.64)(0.19)
glazing degree (P2)1986.63 ***2.36 ***1360.94 ***1.62 ***
(166.04)(0.20)(157.64)(0.19)
shadow effect (1)−1381.38 ***−1.64 ***−1202.69 ***−1.43 ***
(166.04)(0.20)(157.64)(0.19)
solar heat gain coefficient, g-value (0.64)−2868.13 ***−3.41 ***−2717.00 ***−3.23 ***
(234.82)(0.28)(222.94)(0.26)
solar heat gain coefficient, g-value (0.70)−4006.75 ***−4.76 ***−3585.50 ***−4.26 ***
(234.82)(0.28)(222.94)(0.26)
solar heat gain coefficient, g-value (0.75)−4919.63 ***−5.85 ***−4656.63 ***−5.53 ***
(234.82)(0.28)(222.94)(0.26)
constant46,782.50 ***55.59 ***41,935.09 ***49.83 ***
(219.65)(0.26)(208.54)(0.25)
Observations32323232
R20.970.970.970.97
Adjusted R20.960.960.960.96
Residual Std. Error (df = 25)469.630.56445.880.53
F Statistic (df = 6; 25)140.78 ***140.78 ***123.90 ***123.90 ***
Note: *** p < 0.01.
Table 6. Changes in energy demand expressed by QH,nd and UEH for the 2017 and 2021 technical specification.
FactorGain 1 for 2017 PolicyGain 1 for 2021 Policy
cardinal direction%4.37%4.61%
glazing degree%4.50%3.49%
shadow effect%3.15%3.09%
g-value%10.70%11.30%
1 The gain was calculated as proportion of change of energy demand to the maximum energy demand.
Table 7. Descriptive statistics of FEH and PEH for the 2017 and 2021 technical specification.
Technical_SpecificationsIndicator
[kWh/(m2∙a)]
nMinMeanMaxSD
2017FEH22423.1961.05101.0218.42
2017PEH22419.6862.5688.9918.74
2021FEH22421.253.8089.9716.03
2021PEH22417.9056.5080.4716.86
Table 8. The linear models describing the dependence of FEH and PEH on set of predictors.
Energy Indicator (Dependent Variable)
FEH PEH FEH PEH
2017 2021
cardinal direction (N-S) −2.61 *** −2.44 *** −2.41 *** −2.29 ***
(0.17) (0.15) (0.15) (0.14)
glazing degree (P2) 2.69 *** 2.51 *** 1.81 *** 1.72 ***
(0.17) (0.15) (0.15) (0.14)
shadow effect (1) −1.87 *** −1.74 *** −1.60 *** −1.52 ***
(0.17) (0.15) (0.15) (0.14)
g-value (0.64) −3.88 *** −3.62 *** −3.62 *** −3.43 ***
(0.24) (0.22) (0.21) (0.20)
g-value (0.70) −5.42 *** −5.06 *** −4.78 *** −4.53 ***
(0.24) (0.22) (0.21) (0.20)
g-value (0.75) −6.65 *** −6.21 *** −6.20 *** −5.88 ***
(0.24) (0.22) (0.21) (0.20)
heating system (v2) 2.13 *** 22.26 *** −3.45 *** 19.83 ***
(0.32) (0.29) (0.28) (0.26)
heating system (v3) −1.13 *** 23.93 *** −0.68 ** 22.25 ***
(0.32) (0.29) (0.28) (0.26)
heating system (v4) −41.34 *** 12.11 *** −36.31 *** 12.08 ***
(0.32) (0.29) (0.28) (0.26)
heating system (v5) 22.35 *** −34.29 *** 19.88 *** −30.43 ***
(0.32) (0.29) (0.28) (0.26)
heating system (v6) −4.05 *** 15.46 *** −3.58 *** 13.79 ***
(0.32) (0.29) (0.28) (0.26)
heating system (v7) −15.98 *** 8.74 *** −13.81 *** 8.94 ***
(0.32) (0.29) (0.28) (0.26)
Constant 71.37 *** 60.23 *** 63.96 *** 54.36 ***
(0.31) (0.28) (0.27) (0.25)
Observations 224 224 224 224
R2 1.00 1.00 1.00 1.00
Adjusted R2 1.00 1.00 1.00 1.00
Residual Std. Error (df = 211) 1.27 1.15 1.13 1.04
F Statistic (df = 12; 211) 3894.70 *** 4932.10 *** 3710.08 *** 4868.05 ***
Note: *** p < 0.01, ** p < 0.05.
Table 9. Changes in energy consumption expressed by FEH and PEH indices for the 2017 (A group) and 2021 (B group) technical specification.
FactorGain 1 of FEH for 2017 Policy
%
Gain 1 of FEH for 2021 Policy
%
Gain 1 of PEH for 2017 Policy
%
Gain 1 of PEH for 2021 Policy
%
cardinal direction4.194.3913.8213.97
glazing degree4.303.313.933.00
shadow effect3.012.932.752.65
g-value10.2010.809.379.81
heating system71.7071.0073.1073.00
1 The gain was calculated as proportion of change of energy consumption to the maximum energy consumption.
Table 10. Comparison of model parameters.
Effectsqu_2017qu_2021ue_2017ue_2021
cardinal_direction N-S−0.39−0.41−0.39−0.41
glazing_degree P20.410.310.410.31
shadow_effect1−0.28−0.28−0.28−0.28
g0.64−0.51−0.54−0.51−0.54
g0.7−0.71−0.71−0.71−0.71
g0.75−0.87−0.92−0.87−0.92
Publisher’s Note: MDPI stays neutral with regard to jurisdictional claims in published maps and institutional affiliations.

