1. Introduction
Under the situation of climate change, countries have formulated a variety of policies to protect the Earth’s environment. China first proposed a “carbon peak” plan before 2030 in the China-United States (US) Joint Declaration on Climate Change in 2014, and then issued the 14th Five-Year Plan (The 14th Five-Year Plan (2021–2025) is the first five-year plan to start a new journey of building comprehensive socialist modernization, setting the future direction of China’s development in 2021–2025) in 2020, which stressed the need to reduce carbon intensity and achieve the carbon peak at an early date. The carbon peak refers to the highest total net carbon emissions in China, with a reduction of total annual net carbon emissions starting from the carbon peak. As a novel form of environmental protection, the idea of carbon peak has been adopted by an increasing number of large-scale events and conferences, which calls for fuller research into how the carbon peak could be realized efficiently.
Primarily, the carbon peak can be achieved in three ways: improving carbon pricing mechanisms, developing negative emission technologies and developing clean energy technologies. Carbon pricing mechanisms consist of price and quantitative instruments. The former means changing the carbon tax price to influence the carbon emission behavior of industrial parks [
1], while the latter refers to the establishment of a carbon emission trading market, in which industrial parks trade carbon emission allowances to achieve emission and abatement cost reduction [
1,
2]. China, as the largest emitter of greenhouse gases in the world, launched its first national emissions-trading scheme (ETS) in July 2021. Mainly used to capture, treat and utilize carbon dioxide in the atmosphere, negative emission technologies can be roughly divided into two types. One is to increase ecological carbon sinks, using biological processes to absorb carbon from the air and store it in forests, soils, or wetlands. The other refers to the capture, storage, utilization, and conversion technologies of CO
2 which ultimately aim to reduce carbon content in the atmosphere [
3]. As for clean energy technologies, the development of clean energy can complement the energy gap resulting from carbon emission reduction, and then promote emission reduction in industrial parks [
4]. In terms of negative emission reduction technologies, however, it is easy to cause large errors owing to the large differences between each industrial park and the difficulty in measuring their development levels. Therefore, this research analyzes carbon pricing mechanisms and clean energy technologies from a provincial perspective in China.
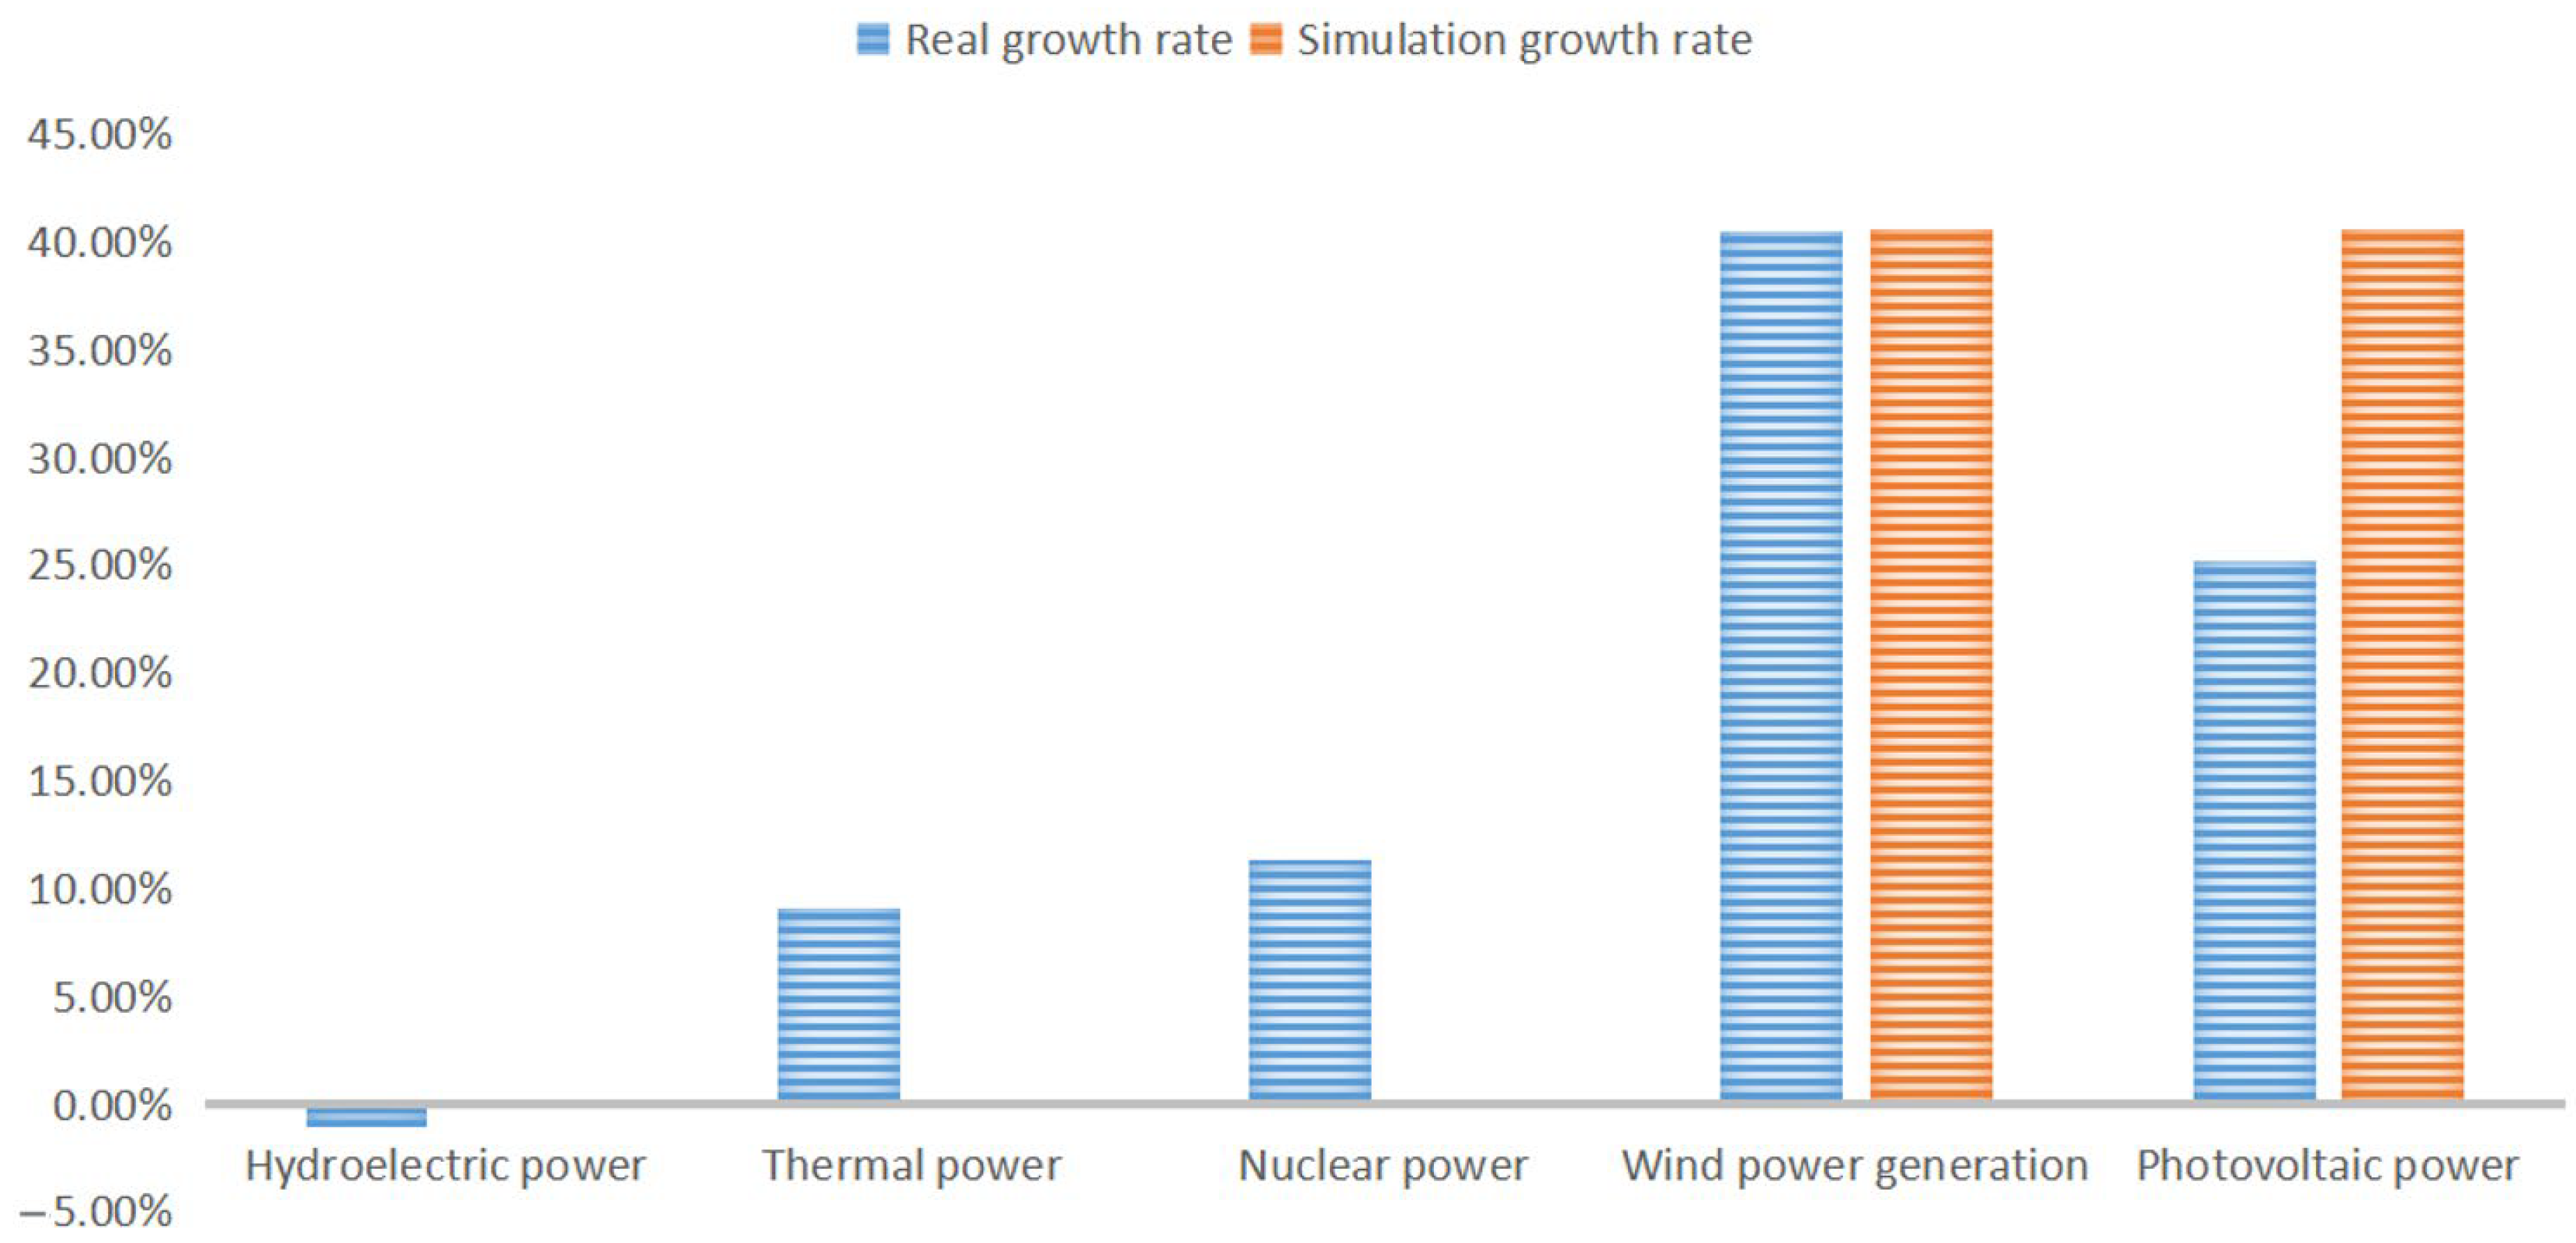
Currently, clean energy has four main types: nuclear, hydroelectric, wind, and photovoltaic (PV) power. According to the China Energy Statistics Yearbook, the nationwide growths of hydroelectric and nuclear power are gradually slowing down. The expansion of hydroelectric and nuclear power projects lead to more severe problems, which can cause streamflow reductions and drive an increase in environmentally-destructive mineral processing [
5]. In addition, increased resettlement problems, and a continuous increase in direct construction costs [
5], make it difficult to further develop both kinds of power. Therefore, this paper excludes both of these kinds of power and only considers the development of PV and wind energy.
However, studies on carbon peak have usually focused on a single realization path. The first path is to analyze energy distribution. Wei et al. used clean energy technologies and energy, economic, and environment (3E) analysis to obtain a route to clean energy production and distribution [
6], while Zou et al. discussed the importance of developing hydrogen energy in the process of carbon peak [
7]. The second path is the direct removal of CO
2 from the atmosphere through negative emission technologies, such as catalytic reduction, which can lead to carbon reduction [
8,
9,
10,
11]. In addition, the third path is to analyze carbon pricing mechanisms. Cui et al. established a marginal abatement cost (MAC) curve, by studying carbon pricing mechanisms, and investigated the importance of the carbon trading market for cost reduction [
1]. Nevertheless, the carbon peak is achieved by taking these three approaches jointly, indicating that studying one single approach is prone to cause certain errors in simulation. Carbon emission reduction will directly give rise to a decrease in total thermal power generation, which, in turn, will create a certain energy gap [
4] and make it necessary to fill the gap in China by developing clean energy. As for negative emission reduction technologies, it is relatively difficult to make estimations accurately considering the existence of technical factors, which may lead to large errors. Meanwhile, the two main ways to achieve the carbon peak in the 14th Five-Year Plan of China are to improve carbon pricing mechanisms and develop clean energy. In this paper, we take into account both carbon pricing mechanisms and the development of clean energy from the perspective of economics to make a more comprehensive analysis of the development and potential costs in achieving the carbon peak in China from 2021 to 2025.
China has a vast land area and abundant and diverse sources of clean energy, which is one of its most obvious advantages regarding achieving the carbon peak. However, the distribution of clean energy is not balanced in each province, thereby resulting in great differences in regional power grid structures [
9]. For instance, due to the dry climate and the long duration of sunshine days, north and northwest regions, like Xinjiang Province, have plenty of solar energy. According to the forecast of Shen et al. [
12], the proportion of solar power in north and northwest power grids will increase by about 10% by 2030, compared with that in 2015, in the case of full exploitation. Sea wind in the eastern region and inland wind in the northwest region are both very strong, thus resulting in the contribution of wind power to cleaner local power structures [
12]. In addition, different levels of economic development in different regions also lead to great gaps in carbon intensity. Regions with high carbon intensity have relatively poor economic development, mainly in western China, whereas those with low carbon intensity have relatively developed economies, mainly in the eastern coastal regions of China [
13,
14]. Multiple factors lead to the heterogeneity of abatement costs in different provinces.
The contributions of this study are in three main areas. Firstly, a novel MAC curve was proposed by taking a bottom-up modeling approach and combining it with the indicator method to simulate carbon trading. Secondly, a method to estimate total carbon emission reduction is proposed and further discussed in the context of the carbon emission reduction market and energy development. Thirdly, the relationship between carbon emission and energy trading markets was constructed, helping to better analyze the achievement scheme of the carbon peak.
The structure of this paper is organized as follows.
Section 2 introduces preparation work before modeling, including data acquisition, future forecasting, and carbon emission allowance allocation.
Section 3 models the carbon abatement cost of enterprises through a bottom-up modeling approach and analyzes the impact on carbon abatement cost in the context of carbon emission allowance trading and clean energy development.
Section 4 analyzes the results and proposes the impact of clean energy development during the 14th Five-Year Plan period.
Section 5 presents the sensitivity analyses of modeling approaches and comparison of energy development in 2021.
Section 6 summarizes the findings and concludes the development trend of carbon peak achievement during the 14th Five-Year Plan period.
2. Model Preparation
The current research on sustainable development mainly uses general equilibrium models and focuses on the energy and power sectors to make predictions [
15,
16]. In addition, another direction of research on the “circular economy” is to analyze future sustainable development by incorporating environmental, social and governance (ESG) performance into decision making [
17,
18]. However, current research lacks an approach to find the optimal development scenario for a country by combining economic policies, demographic changes, energy development and trading markets.
In the analysis of the carbon peak achievement scheme, it can be surmised that the scheme was constructed from two parts, namely the carbon trading market, and the energy development and trading market. In the carbon trading market, this study sums up the difference between the buying and selling amounts of all key carbon emission enterprises in provinces as the amount of carbon trading to simulate and analyze the carbon trading situation from an inter-provincial perspective.
However, the carbon trading market alone cannot meet all the needs to successfully achieve the carbon peak before 2030 and realize sustainable economic development. In the meantime, carbon reduction will create a large energy gap, leading to a large demand for clean energy. In the clean energy development and energy trading part, it is assumed that each province will fill the power gap with wind and PV power, due to their relatively short construction periods and low costs in comparison with hydroelectric and nuclear power.
The variables used in equations are shown in
Table 1, including parameters, symbols, and variable explanations. The general structure is shown in
Figure 1.
2.1. Construction and Prediction of the Dataset
In this section, the dataset construction and prediction were performed. For the data prediction, the data for 2015–2020 were taken as historical data and then combined with policies and future development assessments in China to forecast the development status of 2021–2030 under natural growth and policy regulation scenarios.
Three categories of indicators were set. The first was the basic indicator, including GDP, population and the input-output table in China, derived from the China Statistical Yearbook 2021 [
19]. The second was the energy indicator: the amount of different clean energy power generation and the total thermal power generation in each province, which was extracted from the China Energy Statistical Yearbook 2021 [
20]. The third was the environmental indicator, such as CO
2 emissions from the Carbon Emission Accounts and Databases (CEADs) that were used to calibrate China’s national emissions from 2015 to 2018 [
21].
From GDP growth rate, combined with the forecast of China’s National Development and Reform Commission [
22], it was deduced that China’s GDP growth rate will be 5.5% during the 14th Five-Year Plan period and will fall back to 4.5% over 2026–2030. Moreover, from the 14th Five-Year Plan and the outline of the 2035 Vision, compared to 2020, it was deduced that carbon emission intensity will be reduced by 18% from 2021 to 2025, and China’s carbon intensity will be 65% lower by 2030 than in 2005 [
23]. The data projections were divided into two categories: natural growth and policy regulation. In the first category, all types of energy grow naturally according to historical growth rate (2015–2020) and GDP growth rate. The carbon emission growth rate from 2019 to 2030 was based on the carbon emission growth rate from 2015 to 2018. In the second category, total carbon emissions were obtained by the multiplication of carbon intensity and GDP, and clean energy growth was considered only for wind and PV development. The relevant simulation data are shown in
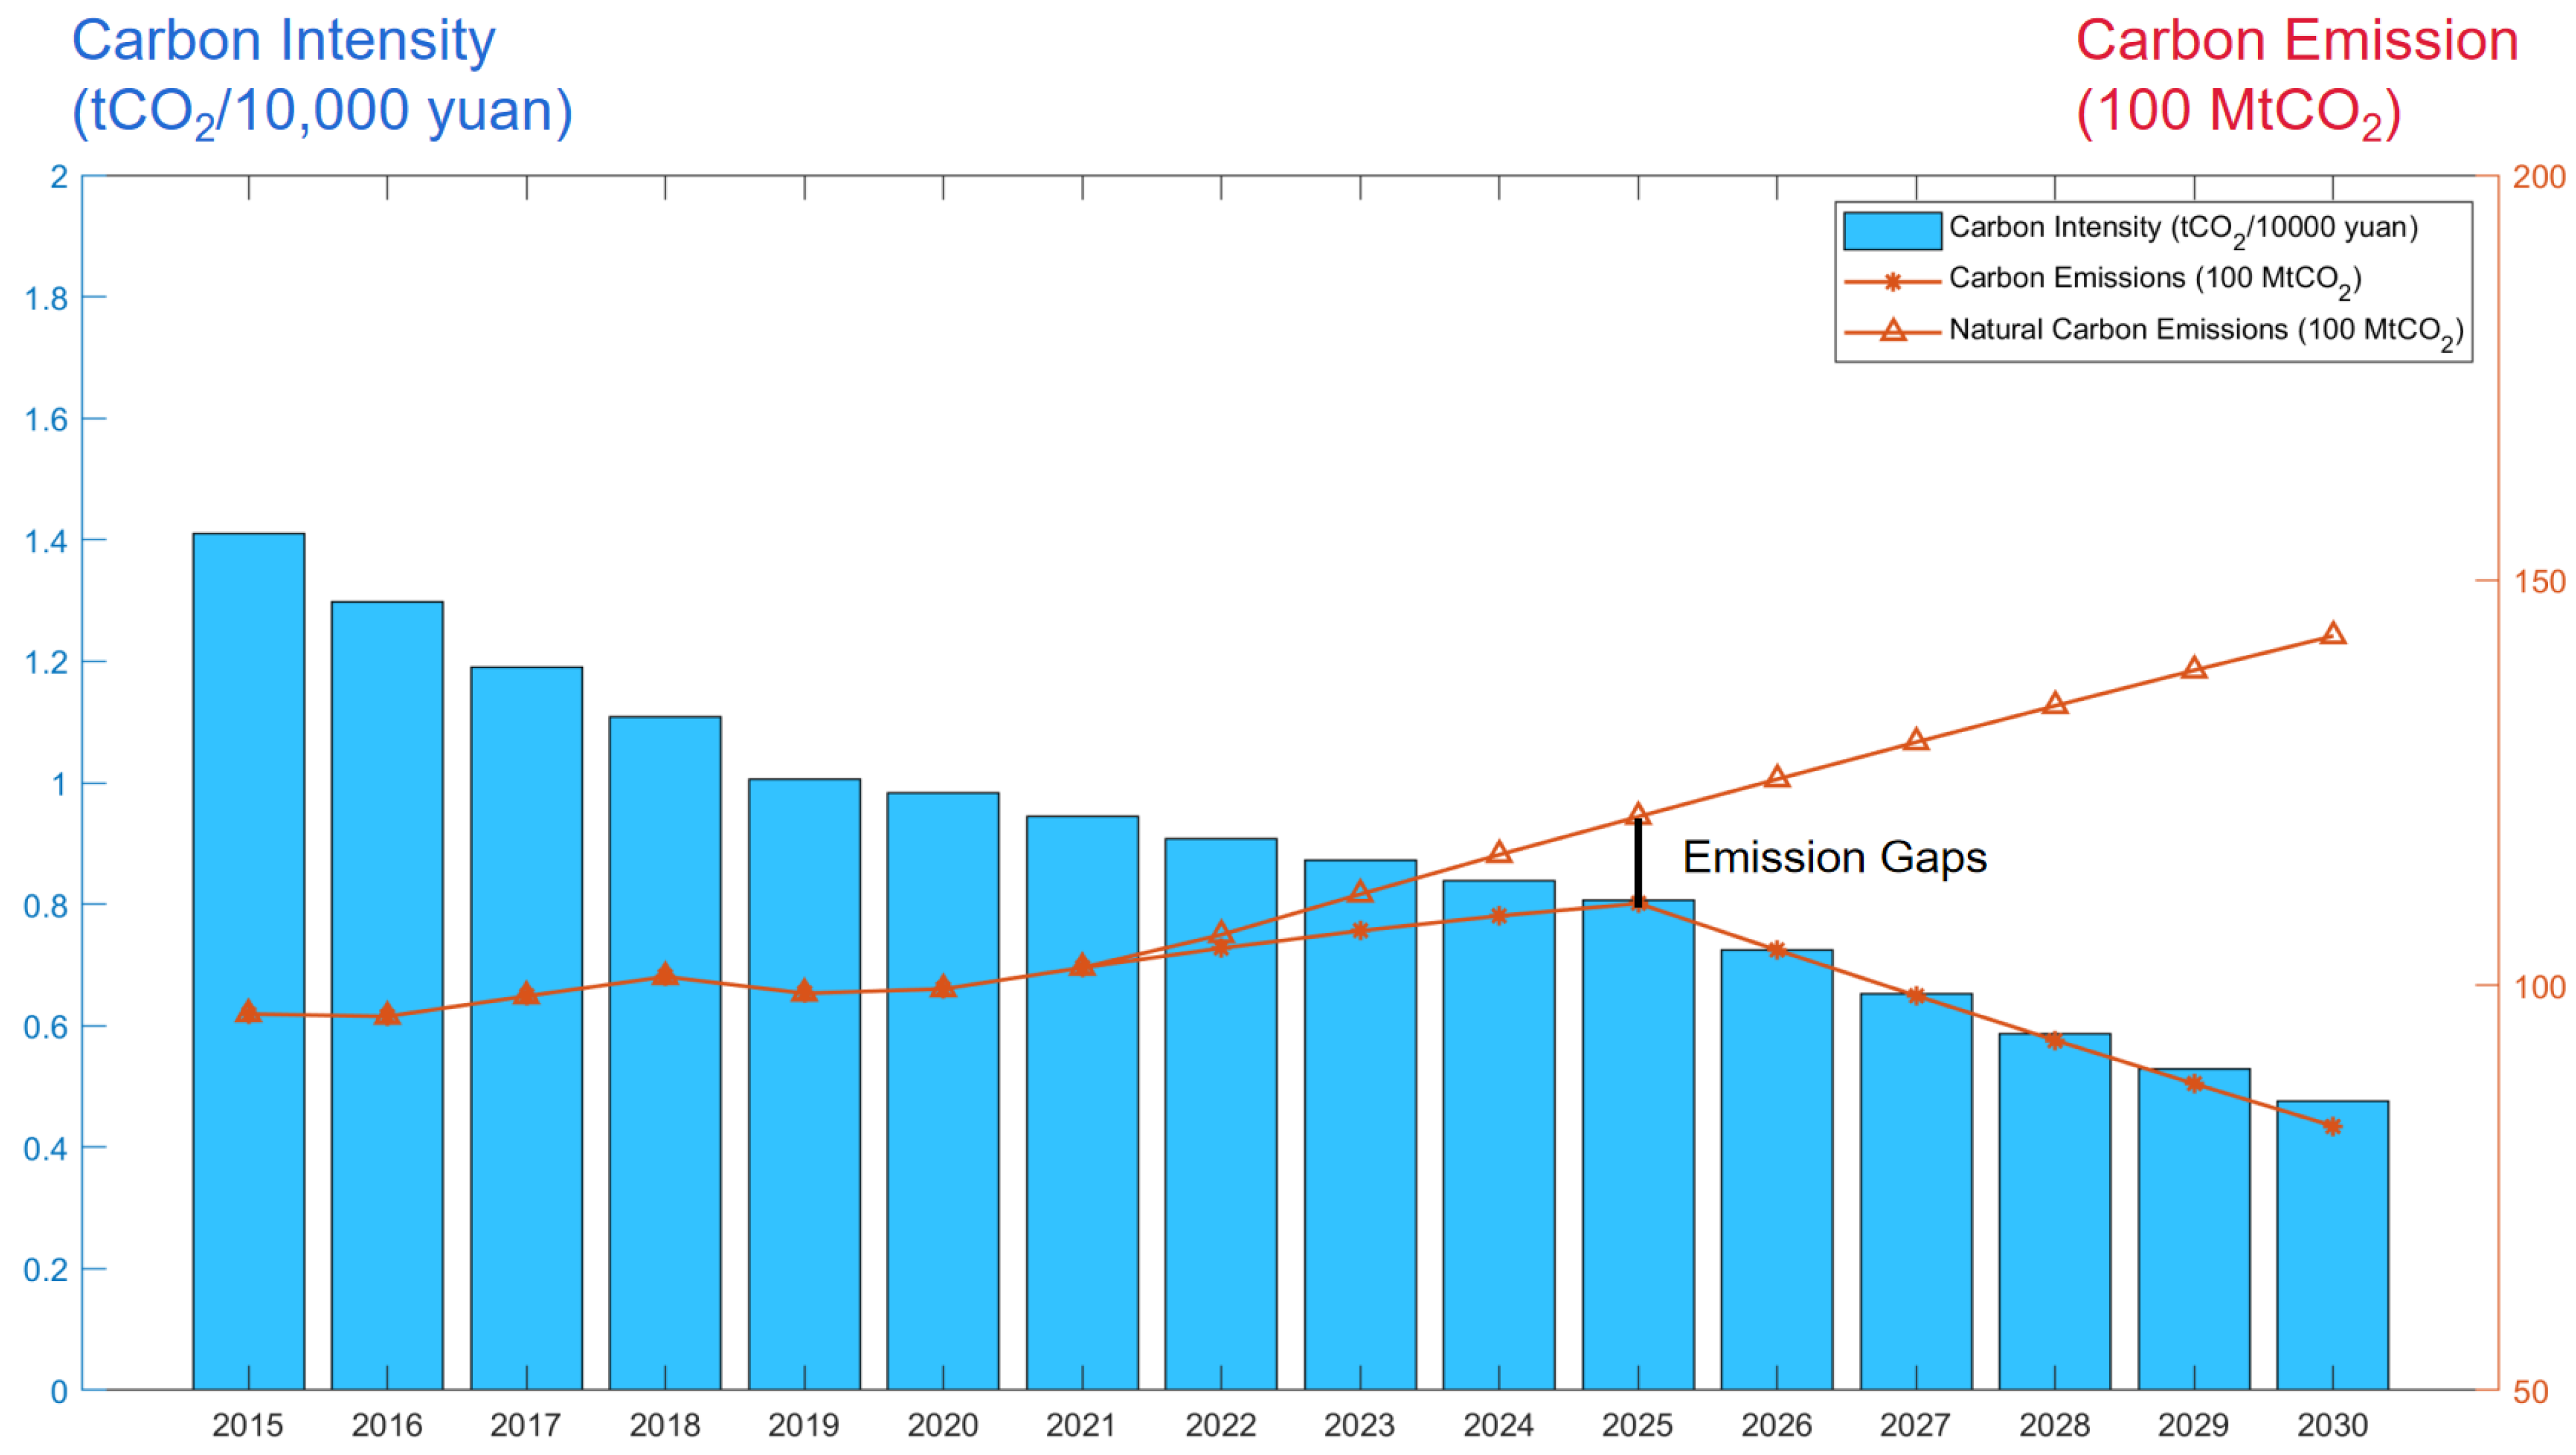
Table 2. In addition, the trend from 2021 to 2030 was forecast to obtain the emission gap in
Figure 2. The inter-provincial data is discussed in
Section 2.3.
In
Figure 2, carbon intensity corresponds to the left
y-axis, while carbon emission corresponds to the right
y-axis. It shows that the period of 2019–2020 featured relatively lower carbon emissions and lower GDP due to the COVID-19 outbreak. It can also be seen that China’s GDP is growing steadily, while the growth rate of carbon intensity and carbon emission is reducing year by year.
Carbon peak refers to the highest total net carbon emissions in China, with the reduction of total annual net carbon emissions starting from the carbon peak, and we found that China will reach the carbon peak by 2025. Additionally, it was found that China’s total carbon emissions could reach 12,080.6 million tons under natural growth by 2025. In contrast, total carbon emissions were supposed to reach 11,008.4 million tons in 2025, at which point the total carbon emission gap would create 1072.2 million tons. Since the carbon emission gap is equivalent to an energy gap, it is necessary to adopt clean energy to fill this energy gap caused by declining carbon emissions. Under the influence of the policy, wind and PV could reach an average growth rate of 40.6% during the 14th Five-Year Plan period, and the relevant sensitivity analysis is discussed in
Section 5. Thus, clean energy development and the energy trading market should be introduced to reconcile the energy gap.
This prediction is reasonable for two reasons. First, China will achieve the carbon peak in 2025, which coincides with the fact that China is committed to reaching maximum carbon emissions before 2030. Second, China’s 14th Five-Year Plan and the Vision 2035 outline provide that China will actively develop clean energy and vigorously promote the development of wind and photovoltaic power generation industries. As a result, carbon emission intensity would decrease year by year [
23].
2.2. Carbon Emission Allowance Allocation
Carbon emission allowance is a permit issued by the country to key carbon-emitting industrial parks. This means that the industrial park must emit carbon dioxide within the specified emission requirements. If an industrial park emits more carbon dioxide than it should, it will be fined if it does not purchase carbon emission allowances. Therefore, we considered carbon emissions from all industrial parks as being major carbon emissions.
In accordance with the “Implementation Plan for Setting and Allocating the Total Amount of National Carbon Emission Trading Quotas for 2019–2020 (Power Generation Industry)”, the amount of carbon emission allowances for each industrial park is up to its type of generating units, which can be classified as conventional coal-fired units of 300 MW class or above, 300 MW class or below, non-conventional coal-fired units, such as coal gangue and coal and water-coal slurry (including coal-fired circulating fluidized bed units), and gas-fired units. However, relevant information has remained imperfect since the initial establishment of the Chinese carbon trading market, making it difficult to accurately obtain detailed data on industrial parks in each province. As a result, existing major carbon emission allowance allocation methods are under investigation to find a better allocation method. Main carbon emission allowance allocation methods include the following three types:
- (1)
Indicator method. This method uses certain indicators as references in the case of allocating carbon emission allowances, including population, per capita carbon emissions, GDP, etc. [
24,
25,
26]. Carbon emission allowances are allocated through indicators to promote the reduction of emissions by each enterprise by carbon emission quotas, which, in turn, promotes the fairness and efficiency of the carbon emission trading market.
- (2)
Optimization method. Through the optimized data envelopment analysis (DEA) model, the allocation of carbon emission allowances is further analyzed and discussed by considering various time and geographical factors [
27,
28], which is of help to find a more fair and efficient method of allocating carbon emission allowances.
- (3)
Game method. The policy of carbon allowances is analyzed based on a game theory model, and different variables combined to study carbon allowance allocation strategies under different scenarios [
29,
30] to come up with a better solution.
Regarding the optimization method, targeting a variety of factors is often a necessity. In this study, it was difficult to achieve good optimization because some variables were hard to predict. As for the game method, it was necessary to consider different strategies and find the optimal one constituting an equilibrium. However, the number of provinces was too large and the impact of different policies was even more difficult to estimate.
Thus, the indicator method was used for the allocation of carbon emission allowances in this model. GDP reflects the living standards of people, while population reflects the overall ability to release or reduce carbon emissions [
25]. Therefore, the simulation data were combined to use GDP and population in each province to allocate carbon allowances.
2.3. Determination of Provincial Indicators
Regarding the growth rate of population, the data from the China Statistical Yearbook were combined [
19], and a natural growth rate of 1% was considered for the population in each province. With regards to carbon emission and energy indicators, the indicator method was employed to determine the emission allocation and energy growth rate of each province. Specific determination is discussed in detail in
Section 3.2 and
Section 3.3.
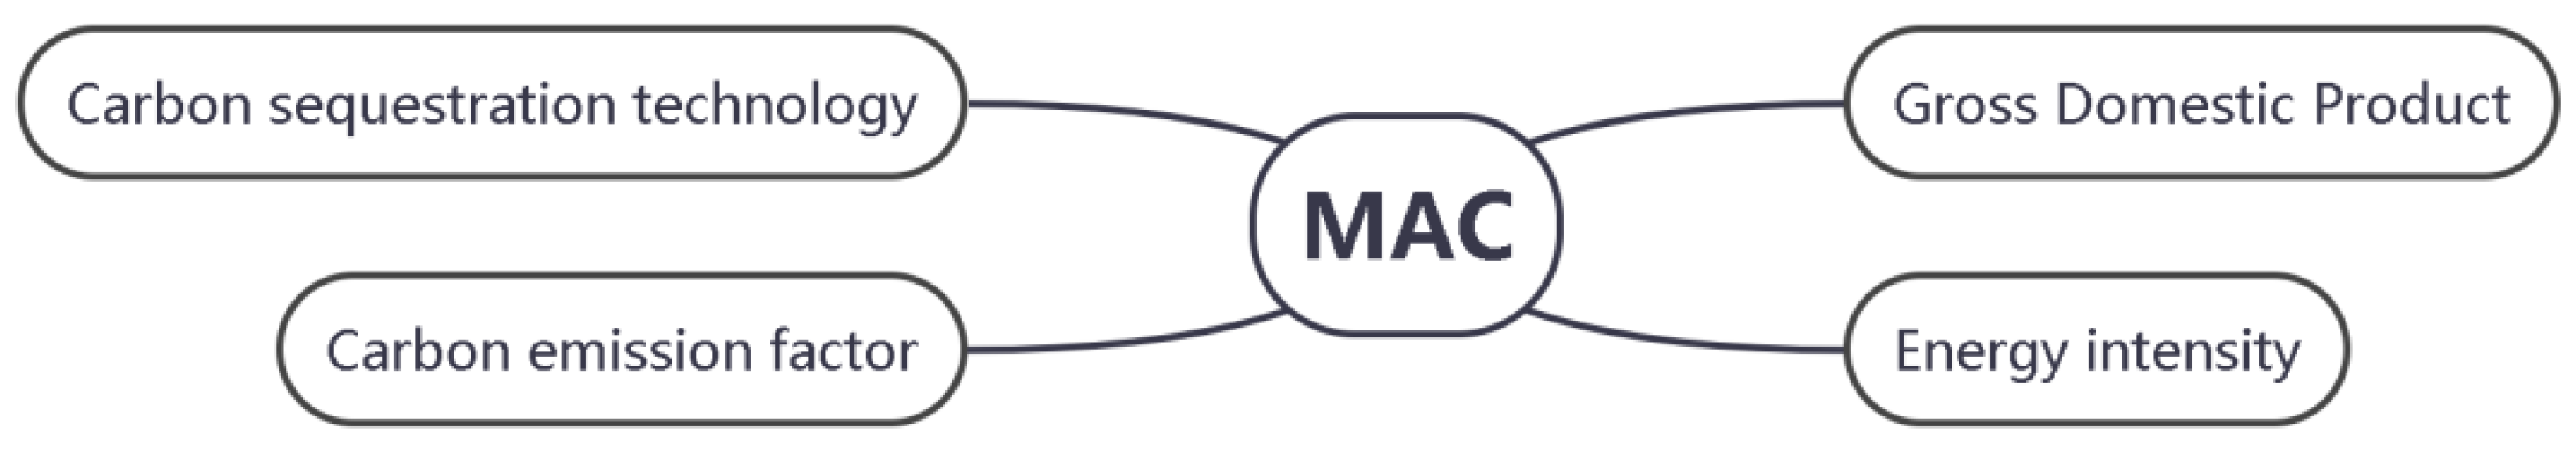
2.4. Marginal Abatement Cost Curve
The marginal abatement cost (MAC) curve, as a commonly used policy tool, is widely used to indicate abatement potential and associated abatement costs. Constructing an MAC curve can be used to analyze a range of environmental issues in different countries and is increasingly being applied to climate change policies [
31,
32,
33]. The MAC curve represents the unit cost for a unit of carbon emission reduction at different total amounts of emission, which means it can be used to measure the total cost of carbon reduction. In addition, for the purpose of establishing a carbon emission trading market in China, the unit price of carbon emission rights needs to be determined, which is equal to MAC, since enterprises always maximize their profits [
34].
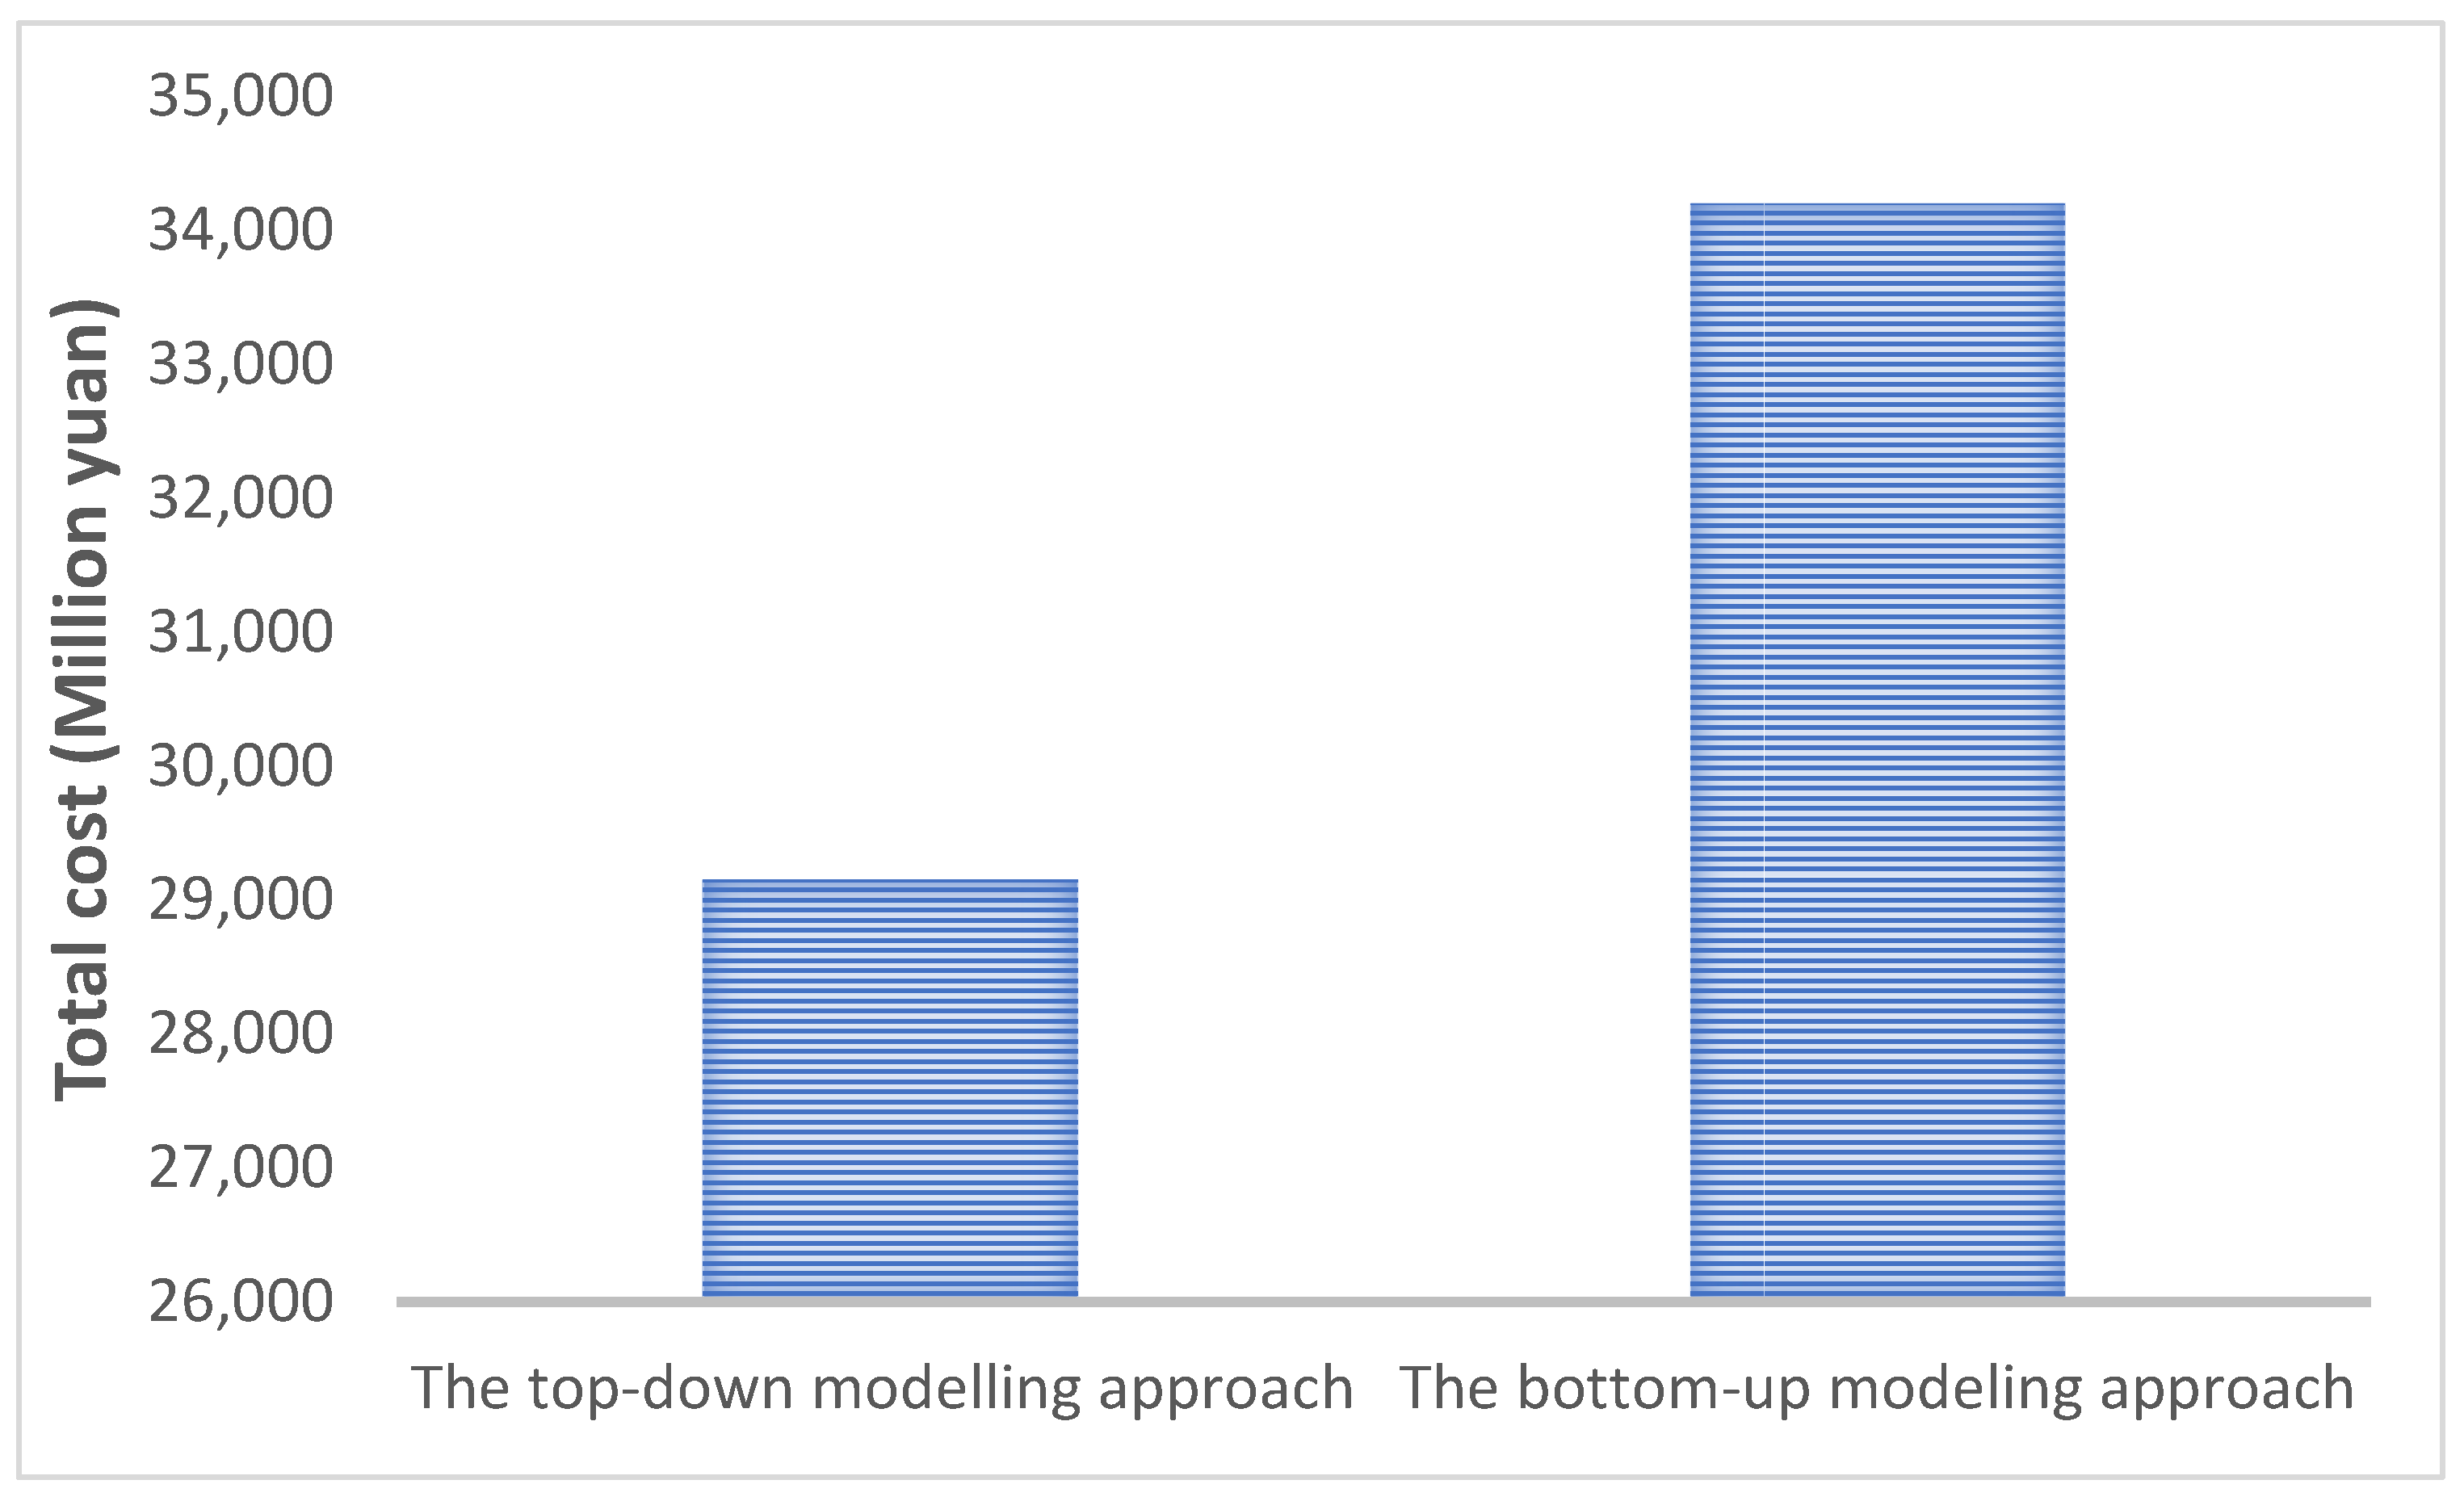
Two main approaches can be taken to determine the MAC curve. The first one is the bottom-up modeling approach, which estimates the aggregate MAC curve by collecting detailed information on abatement technologies and solving an optimization problem [
28,
29]. The second one is the top-down modeling approach that analyzes abatement cost from a macroeconomic perspective to derive the MAC curve of a country [
1,
30]. Since it analyzes unit abatement costs using carbon tax from a macro perspective, the top-down modeling approach causes some errors, due to incomplete information on the complexity of the economic system. The bottom-up modeling approach, on the other hand, could be adopted to obtain the MAC curve more precisely with detailed abatement data. Hence, the bottom-up modeling approach was taken in this model to derive the MAC curves of countries. The top-down modeling approach is also discussed later in the sensitivity analysis part.
4. Result
4.1. National Carbon Emission Trading Market
To achieve the target of reducing carbon intensity by 18% in the 14th Five-Year Plan, industrial parks in each province of China would need to reduce carbon emissions by 1072.2 MtCO2 by 2025 according to our estimation.
First, a simulation without a carbon emission trading market was conducted based on the indicator method. Then, a national carbon emission trading market was introduced to more efficiently achieve the total amount of emission reduction. With a carbon trading market, industrial parks in each province could freely trade carbon emission allowances to increase the efficiency of the market. The simulation results are shown in
Table 4.
In this carbon trading simulation, all the provinces had an incentive to buy or sell carbon allowances in equilibrium, and the unit price of carbon was US
$8.18/ton. However, according to the analysis of Zhang, that of carbon trading should be higher than US
$10/ton during the 14th Five-Year Plan period [
11]. In addition, the latest price of carbon allowances, traded as of 6 December 2021, is US
$6.35 [
36] in the national carbon emission market of China. Since China is still at the early stage of the 14th Five-Year Plan, unit abatement costs would increase at an accelerated rate with increase of the total amount of carbon emission reduction, according to the MAC curve. Therefore, a certain error existed between the current trading price and the estimated value.
The results show that the cost of emission reduction in all provinces has been reduced to varying degrees after the introduction of the national carbon emission trading market, with a total cost reduction of 32.75%. In carbon emission allowance trading, Jiangsu, Guangdong, and Shandong needed to buy carbon emission allowances of 40.76, 38.70, and 28.48 Mt, respectively, while Inner Mongolia, Shanxi, and Hebei needed to sell carbon emission allowances of 110.28, 50.60 and 46.66 Mt, respectively. Combined with the MAC curve, the main reason was that provinces like Hebei and Inner Mongolia have larger total carbon emissions with lower unit abatement costs, making it easier to sell carbon emission allowances. For those provinces like Qinghai and Sichuan, with relatively smaller total carbon emissions and higher unit denomination costs, however, it was more efficient to buy carbon emission allowances. Moreover, the cost of emission reduction in all provinces was reduced to some extent after the introduction of the carbon emission trading market. In this simulation, the total cost of emission reduction was 34,195.40 million yuan, and the total saving was 16,649.69 million yuan, which was an economically significant number.
4.2. Clean Energy Development
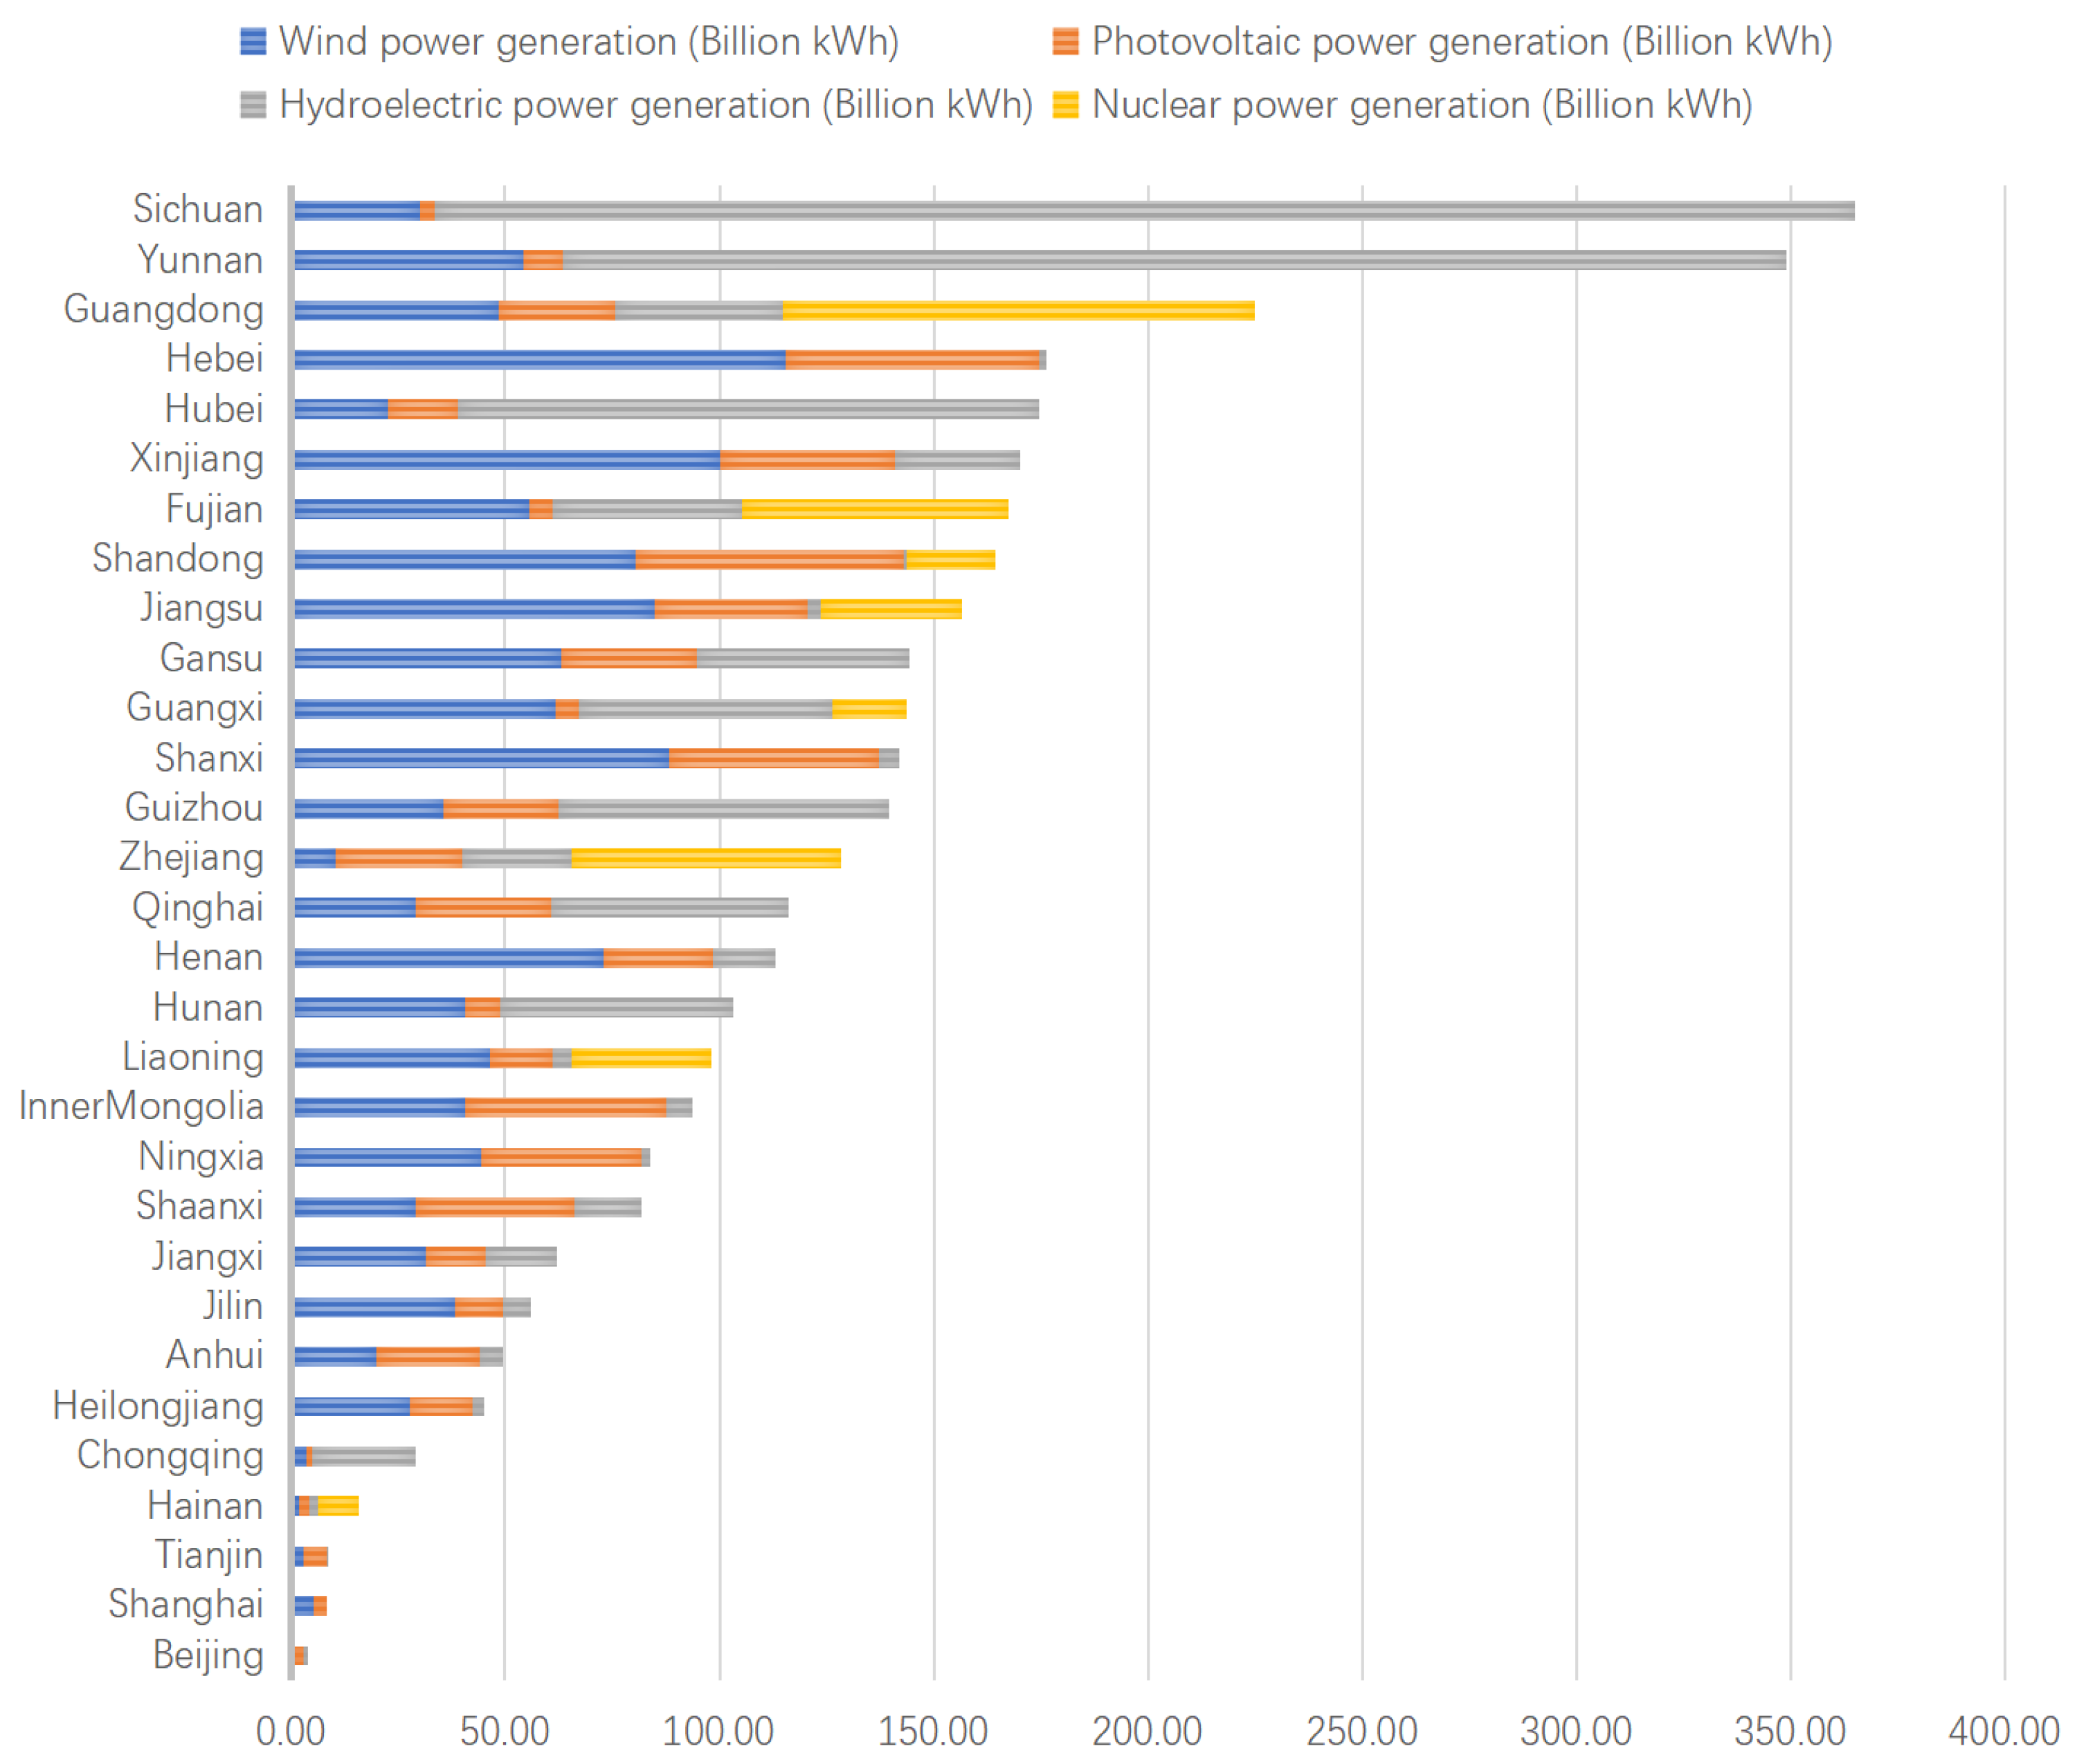
China is also promoting the development and construction of clean energy to achieve the goal of a carbon peak as early as possible. The projected structure of clean energy in 2025 was taken as the development status of carbon peak clean energy, which is shown in
Figure 5.
It was found that wind and PV could grow at an average rate of 40.6% in each year during the 14th Five-Year Plan period. By 2025, the total amount of clean electricity would reach 3600 billion kWh. Among the 30 provinces in China, Sichuan, Yunnan and Guangdong were about to have higher total clean energy generation in 2025, with total clean power exceeding 200 billion kWh. Particularly noticeable was Sichuan, which would have total clean power of over 350 billion kWh. The large proportion of nuclear and hydroelectric power was the main reason for the high total clean energy generation in Sichuan, Yunnan, and Guangdong provinces.
For those generating less clean electricity, like Beijing and Shanghai, PV and wind power would be the most dominant forms of clean energy generation. The main reason is believed to be the heavy reliance of nuclear and hydroelectric power on geographical factors, construction cycles, and other aspects, which are difficult to change in a short period. For some provinces, PV and wind power would be the only way to develop clean energy.
Regarding the currently slowing development of hydroelectric and nuclear power generation, the further development of PV and wind power would need to be more emphasized in the future.
As a result, the proportion of various types of clean energy in China would further change. Provinces dominated by nuclear and hydroelectric power would gradually decrease their shares in the national total of clean energy, while those dominated by PV and wind power, such as Inner Mongolia, Xinjiang, and Hebei, would gradually increase.
4.3. Energy Trading Market
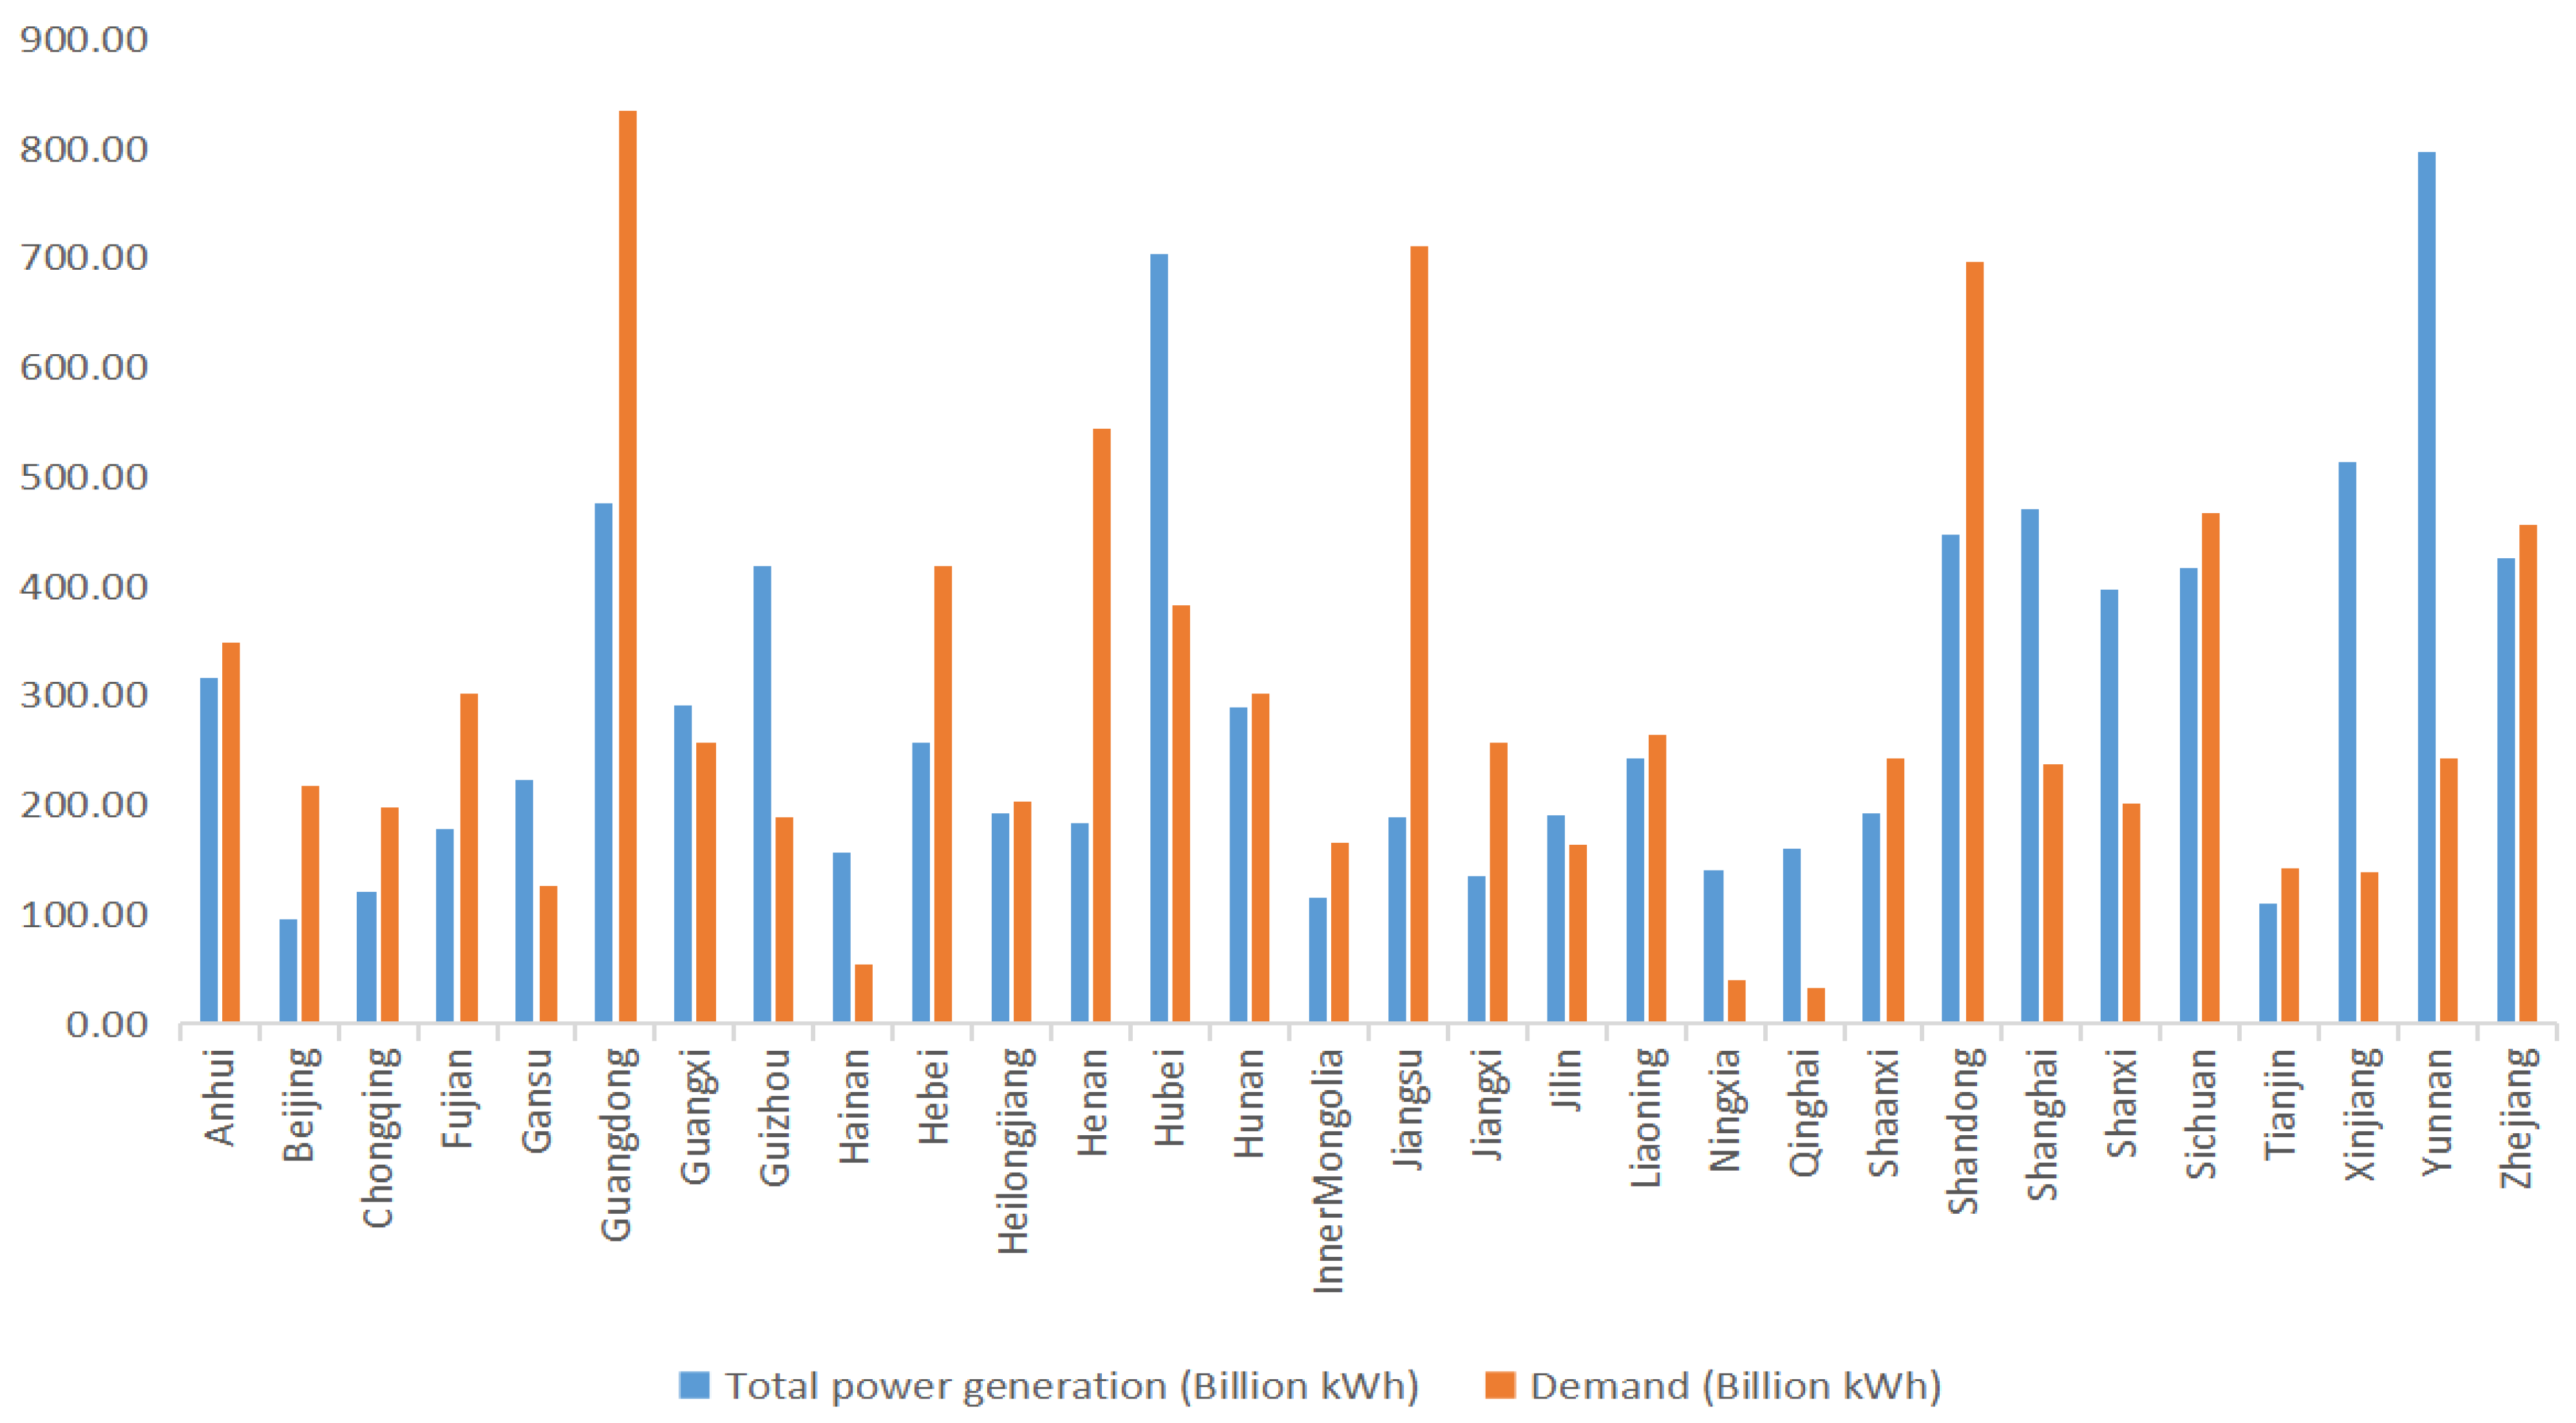
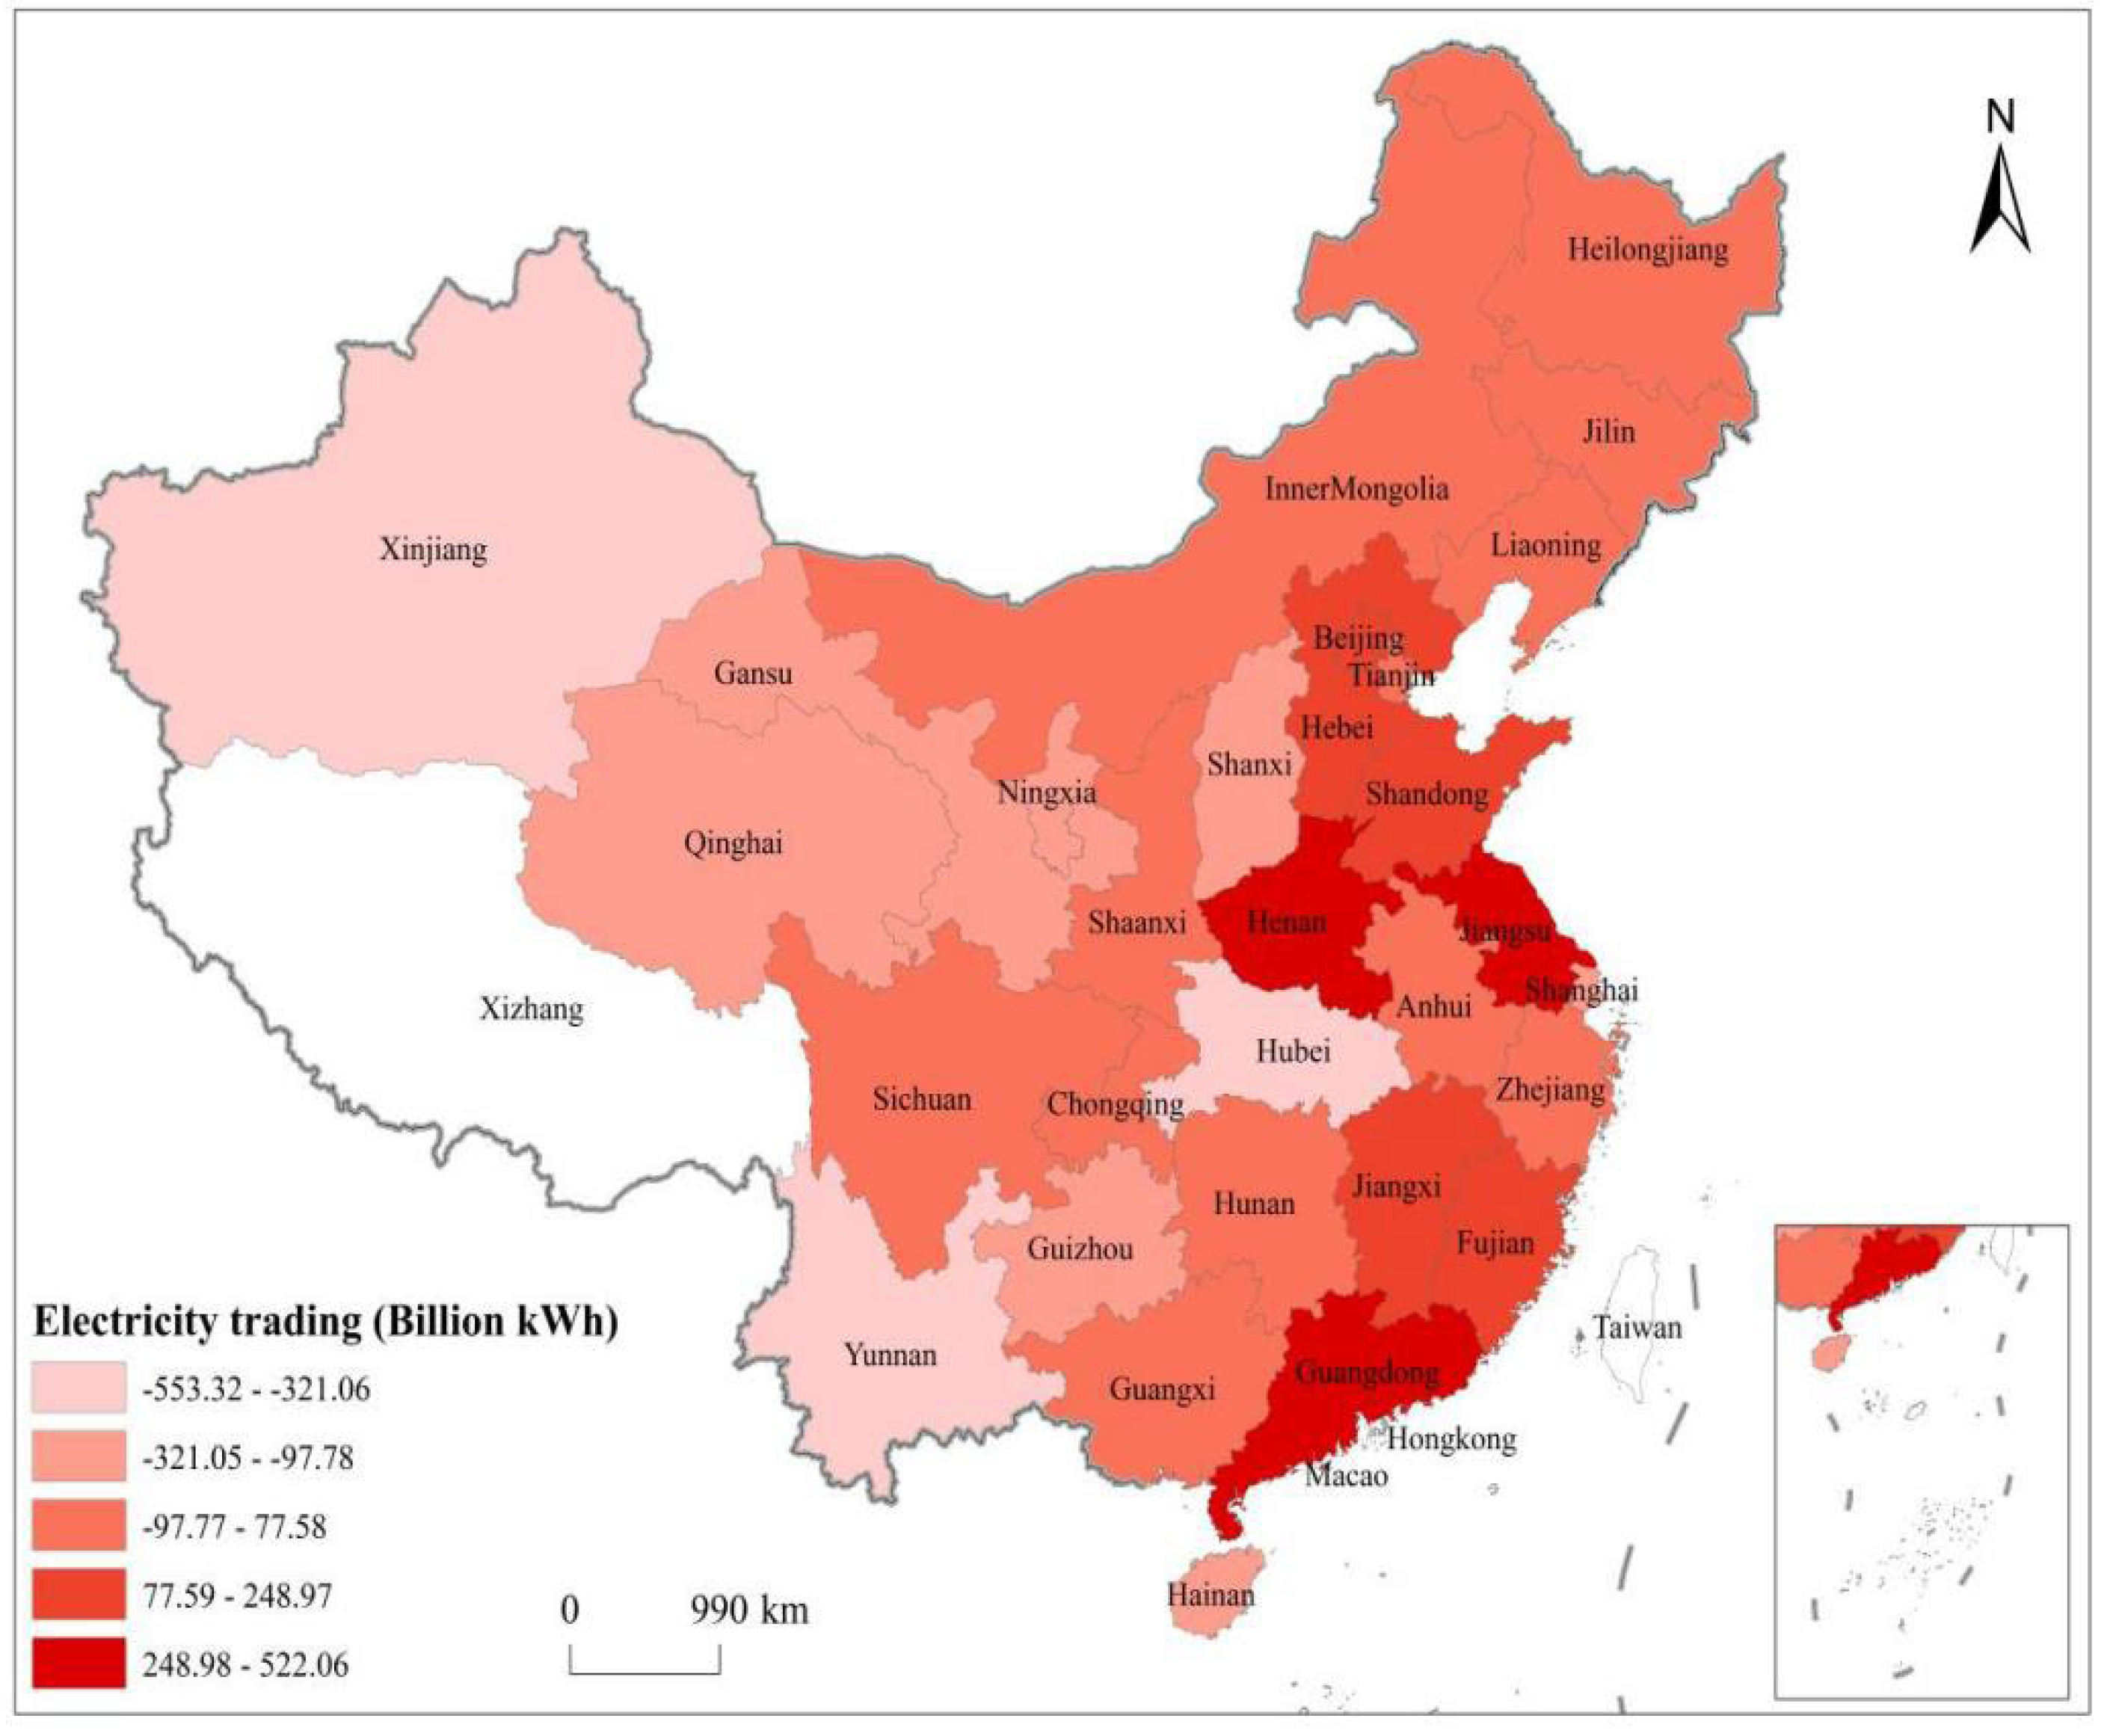
Combined with the above simulation results, it was found that the level of total power generation in each province itself was different from that of actual electricity demand, which also led to the difference between total power generation and the actual demand for electricity in each province, as shown in
Figure 6. Then we introduced the energy trading market, and the energy trading results are shown in
Figure 7.
It was noticed that Guangdong, Jiangsu, and Shandong had the highest energy demand of 835, 710, and 696 billion kWh, respectively, whereas Hainan, Ningxia, and Qinghai had the lowest energy demand of 54, 40, and 33 billion kWh, respectively.
According to the results in
Table 5, the combination of the simulation was reasonable for two main reasons. First, the energy demand structure of provinces in China was roughly the same according to the 2020 China Statistical Yearbook. Second, the results of this study were similar to those of Zhou et al. for the structure of energy consumption by Chinese provinces from 2009 to 2012 [
37], so were, thus, believed to be reasonably robust. Moreover, Jiangsu, Henan, Guangdong, and Shandong had large energy deficits and needed to buy 522, 360, and 360 billion kWh of electricity, respectively, while Yunnan, Xinjiang, and Hubei generated substantially more electricity than their demand and could sell 553, 375 and 321 billion kWh of electricity, respectively.
In the energy trading market, some interesting findings were derived. It was found that provinces buying clean power were mainly in the southern and eastern regions of China, such as Jiangsu, Henan, Guangdong, Shandong, Hebei, Fujian, and Jiangxi. This was mainly because the total amount of electricity generated in these provinces failed to meet their electricity consumption, resulting in a large shortage of power and, hence, the need to buy large amounts of energy. Provinces selling energy were mainly in the western and central regions of China, such as Yunnan, Xinjiang, and Hubei. The overall situation was consistent with the requirement of the 14th Five-Year Plan to deliver electricity from west to east and north to south, which is commonly known as west-east and north-south power transmission.
However, some anomalies still existed. Shanghai, which is geographically located in the east of China, and Hainan, which is in the south, were still selling a lot of electricity. It is believed that this was because thermal power generation would still be the main form of power generation in China at this time. Although the share of clean power in Shanghai and Hainan was only 1.05% and 9.09% respectively, their high thermal power generation would make it possible for them to supply power above the demand and still sell power to other provinces.
6. Conclusions and Discussion
Some important findings were obtained from the numerical simulation. First, according to the estimation, carbon emissions in China will grow to 12.081 and 14.385 billion tons in 2025 and 2030, respectively, if the existing development pattern is kept unchanged. With the target of policies related to the carbon peak, carbon emissions will peak at 11.0084 billion tons in 2025 and decrease to 8.261 billion tons in 2030. Achieving carbon peaking in 2025 requires a reduction of 1.072 million tons of carbon emissions, and carbon emission intensity will be reduced by 18.04% from 2021 to 2025 and 40.1% from 2025 to 2030. In addition, the cost of emission reduction was reduced by 32.75% through the carbon emission trading market compared with what it would be without a national carbon market.
Second, in terms of carbon emission allowance trading, Jiangsu, Guangdong, and Shandong needed to buy carbon emission allowances of 40.76, 38.70, and 28.48 Mt, respectively, while Inner Mongolia, Shanxi, and Hebei needed to sell carbon emission allowances of 110.28, 50.60 and 46.66 Mt, respectively. Combined with the MAC curve, the main reason is that provinces like Hebei and Inner Mongolia have larger total carbon emissions and lower MAC, making it easier to sell carbon emission allowances. For provinces like Qinghai and Sichuan with smaller total carbon emissions and higher MAC, however, it is more efficient to buy carbon emission allowances. The result is quite insightful, which contributes to understanding the importance and urgency of introducing a nationwide carbon market. Compared with other advanced economies. like the Europe Union starting to establish EU-ETS covering 25 member countries in 2005, the China Carbon Emission Trade Exchange (CCETE) will certainly learn from these lessons and provide a market-based mechanism for carbon trading, thus greatly advancing green and sustainable development
Third, it was found that the total amount of clean electricity will reach 3600 billion kWh in 2025. Among the 30 provinces, Sichuan, Yunnan, and Guangdong will have higher total clean energy generation in 2025, with total clean power exceeding 200 billion kWh. The proportion of nuclear and hydroelectric power is the main reason for the high total clean energy generation in Sichuan, Yunnan, and Guangdong provinces. It is believed that the proportion of clean energy in China will further increase in the future with the further development of PV and wind power. Besides, the proportion of various types of clean energy in China will further change. Provinces dominated by nuclear and hydroelectric power will gradually decrease their shares in the national total of clean energy, while those dominated by PV and wind power, such as Inner Mongolia, Xinjiang, and Hebei, will gradually increase.
Fourth, it was also found that Guangdong, Jiangsu, and Shandong have the highest energy demand in the electricity trading market in 2025, with 835, 710, and 696 billion kWh, respectively. Hainan, Ningxia, and Qinghai have the lowest energy demand of 54, 40, and 33 billion kWh, respectively. In addition, Jiangsu, Henan, Guangdong, and Shandong have a large energy shortage and need to buy 522, 360, and 360 billion kWh of electricity, respectively. In the current situation, the energy gap is likely to continue to grow and the demand for cross-province transmission will continue to increase, which will also be the direction of future research.
This paper explores a feasible approach to achieve carbon peaking in China by 2025 under three hypotheses. Combined with the dataset and the introduction of carbon emission and energy trading markets, the future development trend of China was better simulated. Future research will study in more detail the future development of clean energy structure in each province, the trading of different electricity markets and different paths to achieve the carbon peak in China under different policies.


