Article

Thermal Comfort—Case Study in a Lightweight Passive House

by
Krzysztof Wąs
*,
Jan Radoń
and
Agnieszka Sadłowska-Sałęga
Department of Rural Building, Faculty of Environmental Engineering, University of Agriculture in Krakow, 30-059 Krakow, Poland
*
Author to whom correspondence should be addressed.
Energies 2022, 15(13), 4687; https://doi.org/10.3390/en15134687
Submission received: 26 May 2022 / Revised: 19 June 2022 / Accepted: 24 June 2022 / Published: 26 June 2022
(This article belongs to the Special Issue Internal Environment and Thermal Performance of Buildings)

Abstract

:
Saving energy while maintaining a high-quality internal environment is an increasingly important scientific and technological challenge in the building sector. This paper presents the results from a long-term study on thermal comfort in a passive house situated in the south of Poland. The building was constructed in 2010 with the use of prefabricated, lightweight technology. The main energy source is a ground source heat pump which powers the floor heating and DHW. The building is also equipped with a mechanical ventilation system with heat recovery and a ground source heat exchanger. A lightweight building structure which has active systems with limited capabilities (especially for cooling) is a combination which increases the difficulty of maintaining a proper inner environmental condition. Extensive experimental investigations on hygrothermal performance and energy use have been carried out in the building for several years. The measurement results, such as inner air temperature and humidity, as well as the inner surface temperature of partitions, could be directly used to determine basic thermal comfort indicators, including PMV and PPD. Any missing data that has not been directly measured, such as the surface temperature of the windows, floors, and some of the other elements of the building envelope, have been calculated using WUFI®PLUS software and validated with the available measurements. These results are not final; the full measurement of thermal comfort as an applied methodology did not consider human adaptation and assumed constant clothing insulation. Nevertheless, in general, the results show good thermal comfort conditions inside the building under research conditions. This was also confirmed via a survey of the inhabitants: 2 adults and 3 children.

1. Introduction

Obtaining high energy efficiency while providing adequate thermal comfort in all spaces and all seasons is becoming a challenge in passive buildings. Many energy-efficient buildings function at lower heating temperatures which might not usually provide a high quality of thermal comfort [1]. In addition to the radical minimization of heat loss, buildings with a very low energy demand obtain maximum solar gains thanks to the southern orientation of their windows, which can lead to significant overheating in the summer [2,3]. A review of the available literature around this matter of thermal comfort in energy-efficient buildings shows that the available papers are usually based on numerical analyses [4]. Most experimental research was carried out under laboratory conditions [5] or mainly concerns office-type spaces [2,6]. There are only a few examples of real residential buildings for which the monitoring results in terms of indoor living environment quality have been presented. Truong and Garvie [7] presented the results of monitoring the indoor climate and comfort outcomes of a three-bedroom single-storey detached passive house in Australia. Berr et al. [8] compared interviews, which were conducted ‘face-to-face’ in the resident’s household regarding thermal comfort and energy use with yearly measurements of microclimate parameters. The literature also lacks information on the perception of comfort on a daily scale, let alone on an hourly scale. Under real conditions and concerning long-term experimental studies, determining the thermal sensations on the basis of a resident’s survey answers is practically impossible (difficulties, e.g., in the hourly determination of the thermal insulation of clothing or the activity of inhabitants). The absence of empirical evidence documenting a resident’s perceptions of their low-energy home shows that little is understood about whether residents enjoy living in them [8].
The building under research conditions fulfills PH standard requirements. Low energy use is the result of a high thermally-insulated envelope and active systems based on a ground source heat pump as well as mechanical ventilation with heat recovery. Lightweight structures have low heat buffering capacities. This factor has an impact on heating control in winter and increases the overheating risk in summer. No active cooling system is available. The heat recovery unit has a bypass, but night cooling is ineffective because of the lightweight structure. A basic way to avoid overheating is air cooling via a passive ground-coupled heat exchanger. Therefore, our main research aim was to examine the thermal comfort within this particular lightweight building equipped with active systems with limited capabilities, especially for cooling.
There are many different versions of the definition of comfort. Difficulties in defining this concept and determining the scope of its parameters result primarily from the subjective perceptions of users and the interrelationships between the parameters that define it. The basic condition for experiencing thermal comfort is a balance between body heat and the environment. This means that the excess energy produced by the body during metabolic processes can be freely released into the environment.
In order to define the comfort standard, a closer look at the relevant parameters is needed. They can be divided into values related to the thermal environment, such as temperature, humidity, air velocity, and radiation temperature, and parameters characterizing humans such as activity, age, and clothing. Air and envelope surface temperatures have always been regarded as the main comfort indicators within equivalent temperature [9,10], effective temperature [11], operative temperature [12], and standard effective temperature (SET*) [13]. The method of assessing comfort, as presented by European standards [14,15], includes the statistical indicators for assessing thermal comfort from the user’s point of view:
  • Predicted mean vote (PMV)—expressing, on a seven-point scale, the average thermal feeling rating of a large group of people;
  • Predicted Percentage of Dissatisfied (PPD)—describing the percentage of people dissatisfied with the thermal conditions.
PMV is an index of thermal comfort, which is most widely used for assessing moderate indoor thermal environments. It predicts the expected comfort vote on the ASHRAE scale of subjective warmth (cold (−3), cool (−2), slightly cool (−1), neutral (0), slightly warm (1), warm (2), and hot (3)). It can be calculated for any combinations of human metabolic rate (M), clothing thermal insulation (Icl), air temperature (ta) and velocity (var), mean radiant temperature (tr), and partial pressure of water vapor (pa) [14]. As the PMV index was developed on the basis of test results, which differed only slightly from the neutral state (PMV = 0), the standard [14] precisely specifies the scope of PMV application: M = 46–232 W·m−2 (0.8–4 met), Icl = 0–0.310 m²·K·W−1 (0–2 clo), ta = 10–30 °C, tr = 10–40 °C, var = 0–1 m·s−1, and pa = 0–2700 Pa.
In recent years, opinions have been expressed about the inadequacy of comfort assessment using PMV. Humphreys and Nicol [16] showed that PMV was less closely correlated with comfort votes than the air temperature or the globe temperature, and that the effects of errors in the measurement of PMV were not negligible. An analysis of the ASHRAE database showed that PMV can be significantly misleading when used to predict the mean comfort votes of people in everyday conditions in buildings, particularly in warm environments [17]. Studies from other research centers also proved that the calculated value of PMV does not match the answers (Thermal Sensation Votes (TSV)) obtained in field studies [18,19,20].
Behavioral adaptation includes all of the conscious and unconscious behavior in daily life. These can be personal (e.g., changing clothing), technical (e.g., turning on an air conditioner or a fan), and cultural (e.g., an afternoon rest or nap taken during the hottest working hours of the day in a hot climate). Behavioral adaptation can also be influenced by social norms (injunctive and descriptive), such as reducing energy consumption. These behavioral indices were included in a more adequate comfort calculation model.
Concerning comfort during sleep, in addition to the thermal insulation of nightwear, the total thermal insulation of the bedding system should be considered. This depends on the thermal insulation of the bed itself, mattresses, pillows, body coverage of the quilt (considering thicknesses, fibre filling weights, and weight), and the air layer between the human body and the system [21,22,23]. The studies described in [24] indicate that sleeping posture also affects the total thermal insulation of a bedding system.
Some standards of so-called low energy-intensive construction differ from each other in terms of reducing the impact on the environment. They are often confused with each other [25]. Discussion in the literature [26,27] has focused on the positive and negative features of low-energy buildings, net-zero energy buildings (NZEB) [28,29], nearly zero-energy buildings (nZEB) [30,31,32], green buildings, solar houses, sustainable buildings, energy-plus buildings, and passive houses (PH) [33,34]. The energy-saving measures applied within passive houses ensure savings on heating- and cooling-related energy, reaching 90% compared to traditional buildings and over 75% in comparison to average new buildings [35]. The energy demand of a PH fulfils the requirements of the EU EPBD [36], which states that energy use should be as low as is practically achievable. To a large extent, this is due to its efficiency design, which is exemplified by a high level of thermal insulation, windows with low heat transfer, airtightness of the building envelope, and mechanical ventilation systems with heat recovery. On top of these, there is also significant attention paid to the elimination of thermal bridges. PHs require no more than 15 kWh·m2·year1 for heating or cooling, and the heating or cooling peak load does not exceed 10 W·m2 [33,35]. For a building to be considered as being a PH, its conventional primary energy use cannot go beyond 120 kWh·m2·year1. This standard does not allow for excessive temperatures that exceed 10% of the cooling period in warmer climates [33]. With such a limited amount of energy supply, it is easier to meet the subsequent demand by means of renewable energy sources. Currently, a significant majority of studies on PHs focus on factors such as thermal performance under various climatic conditions [37,38,39,40], life-cycle assessment (LCA) and costing (LCC) [41,42,43,44,45], comparative assessment with zero-energy buildings [26,46,47], integration of renewable energy technologies (RET) [48,49], upgrading historic buildings to the standard [50,51], investigations of building material performance [52,53,54,55], and the indoor environment [3,56,57,58].

2. Materials and Methods

2.1. Case Study

Our research was conducted in a single-family building located in the south of Poland. The house was built with a technology of a prefabricated wooden frame structure, which rests on a reinforced concrete foundation slab isolated from the ground with a 50 cm layer of extruded polystyrene. The individual partitions (walls and ceilings) were made in the factory. Then they were transported and assembled at the construction site. The building has almost 120 m2 of usable area. On the ground floor, there is a living room with kitchen, an office room, a toilet, and a technical room. The first floor includes three bedrooms and a bathroom (Figure 1). During the research, the building was inhabited by a family of five (parents and three children).
The building meets the requirements of PH standards. The values of the relevant parameters are presented in Table 1. The average value of the wall thermal conductivity coefficient is 0.08 W·m2·K1. Such a low U-value was achieved by using the skeleton structure. The major parts of the cross-section of the walls are filled with an insulating material. The interior of the skeleton is filled with 16 cm-thick mineral wool. Moreover, a 25 cm layer of insulation (polystyrene, wood wool, or mineral wool) was applied to the outer surface. Figure 2 presents the cross-section of the particular partitions. In total, eight variants of assemblies, differing mainly in their use of thermal insulation materials, various types of stiffening plates, and vapor barrier, were used to build the house. The intention behind such a design was to test various configurations with regards to their hygrothermal parameters [55]. The foundation interface, characterized by extreme thermal insulation, eliminating the influence of thermal bridges in floor area, was another specific solution. To obtain lower U-values and to ensure better tightness, non-opening windows were installed, with the exception of one opening terrace window on the ground floor.
The active systems included floor and an air heating (reheating the ventilation air) and a system for preparing domestic hot water. The heat is supplied by a ground heat source pump. The building is equipped with a mechanical ventilation system with heat recovery and a ground heat exchanger. The heat exchanger mitigates fluctuations in the temperature of the outside air let into the building in the winter and summer season. The systems are shown in Figure 3 and Figure 4.
The building was subjected to extensive experimental research for many years, starting in 2011. A total of 158 sensors were installed in the building structure and in the technical systems. A local meteorological station was installed next to the building. Measurements were recorded at 1 or 6 min intervals. The results, including the energy flows in particular elements of the active systems (heat pump, circulation pumps, and fans) and electricity use in the entire building, were analyzed. The temperature and humidity from within the assemblies were also measured. This allowed us to determine the hygrothermal performance in eight variants of the walls and two types of roof structures under real operating conditions [54,55]. Also, analysis and computational simulations of thermal conditions around the ground heat exchanger [59] were carried out.

2.2. Measurement of Microclimate Parameters in the Building

Inside the building, the equipment for monitoring of the microclimate parameters was installed. The air temperature and relative humidity were measured using the integrated LB-710HS thermo-hygrometer. The relevant parameters were as follows:
  • Temperature measurement:
    • Accuracy: 0.1 °C;
    • Measurement range: −40–85 °C;
    • Resolution: 0.1 °C.
  • Relative humidity measurement:
    • Accuracy: 2%;
    • Range: 0–100%;
    • Resolution: 0.1%.
Thermo-hygrometers were installed in the living room on the ground floor, in the bedroom and bathroom on the first floor, and in the non-functional attic (Figure 5). Radiant temperature was measured by black globe thermometers:
  • Accuracy: 0.3 °C;
  • Range: −50–200 °C;
  • Resolution: 0.1 °C;
  • Diameter: 150 mm, ball 150 mm;
  • Material: matte, blackened, copper, diameter.
Globe thermometers were located in the living room on the ground floor and in the bedroom on the first floor. The temperature of the inner surface of the partitions was also measured. The sensors (of type PT100 with an accuracy of 0.1 °C) installed close to the surface were used for this purpose (Figure 5).

2.3. Measurement of Outdoor Climate Parameters

The parameters of the external climate were measured in situ by the meteorological station located in the southern part of the plot (Figure 4). The following parameters were recorded: temperature, relative humidity, direct and diffuse radiation, wind speed, and direction.

2.4. Complementary Calculations

As not all the relevant parameters could be directly measured, e.g., inner surface temperature of all the partitions and floor, WUFI®PLUS software was used for supplementary calculation. Based on the blueprints, a 3D model of the building was created. Measured hourly values of temperature and relative air humidity inside the building were assumed as boundary conditions for the calculation of hygrothermal performance of partitions. The outdoor climate, based on measured parameters in the weather conditions near the building, was assumed as the external boundary condition. Calculation results were then validated with the available measured results, such as measured surface temperature (Figure 5).
Floor surface temperature is an essential component of thermal comfort. It is influenced by the transient building–soil thermal interaction [60]. The surface temperature was not measured directly. Temperature sensors were located in 3 positions (Figure 5) between the screed and reinforced slabs. Detailed 3D transient heat flow calculations were carried out to analyze the thermal conditions of the slab-on-grade with floor heating [59]. The measured maximal temperature difference between central and corner points was 3 K. This is because of the thick thermal insulation under the floor and the perimeter insulation. Based on the validated model mean floor surface, the floor temperature pattern was calculated and assumed for the comfort analysis.

2.5. Assumptions for the Comfort Analysis

The assessment of the microclimate in terms of residents’ comfort was based on the analysis of indoor air parameters, i.e., temperature and moisture content, the inner surface temperature of partitions and their juxtaposition, such as operative temperature. Measured and complementary calculated parameters were compiled according to the comfort zones of Leusden and Freymark (based on air temperature and relative humidity) [61], Frank (based on air temperature and mean surface temperature) [62], and ASHRAE summer and winter comfort zones (based on operative temperature and humidity) [63].
The assessments of comfort PMV and the PPD index during the day—for the living room and at night—for the bedroom were made as follows:
  • During the day, two clothing insulation values were assumed: 0,5 clo (e.g., underwear, short-sleeved shirt, light pants, thin socks, and shoes [14]) and 1.0 clo (e.g., briefs, shirt, pants, jackets, socks, and shoes [14]), which correspond to the thermal insulation proposed for winter and summer as standard [15]. An activity of 1.0 met was assumed (seating, writing, and reading [63]).
  • In the case of sleeping comfort, two values of thermal bedding system insulation were adopted: 3.7 clo and 2.0 clo (based on [24]). Activity for sleeping was assumed to be 0.7 met (based on [63]).
The results were compared to the comfort category defined in the standard [14]:
  • I (A) category—PMV < ±0.2 and PPD < 6%;
  • II (B) category—PMV < ±0.5 and PPD < 10%;
  • III (C) category—PMV < ±0.7 and PPD < 15%.
The essential elements of the research and their interrelationship are presented in flowchart (Figure 6).

3. Results and Discussion

3.1. Outdoor Climate

In the year under study, the outside air temperature fluctuated within the range of −28.2–36.2 °C. The minimal temperature was recorded in January and the maximum in August. The mean annual temperature was 8.4 °C (Figure 7). Relative humidity varied from 16.5% to 96.9% (Figure 7), with an average of 79.8% and a median of 87.7%. South and south-easterly winds with speeds up to 5 km·h−1 prevailed (Figure 7). The intensity of solar radiation is shown in Figure 7. A comparison with the typical meteorological year (TMY) (climate POL_SL_Katowice, Intl.AP.125600_TMYx.epw [64]) shows that the climate in the year under review was characterized by a greater amplitude (in winter, it was much cooler than the statistical climate, and in summer, it was slightly warmer; the median in both cases differed by only 0.3 °C). The relative humidity was slightly higher than that resulting from the statistical climate.

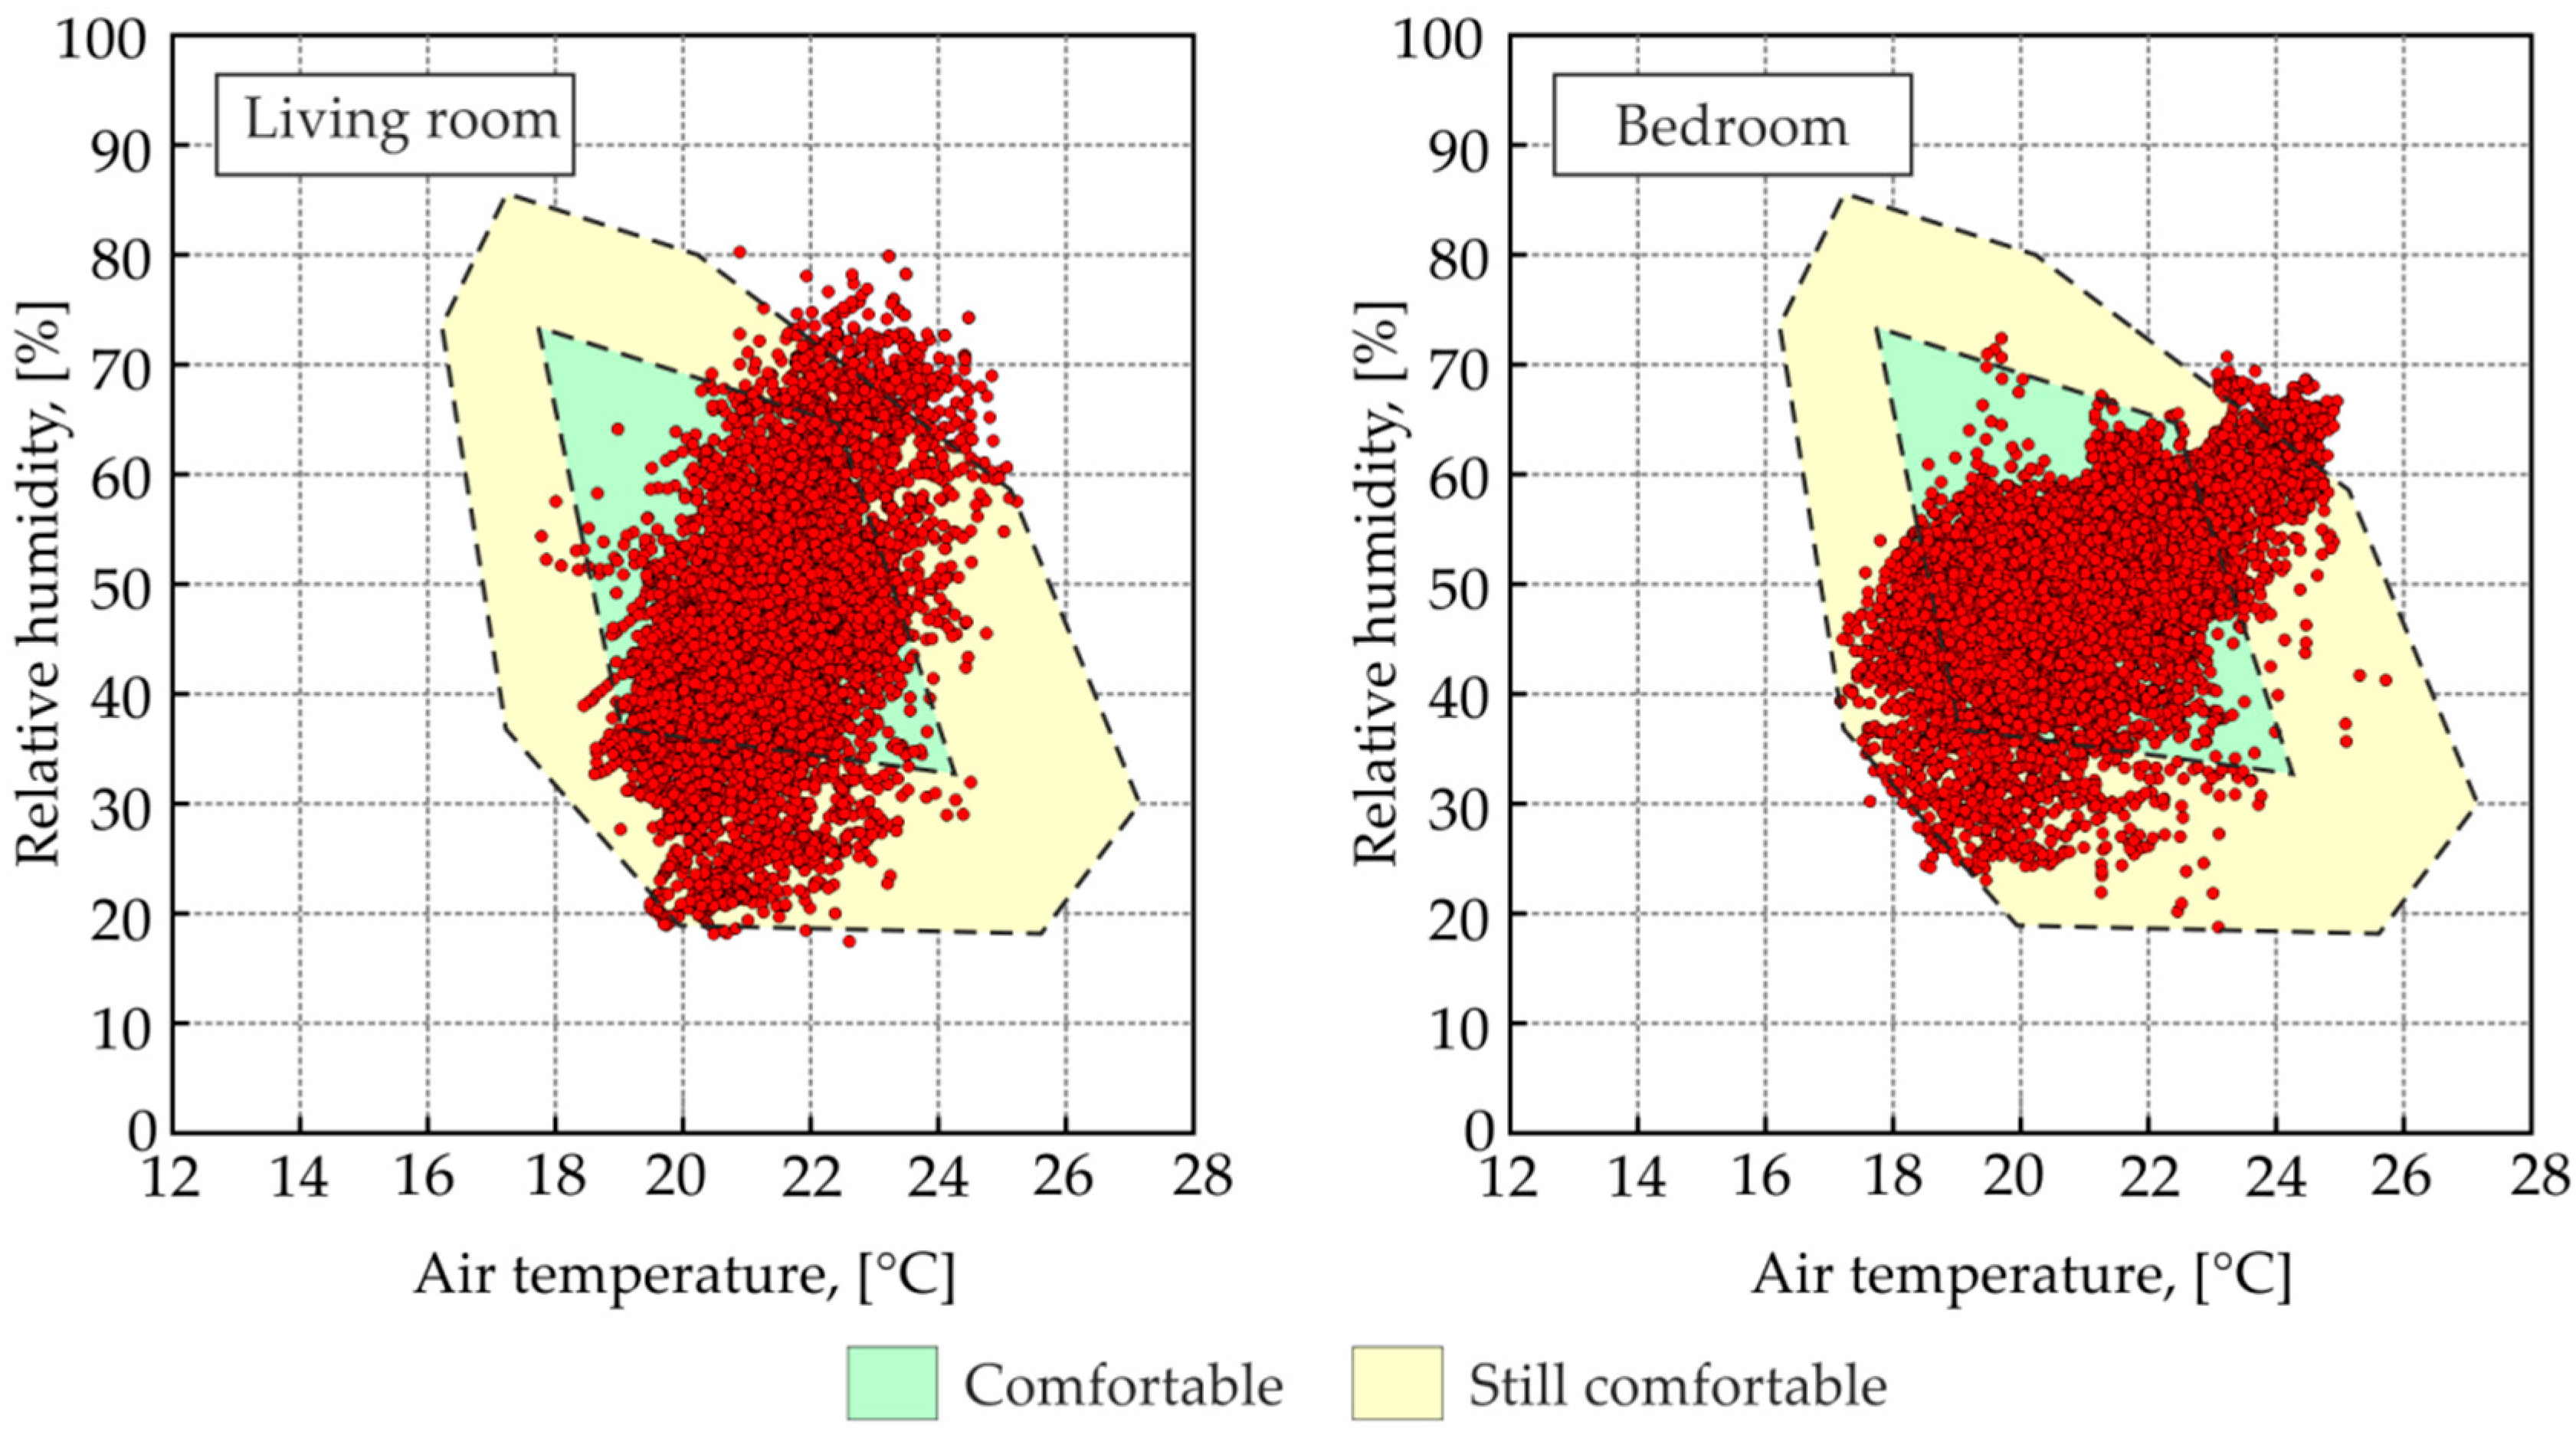
3.2. Indoor Air Temperature and Relative Humidity

The temperature in the living room fluctuated within the range of 18.5–26.9 °C. For the bedroom, the range was 17.8–27.4 °C, whilst the bathroom ranged from 18.0–29.2 °C. The median was 22.4 °C in the living room, 21.9 °C in the bedroom, and 22.2 °C in the bathroom (Figure 8a). An example of the course of the temperatures during January from within the analyzed rooms is presented in (Figure 9). The temperature in the living room was characterised by a rather low variability (standard deviation 1.2 °C). For the bedroom and bathroom, the variation was similar (standard deviation 1.8 °C and 1.7 °C, respectively).
Relative humidity inside the building was measured in the same locations as the temperature. The ranges were: 17.5–80.2% for the living room, 18.8–72.4% for the bedroom, and 21.1–86.3% for the bathroom on the first floor (Figure 5). The measurements showed that the relative humidity in the bedroom was characterized by the lowest variability, with a standard deviation of 8.3%. The highest variability was observed in the living room, where the standard deviation was 10.5%. For the bathroom, the standard deviation was 8.9%. The measured ranges of relative humidity are presented in (Figure 8b).
Differences in microclimate parameters between the living room, bedroom, and bathroom were statistically compiled. Based on the measured patterns of temperature and relative humidity, an R–Spearman correlation coefficient between the rooms was calculated. The high correlation between the results was statistically significant. Detailed values are presented in Table 2.
The comfort assessment proposed by Leusden and Freymark [61] was carried out for the living room and bedroom. These are spaces with the longest time inhabited by the residents. As shown in Figure 10, hourly values in both rooms indicate that for most of the time, the conditions were “comfortable” or “almost comfortable”. Only a small fraction of the measurements fell outside of the comfort zone.
The inner climate quality, in terms of operative temperature, humidity ratio, and standard clothing insulation (0.5 and 1.0 clo), was also analyzed. Figure 11 shows the results on an annual basis. While wearing a garment with an insulation value of 0.5 clo, the conditions were outside the comfort zone most of the time. When analyzing the monthly periods, it was observed that from January to May and from September to December, the tested values were practically entirely outside the comfort zone. On the other hand, with a garment insulation performance of 1.0 clo, most measurements were in the comfort zone. This is also confirmed by monthly analyses which show that exceeding the comfort zone occurs mainly in the summer months, i.e., June, July, and August.

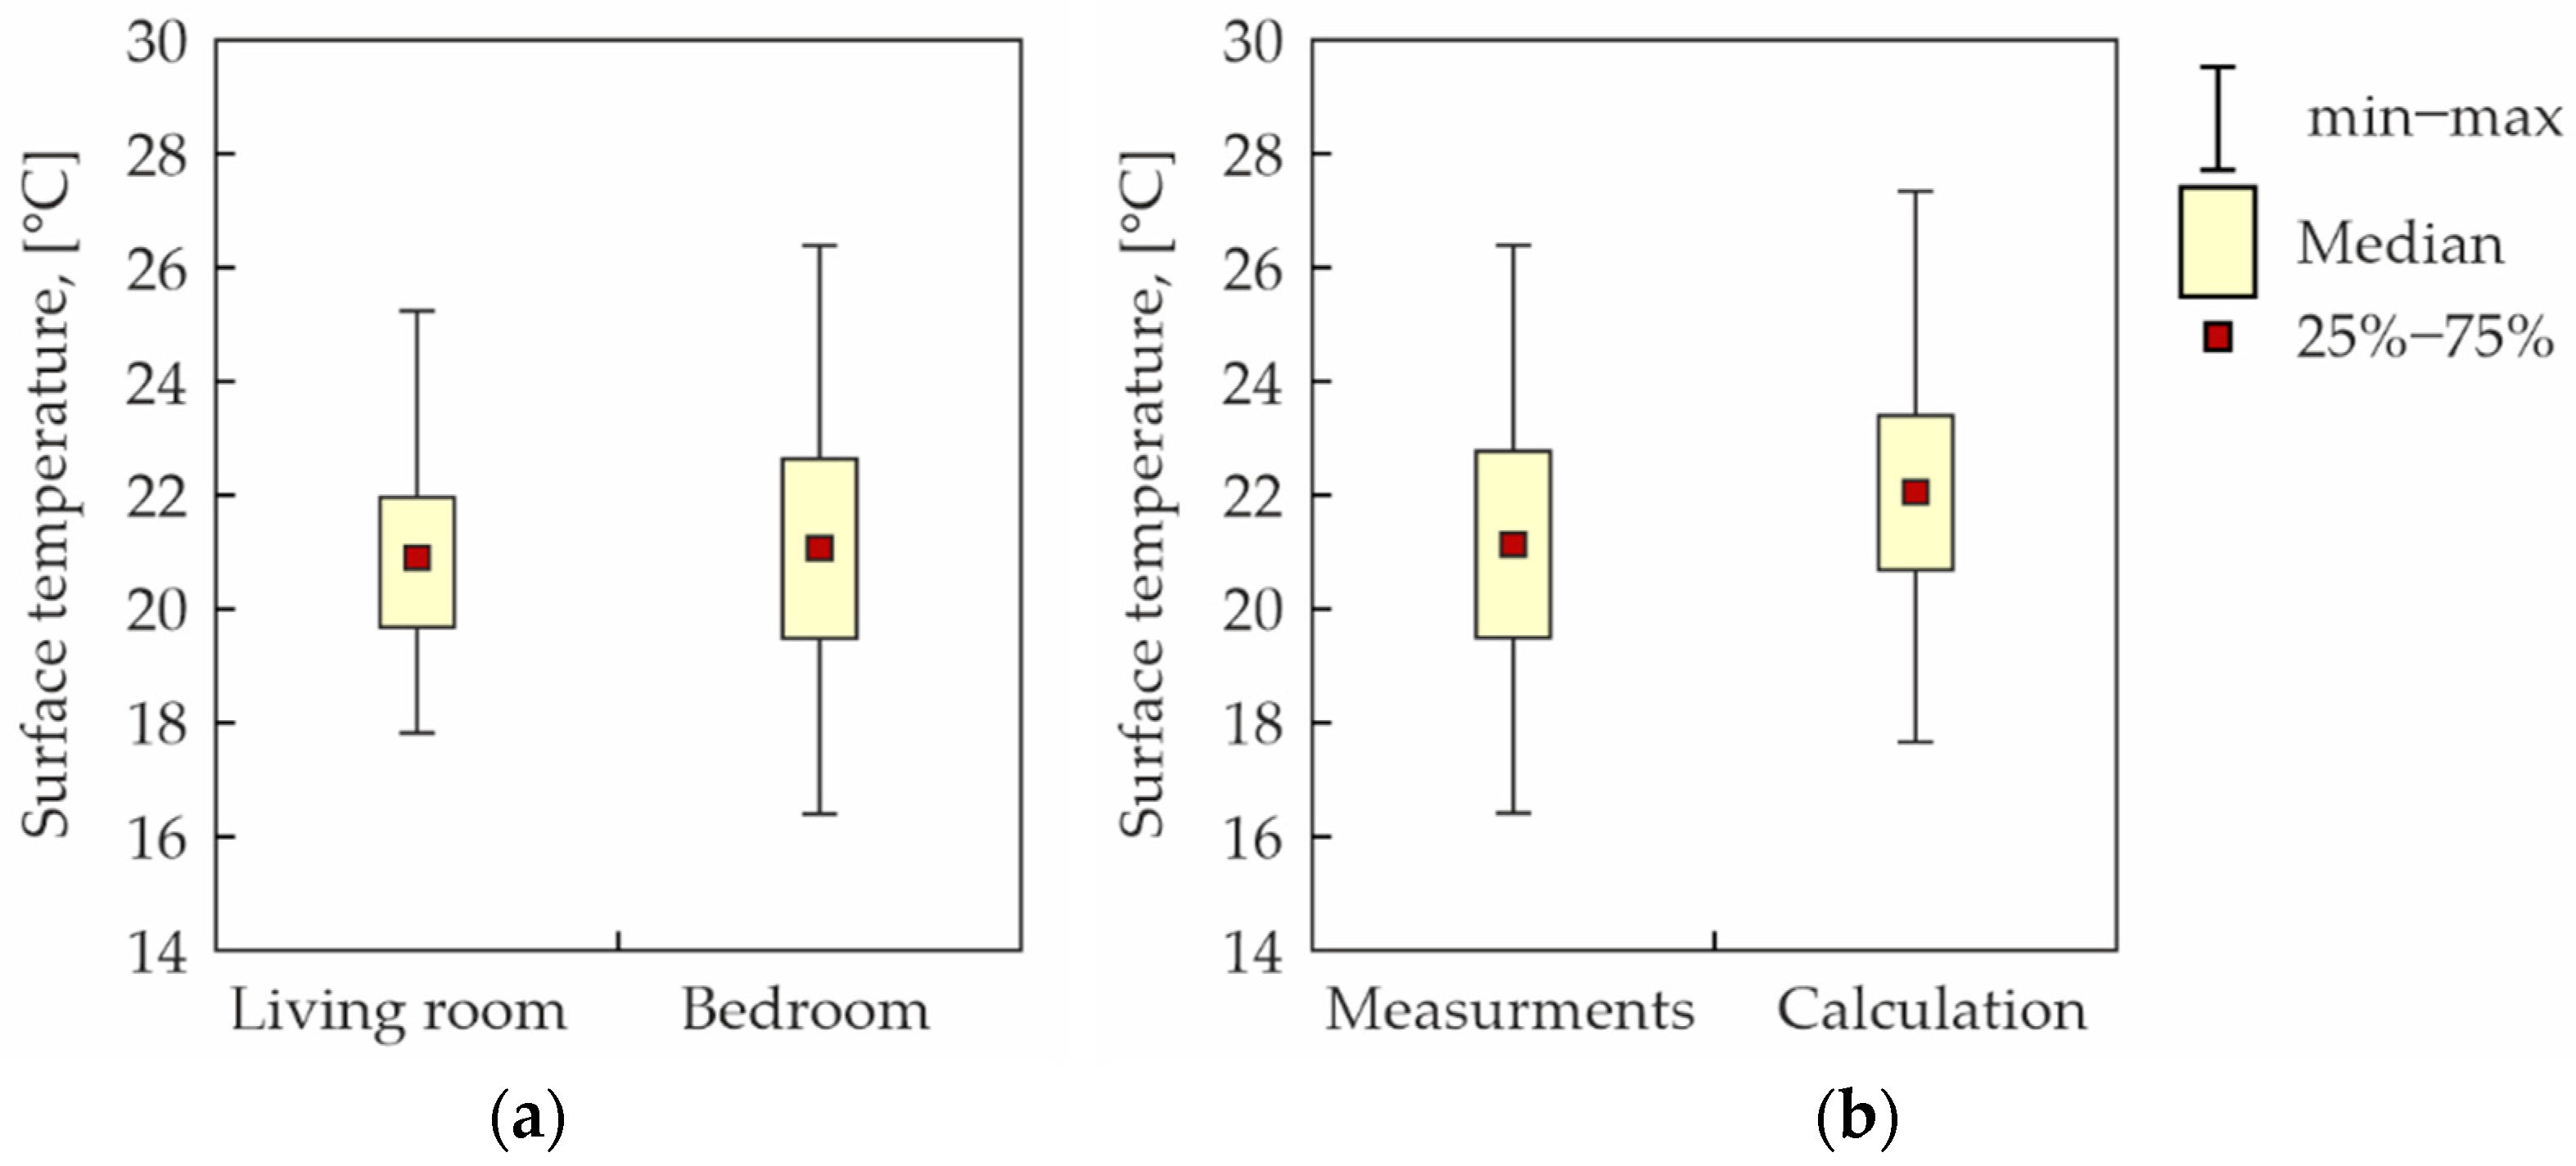
3.3. Surface Temperature

The inner surface temperature of two walls was directly measured. The average temperature was at a similar level, i.e., 20.9 °C in the living room, 21.1 °C in the bedroom and 21.2 °C in the bathroom. In the bedroom, the biggest fluctuation in temperature range (16.4–26.4 °C) was recorded on an annual basis, Figure 12a.
The surface temperature of the remaining building assemblies was determined by calculation. A high correlation coefficient (0.97) by absolute difference for the living room below 0.5 °C and bedroom at 1.0 °C was observed, when compared with the available measurement results (Figure 12b).
Based on the validated calculation results of surface temperature and measured air temperature, the comfort level, according to Frank [62], was determined. The nomograms (Figure 13) show the results for the living room and the bedroom on an annual basis. In both rooms, most of the surface-air temperature value pairs are in the “comfortable” or “almost comfortable” zone. Monthly analysis specified an exceedance that occurred mainly in the summer months. They are available from June to September for the living room and from June to August for the bedroom.

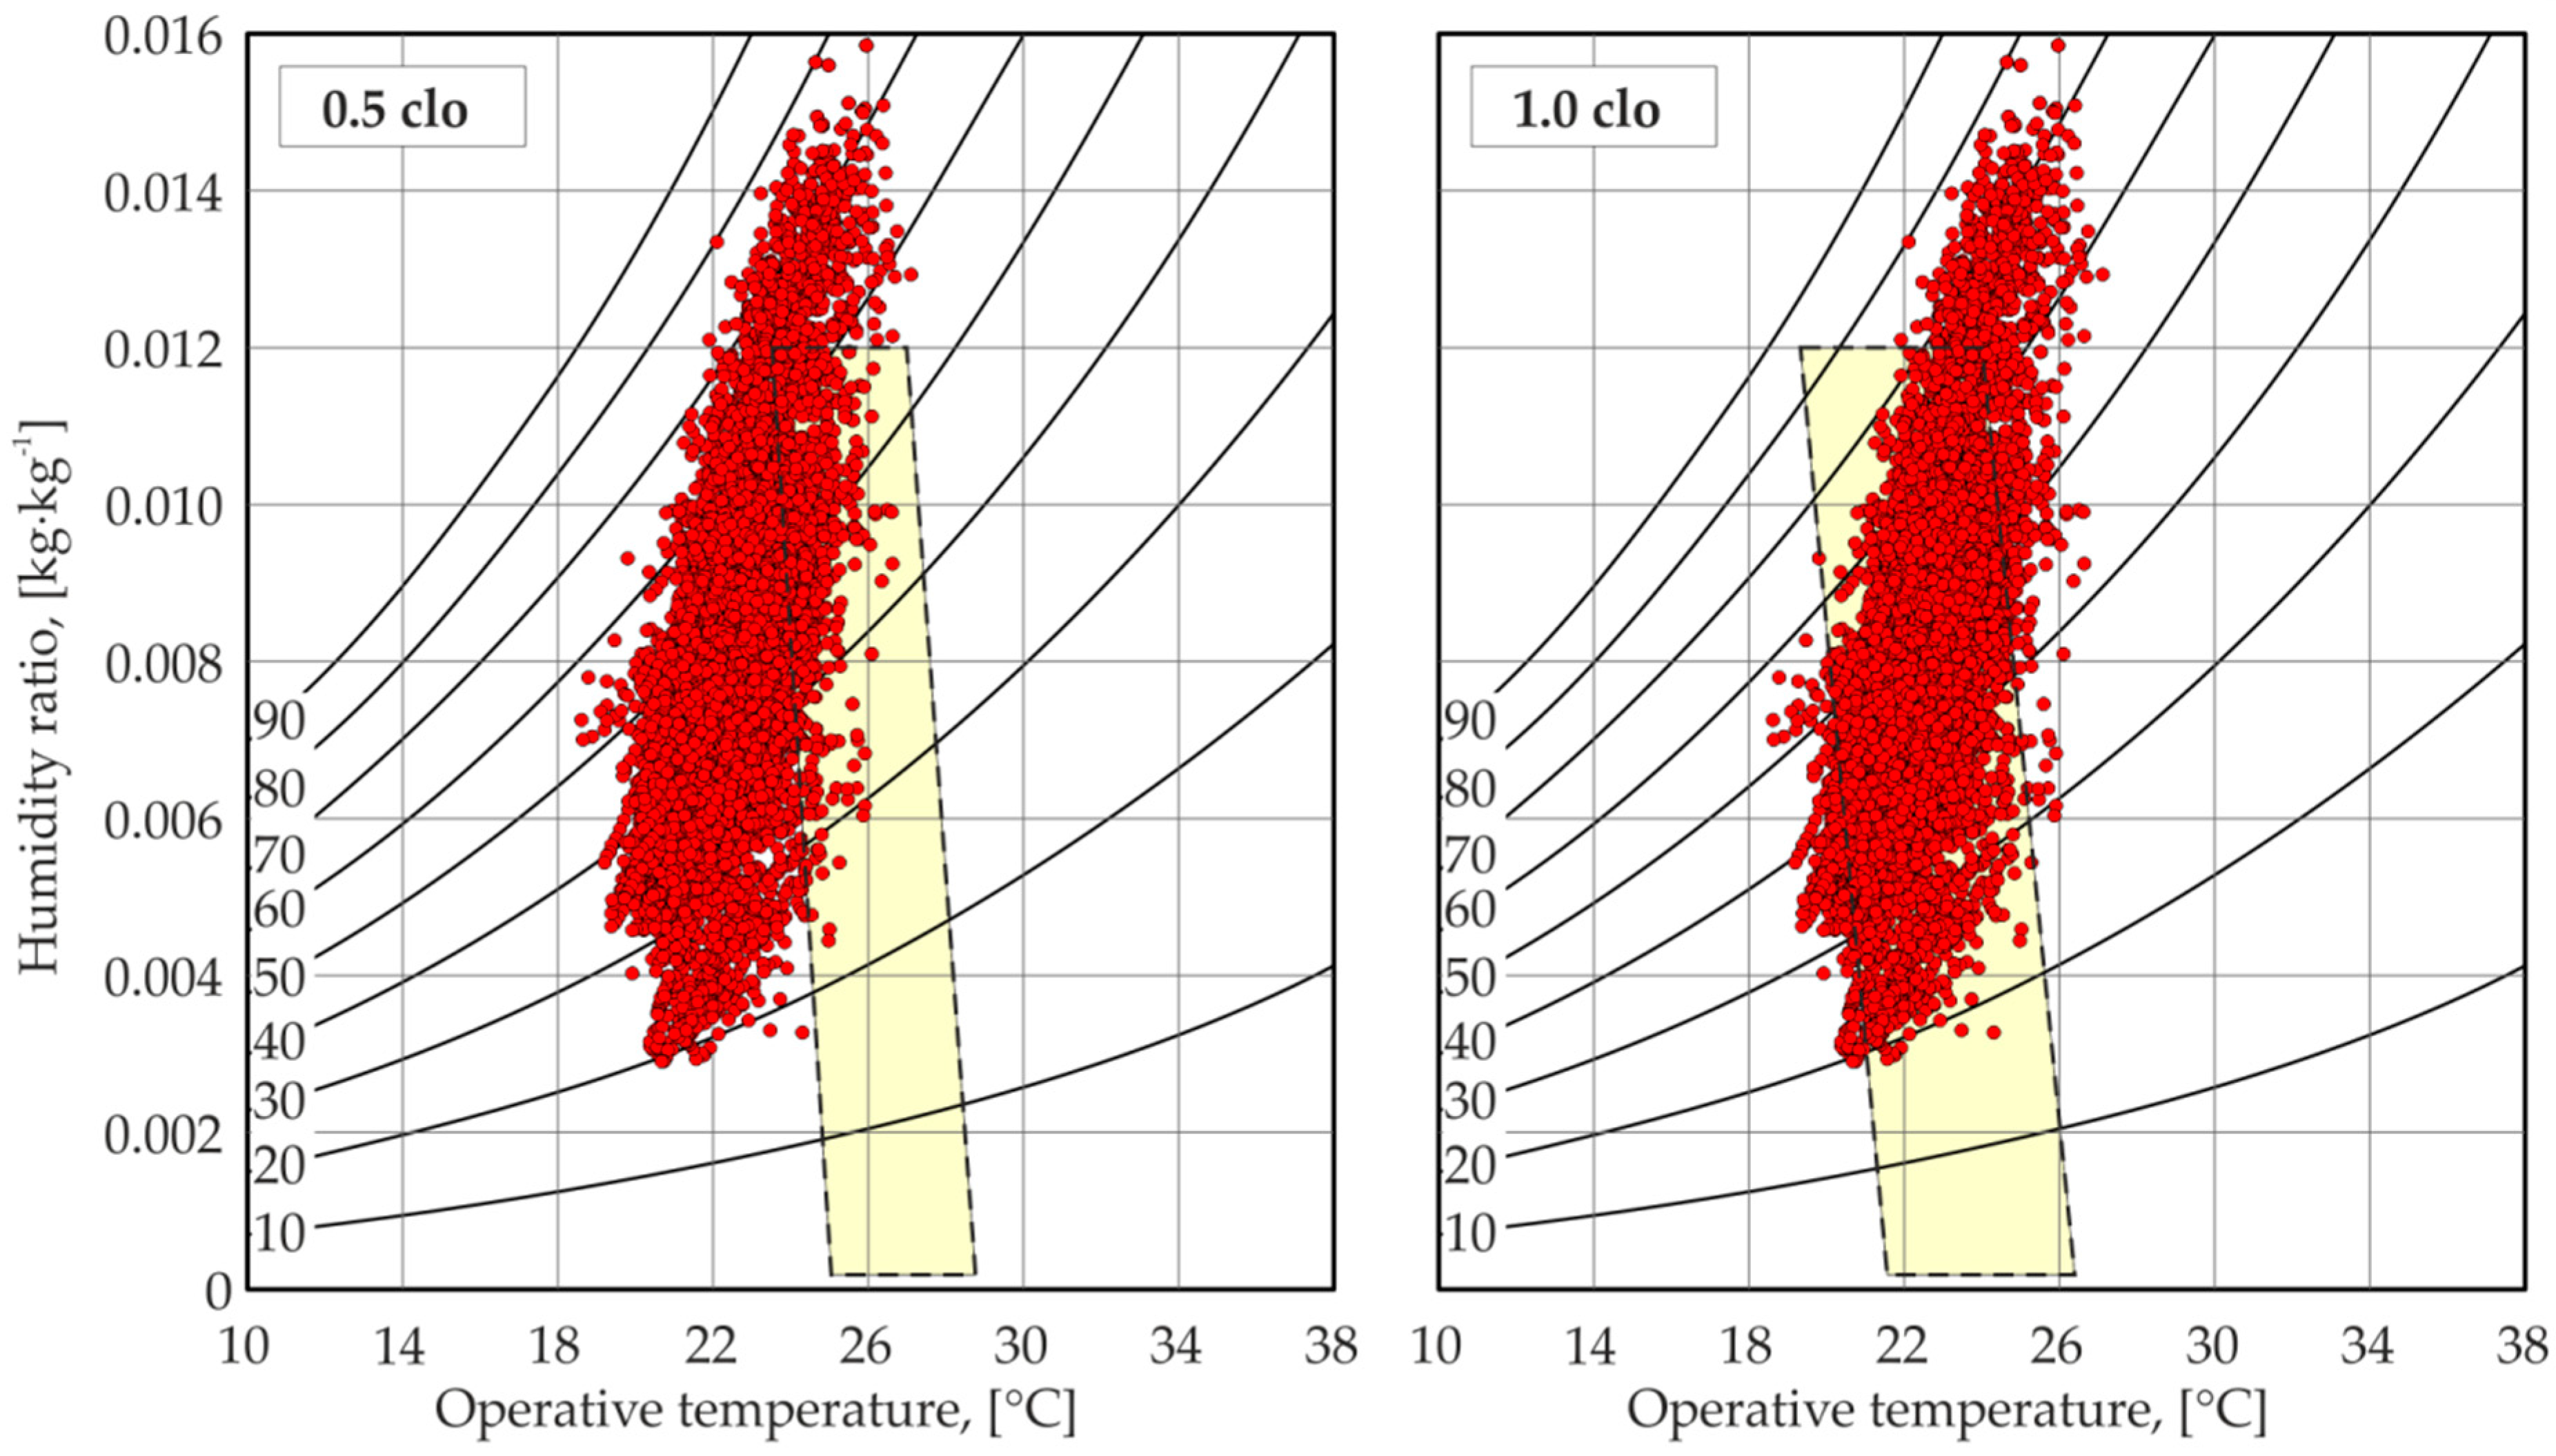
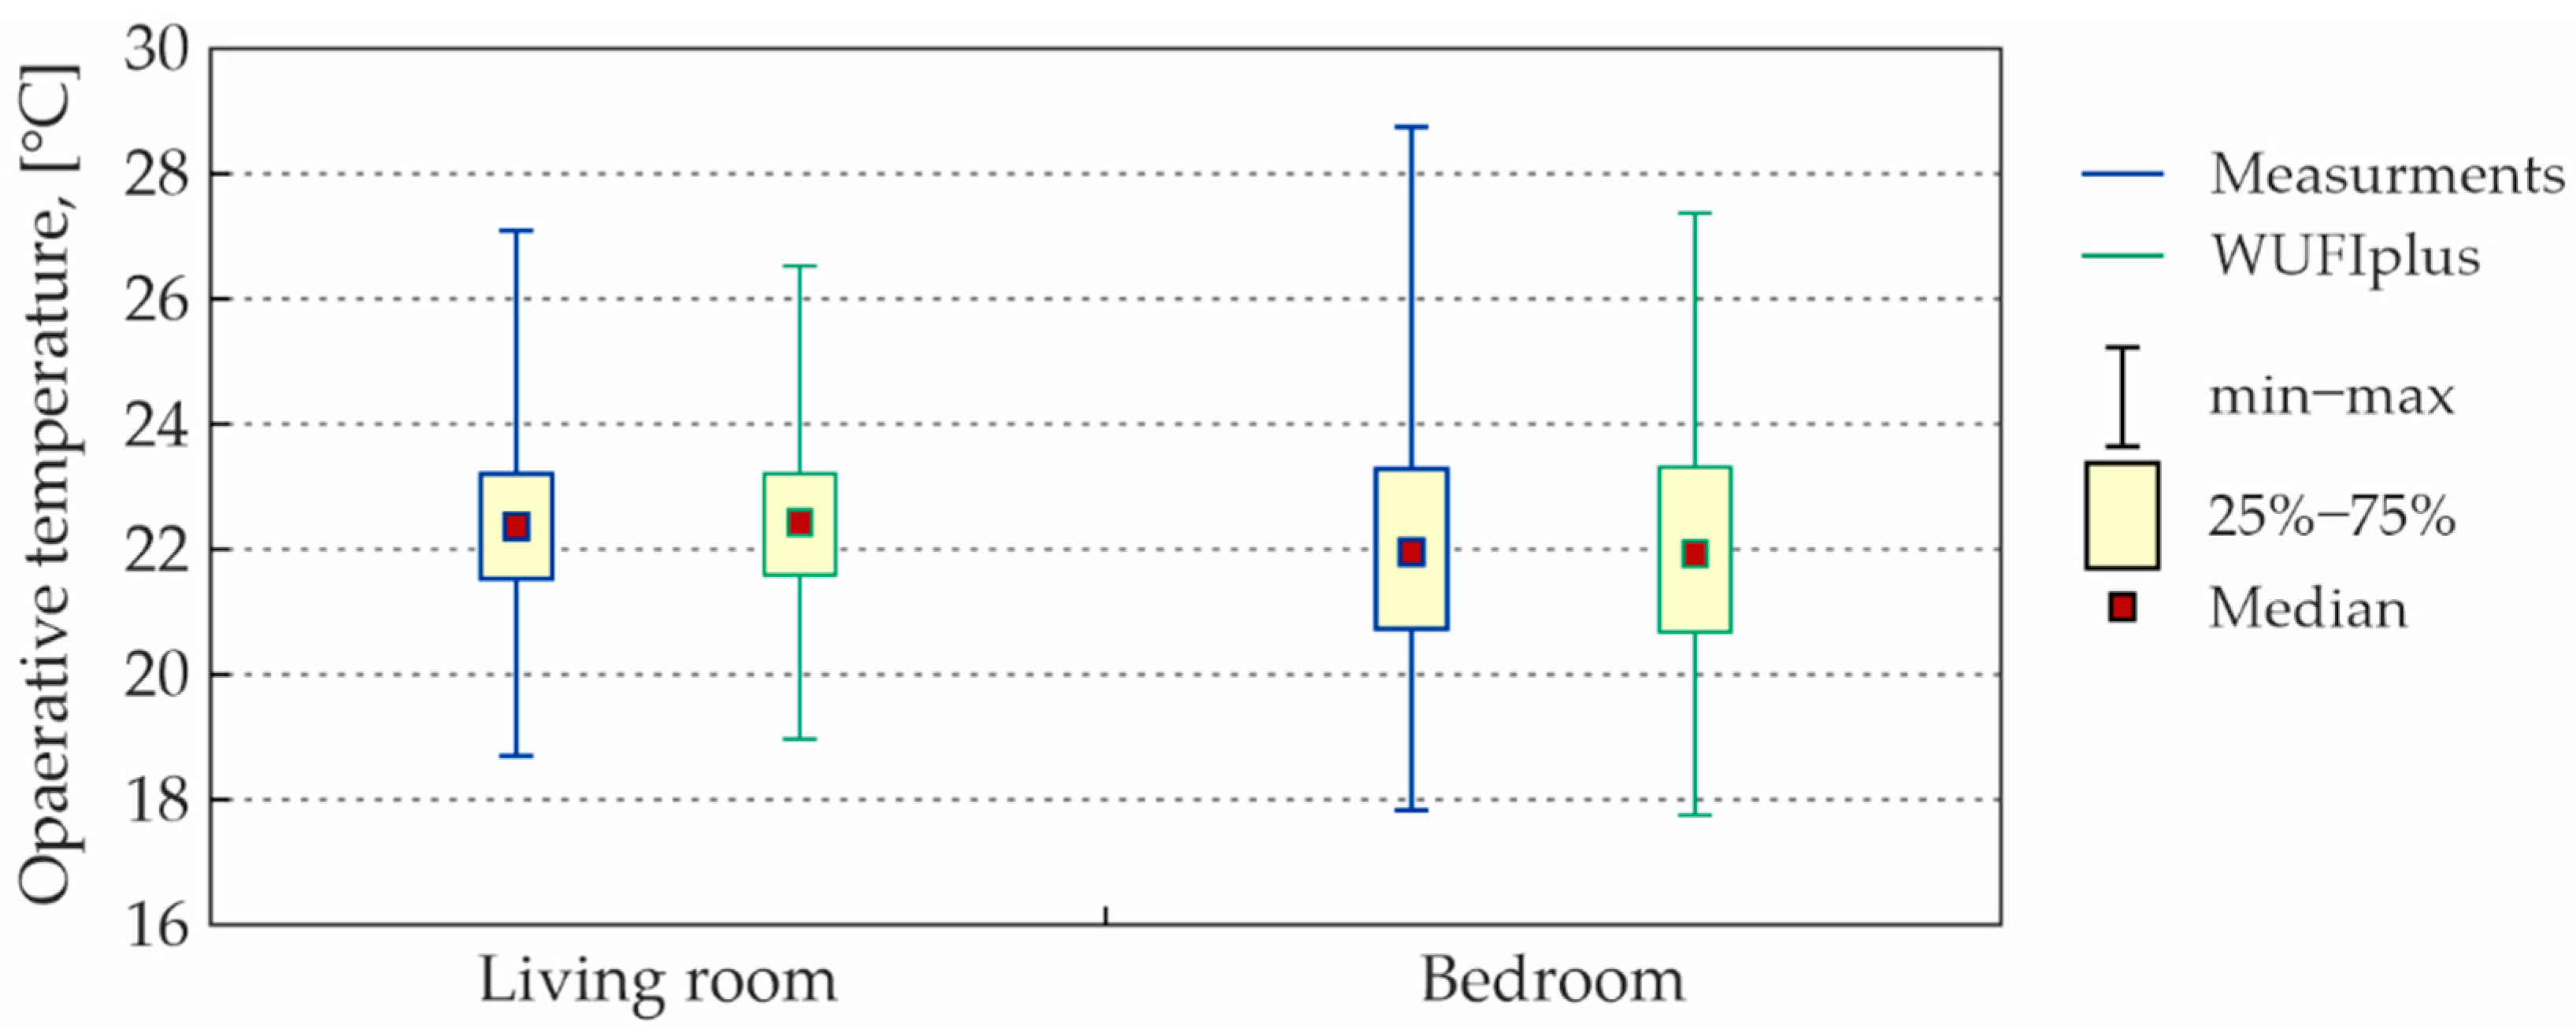
3.4. Radiant and Operative Temperature

The combined air and radiant temperatures were measured by a globe thermometer in the living room on the ground floor and the bedroom on the first floor, Figure 5. The average value for the living room was 22.4 °C, and the range was 18.6–27 °C. The mean value for the bedroom was 21.4 °C, ranging from 17.8–28.7 °C (Figure 14). The mean radiant temperature within the rooms was also calculated as a weighted value of room enclosure surface temperature. The surface temperature was determined by validated computer simulations (see Section 3.3).
Based on air and radiant temperature, an operative temperature was determined. The hourly pattern for the living room during January is shown in Figure 14. The mean value for the measurement based on operative temperature was 22.1 °C and 22.0 °C for the calculated data. The series both differ mainly in their maximum values. The value range for the measurements was 17.8–28.7 °C, and for the calculations, it was 17.7–27.4 °C, as shown in Figure 15. For the measured and calculated mean operative temperature series, a correlation coefficient of 0.98 was obtained.

3.5. PMV and PPD Indicators

The analysis of PMV and PPD indicators was split into day and night, as described in the methodology. The adopted scenario assumed a human presence in the living room from 7 AM to 10 PM (16 h a day in total), with three variants of thermal insulation of clothing for activities for activities of 1.0 met. Two of them are standard values, i.e., 1.0 clo and 0.5 clo. Additionally, an intermediate value of 0.75 clo was considered. For bedroom presence time, the time from 11 PM to 6 AM was assumed. Two variants of thermal insulation, including bedclothes, were set: 3.7 clo and 2.0 clo, with an activity of 0.7 met.
The results of the calculations for daily comfort, including comfort categories for the living room, are presented in Figure 16. PMV fluctuates annually in the range −1.1–1.0, when an insulation value of 1.0 clo is assumed. The conditions of I category lasted a total of 2027 h, which is 34.7% of the period considered. The II category covers 2268 h (38.8%), and the III category an amount of 951 h (16.3%). It was found that 602 h occurred outside the limit of applicability toward the methodology, which is 10.3%. If 0.5 clo is assumed, the results indicate that the conditions are generally too cold. Most of time (5141 h, which is 88%) this is even beyond the area of the quantifiable parameters. In terms of comfort, time coverage was I—149 h (2.6%), II—255 h (4.4%), and III—300 h (5.1%). On an annual basis, the analyzed PMV values range from −2.6 to 0.3. In turn, the third case of thermal insulation of clothing of 0.75 was an intermediate variant. PMV values ranged from −1.7 to 0.7. The I, II, and III categories covered 10.3%, 23.0%, and 19.7% of the analyzed time, respectively. The percentage of time left which occurred outside quantifiability was 47.1%. Detailed values are presented in Table 3. Figure 17 shows the percentage of monthly-based PMV in terms of the comfort category for the considered thermal insulation properties of clothing. It confirms that the most optimal clothing value for the living room, for all analyzed cases, is 1.0 clo.
The results for night-time comfort in the bedroom are presented in Figure 18. When assuming a total insulation for clothing and bedding of 2.0 clo, the PMV values fluctuate annually in the range of −1.8–0.8. In the I category of comfort, 403 h were recorded, which constitutes 13.8% of the period considered. For 1524 h (52.2%), conditions outside the qualifiable range occurred, mainly reported as the feeling of being “too cold” during the winter half of the year. When assuming an insulation of 3.7 clo (bed set plus clothing), most of the PMV values fall within the comfort categories (71.5%). An overview of comfort for the bedroom is summarized in Figure 18 and Table 4. The percentage share for particular months is shown in Figure 19.

3.6. Discussion

Achieving very low energy consumption is the highest priority when designing a low-energy building. It is assumed that active systems with dimensions based on the demand for standard heat outputs and passive cooling are sufficient to provide adequate thermal comfort. This assumption seems to be particularly relevant in the case of passive buildings, where the internal environment is better isolated from the influence of the external climate. There are very few publications verifying this thesis. Almost all of them indicate some comfort issues and a need for further research in residential passive buildings. A study of the literature, and the specific features of the building under study, prompted the undertaking of this research. In order to assess comfort as widely as possible, various criteria, according to current standards, were used.
Due to the long period needed for the measurements and the fact that the building was inhabited, not all of the parameters were measured. Missing data, like the surface temperature of most partitions, including the floor in the living room and windows, were determined via calculations using the WUFI®PLUS software. The results were validated by comparative calculations, with the use of experimental data both for the boundary conditions and the temperature on the surfaces and the internals of the assemblies. Very good compliance between the measurement and the calculation result allowed us to regard the input parameters as sufficiently accurate.
Obviously, the environmental conditions inside of buildings are strongly dependent on the outdoor climate. The measurement results for the chosen one-year research period showed a colder winter and a warmer summer than the statistical data. Therefore, it might be expected that the comfort parameters during the future use of the building will be in general within the obtained ranges. Measurements from the following years confirmed this thesis. However, the occurrence of different conditions due to climate change may significantly limit the applicability of anticipated comfort.
This research, even though very extensive, was carried out for only one building. Thus, extrapolation of the results to other buildings is limited to similar cases, i.e., lightweight-structure, non-opening windows, mechanical ventilation combined with ground heat exchanger, and underfloor heating powered with a ground source heat pump. Similar usage and external climate are also essential factors. No directly comparable case has been found in the literature. The most differences pertain to building structure and climate zone.
Nevertheless, similar conclusions can be found in some publications. Most papers pay attention to the overheating issue, e.g., the studies by Foster et al. [65] showed overheating above 30 °C in passive houses in Scotland. A study based on interviews with the inhabitants of 25 households (Berr et al. [8]) confirmed good comfort conditions; however, significant issues were identified in the reliability and usability of the energy technologies. Research conducted in Australia (Truonga [7]) and Berr [8] showed very good comfort conditions during the transitional periods (spring and autumn) yet worse but acceptable comfort conditions in winter and summer. Good comfort conditions in the building under study, similar to the results presented in these publications, occurred for the majority of the time. The problem of periodic overheating in summer was also observed. Assumed passive cooling based on the ground source heat exchanger was not sufficient for hot periods.
Despite a correctly selected heat pump, the feeling of cold occurred for relatively short periods of time. This happened when the outer air dropped below −20 °C. Since the heat pump power was calculated for −22 °C conditions, the relatively low heat buffering of the building and poor regeneration of a lower ground heat source could be the reasons for this. Underheating in passive houses is less documented in the literature.
The results presented are not the final measure of thermal comfort in the building as the methodology omits the human adaptation and assumes constant clothing insulation. The results show the time in which individual insulations give a specific category of comfort. Depending on current conditions, people dress according to individual needs. Human adaptation, omitted in the applied methodology, could be another factor improving individual sensing and thermal comfort assessment.

4. Summary and Conclusions

Air temperature and humidity, as well as radiative temperature, are basic input parameters for the calculation of thermal comfort indicators. As the building under research was investigated, mainly for hygrothermal performance and energy use, not all experimental data were available. The missing parameters were obtained by calculations, while measurement results were used for validation. High agreement allowed for reliable analysis based both on experimental and calculated data.
The combined air and radiant temperatures were measured by a globe thermometer in two rooms. This allowed us to determine the operative temperature from air and surface temperature and from directly measured results. Between the two series, a correlation coefficient of 0.98 was obtained.
The compilation between the differences in microclimate parameters for the living room, bedroom, and bathroom was statistically significant. This means that homogeneous conditions do not exist, even in lightweight buildings. Surprisingly higher correlations were obtained for the relative humidity patterns compared to those for the temperature. Mechanical ventilation dominates the changes in humidity, whereas different solar and inner gains in particular rooms cause higher temperature differences.
Based on the hourly and yearly patterns of experimental and complementary data obtained by computer simulations, basic comfort indicators in particular rooms were determined and statistically summarized. Even though the analysis was carried out under a certain calendar year and for a certain building type, and considering that the winter was slightly cooler and the summer warmer than the statistical climate, some general regularities in terms of thermal comfort, typical for lightweight passive buildings, could be observed.
Inner climate quality assessment, according to Leusden and Freymark [61], showed that in the living room, the majority (more than 50%) of hourly temperature and relative humidity value pairs fell within the “comfort zone”, and more than 45% fell within the “still comfort zone”. Less than 5% was estimated to be outside of the comfort range. Estimations, according to Frank [62], had similarities to this. Lightweight building structure and high thermal insulation cause little air and partition surface temperature differences. Thus, the windows have a greater impact when it comes to comfort criteria, including the inner thermal envelope surface temperature.
Thermal comfort depends strongly on clothing insulation. Analysis, according to ASHRAE methodology, showed that operative temperature and humidity ratio in combination with a standard insulation of 0.5 clo mostly fall outside of the comfort zone, whereas for 1 clo, they fall mostly inside of the comfort zone on an annual basis. Based on PMV and PPD indices, the best comfort in the living room was obtained assuming 1 clo for the whole year, which gives almost 90% of the time within I, II, and III categories. In the bedroom (night), more than 70% of the PMV values fall within the comfort categories when assuming 3.7 clo (bed set plus clothing).
The occurrence of periods in which comfort parameters fall outside of I category, or even beyond the applicability of the PMV methodology, is a measure of the price paid for energy-saving solutions on the side of the building structure and the active systems. The heat pump power was correctly quantified according to the heat load of the building in the appropriate climate zone. Nevertheless, during very cold times (sometimes a temperature below −20 °C), the heat pump was not able to overcome these conditions. Similarly, the ground-coupled heat exchanger and bypass in the heat recovery unit were not sufficient to avoid overheating. Obviously, optimal conditions could be established with additional heating or active cooling. This, however, would have meant the loss of PH status and so was not used. Instead, the inhabitants dressed according to their individual needs. The results showed that clothing insulation can improve the comfort conditions up to I category for the most of time. As the survey confirmed, the inhabitants were generally satisfied with the microclimate conditions.

Author Contributions

Conceptualization, K.W. and J.R.; methodology, A.S.-S. and J.R.; software, J.R.; validation, K.W.; formal analysis, K.W.; investigation, A.S.-S.; resources, A.S.-S.; data curation, K.W.; writing—original draft preparation, K.W.; writing—review and editing, A.S.-S. and J.R.; visualization, A.S.-S. and K.W.; supervision, J.R. All authors have read and agreed to the published version of the manuscript.

Funding

This research was supported by European Union/European Regional Development Fund: “Passive house for everyone”, Operational Program Innovative Economy, Action 1.4 Support for goal-oriented projects of priority axis 1: Research and development of modern technologies, and action 4.1 Support for the implementation of R&D results of priority axis 4: Investments in innovative projects (2012).

Institutional Review Board Statement

Not applicable.

Informed Consent Statement

Not applicable.

Data Availability Statement

Not applicable.

Acknowledgments

We give a special gratitude to the house inhabitants, the Pawliczek family, for their friendly attitude and great endurance shown during the many years of investigation.

Conflicts of Interest

The authors declare no conflict of interest. The funders had no role in the design of the study; in the collection, analyses, or interpretation of data; in the writing of the manuscript, or in the decision to publish the results.

References

  1. Piasecki, M.; Fedorczak-Cisak, M.; Furtak, M.; Biskupski, J. Experimental Confirmation of the Reliability of Fanger’s Thermal Comfort Model—Case Study of a Near-Zero Energy Building (NZEB) Office Building. Sustainability 2019, 11, 2461. [Google Scholar] [CrossRef] [Green Version]
  2. Kisilewicz, T. Overheating of Low-Energy Buildings. Available online: http://beta.nis.com.pl/userfiles/editor/nauka/122013_n/Kisilewicz_12-2013.pdf (accessed on 9 June 2022).
  3. Mlakar, J.; Štrancar, J. Overheating in residential passive house: Solution strategies revealed and confirmed through data analysis and simulations. Energy Build. 2011, 43, 1443–1451. [Google Scholar] [CrossRef]
  4. O’Donovan, A.; Murphy, M.D.; O’Sullivan, P.D. Passive control strategies for cooling a non-residential nearly zero energy office: Simulated comfort resilience now and in the future. Energy Build. 2021, 231, 110607. [Google Scholar] [CrossRef]
  5. Fedorczak-Cisak, M.; Furtak, M.; Gintowt, J.; Kowalska-Koczwara, A.; Pachla, F.; Stypuła, K.; Tatara, T. Thermal and Vibration Comfort Analysis of a Nearly Zero-Energy Building in Poland. Sustainability 2018, 10, 3774. [Google Scholar] [CrossRef] [Green Version]
  6. Ballarini, I.; De Luca, G.; Paragamyan, A.; Pellegrino, A.; Corrado, V. Transformation of an Office Building into a Nearly Zero Energy Building (nZEB): Implications for Thermal and Visual Comfort and Energy Performance. Energies 2019, 12, 895. [Google Scholar] [CrossRef] [Green Version]
  7. Truonga, H.; Garvie, A.M. Chifley Passive House: A Case Study in Energy Efficiency and Comfort. Energy Procedia 2017, 121, 214–221. [Google Scholar] [CrossRef]
  8. Berr, S.; Whaley, D.; Davidson, K.; Saman, W. Near zero energy homes—What do users think? Energy Policy 2014, 73, 127–137. [Google Scholar] [CrossRef]
  9. Matzarakis, A.; Mayer, H.; Iziomon, M. Applications of a universal thermal index: Physiological equivalent temperature. Int. J. Biometeorol. 1999, 43, 76–84. [Google Scholar] [CrossRef]
  10. Höppe, P. The physiological equivalent temperature—A universal index for the biometeorological assessment of the thermal environment. Int. J. Biometeorol. 1999, 43, 71–75. [Google Scholar] [CrossRef]
  11. Fabbri, K. A Brief History of Thermal Comfort: From Effective Temperature to Adaptive Thermal Comfort. Indoor Therm. Comf. Percept. 2015, 7–23. [Google Scholar] [CrossRef]
  12. Myhren, J.; Holmberg, S. Comfort temperatures and operative temperatures in an office with different heating methods. In Proceedings of the 8th International Conference and Exhibition of the Healthy Building, Lisboa, Portugal, 4–8 June 2006. [Google Scholar]
  13. Zhang, S.; Lin, Z. Standard effective temperature based adaptive-rational thermal comfort model. Appl. Energy 2020, 264, 114723. [Google Scholar] [CrossRef]
  14. ISO 7730:2005; Ergonomics of the Thermal Environment—Analytical Determination and Interpretation of Thermal Comfort Using Calculation of the PMV and PPD Indices and Local Thermal Comfort Criteria. International Organization for Standardization: Geneva, Switzerland, 2005.
  15. EN 16798-1:2019; Energy Performance of Buildings. Ventilation for Buildings. Indoor Environmental Input Parameters for Design and Assessment of Energy Performance of Buildings Addressing Indoor Air Quality, Thermal Environment, Lighting and Acoustics. European Committee for Standardization: Brussels, Belgium, 2019.
  16. Humphreys, M.; Nicol, F. The validity of ISO-PMV for predicting comfort votes in every-day thermal environments. Energy Build. 2002, 34, 667–684. [Google Scholar] [CrossRef]
  17. Humphreys, M.; Nicol, J. Effects of measurement and formulation error on thermal comfort indices in the ASHRAE database of field studies. ASHRAE Trans. 2000, 106, 493–502. [Google Scholar]
  18. Havenith, G.; Holmér, I.; Parsons, K. Personal factors in thermal comfort assessment: Clothing properties and metabolic heat production. Energy Build. 2002, 34, 581–591. [Google Scholar] [CrossRef]
  19. Almeida, R.; Ramos, N.; de Freitas, V. Thermal comfort models and pupils’ perception in free-running school buildings of a mild climate country. Energy Build. 2016, 111, 64–75. [Google Scholar] [CrossRef]
  20. Gilani, S.; Khan, M.; Ali, M. Revisiting’s Fanger’s thermal comfort model using mean blood pressure as a bio-marker: An experimental investigation. Appl. Therm. Eng. 2016, 109, 35–43. [Google Scholar] [CrossRef]
  21. Pan, D.; Lin, Z.; Deng, S. A mathematical model for predicting the total insulation value of a bedding system. Build. Environ. 2010, 45, 1866–1872. [Google Scholar] [CrossRef]
  22. Lin, Z.; Deng, S. A study on the thermal comfort in sleeping environments in the subtropics—Measuring the total insulation values for the bedding systems commonly used in the subtropics. Build. Environ. 2008, 43, 905–916. [Google Scholar] [CrossRef]
  23. Lan, L.; Pan, L.; Lian, Z.; Huang, H.; Lin, Y. Experimental study on thermal comfort of sleeping people at different air temperatures. Build. Environ. 2014, 73, 24–31. [Google Scholar] [CrossRef]
  24. Lu, Y.; Nu, M.; Song, W.; Liu, Y.; Wang, M. Investigation on the total and local thermal insulation of the bedding system: Effects of filling materials, weights and body postures. Build. Environ. 2021, 204, 108–161. [Google Scholar] [CrossRef]
  25. Berardi, U. Clarifying the new interpretations of the concept of sustainable building. Sustain. Cities Soc. 2013, 8, 72–78. [Google Scholar] [CrossRef]
  26. Mahdavi, A.; Doppelbauer, E. A performance comparison of passive and low-energy buildings. Energy Build. 2010, 42, 1314–1319. [Google Scholar] [CrossRef]
  27. Marszal, A.; Heiselberg, P.; Bourrelle, J.; Musall, E.; Voss, K.; Sartori, K.; Napolitano, A. Zero Energy Building—A review of definitions and calculation methodologies. Energy Build. 2011, 43, 971–979. [Google Scholar] [CrossRef]
  28. Voss, K.; Musall, E.; Lichtmeß, M. From Low-Energy to Net Zero-Energy Buildings: Status and Perspectives. J. Green Build. 2011, 6, 46–57. [Google Scholar] [CrossRef]
  29. Sartori, I.; Napolitano, A.; Vossc, K. Net zero energy buildings: A consistent definition framework. Energy Build. 2012, 48, 220–232. [Google Scholar] [CrossRef] [Green Version]
  30. Altobello, A.; Misceo, M.; Russo, P.; Stefanizzi, P.; Vignola, I. Comparison of numerical and experimental performances of nZEB residential building in Putignano (Apulia Region). In Materials Science and Engineering, Proceedings of the IOP Conference Series: Materials Science and Engine, Palembang, Indonesia, 5–16 October 2019; IOP Publishing: Bristol, UK, 2019. [Google Scholar]
  31. Kampelis, N.; Sifakis, N.; Kolokotsa, D.; Gobakis, K.; Kalaitzakis, K.; Isidori, D.; Cristalli, C. HVAC Optimization Genetic Algorithm for Industrial Near-Zero-Energy Building Demand Response. Energies 2019, 12, 2177. [Google Scholar] [CrossRef] [Green Version]
  32. Xu, X.; Feng, G.; Chi, D.; Liu, M.; Dou, B. Optimization of Performance Parameter Design and Energy Use Prediction for Nearly Zero Energy Buildings. Energies 2018, 11, 3252. [Google Scholar] [CrossRef] [Green Version]
  33. Passive House Institute (PHI). Available online: https://passivehouse.com (accessed on 24 May 2022).
  34. Sadineni, S.; Madala, S.; Boehm, R. Passive building energy savings: A review of building envelope components. Renew. Sustain. Energy Rev. 2011, 15, 3617–3631. [Google Scholar] [CrossRef]
  35. PASSIPEDIA. What Is a Passive House? Available online: https://passipedia.org/basics/what_is_a_passive_house (accessed on 24 May 2022).
  36. The European Parliament and the Council of the European Union. Directive (EU) 2018/844 of the European Parliament and of the Council of 30 May 2018 Amending Directive 2010/31/EU on the Energy Performance of Buildings and Directive 2012/27/EU on Energy Efficiency; The European Parliament and the Council of the European Union: Brussels, Belgium, 2018. [Google Scholar]
  37. Ridley, I.; Bere, J.; Clarke, A.; Schwartz, Y.; Far, A. The side by side in use monitored performance of two passive and low carbon Welsh houses. Energy Build. 2014, 82, 13–26. [Google Scholar] [CrossRef]
  38. Ridley, I.; Clarke, A.; Bere, J.; Altamirano, H.; Lewis, S.; Durdev, M.; Farr, A. The monitored performance of the first new London dwelling certified to the Passive House standard. Energy Build. 2013, 63, 67–78. [Google Scholar] [CrossRef] [Green Version]
  39. Rohdin, P.; Molin, A.; Moshfegh, B. Experiences from nine passive houses in Sweden–indoor thermal environment and energy use. Build. Environ. 2014, 71, 176–185. [Google Scholar] [CrossRef] [Green Version]
  40. Schnieders, J.; Feist, W.; Rongen, L. Passive Houses for different climate zones. Energy Build. 2015, 105, 71–87. [Google Scholar] [CrossRef]
  41. Dahlstrøm, O.; Sørnes, K.; Eriksen, S.; Hertwich, E. Life cycle assessment of a single-family residence built to either conventional-or passive house standard. Energy Build. 2012, 54, 470–479. [Google Scholar] [CrossRef]
  42. Proietti, S.; Sdringola, P.; Desideri, U.; Zepparelli, F.; Masciarelli, F.; Castellani, F. Life Cycle Assessment of a passive house in a seismic temperate zone. Energy Build. 2013, 64, 463–472. [Google Scholar] [CrossRef]
  43. Badea, A.; Baracu, T.; Dinca, C.; Tutica, D.; Grigore, R.; Anastasiu, M. A life-cycle cost analysis of the passive house ‘POLITEHNICA’ from Bucharest. Energy Build. 2014, 80, 542–555. [Google Scholar] [CrossRef]
  44. Galvin, R. Are passive houses economically viable? A reality-based, subjectivist approach to cost-benefit analyses. Energy Build. 2014, 80, 149–157. [Google Scholar] [CrossRef]
  45. Stephan, A.; Crawford, R.; Myttenaere, K. A comprehensive assessment of the life cycle energy demand of passive houses. Appl. Energy 2013, 112, 23–34. [Google Scholar] [CrossRef] [Green Version]
  46. Chel, A.; Janssens, A.; De Paepe, M. Thermal performance of a nearly zero energy passive house integrated with the air–air heat exchanger and the earth?water heat exchanger. Energy Build. 2015, 96, 53–63. [Google Scholar] [CrossRef]
  47. Kylili, A.; Fokaides, P. European smart cities: The role of zero energy buildings. Sustain. Cities Soc. 2015, 15, 86–95. [Google Scholar] [CrossRef]
  48. Georges, L.; Skreiberg, Ø.; Novakovic, V. On the proper integration of wood stoves in passive houses: Investigation using detailed dynamic simulations. Energy Build. 2013, 59, 203–213. [Google Scholar] [CrossRef] [Green Version]
  49. Rekstad, J.; Meir, M.; Murtnes, E.; Dursun, A. A comparison of the energy consumption in two passive houses, one with a solar heating system and one with an air-water heat pump. Energy Build. 2015, 96, 149–161. [Google Scholar] [CrossRef]
  50. Moran, F.; Blight, T.; Natarajan, S.; Shea, A. The use of Passive House Planning Package to reduce energy use and CO2 emissions in historic dwellings. Energy Build. 2014, 75, 216–227. [Google Scholar] [CrossRef]
  51. Leardini, P.; Manfredini, M.; Callau, M. Energy upgrade to Passive House standard for historic public housing in New Zealand. Energy Build. 2015, 95, 211–218. [Google Scholar] [CrossRef]
  52. Sage-Lauck, J.; Sailor, D. Evaluation of phase change materials for improving thermal comfort in a super-insulated residential building. Energy Build. 2014, 79, 32–40. [Google Scholar] [CrossRef]
  53. Němeček, M.; Kalousek, M. Influence of thermal storage mass on summer thermal stability in a passive wooden house in the Czech Republic. Energy Build. 2015, 107, 68–75. [Google Scholar] [CrossRef]
  54. Radoń, J.; Wąs, K.; Flaga-Maryanczyk, A.; Schnotale, J. Experimental and theoretical study on hygrothermal long-term performance of outer assemblies in lightweight passive house. J. Build. Phys. 2018, 41, 299–320. [Google Scholar] [CrossRef]
  55. Wąs, K. Wpływ Konstrukcji Ściany Lekkiej Szkieletowej na Zjawiska Cieplno-Wilgotnościowe w Budynku Pasywnym (Impact of Light-Frame Wall Structure on Hygrothermal Performance in a Passive House). Ph.D. Thesis, Cracow University of Technology, Kraków, Poland, 2016. [Google Scholar]
  56. Kaklauskas, A.; Rute, J.; Zavadskas, E.; Daniuna, A.; Pruskus, V.; Bivainis, J.; Plakys, V. Passive House model for quantitative and qualitative analyses and its intelligent system. Energy Build. 2012, 50, 7–18. [Google Scholar] [CrossRef]
  57. Langer, S.; Bekö, G.; Bloom, E.; Widheden, A.; Ekbe, L. Indoor air quality in passive and conventional new houses in Sweden. Build. Environ. 2015, 93, 92–100. [Google Scholar] [CrossRef]
  58. Fokaides, P.; Christoforou, E.; Ilic, M. Performance of a Passive House under subtropical climatic conditions. Energy Build. 2016, 133, 14–31. [Google Scholar] [CrossRef]
  59. Radoń, J.; Wąs, K.; Flaga-Maryańczyk, A.; Antretter, F. Thermal Performance of Slab on Grade with Floor Heating in a Passive House. Tech. Trans. Civ. Eng. 2014, 3, 405–413. [Google Scholar]
  60. Nawalany, G.; Sokołowski, P. Building–Soil Thermal Interaction: A Case Study. Energies 2019, 12, 2922. [Google Scholar] [CrossRef] [Green Version]
  61. Michalak, P. Selected Aspects of Indoor Climate in a Passive Office Building with a Thermally Activated Building System: A Case Study from Poland. Energies 2021, 14, 860. [Google Scholar] [CrossRef]
  62. Thermishe Behaglikheit. Available online: http://www.bosy-online.de/thermische_Behaglichkeit.htm (accessed on 11 May 2022).
  63. ASHRAE Handbook—Fundamentals. Available online: https://www.ashrae.org/technical-resources/ashrae-handbook (accessed on 11 May 2022).
  64. Climate.OneBuilding.Org. Available online: https://climate.onebuilding.org/WMO_Region_6_Europe/POL_Poland/index.html (accessed on 11 May 2022).
  65. Foster, J.; Sharpe, T.; Poston, A.; Morgan, C.; Musau, F. Scottish Passive House: Insights into Environmental Conditions in Monitored Passive Houses. Sustainability 2016, 8, 412. [Google Scholar] [CrossRef]
Figure 1. South-west facade (a) and south-east facade (b).
Energies 15 04687 g001
Figure 2. Assembly variants of the outer wall: external plaster finishing (a) and siding on the external surface (b).
Energies 15 04687 g002
Figure 3. Heating and ventilation systems in the building.
Energies 15 04687 g003
Figure 4. Heat pump, ground heat exchanger, and weather station arrangement.
Energies 15 04687 g004
Figure 5. Location of measurement sensors.
Energies 15 04687 g005
Figure 6. Flowchart of the research.
Energies 15 04687 g006
Figure 7. Variability of the measured outer climate.
Energies 15 04687 g007
Figure 8. Extremes, mean value, and 25/75 percentiles for the temperature (a) and relative humidity (b) of the air in the living room and bedroom.
Energies 15 04687 g008
Figure 9. Air temperature during January in the analyzed rooms.
Energies 15 04687 g009
Figure 10. Internal air temperature and relative humidity against the comfort zones according to Leusden and Freymark [61].
Energies 15 04687 g010
Figure 11. Operative temperature and humidity ratio against the comfort zones in winter and summer [62].
Energies 15 04687 g011
Figure 12. Measured surface temperature in rooms (a) and the measured and calculated surface temperature in the bedroom (b).
Energies 15 04687 g012
Figure 13. Comfort according to Frank [62] in living room and bedroom.
Energies 15 04687 g013
Figure 14. Measurement and calculation based on operative temperature in living room during January.
Energies 15 04687 g014
Figure 15. Operative temperature for the living room and bedroom, obtained from the measurements and computer simulations.
Energies 15 04687 g015
Figure 16. The range of PMV values depending on the clothing insulation for the living room.
Energies 15 04687 g016
Figure 17. Monthly comfort category quota for the living room by clothing insulations of 1.0, 0.75, and 0.5 clo.
Energies 15 04687 g017
Figure 18. The range of PMV values depending on the clothing insulation for the bedroom.
Energies 15 04687 g018
Figure 19. Monthly comfort category quota for the bedroom with clothing insulations of 2.0 and 3.7 clo.
Energies 15 04687 g019
Table 1. Relevant parameters of the building.
ParameterValue
Average heat transfer coefficient of opaque, outer building walls0.08 W·m2·K1
Heat transfer coefficient of windows (3 glass panes)0.74 W·m−2·K−1
Solar heat gain coeficient (average)0.6
Efficient heat recovery ventilation unit93%
Airtightness, ACH0.5 h1
Heating energy demand7.5 kWh·m2·year1
Primary energy demand104.4 kWh·m2·year1
Table 2. R-Spearman correlation coefficients.
TemperatureRelative Humidity
BedroomLivingroomBathroomBedroomLivingroomBathroom
Bedroom1.0000.6800.8781.0000.8910.872
Livingroom0.6801.0000.6860.8911.0000.858
Bathroom0.8780.6861.0000.8720.8581.000
Table 3. Daily comfort categories in living room.
1 clo0.75 clo0.5 clo
Parameterhours%hours%hours%
I category202734.759910.31492.6
II category226838.8134323.02554.4
III category95116.3115319.73005.1
Beyond applicability—cool5038.6275047.1514188.0
Beyond applicability—warm991.700.000.0
Table 4. Night comfort categories in bedroom.
2.0 clo3.7 clo
Parameterhours%hours%
I category40313.884028.8
II category59020.285729.3
III category40313.839013.4
Beyond applicability—cool149751.338313.1
Beyond applicability—warm270.945015.4
Publisher’s Note: MDPI stays neutral with regard to jurisdictional claims in published maps and institutional affiliations.

