Abstract
The main purpose of this paper is to develop possible scenarios for reducing carbon dioxide (CO2) emissions in Serbia by switching from coal-fired to natural gas-fired electricity generation by the end of 2050. Accordingly, the challenges are to establish scenarios and identify measures that are best suited to all Western Balkan countries. In particular, this paper proposes a number of energy mix scenarios that offer some options for reducing CO2 emissions while maintaining an economic way of consumption. Projections of these reduction scenarios are obtained by combining the Kaya identity with the emission factor method. A simplified methodology based on sensitivity analysis is used as a source of data to estimate the nonstatistical uncertainty limits for the projections of the reduction scenarios. The sensitivity analysis is carried out using historical data from Serbia for the period from 1990 to 2019. In addition, a direct verification of the proposed methodology is performed based on historical data for 2020. The developed scenarios 1 and 2 show that CO2 emissions could be reduced by 10.94% and up to 74.44% from baseline in 1990, respectively. The obtained results are also contrasted with the data available for some other countries with similar experiences. Finally, it is found that the developed scenarios are achievable only at significantly decreased levels of coal-fired electricity generation.
1. Introduction
In the period from 1990 to 2018—except in 2009, when there was an outbreak of the influenza A (H1N1) pandemic—global energy-related CO2 emissions increased year to year [1,2]. According to [1,3], the global energy-related CO2 emissions in 2018 amounted to 33.5 Gt CO2 and were shared by economic sectors in the following manner: electricity and heat generation: 43.75%; transportation: 25.93%; industry: 19.33%; buildings: 9.04%; and other sectors: 1.95%. Coal-fired electricity generation and corresponding CO2 emissions decreased by 3% and 2%, respectively, in 2019, for the first time in history [4]. In addition, global energy-related CO2 emissions in 2019 were 0.1 Gt CO2 lower than in 2018 [1]. As primary energy demand dropped by nearly 4% in 2020 due to the COVID-19 pandemic, global energy-related CO2 emissions decreased by an additional 5.8% and amounted to 31.5 Gt CO2 [1]. The declines were caused by a sharp decline in CO2 emissions from the electricity and heat generation sector (the so-called energy sector), thanks to the expanding role of renewables (mainly wind and solar energy), fuel switching from coal (or lignite) to natural gas (NG), very mild winters during the period 2018–2021, and higher nuclear power output [4,5].
Although Serbia is not one of the most developed economies in the world and has no nuclear power plants, an increase in CO2 emissions from the energy sector in the period following 2018 was recorded in this country [6]. This is contrary to the global trend. According to [7], Serbian energy-related CO2 emissions in 2018 amounted to 44 Mt CO2 and were shared by economic sectors as follows: electricity and heat generation: 68.18%; transportation: 13.64%; industry: 9.09%; buildings: 2.27%; and other sectors: 6.82%. Regardless of an increased usage of renewables (such as hydro, wind, biomass, biogas, and solar energy), switching from solid and liquid fossil fuels to NG in the majority of district heating systems, and very mild winters during the given period, the mentioned increase in CO2 emissions was caused by an increased usage of coal in coal-fired power plants (CPPs). In addition, natural gas-fired power plants (NGPPs) contributed to a further increase in global energy-related CO2 and other greenhouse gas (GHG) emissions but to a significantly lower extent compared with CPPs. In the particular case of Serbia, since the second string of the TurkStream natural gas pipeline (the so-called Balkan Stream pipeline) became operational in the course of 2020 [8], special attention should be paid to the generation of electricity and heat from NG.
The release of methane (CH4), which is the second most abundant GHG after CO2, is of particular importance for the application of natural gas-fired combined heat and power (CHP) technology. Although CH4 is released into the atmosphere in smaller quantities than CO2, its ability to trap heat in the atmosphere is about 25 times greater [9]. Consequently, CH4 leaks are reported to nullify or reverse any climate change benefit experienced from the switch from solid and liquid fossil fuels to NG [10,11,12]. This does not apply in the case of Serbia because coals from the Kostolac and Kolubara basins have relatively small lower heating values and release enormous quantities of poisonous gases during combustion. This can be generalized to the other Western Balkan countries, namely: Bosnia and Herzegovina, Montenegro, North Macedonia, and Croatia, where some types of coals have a lower heating value higher than the ones used in Serbia. From this perspective, it is also important to note that energy-related GHG emissions are only a portion of the total anthropogenic GHG emissions and that global CO2 emissions rose as the worldwide economic activity recovered at the end of 2020.
Serbia itself is not at the cutting edge when it comes to global GHG emission reductions; however, according to [13], this country is among the 10% of countries in the world whose CPPs pollute the environment to the highest extent. In addition, environmental campaigners have taken legal action against the state-owned Public Enterprise Electric Power Industry of Serbia (PE EPS) for exposing Serbian and EU citizens to poisonous gases six times above the allowed limit, in breach of both national and international law [14]. Moreover, the EU is preparing a new tax for countries such as Serbia, where energy-related CO2 emissions are higher than allowed [15]. Accordingly, in the case of Serbia, as in most regions worldwide, there is already a significant international interest in the switch from coal-fired to natural gas-fired electricity generation, including renewables.
The top 10% of countries in the world with the most polluting CPPs are China, India, the United States, South Africa, South Korea, Germany, Ukraine, Poland, the United Kingdom, Kazakhstan, Russia, Japan, Serbia, Australia, Mexico, Israel, Romania, and Taiwan [13]. According to this list, Serbia takes 13th place, but with its CPPs of 4448 MW, it should actually be in 12th place. In Serbia and the majority of these countries, electricity generation by CPPs is also inefficient. For instance, the authors of [16] identify sources of polluting and inefficient electricity generation by CPPs in China. Large-scale measures taken to overcome one or both of these two issues in China are as follows: (i) switching from CPPs to natural gas-fired CHP plants [17,18]; (ii) replacing CPPs with photovoltaic (PV) power plants [19,20]; (iii) the use of wind power plants instead of CPPs [21,22]; (iv) implementing projects of flue gas-fired combined cooling, heating, and power (CCHP) plants [23,24]; and (v) the use of geothermal energy for district heating instead of coal-fired heating [25,26], etc.
In the case of Serbia, switching to NG currently represents the most suitable measure in the light of the reduction of local and regional GHG emissions. In addition, there are a number of publications on related topics, providing the readership with useful details about GHG emissions in Serbia in general [27,28], CO2 emissions from various types of coals used in Serbian CPPs [29,30], climate change policies and plans relating to the Southeast European countries [31,32], renewable energy development trends in Serbia and the other Western Balkan countries [33,34], and so on. Moreover, some papers deal with CPPs and/or NGPPs in other countries and regions of the world, namely: India [35], Germany [36], Turkey [37], Algeria [38], Asia-Pacific [12], Southeast Asia [39,40], South Korea [41], Egypt [42], etc. Accordingly, there is no paper reviewing the potential effects of the Balkan Stream pipeline on CO2 emissions in Serbia, reviewing planned NGPPs in Serbia, or dealing with possible scenarios and necessary measures for reducing CO2 emissions in Serbia by the end of 2050 (by means of natural gas-fired electricity generation).
In this paper, reliable projections are made of CO2 emissions reduction scenarios for the Serbian energy sector up to 2050, and a number of associated measures are then identified, answering the questions of how the transition from CPPs to NGPPs can reduce CO2 emissions, to what extent, and with which consequences. The projections are made based on the relevant data, actual state, and current plans, and the assumption that possible development trends of renewables in Serbia will follow the current predictions about the rising proportion of electricity generation from renewable energy sources (RESs) in the EU’s gross electricity demand up to 2050. In particular, the projections are made using the Kaya identity [43,44,45,46,47,48] and emission factor method [49,50], and by varying the levels of electricity generation from coal, NG, and RES and priorities related to the measure implementation, taking into account the political environment, status of legislation, actual state of the economy, energy sector responsiveness to new development trends, etc.
Specifically, the Kaya identity [43,44,45,46,47,48] is usually used for quantifying global CO2 emissions from anthropogenic sources (in Mt of CO2 per year) and is expressed as the product of the global population (in billions of persons), global gross domestic product (GDP) per capita (in current USD per year), energy intensity of global GDP (in TWh or TJ per billions of current USD), and CO2 intensity of the energy supply (in Mt of CO2 per TWh or TJ). The emission factor method [49,50] estimates direct GHG emissions from stationary combustion processes in line with the principles of the GHG protocol. In addition to the mentioned methods, there are many other methods that can be used to estimate global GHG emissions, such as the so-called IPAT model [47], Logarithmic Mean Divisia Index (LMDI) decomposition method [51], LMDI decomposition method based on energy allocation analysis [51], method of marginal emission factors [52], etc. Furthermore, a number of other methods that can be used for the same purpose are already outlined in [53]. In order to estimate the uncertainty limits for the projections, sensitivity analysis is performed using historical data from the Serbian energy sector for the period 1990–2019. The emission projections for 2020 are directly compared with the corresponding actual data. The results include all electricity generation capacities in Serbia, except the ones located in Kosovo.
2. Necessary Data and Methodology
Along with a number of data, the Kaya identity [43,44,45,46,47,48], necessary assumptions, and emission factor method [49,50] are used for the development of different projections of the annual CO2 emissions from the Serbian electricity generation sector. In addition, the Kaya identity factors are used as a basis for the introduction of all assumptions necessary for the purpose of applying the emission factor method. Afterwards, based on those projections, measures for the reduction of CO2 emissions up to the end of 2050 are defined.
2.1. The Kaya Identity and Historical Data
In the context of the effects of the electric power system and socioeconomic parameters on CO2 emissions, the original Kaya identity is adapted and expressed as follows [43,44,45,46,47,48]:
where Ea,t represents the annual CO2 emissions from the Serbian electricity generation sector in Mt CO2/y, P is the total population of Serbia in millions, G is the Serbian GDP in billions of current USD, and Cel is the annual gross electricity consumption of Serbia in TWh/y. These four parameters directly define the Kaya identity factors. Figure 1 and Figure 2 show the historical changes in the electric power system and socioeconomic parameters. It should be noted here that the values for Ea,t are taken from the annual reports of PE EPS or estimated based on the values of the specific energy consumption from the annual reports and other documentation of PE EPS. In addition, G/P is the Serbian GDP per capita in thousands of current USD per year, Cel/G is the electricity intensity of Serbian GDP in TWh per billion of current USD, and Ea,t/Cel is the CO2 intensity of the electricity supply in Mt CO2/TWh. These three ratios together with the population P represent the Kaya identity factors. Figure 3 shows the historical changes in the Kaya identity factors.
Figure 1.
Annual electricity generation in Serbia from various power plants [54,55,56,57].
Figure 2.
Changes in the parameters relevant for determining the Kaya identity factors [6,55,57,58,59,60,61,62,63,64].
Figure 3.
Changes in the Kaya identity factors.
As usual, in papers of this kind, projections of CO2 emission reduction scenarios are considered as emission inventories for a future period of time in which historical data are replaced by a number of logical expectations and assumptions [49,50]. According to the historical data from Figure 1, Figure 2 and Figure 3, all the parameters and factors have been affected by the national, regional, and global crises, such as the disintegration of the former Socialist Federal Republic of Yugoslavia (in 1991); the civil wars in Croatia (1991–1995) and Bosnia and Herzegovina (1992–1995) and the associated large waves of refugees; the economic sanctions imposed on the Federal Republic of Yugoslavia by the UN Security Council (between May 1992 and November 1995 and between October 1996 and October 2000); the NATO bombing campaign against the Federal Republic of Yugoslavia (March-June 1999); the Great Recession of 2008, referring to the economic downturn between 2008 and 2013, which coincided with the outbreak of the influenza A (H1N1) pandemic in 2009; and the global recession caused by the COVID-19 pandemic in 2019, 2020, and 2021. On the other hand, compared to EU countries that had already started activities to improve the operation of their power plants based on the relevant EU directives in the early 1990s, Serbia started the same activities after 2000. Thus, for example, due to the consequences caused by the COVID-19 pandemic, the completion and commissioning of NGPP Pančevo were postponed for more than one year compared to the original plans. This finally resulted in a substantial prolongation of the implementation period of the NGPP Pančevo project by approximately two years. In particular, it took four instead of the planned two years.
In addition, the total population of Serbia increased between 1990 and 1994 due to a high level of immigration while it decreased continuously since 1994 [65,66]. The GDP per capita in constant 2010 USD grew in Serbia from 1999 to 2020 but with some minor deviations: it significantly declined in 2019, and has not yet reached the level of 1990. Moreover, the Serbian gross electricity consumption grew from 1990 to 1998, had a decline of about 10% in 1999, also grew from 2000 to 2006, and has been approximately constant (at an average level of 33.481 TWh/y) since 2006. For the Serbian GDP in current USD (from Figure 2), Serbian GDP per capita (from Figure 3), and electricity intensity of Serbian GDP (from Figure 3), 2000 can be regarded as a ground-breaking year. This ground-breaking year coincides with the fact that the European integration process of Serbia started practically after the suspension of economic sanctions in 2000; that is, with the beginning of political and economic reforms in Serbia. During the whole period under consideration, there were several phases during which the annual CO2 emissions were increasing, and several phases during which they were decreasing. CO2 emissions were, between 1991 and 2005, below those of 1990, and since 2006, excluding 2014, they were above that level. Moreover, CO2 emissions showed a declining trend from 2011 to 2019 (Figure 2). This trend has coincided with a clear rising trend in the electricity generation from RESs (Figure 1), which is in accordance with the national strategy [67]. However, this reduction was 12.65%, and CO2 emissions did not reach the 1990 level, which certainly requires much more serious action in the direction of raising the share of RESs in the total generation of electricity. Table 1 shows how the amounts of renewable energy used for the generation of electricity and heat in Serbia relate to the national RES potential.

Table 1.
Structure of the exploitable RES potential in Serbia [68,69].
Furthermore, the changes in the electric power system and socioeconomic parameters, and the effects of the crises were directly reflected in the changes in the Kaya identity factors from Figure 3. The most important details that can be seen from this figure are that there are some trends in the changes in these factors since 2007, and that these trends can be further used to specify key assumptions and develop possible scenarios for reducing CO2 emissions in Serbia by 2050. In addition to this, multiplying the four factors from Figure 3 by each other produces the resultant curve (1) that is identical to curve representing the annual CO2 emissions from the Serbian electricity generation sector in Figure 2.
According to the historical changes in the Kaya identity factors in Figure 3, the following conclusions can be drawn: (i) Compared to 6.964 million in 2019, the total population of Serbia will decrease by an average of 0.54% annually during the period up to the end of 2050 and it will probably be about 5.8 million at this time. (ii) Compared to 6338.4 USD in 2019, the Serbian GDP per capita (in constant 2010 USD) will grow by an average of 1.93% annually by the end of 2030; in 2030, it will reach that of 1990 and it will continue to grow by 2% annually up to the end of 2050. (iii) By the end of 2050, the electricity intensity of Serbian GDP and CO2 intensity of the electricity supply will decrease or remain at the levels of the associated averages for the period 2007–2019.
2.2. Data on Existing and Planned CPPs and NGPPs
In order to develop possible scenarios for reducing CO2 emissions from the Serbian electricity generation sector by generating electricity from NG, it is necessary to have insight into the current and future state of CPPs and NGPPs. In particular, it is necessary to determine the average and potential values of performance indicators, annual CO2 emissions, and annual CO2 emission intensities for all the existing and planned CPPs and NGPPs, using the calculation method proposed in Appendix A [6,49,57,70,71,72].
For each CPP built before 2000, the average values of annual electricity generation (Qel) and hourly lignite consumption (mL) are determined based on five records (actual values) of Qel and mL for the years (t) from 2015 to 2019, respectively. In addition to this, the average values of hourly mazut consumption (mM), hourly naphtha consumption (mN), and annual number of operation hours (top) are determined based on the five estimates of mM, mN, and top for the years (t) from 2015 to 2019, respectively. Then, the average values of Qel, mL, mM, mN, and top are used for the determination of the average values of the electrical efficiency (ηel), annual CO2 emissions (Ea,t), and annual CO2 emission intensity (IEa). The same approach is also applied to each NGPP built before 2000, of course, bearing in mind that there is no NGPP that uses secondary fuels together with NG. For any NGPP built after 2000, a value of 7500 h/y is assumed for top while all other average performance indicators are taken directly from the manufacturers and from [73].
Table A1 lists the actual performance indicators, estimated annual CO2 emissions, and estimated annual CO2 emission intensities for Serbian CPPs and NGPPs built before 2000, for the period from 2015 to 2020. The average values of the performance indicators, annual CO2 emissions, and annual CO2 emission intensities for the existing Serbian CPPs and NGPPs are outlined in Table A2 and Table A3, respectively. Table A2 is entirely based on Table A1 while Table A3 is partly formed on the basis of Table A1. Table A1, Table A2 and Table A3 can be found in Appendix B [6,30,73,74,75].
The development of possible scenarios also requires overviews of CPPs and NGPPs, which should be constructed in Serbia during the next few decades. There are many different scenarios dealing with the estimation of the total demand for new CPPs, CPPs that need to be modernized, and CPPs that will be shut down during the period 2018–2024. All the scenarios are based on the EU directives 2001/80/EC [76] and 2010/75/EU [77], and the Energy Sector Development Strategy of the Republic of Serbia for the Period by 2025 with Projections by 2030 [67], which relies predominantly on the electricity generation in CPPs. Accordingly, this paper will not focus on these scenarios, but it will be based on the mentioned EU directives and strategy. In the case of planned CPPs and NGPPs, the calculation method from Appendix A is used again to determine the potential values of their performance indicators, annual CO2 emissions, and annual CO2 emission intensity. Specifically, the potential value of Qel for each planned CPP is determined using the actual lower heating values for lignite (LHVL) and mazut (LHVM), together with the assumed values for mL, mM, top, and ηel; that is, Equations (A6) and (A10). Similarly, in the case of each planned NGPP, the potential value for Qel is determined using the actual lower heating value for NG (LHVNG), and the assumed values for hourly NG consumption (mNG), top, and ηel. The potential values of the performance indicators, annual CO2 emissions, and annual CO2 emission intensities for planned CPPs and NGPPs are outlined in Table 2 and Table 3, respectively.
Table 2.
An overview of the potential values of the performance indicators, annual CO2 emissions, and annual CO2 emission intensity for the planned CPPs in Serbia [78].
Table 3.
An overview of the potential values of the performance indicators, annual CO2 emissions, and annual CO2 emission intensity for the planned NGPPs in Serbia [78,79].
2.3. Necessary Assumptions
The three conclusions derived from the historical changes in the Kaya identity factors and data presented in Table 2, Table 3, Table A2 and Table A3, are further used as a basis for assumptions necessary for the development of possible scenarios for reducing CO2 emissions. The mentioned assumptions are:
- Serbia will continue to base its electricity supply independence on electricity generation from lignite (in CPPs)—Scenario 1; or Serbia will redefine its electricity supply independence policy and base it on electricity generation in HPPs and RESs (i.e., Serbia will continue with the implementation of the so-called EU’s “20-20-20” targets)—Scenario 2.
- Electricity supply independence under Scenario 1 implies that a significant portion of the average annual gross electricity consumption of Serbia by the end of 2050 should be covered by CPPs.
- Newly built CPPs will be used only as a replacement for the old ones, and electricity generation from lignite, by the end of 2050, will not exceed the level of the average generation for the period 2015–2019.
- Serbia will continue with construction activities and investments in the area of RESs, and various development sub-scenarios in this area will also be possible.
- The construction of larger NGPPs will slow down or stop the construction of small NGPPs, and the generation of electricity in NGPPs built after 2000 will be constant up to the end of 2050.
- NGPPs Pančevo, Jug, and Voždovac have been completed in the period 2020–2021 and have started generating electricity at the beginning of 2022 while the construction of each of the four remaining NGPPs from Table 3 will take three years. They will be built in phases according to the one-by-one principle and will start generating electricity in 2025, 2028, 2031, and 2034.
- NGPP Novi Sad, built before 2000, will stop generating electricity at the end of 2026, i.e., when the new NGPP Novi Sad is built.
- Differences that may occur between the generated and consumed electricity amounts under Scenarios 1 and 2 will be exported.
2.4. Emission Factor Method
For the purpose of the application of the emission factor method, the annual CO2 emissions from the Serbian electricity generation sector are expressed as a function of time in the following manner [49,50]:
where qS,s(t) is the specific energy consumption (in GJ/GWh) for the sub-sector s in the year t, Qel,s(t) is the electricity generation (in GWh/y) for sub-sector s in the year t, and F′E,s(t) is the aggregated CO2 emission factor (in t CO2/GJ) for the sub-sector s in the year t.
The values of the specific energy consumption used for the existing CPPs (sub-sector s = 1), NGPPs built before 2000 (sub-sector s = 2), NGPPs built after 2000 (sub-sector s = 3), planned CPPs (sub-sector s = 4), and planned NGPPs (sub-sector s = 5) are 10,729.6, 14,004.1, 8541.4, 10,729.6, and 8348.5 GJ/GWh, respectively. Hence, it is assumed that the Serbian electricity generation sector consists of three sub-sectors in terms of historical CO2 emissions or five sub-sectors in terms of future CO2 emissions. The values used for Qel,s(t) are presented in Figure 1.
Since details on the fuels and processes are available for the three/five sub-sectors, the aggregated CO2 emission factor for the sub-sector s in the year t is estimated from the weighted CO2 emission factors for the associated fuel types as [50]:
where ps,k(t) is the share of a given fuel type within a given sub-sector (1, 2, 3, 4, or 5), FE,s,k(t) is the default CO2 emission factor for a given fuel type (in t CO2/GJ), and k is the type of fuel (k = L stands for lignite or coal, k = M for mazut, k = N for naphtha, and k = NG for natural gas). According to Table A1 and Table A2, for existing CPPs during the 2015–2019 period, the average shares of lignite, mazut, and naphtha were p1,L(t) = 0.9933, p1,M(t) = 0.006, and p1,N(t) = 0.0007, respectively. The same is applied to sub-sector s = 4 (that is, to planned CPPs from Table 2). For sub-sector 2, it is assumed that older NGPPs, in accordance with Table A1 and Table A3, have used only NG as fuel. This assumption is justified by the fact that in the last decade, older NGPPs have used only NG to generate electricity [6,55,57]. Previously, these NGPPs mainly used liquid fuels such as mazut, naphtha, or gasoline. For instance, until 2003, CHP Novi Beograd generated heat and electricity only from gasoline while today, it generates only heat from NG and mazut. This power plant had three units, where each of them consisted of a 32 MW turbine and a 40 MVA turbo generator. The amounts of electricity generated by CHP Novi Beograd during the 1990–2003 period are included in the corresponding annual electricity generations represented by pink curve with square markers and turquoise curve with x markers in Figure 1. In addition, newer NGPPs belonging to sub-sector 3 actually use only NG (Table A3). Accordingly, the shares relating to the fuel type used in existing NGPPs are p2,NG(t) = 1 for s = 2 and p3,NG(t) = 1 for s = 3. The same is applied to sub-sector s = 5 (that is, to planned NGPPs from Table 3). All the default CO2 emission factors are based on the 2006 IPCC Guidelines [49]. Therefore, the associated aggregated CO2 emission factors are F’E,1(t) = 0.100839 t CO2/GJ, F’E,2(t) = 0.0561 t CO2/GJ, F’E,3(t) = 0.0561 t CO2/GJ, F’E,4(t) = 0.100839 t CO2/GJ, and F’E,5(t) = 0.0561 t CO2/GJ.
2.5. Historical CO2 Emissions in Serbia
Insight into the applicability of the emission factor method can best be gained by using it for the determination of historical CO2 emissions that are known or can be estimated from other available and relevant data. Figure 4 shows a comparison between the available (official) and estimated values of historical CO2 emissions for the Serbian electricity generation sector in the period 1990–2020. For the period 2008–2020, according to this comparison, differences between, on one side, the official values and, on the other, the values estimated based on the country-specific and default CO2 emission factors are from −3.25 up to +1.56% and from +3.35 up to +7.94%, respectively. In addition, differences between the two curves representing the estimated values in Figure 4 amount to 6.06–6.85% for the entire period. The main reason for such differences in the period 1990–2020 is the use of country-specific CO2 emission factors to estimate CO2 emissions that are missing. Moreover, reports on the state of the environment in the PE EPS have been published regularly since 2002, and only official CO2 emissions for 2008 and the period 2010–2020 were available when writing this paper. Therefore, it is evident that the official data are underestimated by less than 10%, which represents a good starting point for estimating CO2 emissions by 2050, of course, if reliable assumptions can be made. Furthermore, it is interesting to note here that the share of power plants firing liquid fossil fuels and NG in the total CO2 emissions was the highest in 1990 and amounted to 3.72%.
Figure 4.
Historical annual CO2 emissions from Serbian CPPs and NGPPs [6,55,57].
2.6. Sensitivity Analysis
Sensitivity analysis and determination of the uncertainty limits within which CO2 emissions can be expected by the end of 2050 are performed on the basis of known data on historical annual CO2 emissions Ea,t(t) and electricity generation Qel,s(t) in CPPs and NGPPs for the period 1990–2019. In particular, values are determined of the coefficients linking CO2 emissions to electricity generation in CPPs and NGPPs for each year within the period 1990–2019. Each of these coefficients is calculated as a product of the corresponding values for the specific energy consumption qS,s(t) and the aggregated CO2 emission factor F’E,s(t) from Equation (2). In addition, these coefficients differ according to the power plant types.
Historical annual CO2 emissions Ea,t(t) and the expected values of and for the existing CPPs (s = 1), NGPPs built before 2000 (s = 2), and NGPPs built after 2000 (s = 3) are used for the calculation of CO2 emissions from the sub-sectors s = 1, 2, and 3 for each year t within the period 1990–2019, using the following three expressions:
where qS,1 = 10,729.6 GJ/GWh, qS,2 = 14,004.1 GJ/GWh, and qS,3 = 8541.4 GJ/GWh are the specific energy consumptions for the sub-sectors s = 1, 2, and 3, respectively; and F′E,1 = 0.100839 t CO2/GJ, F′E,2 = 0.0561 t CO2/GJ, and F′E,3 = 0.0561 t CO2/GJ are the aggregated CO2 emission factors for the sub-sectors s = 1, 2, and 3, respectively.
Accordingly, coefficients showing the sensitivity of CO2 emissions to electricity generation, for each of the three sub-sectors (s = 1, 2, and 3) and for each year t within the period 1990–2019, are obtained as:
Then, the mean values:
and the standard deviations:
for the sensitivity coefficients ps(t) are determined. In the previous equations for ps,av(t) and σp,s(t), the coefficient j represents the number of historical data used.
Specifically, it is assumed that the number of historical data used equals the number of years for which a forecast is made. Thus, for instance, for 2025, the coefficient j amounts to 2025–2019 = 6, which means that data from the recent past are used first as the most relevant for forecasting in the near future. Annual CO2 emissions for any sub-sector (s = 1, 2 or 3) can be determined as:
which is further used to develop the equation for the standard deviation of annual CO2 emissions:
that is,
which is valid for the year t of forecasting.
The previous equation can also be written in the following form:
where σE,s%(t) and σp,s%(t) are the corresponding percentage standard deviations.
Since annual CO2 emissions in the future, according to the emission factor method and the associated Equation (2), will come partly from the existing CPPs (s = 1), partly from NGPPs built before 2000 (s = 2), partly from NGPPs built after 2000 (s = 3), partly from planned CPPs (s = 4), and partly from planned NGPPs (s = 5), then an equivalent standard deviation that takes into account all types of electricity-generating plants must be determined. The equivalent standard deviation is determined based on the calculated values of the percentage standard deviations for the existing CPPs (s = 1), NGPPs built before 2000 (s = 2) and NGPPs built after 2000 (s = 3), and the amounts of electricity generated from the corresponding power plants in the considered scenarios Qel,s, where s = 1, 2, and 3, i.e.,
In the previous expression, CPPs and NGPPs that were planned to be built after 2019 are included in the first and third terms of the numerator, respectively. Based on this, Ea,max(t) = Ea,av(t)·[1 + 2·σE,s%(t)] and Ea,min(t) = Ea,av(t)·[1 − 2·σE,s%(t)] are identified as the upper and lower uncertainty limits for the projection of CO2 emissions in the year t, respectively; while ±2·σE,s%(t) is identified as a confidence interval with respect to the corresponding mean value Ea,av(t). In connection with this, the mean (expected) value of CO2 emissions for the year t of forecasting Ea,av(t) represents the value of CO2 emissions on the basis of which the corresponding projections are drawn in Section 4. The confidence interval of ±2·σE,s%(t) is adopted because this is the interval most commonly used in engineering to ensure that some projections belong to a particular interval with a probability of 95.45%.
3. Effects of the Balkan Stream and Natural Gas Sustainability
3.1. Potential Effects of the Balkan Stream on CO2 Emissions
In 2019, according to Table A3, the total annual consumption of NG for the needs of electricity generation in 20 Serbian NGPPs was approximately 133.4 million Sm3/y, whereas 35.8 million Sm3/y (or 26.82%) of this amount was obtained from Serbian NG fields while the remaining amount (73.18%) was imported from other countries. NGPPs from Table A3 labeled with the numbers 6–19 use NG from domestic sources, and are located in their vicinity and belong to NIS while the remaining six NGPPs use imported NG. According to Table 3, the amount of about 2.0292 billion Sm3 of NG per year will be required for the planned NGPPs. This amount is almost equal to the capacity of the Balkan Stream pipeline that is projected for Serbia, and which amounts to between 1.8 and 2 billion Sm3 of NG per year [8,80,81,82]. Accordingly, it can be concluded that after the construction (i.e., commissioning) of all the NGPPs from Table 3, the entire projected capacity of 1.8–2 billion Sm3/y will be used for the generation of electricity. However, the maximum amount of NG that could be delivered to Serbia by the Balkan Stream pipeline equals to 4.5 billion Sm3/y, which means that the difference between this maximum amount and the associated capacity projected for Serbia would be available to other consumers.
Based on Table A2 and Table A3, the average annual CO2 emission intensity for CPPs equals 1080.7 g CO2/kWh and is about twice as high as in the case of NGPPs. Accordingly, assuming the same annual number of operation hours for both old and new units, the replacement of each old CPP unit by a new NGPP unit of the same capacity would result in a reduction in the annual amount of CO2 emissions by more than 50%; namely, by 56.05% in the case of units A1 and A2 of the CPP Nikola Tesla A, 63.06% in the case of the CPP Kolubara A, 60.35% in the case of the CPP Morava, and 66.24% in the case of the CPP Kostolac A. In particular, the replacement of all old CPP units (having a total installed capacity of 1126 MW) will decrease the annual amount of CO2 emissions from Ea,t = 5.946 Mt CO2/y to Ea,t = 2.305 Mt CO2/y.
The planned NGPPs from Table 3 will be built in the vicinity of Serbian cities with the highest degree of industrialization, high traffic intensity, outdated district heating systems, and the like, and thus with the highest level of air pollution in the period from 2001 to 2019. These were, according to [83,84,85,86], the cities of Belgrade, Novi Sad, Niš, Subotica, Kragujevac, Pančevo, Obrenovac, Lazarevac, Valjevo, Kostolac, etc. Moreover, some of these cities are located very close to the existing and planned CPPs (from Table 2 and Table A2, respectively) while Belgrade was the most polluted city in the world for a few times during 2019 [87,88]. For instance, the cities of Obrenovac, Lazarevac, Valjevo, and Belgrade are located near the Kolubara basin, that is, the largest existing Serbian CPPs, and so on. Figure 5 shows the layout of existing and planned CPPs and NGPPs with respect to the part of the Balkan Stream pipeline running across Serbia and with respect to two local NG pipeline systems.
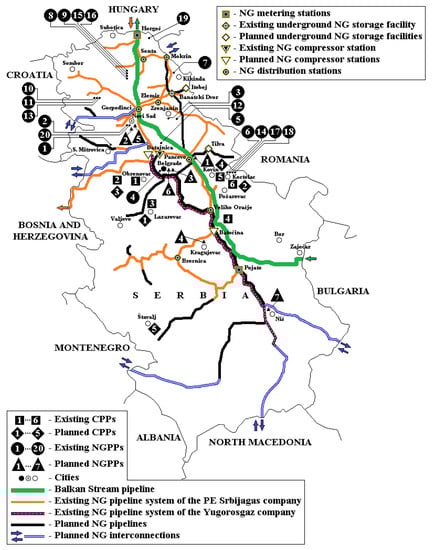
Figure 5.
The layout of the existing and planned CPPs and NGPPs with respect to the part of the Balkan Stream pipeline running across Serbia and with respect to local NG pipeline systems.
Therefore, it is obvious that the Balkan Stream pipeline, together with NGPPs that will be supplied by it, will significantly reduce the annual amounts of CO2 emissions from the Serbian electricity generation sector, and the levels of air pollution in the largest Serbian cities.
According to Figure 5, for all old CPPs, and for most of the planned ones, it can be said that they are or will be built in the Kolubara and Kostolac basins, that is, near the city of Belgrade. As for the existing 20 NGPPs, 15 of them are located north of Belgrade, i.e., in Vojvodina, where domestic NG fields are located and where the NG infrastructure is almost completely developed; while four of them are located in the Kostolac basin (east of Belgrade), and one in Belgrade. Accordingly, it is clear that the Balkan Stream pipeline has intensified planning in order to build new NGPPs in the Belgrade area and in the southern parts of the country; namely: two in Belgrade, where there is a well-developed NG infrastructure, and one each in Kragujevac and Niš, whose local NG distribution networks are not yet developed.
3.2. Natural Gas Sustainability
Serbia is a developing country that produces, stores, and imports NG. The total annual production of NG, which was delivered to the Serbian transmission and distribution system, was 293 million Sm3 in 2019, which is 12.5% less than the production in 2018 [54]. In 2019, a total of 2.609 billion Sm3 was available for domestic consumption from: domestic production, underground storage (in Banatski Dvor), and imports, and 2.325 billion Sm3 of NG was consumed [54]. Most of NG is imported from Russia under a long-term agreement [89]. Imports of NG from Russia under long-term and other agreements amounted to 2.197 billion Sm3 in 2019, and all required quantities were imported over the Hungarian transmission system [54]. In 2019, 8% less NG was consumed than in 2018. Consumption of NG in residential buildings increased by about 5% while in heating power plants, it decreased by slightly less than 9%, and in industry, it decreased by more than 9% [54]. In particular, the scope of NG in Serbia, in terms of CO2 emission reduction, mainly lies in the energy (heat generation) and industry sectors. Accordingly, the concept of sustainability with regard to NG is very important for Serbia.
In order to establish whether NG can be used as transition fuel in the achievement of the sustainable energy solutions, together with reducing CO2 emissions, an STEEP analysis is carried out in accordance with the procedure proposed in [90]. The sustainability parameters/dimensions considered in the STEEP analysis are the following [90]: social (S), technological (T), economic (E), environmental (E), and political (P). These five parameters form the so-called STEEP framework. The STEEP framework has one parameter less than the most commonly used PESTEL framework [90], and that is the legal parameter (L). The STEEP framework is applied to the case of Serbia with the aim of identifying the key drivers and potential barriers for each existing issue. All key drivers and potential barriers identified are outlined in Table 4. The STEEP analysis carried out in [90] covered the following countries: India, Norway, Iran, and the UK, which gives readers the opportunity to contrast the case of Serbia with these countries.
Table 4.
STEEP parameters in the case of Serbia.
4. Results and Discussion
Scenario 1 or Scenario 2 can further be divided into a number of possible sub-scenarios. Figure 6 shows the region of possible sub-scenarios within Scenario 1.

Figure 6.
Region of possible sub-scenarios for annual CO2 emissions from the Serbian electricity generation sector together with the corresponding upper and lower limits of uncertainty for the period 2020–2050, taking into account national targets relating to the independence of the electricity supply, that is, Scenario 1.
Appendix C gives an overview of six of the many possible sub-scenarios within Scenario 1. These sub-scenarios are shown together with their upper and lower limits of uncertainty in Figure A1. According to Figure A1, Sub-scenario 1-1 surrounds the region of possible sub-scenarios from the upper side while the Sub-scenario 1-6 surrounds the region from the lower side. Sub-scenario 1-1 assumes that, by the end of 2040, the generation of electricity from lignite should be at the level of the average generation of electricity from lignite for the period 2015–2019, and then it should start to decrease by 3% annually until it reaches 70% of the given average. According to Sub-scenario 1-6, by the end of 2030, the generation of electricity from lignite should be reduced by 3% annually until it reaches 70% of the average electricity generation from lignite for the period 2015–2019, and then it should remain unchanged until the end of 2050.
Regarding Scenario 1 and Figure 6, the following should be observed: (i) Each of the possible sub-scenarios predicts that CO2 emissions from the Serbian electricity generation sector should finally be equal to 22.248 Mt CO2/y, which means that under each of these sub-scenarios, CO2 emissions could be reduced by 10.94% compared to the corresponding estimated value of 1990. (ii) Sub-scenarios similar to Sub-scenario 1-1 would at first have rising trends and then declining trends while sub-scenarios similar to Sub-scenario 1-6 would have non-rising trends during the entire period under consideration. (iii) The wavy parts of these sub-scenarios illustrate the potential effects of the phased construction and commissioning of the planned NGPPs on CO2 emissions from the Serbian electricity generation sector by 2034. (iv) According to these sub-scenarios, there is a possibility that annual CO2 emissions from the Serbian electricity generation sector should significantly exceed that of 1990, specifically reaching 30.063 Mt CO2/y. (v) If Serbia, for some reason, gives up or alters its position on the accession to the EU, then it can be said with some confidence that the actual scenario of reducing CO2 emissions from the Serbian electricity generation sector by 2050 could be between Sub-scenarios 1-1 and 1-6.
In addition, six of all possible sub-scenarios within Scenario 2 are overviewed in Appendix C and shown in Figure A2. At the same time, Figure A2 shows the corresponding upper and lower uncertainty limits. According to Figure A2, Sub-scenarios 2-1 and 2-5 surround the region of possible sub-scenarios from the upper and lower sides, respectively. Sub-scenario 2-1 assumes that, in 2020, the generation of electricity from lignite should be at the level of the average generation of electricity from lignite for the period 2015–2019, and then it should be decreased annually by the amount of electricity generated in planned NGPPs. In accordance with Sub-scenario 2-5, the annual gross electricity consumption should be reduced by 20% by 2050, the generation of electricity from lignite should be reduced annually by the amounts of electricity generated in planned NGPPs and RESs, and by the amount of the decline in the annual gross electricity consumption, and everything else should be the same as in Sub-scenarios 2-3 and 2-4 (which are defined in Appendix C). The region of possible sub-scenarios within Scenario 2 is presented in Figure 7.
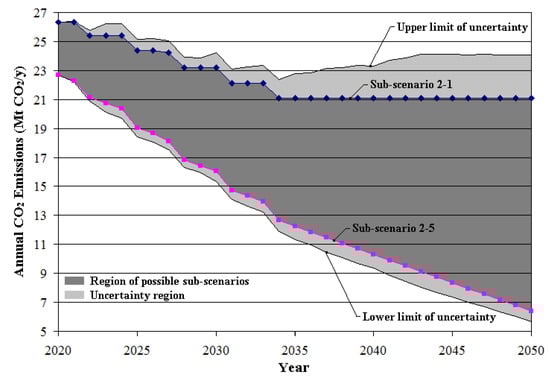
Figure 7.
Region of possible sub-scenarios for annual CO2 emissions from the Serbian electricity generation sector together with the corresponding upper and lower limits of uncertainty for the period 2020–2050, taking into account the EU’s “20-20-20” targets, that is, Scenario 2.
Regarding Scenario 2 and Figure 7, the following should be noted: (i) Each of the possible sub-scenarios shows that annual CO2 emissions from the Serbian electricity generation sector can finally be significantly lower than that of 1990. (ii) Each of these sub-scenarios is in line with the EU’s “20-20-20” targets. (iii) It seems that zero CO2 emissions from the Serbian electricity generation sector cannot be reached at the end of 2050. (iv) Sub-scenario 2-5 appears to be the best possible scenario for the Serbian electricity generation sector. (v) If Serbia decides to achieve the EU’s “20-20-20” targets and accelerate the EU accession process, then it is evident that the actual scenario of reducing CO2 emissions from the Serbian electricity generation sector by 2050 could be one of the sub-scenarios from Figure 7.
In connection with these projections, the application of the proposed methodology also resulted in an underestimation of CO2 emissions for 2020. This can best be seen from the comparison between, on one side, the yellow curve with triangle markers or official CO2 emissions from Figure 4 and, on the other, the results presented in Figure 6 or Figure 7. CO2 emissions in 2020 amounted to 26.525 Mt CO2/y in accordance with yellow curve with triangle markers from Figure 4, and 28.381 Mt CO2/y in accordance with the official data. Based on Figure 6 and Figure 7, CO2 emissions in 2020, according to Sub-scenario 1-1 or Sub-scenario 2-1, amounted to 26.311 Mt CO2/y. This value is lower by 0.81% and 7.29% if compared to the CO2 emissions of 26.525 and 28.381 Mt CO2/y, respectively. From the point of view of engineering, these differences are reasonable for the proposed estimation procedure. Therefore, it is obvious that CO2 emissions from the Serbian electricity generation sector in 2020 correspond to Scenario 1; that is, Sub-scenario 1-1.
It is interesting to see what the shares of certain technologies were in the total electricity generation in Serbia in 2020 and what they might be after the construction of all the NGPPs from Table 3. The actual shares of electricity generation for 2020 and projected shares of electricity generation according to Sub-scenario 2-4 (defined in Appendix C) for 2034 are represented by bars (a) and (b) in Figure 8, respectively. The projected shares (b) in Figure 8 are obtained assuming that the annual electricity generation and the amount of electricity generated in HPPs in 2034 should be the same as the ones for 2019, that the annual gross electricity consumption in 2034 should be the same as the average one for the period 2006–2019, and that electricity generation in CPPs in 2034 should be reduced by the amounts of electricity generated in all NGPPs built after 2000 and RESs, and, at the same time, increased by the amount of electricity generated in NGPPs built before 2000.

Figure 8.
Electricity generation in Serbia: (a) in 2020—actual data [55]; and (b) in 2034—a projection according to Sub-scenario 2-4.
Figure 8 clearly shows that there is a possibility that Serbia can remain independent in terms of the electricity supply even if electricity generation from lignite falls slightly below 30%. However, in the case of Serbia, the RESs construction campaign must be continued, and the construction of planned HPPs with higher capacities must begin as soon as possible. Moreover, it is evident that new players will appear in the Serbian electricity generation sector. The companies that are building NGPPs in Serbia and which are most interested in the success of the Balkan Stream project could certainly be these new players, namely: NIS and Gazprom Energoholding Serbia. As for electricity generation, NIS has been generating electricity since 2012 and has been selling a portion of that electricity amount to the PE EPS. Figure 9 shows the annual amounts of electricity generated and sold by NIS during the period 2012–2020, and the appropriate projections for 2022. The projections are obtained assuming that the amount of electricity consumed (internally) by NIS in 2022 could be the same as in 2020 (i.e., 405.74 GWh/y). According to Figure 8 and Figure 9, assuming that the total amount of electricity generated in Serbia in 2022 could be the same as the one in 2020, the share of electricity generation of NIS in the total electricity generation for 2022 could be 3.6%. Under the same assumptions, after the commissioning of NGPPs 4-7 with a total installed capacity of 1000 MW, the share of electricity generated by NIS could reach the order of 24% (bar (b) in Figure 8).
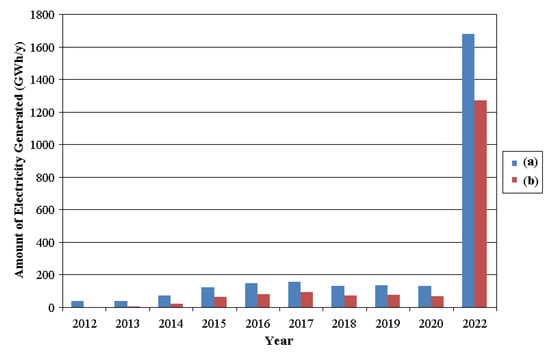
Figure 9.
Actual annual amounts and projections of electricity generated by NIS [91]: (a) total generation of electricity, and (b) electricity sold.
Based on all the considerations, a set of applicable measures to ensure that Serbia will remain independent in terms of the electricity supply and at the same time maximally reduce CO2 emissions from its electricity generation sector is as follows:
- The share of CPPs in the total annual amount of electricity consumed in Serbia should be 28%. It should also be ensured that this share can be additionally increased by up to the share of NGPPs (i.e., by up to 24%), if necessary.
- The construction of planned HPPs with lager generation capacities must be carried out simultaneously with the construction of RESs and completed as soon as possible. This measure has no alternative.
- The construction of RESs should be continued according to the trend from 2020 or intensified even more. If possible, the share of RESs in the total annual amount of electricity consumed in Serbia should be increased up to 27% (of course, without taking into account the share of larger HPPs).
- The annual gross electricity consumption of Serbia should be reduced by up to 20% by means of the implementation of projects in the areas of smart cities, smart infrastructure, and energy-efficient industries.
5. Conclusions
Compared to CO2 emissions from the Serbian electricity generation sector for 1990, CO2 emissions obtained under Scenarios 1 and 2 could be reduced by 10.94% and by up to 74.44%, respectively. In addition, for the same annual number of operation hours, the replacement of each old CPP by a new NGPP of the same generation capacity can reduce the corresponding annual CO2 emissions by at least 50%. Moreover, new large players have been appearing in the Serbian electricity generation sector, which represents the next logical step in the deregulation of the local electricity market. In connection with this, it was found that, by 2034, the share of NGPPs owned by these players in the total annual amount of electricity consumed in Serbia can reach 24%. Furthermore, if Serbia relies unreservedly on the generation of electricity in NGPPs, giving up the technology of conventional CPPs, then its electricity generation sector could, for the first time, be dependent on the import of NG. Accordingly, Serbia can remain independent in terms of the electricity supply only if the share of CPPs in the total annual amount of electricity consumption amounts between 28% and 52%.
The proposed methodology combining the Kaya identity with the emission factor method was developed and successfully applied in order to estimate the potential annual CO2 emissions from the Serbian electricity generation sector by the end of 2050. According to the proposed methodology, the future CO2 emissions were probably underestimated by less than 10%, which is reasonable because such differences result from the use of the default CO2 emission factors (taken from the 2006 IPCC Guidelines) instead of the country-specific ones. In addition to this, the EU’s “20-20-20” targets are achievable in the case of the Serbian electricity generation sector by 2050 while zero CO2 emissions are not. The proposed methodology was successfully verified based on historical data for 2020, and it was pointed out that the CO2 emissions for 2020 correspond to Sub-scenario 1-1.
It was also found that the annual CO2 emissions from the Serbian electricity generation sector were reduced by 12.65% in the period 2011–2019 and that they did not reach the 1990 level. Moreover, it was established that the share of RESs in the annual amount of electricity generated in Serbia reached 4.21% for the first time in 2020. Undoubtedly, the reduction in CO2 emissions coincided with the increase in electricity generation from RESs. However, it is possible that the unusually mild winters in the period 2011–2020 also contributed to this outcome. Finally, having in mind the need to ensure that Serbia should remain independent in terms of the electricity supply, a set of measures necessary for the reduction of CO2 emissions from the Serbian electricity generation sector was also identified.
Future research directions are a direct comparison of the proposed methodology to that used by the PE EPS, a study of the country-specific CO2 emission factors including the generation of electricity and heat, and overviews of possible scenarios for reducing other energy-related GHG emissions in Serbia.
Author Contributions
Conceptualization, D.K. and M.M.; methodology, D.K. and I.R.; software, D.A.; validation, D.K. and D.A.; formal analysis, D.K., M.M., I.R. and D.A.; investigation, D.K. and M.M.; resources, D.K. and I.R.; data curation, D.K.; writing—original draft preparation, D.K. and M.M.; writing—review and editing, D.K., M.M., I.R. and D.A.; visualization, D.K. and M.M.; supervision, D.K. and D.A.; funding acquisition, D.K., M.M. and D.A. All authors have read and agreed to the published version of the manuscript.
Funding
This paper was based on research conducted within the program No. NIO 200155 funded by the Ministry of Education, Science, and Technological Development of the Republic of Serbia.
Data Availability Statement
The data used in this paper are available on request from the corresponding author.
Acknowledgments
The authors would like to thank the management team of the PE Electric Power Industry of Serbia for providing the necessary data on Serbian coal-fired power plants, as well as Vladica Mijailović, Ana Sivački, Nikola Krstić, and Aleksandra Kuč for their technical assistance and proofreading.
Conflicts of Interest
The authors declare no conflict of interest.
Nomenclature
| CCHP | Combined cooling, heating, and power |
| CHP | Combined heating and power |
| CPP | Coal-fired power plant |
| EU | The European Union |
| GDP | Gross domestic product |
| GHG | Greenhouse gas |
| HPP | Hydro power plant |
| IEA | The International Energy Agency |
| IPAT | The impact by population, affluence, and technological development |
| IPCC | The Intergovernmental Panel on Climate Change |
| KC | Clinical Center (or Klinički Centar, in Serbian) |
| LMDI | Logarithmic Mean Divisia Index |
| NATO | North Atlantic Treaty Organization |
| NIS | The Petroleum Industry of Serbia |
| NG | Natural gas |
| NGPP | Natural gas-fired power plant |
| PE EPS | The Public Enterprise Electric Power Industry of Serbia |
| PESTEL | P–political, E–economic, S–social, T–technological, E–environmental, and L–legal |
| PUC | Public Utility Company |
| PV | Photovoltaic |
| RES | Renewable energy source |
| STEEP | S–social, T–technological, E–economic, E–environmental, and P–political |
| UK | The United Kingdom |
| UN | The United Nations |
| USA | The United States of America |
| USD | United States Dollar |
| BUSD | Billion of current USD |
| GJ/GWh | Gigajoule per gigawatt-hour |
| GJ/Sm3 | Gigajoule per standard cubic meter |
| GJ/t | Gigajoule per ton |
| Gt CO2 | Gigaton of CO2 |
| GWh/y | Gigawatt-hour per year |
| g CO2/kWh | Gramme of CO2 per kilowatt-hour |
| h/y | Hour per year |
| kt CO2/y | Kiloton of CO2 per year |
| kUSD/y | Thousand of current USD per year |
| k 2010 USD | Thousand of constant 2010 USD |
| Mt CO2 | Megaton of CO2 |
| Mt CO2/TWh | Megaton of CO2 per terawatt-hour |
| Mt CO2/y | Megaton of CO2 per year |
| MW | Megawatt |
| MWth | Thermal megawatt |
| Sm3 | Standard cubic meter |
| Sm3/h | Standard cubic meter per hour |
| Sm3/y | Standard cubic meter per year |
| TJ | Terajoule |
| TWh | Terawatt-hour |
| TWh/BUSD | Terawatt-hour per billion of current USD |
| TWh/y | Terawatt-hour per year |
| t CO2/GJ | Ton of CO2 per gigajoule |
| t CO2/y | Ton of CO2 per year |
| t/h | Ton per hour |
| t/y | Ton per year |
Appendix A. Calculation of CO2 Emissions
For the calculation of the annual direct CO2 emissions from stationary combustion of fuels, and associated annual CO2 emission intensities, the following performance indicators of CPPs and NGPPs were used: Qel—the annual electricity generation in GWh/y, LHVi—the lower heating value of a specific fuel type in GJ/t or GJ/Sm3, Mi—the annual fuel consumption in t/y or Sm3/y, FE,i—the default value of direct CO2 emission factor for stationary combustion of a specific fuel type in the electricity generation sector in t CO2/GJ, and mi—the hourly fuel consumption in t/h or Sm3/h. In addition, the subscript i = L, M, N, or NG represents a specific fuel type, namely: the subscripts L, M, N, and NG stand for lignite (or coal), mazut (i.e., residual fuel oil), naphtha, and NG, respectively. The actual values for Qel, LHVi, Mi, FE,i, mL, and mNG are taken from [6,49,57,70,71] and from the official web page of the PE EPS while the values for mM and mN are estimated based on the known actual values in the following manner:
where:
represents the estimated annual number of operation hours for a specific CPP or NGPP in h/y.
For Serbian CPPs, lignite is the basic fuel while mazut and naphtha are secondary. In order to accelerate combustion processes, the secondary fuels are added to the basic fuel, before being fed to the combustion system. Although Serbian NGPPs do not need any secondary fuel for electricity generation, two of them can use mazut instead of NG (as an alternative fuel), and one simultaneously uses biomass for the generation of heat. The lower heating values for mazut, naphtha, and NG are LHVM = 40.86, LHVN = 42.1, and LHVNG = 0.0342 GJ/Sm3, respectively. The lower heating values for different types of lignite used in Serbian CPPs are given in Table A1, Appendix B. The default values of direct CO2 emission factors for stationary combustion of lignite, mazut, naphtha, and NG are based on the 2006 IPCC Guidelines for National Greenhouse Gas Inventories [49]. According to [49], the direct CO2 emission factors for lignite, mazut, naphtha, and NG are FE,L = 0.101, FE,M = 0.0774, FE,N = 0.0733, and FE,NG = 0.0561 t CO2/GJ, respectively. The required values for the hourly consumptions of lignite/coal, mazut, naphtha, and NG are given in Table 1, Table 2, Table A1, Table A2 and Table A3; that is, in Section 2 and Appendix B.
The annual direct CO2 emissions from stationary combustion of a combination of fuels (lignite and mazut; lignite and naphtha; lignite, mazut and naphtha; NG only; or coal and mazut) for a specific CPP or NGPP in t CO2/y are calculated by means of [49]:
or:
where Ea,i represents the annual direct CO2 emissions from stationary combustion of a specific fuel type in t CO2/y, Mi is the annual consumption of a specific fuel type in t/y or Sm3/y, mi is the hourly consumption of a specific fuel type in t/h or Sm3/h, and top is the estimated annual number of operation hours for the CPP or NGPP under consideration in h/y.
The annual amount of heat released from stationary combustion of a combination of fuels in GWh/y is:
or:
where Qf,i is the annual amount of heat released from stationary combustion of a specific fuel type in GWh/y.
In Equations (A3)–(A6), the estimated, average, or potential values for Ea,t, Ea,i, Qf, and Qf,i are required to be calculated using the corresponding values of Mi, mi, and top. Moreover, the average values for mi and top are obtained based on the five corresponding estimates relating to the years (t) from 2015 to 2019, i.e.,
and:
respectively, while the average value for Mi is estimated as:
Furthermore, the actual and average values of mL for a specific CPP, or of mNG for a specific NGPP, are assumed to be constant and mutually equal.
Accordingly, the electrical efficiency for a specific CPP or NGPP in percent is:
where Qel is the annual electricity generation in GWh/y, and Qf is the annual amount of heat released from stationary combustion of a combination of fuels in GWh/y. In this case, the values for ηel, Qel, and Qf may be the actual, average, or potential. The average value for Qel is obtained based on five appropriate actual values relating to the years (t) from 2015 to 2019, i.e.,
Finally, for a CPP or NGPP in the case when heat generation is not taken into account, an annual CO2 emission intensity IEa in g CO2/kWh (estimated, average, or potential) is calculated as the ratio of the corresponding annual direct CO2 emissions from stationary combustion of a combination of fuels Ea,t in t CO2/y, and the corresponding annual electricity generation Qel in GWh/y [72], i.e.,
If a CPP or NGPP uses only one type of fuel, Equation (A12) reduces to the following form:
where FE,i is in t CO2/GJ, and ηel in percent. In particular, this equation can be obtained by substituting Equations (A3), (A5) and (A10) into (A12), or by substituting Equations (A4), (A6) and (A10) into (A12).
Appendix B. CO2 Emissions from the Existing CPPs and NGPPs
Overviews of the actual, estimated, and average values for the performance indicators, annual CO2 emissions, and annual CO2 emission intensity of existing CPPs and NGPPs in Serbia are given in this appendix. Table A1 shows a periodic overview of the actual and estimated data on the CPPs and NGPPs built before 2000 while Table A2 and Table A3 show overviews of the average data on all existing CPPs and all existing NGPPs, respectively.
Table A1.
A periodic overview of the actual performance indicators, estimated annual CO2 emissions, and estimated annual CO2 emission intensities for Serbian CPPs and NGPPs built before 2000 [6] *.
Table A1.
A periodic overview of the actual performance indicators, estimated annual CO2 emissions, and estimated annual CO2 emission intensities for Serbian CPPs and NGPPs built before 2000 [6] *.
| CPP or NGPP and LHVi ** | Parameter | Unit | 2015 | 2016 | 2017 | 2018 | 2019 | 2020 | |
|---|---|---|---|---|---|---|---|---|---|
| Nikola Tesla A which uses the lignite having LHVL = 6.7 GJ/t | Qel | GWh/y | 9693.3 | 10,844 | 8357.098 | 7878 | 8571.08 | 9075.7 | |
| Fuel | mL | t/h | 2510 | 2510 | 2510 | 2510 | 2510 | 2510 | |
| mM | t/h | 2.552 | 1.312 | 1.511 | 3.614 | 3.01 | 3.119 | ||
| top | h/y | 5831.4 | 6635.1 | 5732.4 | 5529.7 | 5862.4 | 6243.8 | ||
| ηel | % | 35.36 | 34.87 | 31.09 | 30.28 | 31.03 | 30.88 | ||
| Ea,t | Mt CO2/y | 9.952 | 11.297 | 9.764 | 9.445 | 10.024 | 10.667 | ||
| IEa | g CO2/kWh | 1026.7 | 1041.8 | 1168.3 | 1198.9 | 1169.6 | 1175.3 | ||
| Nikola Tesla B which uses the lignite having LHVL = 6.7 GJ/t | Qel | GWh/y | 8196.2 | 6418 | 7750.348 | 7733.1 | 7937.29 | 7960.86 | |
| Fuel | mL | t/h | 1770 | 1770 | 1770 | 1770 | 1770 | 1770 | |
| mM | t/h | 1.747 | 3.979 | 3.058 | 1.585 | 2.486 | 1.634 | ||
| top | h/y | 6709.9 | 5403.1 | 6843.8 | 7115.2 | 7223.3 | 7225 | ||
| ηel | % | 36.86 | 35.57 | 34.02 | 32.71 | 32.95 | 33.26 | ||
| Ea,t | Mt CO2/y | 8.074 | 6.54 | 8.263 | 8.578 | 8.688 | 8.691 | ||
| IEa | g CO2/kWh | 985.1 | 1019 | 1066.2 | 1109.3 | 1094.6 | 1091.7 | ||
| Kolubara A which uses the lignite having LHVL = 6.28 GJ/t | Qel | GWh/y | 803.1 | 706 | 780.746 | 560.1 | 560.15 | 560.24 | |
| Fuel | mL | t/h | 493.5 | 493.5 | 493.5 | 493.5 | 493.5 | 493.5 | |
| mN | t/h | 1.26 | 0.499 | 0.45 | 0.725 | 0.741 | 0.88 | ||
| top | h/y | 2999.5 | 2742.2 | 2960.1 | 2230.5 | 2242.2 | 2093.4 | ||
| ηel | % | 30.58 | 29.7 | 30.45 | 28.88 | 28.74 | 30.72 | ||
| Ea,t | Mt CO2/y | 0.951 | 0.863 | 0.931 | 0.703 | 0.707 | 0.661 | ||
| IEa | g CO2/kWh | 1183.6 | 1221.8 | 1192 | 1255.6 | 1261.9 | 1179.8 | ||
| Morava which uses the lignite having LHVL = 7.78 GJ/t | Qel | GWh/y | 335.4 | 294 | 390.184 | 443.5 | 453.86 | 491.93 | |
| Fuel | mL | t/h | 170 | 170 | 170 | 170 | 170 | 170 | |
| mM | t/h | 0.578 | 0.571 | 0.567 | 0.208 | 0.37 | 0.162 | ||
| mN | t/h | 0.218 | 0.195 | 0.103 | 0.096 | 0.084 | 0.063 | ||
| top | h/y | 2441.1 | 2238.1 | 2941.6 | 3478.6 | 3712.9 | 3749 | ||
| ηel | % | 36.49 | 34.92 | 35.37 | 34.22 | 32.96 | 35.47 | ||
| Ea,t | Mt CO2/y | 0.332 | 0.304 | 0.399 | 0.47 | 0.5 | 0.503 | ||
| IEa | g CO2/kWh | 990.4 | 1035.3 | 1023 | 1059 | 1100.6 | 1023.4 | ||
| Kostolac A which uses the lignite having LHVL = 7.8 GJ/t | Qel | GWh/y | 1742.9 | 2042 | 2063.031 | 2010.4 | 2070.76 | 1671.07 | |
| Fuel | mL | t/h | 410 | 410 | 410 | 410 | 410 | 410 | |
| mN | t/h | 0.192 | 0.181 | 0.188 | 0.242 | 0.35 | 0.443 | ||
| top | h/y | 6544.2 | 7103.5 | 7513.1 | 6979.5 | 7145.4 | 5933.6 | ||
| ηel | % | 29.9 | 32.28 | 30.83 | 32.32 | 32.47 | 31.52 | ||
| Ea,t | Mt CO2/y | 2.118 | 2.298 | 2.431 | 2.26 | 2.316 | 1.925 | ||
| IEa | g CO2/kWh | 1215 | 1125.5 | 1178.4 | 1124 | 1118.3 | 1151.8 | ||
| Kostolac B which uses the lignite having LHVL = 7.8 GJ/t | Qel | GWh/y | 4245.9 | 4711 | 4798.8 | 4329.3 | 3575.74 | 4571.73 | |
| Fuel | mL | t/h | 800 | 800 | 800 | 800 | 800 | 800 | |
| mM | t/h | 1.053 | 0.65 | 0.56 | 0.751 | 0.868 | 0.692 | ||
| top | h/y | 6958.8 | 7496.6 | 7738.7 | 6862.4 | 5546.7 | 6941.5 | ||
| ηel | % | 34.96 | 36.1 | 35.64 | 36.22 | 36.98 | 37.83 | ||
| Ea,t | Mt CO2/y | 4.409 | 4.74 | 4.891 | 4.341 | 3.511 | 4.39 | ||
| IEa | g CO2/kWh | 1038.4 | 1006.2 | 1019.2 | 1002.8 | 981.9 | 960.3 | ||
| Sum | Ea,t | Mt CO2/y | 25.835 | 26.052 | 26.679 | 25.797 | 25.745 | 26.837 | |
| Novi Sad | Qel | GWh/y | 44.9 | 90 | 185.359 | 238.3 | 336.65 | 192.19 | |
| Fuel | mNG | Sm3/h | 53047.7 | 53047.7 | 53047.7 | 53047.7 | 53047.7 | 53047.7 | |
| top | h/y | 360.6 | 700.3 | 1425 | 1837.9 | 2485.7 | 1406.1 | ||
| ηel | % | 24.71 | 25.5 | 25.81 | 25.73 | 26.87 | 27.12 | ||
| Ea,t | Mt CO2/y | 0.0367 | 0.0713 | 0.145 | 0.1871 | 0.253 | 0.143 | ||
| IEa | g CO2/kWh | 817.3 | 791.9 | 782.4 | 785 | 751.5 | 744.6 | ||
* The NGPPs Zrenjanin and Sremska Mitrovica are excluded from this table because they did not generate electricity during the period from the beginning of 2015 to the end of 2019. ** LHVL stands for the lower heating value of lignite.
Table A2.
An overview of the average performance indicators, average annual CO2 emissions, average annual CO2 emission intensities, and some other related information for the existing Serbian CPPs [6].
Table A2.
An overview of the average performance indicators, average annual CO2 emissions, average annual CO2 emission intensities, and some other related information for the existing Serbian CPPs [6].
| No. | CPP * and Commencement of Operation | Installed Electricity Generation Units and Their Powers | Average Electrical Efficiency | Thermal Energy | Average Fuel Consumption | Average Annual Number of Operation Hours | Average Annual CO2 Emissions ** | Average Annual CO2 Emission Intensity ** | ||
|---|---|---|---|---|---|---|---|---|---|---|
| Basic | Secondary | |||||||||
| Lignite | Mazut | Naphtha | ||||||||
| mL | mM | mN | ||||||||
| MW | % | MWth | t/h | t/h | t/h | h/y | Mt CO2/y | g CO2/kWh | ||
| 1 | Nikola Tesla A, 1970–1979 | 2 × 210 + 1 × 329 + 1 × 308.5 + 1 × 340 + 1 × 347.5 = 1745 | 32.61 | 197.6 | 2510 | 2.4 | 0 | 5918.2 | 10.097 | 1113.4 |
| 2 | Nikola Tesla B, 1983–1985 | 2 × 650 = 1300 | 34.37 | 0 | 1770 | 2.571 | 0 | 6659.1 | 8.03 | 1055.6 |
| 3 | Kolubara A, 1956–1979 | 3 × 32 + 1 × 65+ 1 × 110 = 271 | 29.77 | 120 | 493.5 | 0 | 0.735 | 2634.9 | 0.831 | 1218.1 |
| 4 | Morava, 1969 | 1 × 125 = 125 | 34.58 | 0 | 170 | 0.459 | 0.139 | 2962.5 | 0.401 | 1046.7 |
| 5 | Kostolac A, 1967–1980 | 1 × 100+1 × 210 = 310 | 31.58 | 130 | 410 | 0 | 0.231 | 7057.1 | 2.284 | 1150.4 |
| 6 | Kostolac B, 1987–1991 | 2 × 348.5 = 697 | 35.93 | 0 | 800 | 0.776 | 0 | 6920.6 | 4.379 | 1010.7 |
| Sum | 4448 | – | 447 | 6153.5 | 6.206 | 1.105 | – | 26.022 | – | |
* All CPPs listed in this table belong to the PE EPS. ** For each CPP, it is assumed that the average annual CO2 emissions and average annual CO2 emission intensity for any future year shall correspond to the averages obtained for the period from the beginning of 2015 to the end of 2019, using the proposed calculation method.
According to Table A2, the average values of IEa for the existing Serbian CPPs range between 1010.7 (in the case of CPP Kostolac B) and 1218.1 g CO2/kWh (in the case of CPP Kolubara A). In addition, according to Table A3, the average values of IEa for the existing Serbian NGPPs range between 459 (in the case of NGPP Zapad) and 774.2 g CO2/kWh (in the case of NGPP Novi Sad). It is also evident that these increases in IEa coincided with a reduction in the electrical efficiency ηel of the CPPs in Table A2 and of the NGPPs in Table A3, regardless of the commencement date of operation. When definition (A12) takes into account heat generation, it becomes apparent that IEa can have a significantly lower value when compared to the corresponding value from Table A2 or Table A3. This applies to each CPP or NGPP that generates both electricity and heat. This could certainly be the topic of a future study.
Table A3.
An overview of the average performance indicators, average annual CO2 emissions, average annual CO2 emission intensities, and some other related information for the existing Serbian NGPPs [6,73].
Table A3.
An overview of the average performance indicators, average annual CO2 emissions, average annual CO2 emission intensities, and some other related information for the existing Serbian NGPPs [6,73].
| No. | NGPP * and Commencement of Operation | Installed Electricity Generation Units and Their Powers | Average Electrical Efficiency | Thermal Energy | Average Fuel Consumption | Average Annual Number of Operation Hours | Average Annual CO2 Emissions | Average Annual CO2 Emission Intensity |
|---|---|---|---|---|---|---|---|---|
| NG | ||||||||
| mNG | ||||||||
| MW | % | MWth | Sm3/h | h/y | kt CO2/y | g CO2/kWh | ||
| 1 | Sremska Mitrovica, 1977 | 1 × 32 = 32 | 30 | 33 | 9453 ** | 0 **** | 0 **** | 673.2 |
| 2 | Novi Sad, 1981–1984 | 1 × 135 + 1 × 110 = 245 | 26.09 | 355 | 53047.7 *** | 1361.9 | 138.612 ***** | 774.2 ***** |
| 3 | Zrenjanin, 1989 | 1 × 120 = 120 | 32 | 140 | 19693.8 *** | 0 **** | 0 **** | 631.1 |
| 4 | Toplana KC (heating plant in the City of Belgrade), 2008 ****** | 1 × 1.819 = 1.819 | 43.3 | 1.807 | 466.3 | 7500 | 6.7099 | 466.4 |
| 5 | Imlek (dairy company in Padinska Skela), 2011 | 1 × 1.415 = 1.415 | 41.9 | 1.492 | 374.5 | 7500 | 5.3889 | 482 |
| 6 | Sirakovo, Aug 2013 | 1 × 0.85 = 0.85 | 39.9 | 0.904 | 181.4 | 7500 | 2.6103 | 506.2 |
| 7 | Kikinda, Nov 2013 | 1 × 0.995 = 0.995 | 41.3 | 1.1 | 254.2 | 7500 | 3.6578 | 489 |
| 8 | Velebit 1, Dec 2013 | 1 × 0.995 = 0.995 | 42.6 | 1.04 | 270.1 | 7500 | 3.8866 | 474.1 |
| 9 | Velebit 2, Dec 2013 | 1 × 0.995 = 0.995 | 42.6 | 1.04 | 270.1 | 7500 | 3.8866 | 474.1 |
| 10 | Srbobran 1, Aug 2014 | 1 × 0.995 = 0.995 | 41.5 | 1.1 | 474.7 | 7500 | 6.8308 | 486.7 |
| 11 | Srbobran 2, Aug 2014 | 1 × 0.995 = 0.995 | 41.5 | 1.1 | 474.7 | 7500 | 6.8308 | 486.7 |
| 12 | Boka, Sep 2014 | 1 × 0.329 = 0.329 | 41.4 | 0.37 | 81.2 | 7500 | 1.1684 | 487.8 |
| 13 | Turija, Dec 2014 | 1 × 0.995 = 0.995 | 40.6 | 1.118 | 206.8 | 7500 | 2.9758 | 497.4 |
| 14 | Bradarac, Dec 2014 | 1 × 0.3 = 0.3 | 40.9 | 0.345 | 60.1 | 7500 | 0.8648 | 493.8 |
| 15 | Velebit 3, Jan 2015 | 1 × 1 = 1 | 41.2 | – | 415.6 | 7500 | 5.9803 | 490.2 |
| 16 | Velebit 4, Jan 2015 | 1 × 1 = 1 | 41.2 | – | 415.6 | 7500 | 5.9803 | 490.2 |
| 17 | Sirakovo 2-1, Jun 2015 | 1 × 1 = 1 | 43.1 | – | 207.8 | 7500 | 2.9902 | 468.6 |
| 18 | Sirakovo 2-2, Jun 2015 | 1 × 1 = 1 | 43.1 | – | 207.8 | 7500 | 2.9902 | 468.6 |
| 19 | Majdan, Aug 2016 | 1 × 2.41 = 2.41 | 39.5 | – | 1250.1 | 7500 | 17.9885 | 511.3 |
| 20 | Zapad (heating plant in the City of Novi Sad), Oct 2016 | 3 × 3.328 = 9.984 | 44 | 10.035 | 2541.3 | 7500 | 36.5684 | 459 |
| Sum | 424.077 | – | 549.451 | 90,346.8 | – | 255.9206 | – | |
* NGPPs 1-3 belong to the PE EPS, NGPP 4 belongs to the Clinical Center of Serbia (Srb. Klinički Centar Srbije), NGPP 5 belongs to the dairy company Imlek, NGPPs 6-19 belong to NIS, and NGPP 20 belongs to the PUC Novosadska Toplana Novi Sad. NGPPs 1-3 are equipped with typical steam turbines while the other NGPPs use internal combustion engines that operate at fixed rotational speeds. ** The NGPP Sremska Mitrovica simultaneously uses NG for the generation of electricity and biomass for the generation of heat. *** The NGPP Novi Sad and NGPP Zrenjanin can use mazut as fuel instead of the typically used NG. **** During the period from 2015 to 2019, only heat was generated in the NGPP Zrenjanin and NGPP Sremska Mitrovica. ***** For the NGPP Novi Sad, it is assumed that the average annual CO2 emissions and average annual CO2 emission intensity for any future year shall correspond to the averages obtained for the period from the beginning of 2015 to the end of 2019, using the proposed calculation method. ****** The NGPP Toplana KC can use mazut as fuel instead of the typically used NG. Since 2011, the Clinical Center of Serbia has been selling electricity generated from this NGPP to the PE EPS.
In addition, there are CO2 emission intensities, whose values are usually obtained by conducting experiments for different CPPs. In the EU member countries, a CPP with an assumed 40% efficiency generates electricity with an average annual CO2 emission intensity of about 850 g CO2/kWh [74]. This is unfortunately not the case with the existing CPPs in Serbia, whose average annual CO2 emission intensity, according to [30,74,75], ranges between 880 and 1340 g CO2/kWh. The lower and upper bounds of this range correspond to the lignite types from the Kostolac and Kolubara basins, respectively. The CPP Kostolac A and CPP Kostolac B use lignite from the Kostolac basin while the others use lignite from the Kolubara basin. Accordingly, an average annual CO2 emission intensity that can be used for a Serbian CPP is 1150 g CO2/kWh [30]. This certainly agrees with the results obtained using the proposed calculation method.
Appendix C. An Overview of Some Possible Sub-Scenarios
Scenario 1 or Scenario 2 from Section 2.3, for example, are divided into six possible sub-scenarios. Accordingly, six possible sub-scenarios within Scenario 1 are as follows:
Sub-scenario 1-1: From 2019 to the end of 2040, electricity generation in CPPs should be at the level of the average electricity generation in CPPs for the period 2015–2019, and after 2040, it should start to decrease by 3% annually until it reaches 70% of the given average.
Sub-scenario 1-2: From 2019 to the end of 2030, electricity generation in CPPs should be at the level of the average electricity generation in CPPs for the period 2015–2019, and after 2030, it should start to decrease by 2% annually until it reaches 70% of the given average, and then it should not change by the end of 2050.
Sub-scenario 1-3: From 2019 to the end of 2030, electricity generation in CPPs should be at the level of the average electricity generation in CPPs for the period 2015–2019, and after 2030, it should start to decrease by 3% annually until it reaches 70% of the given average, and then it should not change by the end of 2050.
Sub-scenario 1-4: From 2019 to the end of 2050, electricity generation in CPPs should be reduced by 1% annually until it reaches 70% of the average electricity generation in CPPs for the period 2015–2019.
Sub-scenario 1-5: From 2019 to the end of 2035, electricity generation in CPPs should be reduced by 2% annually until it reaches 70% of the average electricity generation in CPPs for the period 2015-2019, and then it should not change by the end of 2050.
Sub-scenario 1-6: From 2019 to the end of 2030, electricity generation in CPPs should be reduced by 3% annually until it reaches 70% of the average electricity generation in CPPs for the period 2015-2019, and then it should not change by the end of 2050.
In addition, six possible sub-scenarios within Scenario 2 are:
Sub-scenario 2-1: In 2020, electricity generation in CPPs should be at the level of the average electricity generation in CPPs for the period 2015-2019, and then it should be reduced annually by the amount of electricity generated in the planned NGPPs (Table 3).
Sub-scenario 2-2: In the period 2020-2050, electricity generation from RESs should be at the corresponding level of 2019 and should amount to 3.79% of the average annual gross electricity consumption of Serbia for the period 2006-2019 (i.e., 3.79% of 33.481 TWh/y). In the same period, electricity generation in CPPs should be reduced annually by the amounts of electricity generated in the planned NGPPs and RESs.
Sub-scenario 2-3: In the period 2020-2050, in regard to the corresponding level of 2019, electricity generation from RESs should be additionally increased, on an annual basis, by 0.2% of the average annual gross electricity consumption of Serbia for the period 2006-2019. This should be an RES share of 10% in the average annual gross electricity consumption. In the same period, electricity generation in CPPs should be reduced annually by the amounts of electricity generated in the planned NGPPs and RESs.
Sub-scenario 2-4: According to this sub-scenario, the share of RESs in the average annual gross electricity consumption of Serbia should be 20% by the end of 2050, and everything else is the same as in the case of Sub-scenario 2-3.
Sub-scenario 2-5: According to this sub-scenario, the annual gross electricity consumption of Serbia should be reduced by 20% (or 0.645% annually) by the end of 2050 (in the period from 2020 until the end of 2050). In addition, electricity generation in CPPs should be reduced annually by the amounts of the electricity generated in the planned NGPPs and RESs, and by the amount of the decline in the annual gross electricity consumption of Serbia. Everything else remains the same as in the case of Sub-scenario 2-4.
Sub-scenario 2-6: According to this sub-scenario, the annual gross electricity consumption of Serbia should be increased by 20% (or 0.645% annually) by the end of 2050 (in the period from 2020 until the end of 2050). In addition, electricity generation in CPPs should be reduced annually by the amounts of the electricity generated in the planned NGPPs and RESs and increased by the amount of the rise in the annual gross electricity consumption of Serbia. Everything else remains the same as in the case of Sub-scenario 2-4.
These sub-scenarios, that is, the projections of the annual CO2 emissions from the Serbian electricity generation sector corresponding to Scenarios 1 and 2, are illustrated in Figure A1 and Figure A2, respectively. The appropriate upper and lower limits of uncertainty for each of the projections are also shown in Figure A1 and Figure A2. Each uncertainty region between two corresponding limits is colored light grey.
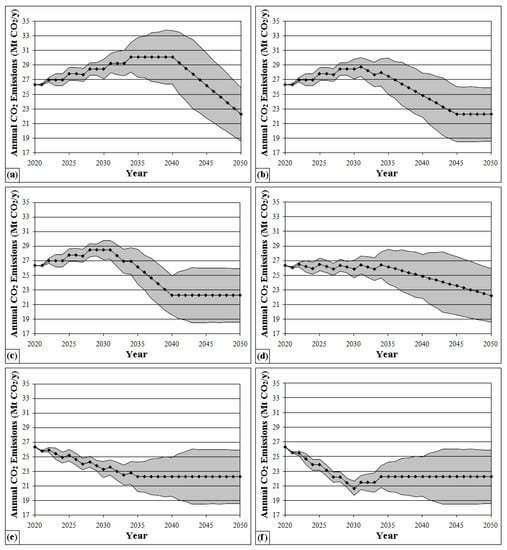
Figure A1.
Projections of annual CO2 emissions from the Serbian electricity generation by the end of 2050, taking into account national targets relating to the independence of the electricity supply, that is, Scenario 1, namely: (a) Sub-scenario 1-1; (b) Sub-scenario 1-2; (c) Sub-scenario 1-3; (d) Sub-scenario 1-4; (e) Sub-scenario 1-5; and (f) Sub-scenario 1-6.
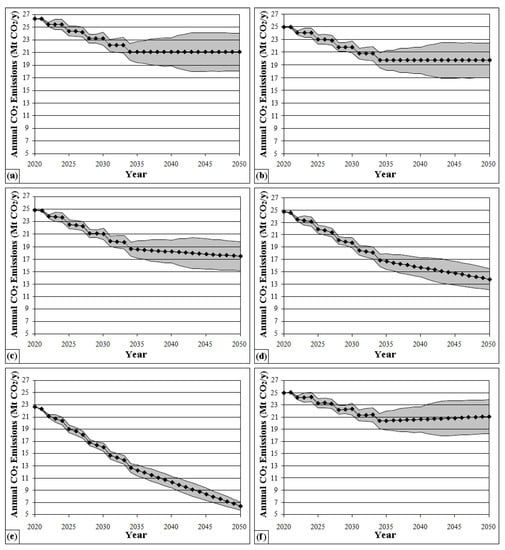
Figure A2.
Projections of annual CO2 emissions from the Serbian electricity generation sector by the end of 2050, taking into account the EU’s “20-20-20” targets, that is, Scenario 2, namely: (a) Sub-scenario 2-1; (b) Sub-scenario 2-2; (c) Sub-scenario 2-3; (d) Sub-scenario 2-4; (e) Sub-scenario 2-5; and (f) Sub-scenario 2-6.
References
- International Energy Agency (IEA). Global Energy Review: CO2 Emissions in 2020. 2 March 2021. Available online: https://www.iea.org/articles/global-energy-review-co2-emissions-in-2020 (accessed on 1 June 2022).
- World Health Organization (WHO). Influenza A (H1N1) Outbreak. 2009. Available online: https://www.who.int/emergencies/situations/influenza-a-(h1n1)-outbreak (accessed on 18 June 2022).
- International Energy Agency (IEA). CO2 Emissions from Fuel Combustion: Overview. July 2020. Available online: https://www.iea.org/reports/co2-emissions-from-fuel-combustion-overview (accessed on 1 June 2022).
- EMBER. 2020 Global Electricity Review. March 2020. Available online: https://ember-climate.org/wp-content/uploads/2020/03/Ember-2020GlobalElectricityReview-Web.pdf (accessed on 1 June 2022).
- International Energy Agency (IEA). Global CO2 Emissions in 2019. 11 February 2020. Available online: https://www.iea.org/articles/global-co2-emissions-in-2019 (accessed on 1 June 2022).
- Public Enterprise Electric Power Industry of Serbia (PE EPS). Reports on the State of the Environment in the PE ‘Electric Power Industry of Serbia’ for 2010–2020. 2011–2021. Available online: http://www.eps.rs/cir/Pages/Sredina.aspx (accessed on 1 June 2022). (In Serbian language).
- International Energy Agency (IEA). Country Profile: Serbia. 2020. Available online: https://www.iea.org/countries/serbia (accessed on 1 June 2022).
- Dastan, S.A. Negotiation of a cross-border natural gas pipeline: An analytical contribution to the discussions on Turkish Stream. Energy Policy 2018, 120, 749–760. [Google Scholar] [CrossRef]
- Nalbandian, H. Climate Implications of Coal-to-Gas Substitution in Power Generation; IEA Clean Coal Centre: London, UK, 2015; Available online: https://usea.org/sites/default/files/042015_Climate%20implications%20of%20coal-to-gas%20substitution%20in%20power%20generation_ccc248.pdf (accessed on 1 June 2022).
- Traber, T.; Fell, H.-J. Natural Gas Makes No Contribution to Climate Protection; Energy Watch Group—EWG: Berlin, Germany, 2019; Available online: http://energywatchgroup.org/wp-content/uploads/EWG_Natural_Gas_Study_September_2019.pdf (accessed on 1 June 2022).
- Cowern, N.; Russell-Jones, R. Global Warming Impact of a Switch from Coal to Gas-Fired Electricity Generation in the UK: Evidence Towards a Better Solution; The Climate Change Committee: London, UK, 2016; Available online: https://www.theccc.org.uk/wp-content/uploads/2016/07/Onshore-petroleum-evidence-submitted-by-Cowern-and-Russell-Jones.pdf (accessed on 1 June 2022).
- Dong, K.; Sun, R.; Li, H.; Liao, H. Does natural gas consumption mitigate CO2 emissions: Testing the environmental Kuznets curve hypothesis for 14 Asia-Pacific countries. Renew. Sustain. Energy Rev. 2018, 94, 419–429. [Google Scholar] [CrossRef]
- Maamoun, N.; Kennedy, R.; Jin, X.; Urpelainen, J. Identifying coal-fired power plants for early retirement. Renew. Sustain. Energy Rev. 2020, 126, 109833. [Google Scholar] [CrossRef]
- European Environmental Bureau. Serbia’s Public Electricity Company Faces Court for Breaching Toxic Emission Limits. 26 January 2021. Available online: https://eeb.org/serbias-public-electricity-company-faces-court-for-breaching-toxic-emission-limits/?fbclid=IwAR3hJDWH7TQ3L26ZxvX5R-IGdyIGcBQn7E4N0sFDsPZ0GZ-Efp61fvkfAVY (accessed on 1 June 2022).
- Center for Investigative Journalism of Serbia. Investigative Stories: New EU Tax that Affects Serbia—Citizens and Businesses Will Lose. 25 March 2021. Available online: https://www.cins.rs/en/new-eu-tax-that-affects-serbia-citizens-and-businesses-will-lose/ (accessed on 1 June 2022).
- Eguchi, S.; Takayabu, H.; Lin, C. Sources of inefficient power generation by coal-fired thermal power plants in China: A metafrontier DEA decomposition approach. Renew. Sustain. Energy Rev. 2021, 138, 110562. [Google Scholar] [CrossRef]
- Heggelund, G.M. China’s climate and energy policy: At a turning point? Int. Environ. Agreem. Politics Law Econ. 2021, 21, 9–23. [Google Scholar] [CrossRef]
- Qin, Y. Natural gas in China’s power sector: Challenges and the road ahead. Energy Insight 2020, 80, 1–15. [Google Scholar]
- Yang, Y.; Campana, P.E.; Yan, J. Potential of unsubsidized distributed solar PV to replace coal-fired power plants, and profits classification in Chinese cities. Renew. Sustain. Energy Rev. 2020, 131, 109967. [Google Scholar] [CrossRef]
- Wang, S. Current status of PV in China and its future forecast. CSEE J. Power Energy Syst. 2020, 6, 72–82. [Google Scholar] [CrossRef]
- Yu, X.; Qu, H. Wind power in China—Opportunity goes with challenge. Renew. Sustain. Energy Rev. 2010, 14, 2232–2237. [Google Scholar] [CrossRef]
- Dai, J.; Yang, X.; Wen, L. Development of wind power industry in China: A comprehensive assessment. Renew. Sustain. Energy Rev. 2018, 97, 156–164. [Google Scholar] [CrossRef]
- Li, Y.; Xia, Y. DES/CCHP: The best utilization mode of natural gas for China’s low carbon economy. Energy Policy 2013, 53, 477–483. [Google Scholar] [CrossRef]
- Yan, B.; Xue, S.; Li, Y.; Duan, J.; Zeng, M. Gas-fired combined cooling, heating and power (CCHP) in Beijing: A techno-economic analysis. Renew. Sustain. Energy Rev. 2016, 63, 118–131. [Google Scholar] [CrossRef] [Green Version]
- Zhang, R.; Wang, G.; Shen, X.; Wang, J.; Tan, X.; Feng, S.; Hong, J. Is geothermal heating environmentally superior than coal fired heating in China? Renew. Sustain. Energy Rev. 2020, 131, 110014. [Google Scholar] [CrossRef]
- Feng, Y.; Chen, X.; Xu, X.F. Current status and potentials of enhanced geothermal system in China: A review. Renew. Sustain. Energy Rev. 2014, 33, 214–223. [Google Scholar] [CrossRef]
- Lazarevic, A.; Karamarkovic, V.; Lazarevic, D.; Karamarkovic, R. Potentials and opportunities to reduce energy-related greenhouse gas emissions in Serbia. Energy Sources Part A Recovery Util. Environ. Eff. 2017, 39, 712–719. [Google Scholar] [CrossRef]
- Cvetković, S.M.; Kaludjerović Radoičić, T.S.; Kragić, R.B.; Kijevčanin, M.L. Electricity production from biogas in Serbia—Assessment of emissions reduction. Therm. Sci. 2016, 20, 1333–1344. [Google Scholar] [CrossRef]
- Stefanović, P.L.; Marković, Z.J.; Bakić, V.V.; Cvetinović, D.B.; Spasojević, V.D.; Živković, N.V. Evaluation of Kolubara lignite carbon emissions characteristics. Therm. Sci. 2012, 16, 805–816. [Google Scholar] [CrossRef]
- Jović, M.; Laković, M. Carbon Footprint method—A case study for thermal power plants in Republic of Serbia. Acta Tech. Corviniensis-Bull. Eng. 2018, 11, 127–129. [Google Scholar]
- Pietrapertosa, F.; Khokhlov, V.; Salvia, M.; Cosmi, C. Climate change adaptation policies and plans: A survey in 11 South East European countries. Renew. Sustain. Energy Rev. 2018, 81, 3041–3050. [Google Scholar] [CrossRef]
- Batas Bjelić, I.; Rajaković, N.; Ćosić, B.; Duić, N. A realistic EU vision of a lignite-based energy system in transition: Case study of Serbia. Therm. Sci. 2015, 19, 371–382. [Google Scholar] [CrossRef]
- Batas Bjelic, I.; Ciric, R.M. Optimal distributed generation planning at a local level—A review of Serbian renewable energy development. Renew. Sustain. Energy Rev. 2014, 39, 79–86. [Google Scholar] [CrossRef]
- Dunjic, S.; Pezzutto, S.; Zubaryeva, A. Renewable energy development trends in the Western Balkans. Renew. Sustain. Energy Rev. 2016, 65, 1026–1032. [Google Scholar] [CrossRef]
- Siva Reddy, V.; Kaushik, S.C.; Panwar, N.L. Review on power generation scenario of India. Renew. Sustain. Energy Rev. 2013, 18, 43–48. [Google Scholar] [CrossRef]
- Gonzalez-Salazar, M.A.; Kirsten, T.; Prchlik, L. Review of the operational flexibility and emissions of gas- and coal-fired power plants in a future with growing renewables. Renew. Sustain. Energy Rev. 2018, 82, 1497–1513. [Google Scholar] [CrossRef]
- Şevik, S. An analysis of the current and future use of natural gas-fired power plants in meeting electricity energy needs: The case of Turkey. Renew. Sustain. Energy Rev. 2015, 52, 572–586. [Google Scholar] [CrossRef]
- Antonanzas, J.; Alia-Martinez, M.; Martinez-de-Pison, F.J.; Antonanzas-Torres, F. Towards the hybridization of gas-fired power plants: A case study of Algeria. Renew. Sustain. Energy Rev. 2015, 51, 116–124. [Google Scholar] [CrossRef]
- Clark, R.; Zucker, N.; Urpelainen, J. The future of coal-fired power generation in Southeast Asia. Renew. Sustain. Energy Rev. 2020, 121, 109650. [Google Scholar] [CrossRef]
- Ali, H.; Phoumin, H.; Weller, S.R.; Suryadi, B. Cost–Benefit Analysis of HELE and Subcritical Coal-Fired Electricity Generation Technologies in Southeast Asia. Sustainability 2021, 13, 1591. [Google Scholar] [CrossRef]
- Seo, S.-J.; Kim, J.-H.; Yoo, S.-H. Public Preference for Increasing Natural Gas Generation for Reducing CO2 Emissions in South Korea. Sustainability 2020, 12, 2636. [Google Scholar] [CrossRef] [Green Version]
- Abdel-Hameed, A.; Kim, J.; Hyun, J.-H.; Ramadhan, H.H.; Joseph, S.R.; Nandutu, M. Optimization of Electricity Generation Technologies to Reduce Carbon Dioxide Emissions in Egypt. Appl. Sci. 2021, 11, 8788. [Google Scholar] [CrossRef]
- Kaya, Y. Impact of Carbon Dioxide Emission Control on GNP Growth: Interpretation of Proposed Scenarios. In Proceedings of the IPCC Energy and Industry Subgroup, Response Strategies Working Group, Paris, France, 9 May 1990. [Google Scholar]
- Yamaji, K.; Matsuhashi, R.; Nagata, Y.; Kaya, Y. A study on economic measures for CO2 reduction in Japan. Energy Policy 1993, 21, 123–132. [Google Scholar] [CrossRef]
- Kaya, Y.; Yokobori, K. Environment, Energy, and Economy: Strategies for Sustainability, 1st ed.; United Nations University Press: Tokyo, Japan, 1997. [Google Scholar]
- Kirby, P.; O’Mahony, T. The Political Economy of the Low-Carbon Transitions: Pathways beyond Techno-Optimism (International Political Economy Series), 1st ed.; Springer International Publishing AG: Cham, Switzerland, 2018. [Google Scholar]
- Hwang, Y.-S.; Um, J.-S.; Hwang, J.-H.; Schlüter, S. Evaluating the causal relations between the Kaya identity index and ODIAC-based fossil fuel CO2 flux. Energies 2020, 13, 6009. [Google Scholar] [CrossRef]
- Schröder, E.; Storm, S. Economic growth and carbon emissions: The road to “Hothouse Earth” is paved with good intentions. Int. J. Political Econ. 2020, 49, 153–173. [Google Scholar] [CrossRef]
- Gómez, D.R.; Watterson, J.D.; Americano, B.B.; Ha, C.; Marland, G.; Matsika, E.; Namayanga, L.N.; Osman-Elasha, B.; Saka, J.D.K.; Treanton, K.; et al. Chapter 2: Stationary Combustion. In 2006 IPCC Guidelines for National Greenhouse Gas Inventories—Volume 2: Energy, 1st ed.; Eggleston, H.S., Buendia, L., Miwa, K., Ngara, T., Tanabe, K., Eds.; Institute for Global Environmental Strategies (IGES): Hayama, Japan, 2006; pp. 2.1–2.47. [Google Scholar]
- Nielsen, O.-K.; Plejdrup, M.S.; Winther, M.; Hjelgaard, K.; Nielsen, M.; Fauser, P.; Mikkelsen, M.H.; Albrektsen, R.; Gyldenkærne, S.; Thomsen, M. Projection of Greenhouse Gases 2017–2040 (Scientific Report from DCE—Danish Centre for Environment and Energy No. 294); Aarhus University, DCE—Danish Centre for Environment and Energy: Aarhus, Denmark, 2018; Available online: https://dce2.au.dk/pub/SR294.pdf (accessed on 1 June 2022).
- Chong, C.H.; Tan, W.X.; Ting, Z.J.; Liu, P.; Ma, L.; Li, Z.; Ni, W. The driving factors of energy-related CO2 emission growth in Malaysia: The LMDI decomposition method based on energy allocation analysis. Renew. Sustain. Energy Rev. 2019, 115, 109356. [Google Scholar] [CrossRef]
- Kamjou, A.S.; Miller, C.J.; Rouholamini, M.; Wang, C. Comparison between Historical and Real-Time Techniques for Estimating Marginal Emissions Attributed to Electricity Generation. Energies 2021, 14, 5261. [Google Scholar] [CrossRef]
- Ofosu-Adarkwa, J.; Xie, N.; Javed, S.A. Forecasting CO2 emissions of China’s cement industry using a hybrid Verhulst-GM(1,N) model and emissions’ technical conversion. Renew. Sustain. Energy Rev. 2020, 130, 109945. [Google Scholar] [CrossRef]
- Energy Agency of the Republic of Serbia (AERS). Annual Reports for 2005–2020. 2006–2021. Available online: https://www.aers.rs/Index.asp?l=1&a=53 (accessed on 1 June 2022)(In Serbian language).
- Public Enterprise Electric Power Industry of Serbia (PE EPS). Annual Reports for 1997–2020. 1998–2021. Available online: http://www.eps.rs/cir/Pages/tehnicki-izvestaji.aspx (accessed on 1 June 2022). (In Serbian language).
- Balkan Green Energy News. In 2019, the Generation of Electricity from Renewables in Serbia was Doubled. 2020. Available online: https://balkangreenenergynews.com/rs/u-2019-duplirana-proizvodnja-elektricne-energije-iz-obnovljivih-izvora-u-srbiji/ (accessed on 1 June 2022). (In Serbian language).
- Public Enterprise Electric Power Industry of Serbia (PE EPS). Green Book. 2009. Available online: http://www.eps.rs/cir/Pages/Sredina.aspx (accessed on 1 June 2022). (In Serbian language).
- Country Economy. Serbia GDP—Gross Domestic Product. 1999. Available online: https://countryeconomy.com/gdp/serbia?year=1998 (accessed on 1 June 2022).
- International Monetary Fund. Federal Republic of Yugoslavia: Membership and Use of Fund Resources—Request for Emergency Post-Conflict Assistance. 8 January 2001. Available online: https://www.imf.org/en/Publications/CR/Issues/2016/12/30/Federal-Republic-of-Yugoslavia-Membership-and-Use-of-Fund-Resources-Request-for-Emergency-3875 (accessed on 1 June 2022).
- Republic of Serbia, Ministry of Mining and Energy. Energy Sector Development Strategy of the Republic of Serbia for the Period by 2015. 2005. Available online: https://www.mre.gov.rs/doc/efikasnost-izvori/01%20Strategija%20razvoja%20energetike%20Republike%20Srbije%20do%202015%20godine.pdf (accessed on 1 June 2020)(In Serbian language).
- Trading Economics. Serbia GDP 1995–2019 Data. 2020. Available online: https://tradingeconomics.com/serbia/gdp (accessed on 1 June 2022).
- Trading Economics. Serbia GDP per Capita 1995–2018 Data. 2020. Available online: https://tradingeconomics.com/serbia/gdp-per-capita (accessed on 1 June 2022).
- The World Bank. The World Bank in Serbia—Overview for 2019. 2020. Available online: https://www.worldbank.org/en/country/serbia/overview (accessed on 1 June 2022).
- The World Bank. The World Bank in Serbia—Overview for 2020. 2021. Available online: https://www.worldbank.org/en/country/serbia/overview (accessed on 1 June 2022).
- The World Bank. Serbia. 2020. Available online: https://data.worldbank.org/country/serbia (accessed on 1 June 2022).
- Trading Economics. Serbia Population 1995–2020 Data. 2021. Available online: https://tradingeconomics.com/serbia/population (accessed on 1 June 2022).
- Republic of Serbia, Ministry of Mining and Energy. Energy Sector Development Strategy of the Republic of Serbia for the Period by 2025 with Projections by 2030. 2016. Available online: http://meemp-serbia.com/wp-content/uploads/2018/09/Legislative-Energy-Sector-Development-Strategy-of-the-Republic-of-Serbia-for-the-period-by-2025-with-projections-by-2030.pdf (accessed on 1 June 2022).
- Balkan Energy. Country Report on Energy Business in Serbia. December 2020. Available online: https://balkanenergy.com/files/Country_report_on_energy_business_in_Serbia_April_2019.pdf (accessed on 1 June 2022).
- UN Economic and Social Commission for Western Asia. United Nations Development Account Project on Promoting Renewable Energy Investments for Climate Change Mitigation and Sustainable Development: Case Study on Policy Reforms to Promote Renewable Energy in Serbia. 2018. Available online: https://www.unescwa.org/sites/default/files/pubs/pdf/policy-reforms-promote-renewable-energy-serbia-english.pdf (accessed on 1 June 2022).
- Knežević, D.; Kolonja, B.; Stanković, R.; Tomašević, A.; Nišić, D. Sizing of Coal Storage Yards. In Proceedings of the 11th International Conference on Surface Mining OMC, Zlatibor, Serbia, 15–18 October 2014; pp. 225–236, (In Serbian language). [Google Scholar]
- CEE Bankwatch Network. Carbon Costs for Planned Coal Power Plants in the Western Balkans and the Risk of Stranded Assets. 29 March 2017. Available online: http://www.cekor.org/documents/pages/649_2.pdf (accessed on 1 June 2022).
- Graus, W.; Worrell, E. Methods for calculating CO2 intensity of power generation and consumption: A global perspective. Energy Policy 2011, 39, 613–627. [Google Scholar] [CrossRef]
- Vignjević, D. Construction of Small Power Plants at Oil and Gas Fields. 2017. Available online: https://www.energy-community.org/dam/jcr:290c4795-7e7e-424f-9eca-97c684b558eb/OF2017_NIS.pdf (accessed on 1 June 2022).
- International Renewable Energy Agency (IRENA). Renewable Energy Prospects for the European Union. February 2018. Available online: https://www.irena.org/-/media/Files/IRENA/Agency/Publication/2018/Feb/IRENA_REmap-EU_2018_summary.pdf?la=en&hash=818E3BDBFC16B90E1D0317C5AA5B07C8ED27F9EF (accessed on 1 June 2022).
- Marković, Z.; Erić, M.; Cvetinović, D.; Stefanović, P.; Spasojević, V.; Škobalj, P. Determination of the Specific Carbon Dioxide Emission Factor from Thermal Power Plants Nikola Tesla A and B. Termotehnika 2016, 42, 25–36. [Google Scholar] [CrossRef] [Green Version]
- Official Journal of the European Communities. Directive 2001/80/EC of the European Parliament and of the Council of 23 October 2001 on the Limitation of Emissions of Certain Pollutants into the Air from Large Combustion Plants. 2001. Available online: https://eur-lex.europa.eu/legal-content/EN/TXT/PDF/?uri=CELEX:32001L0080&from=EN (accessed on 1 June 2022).
- Official Journal of the European Union. Directive 2010/75/EU of the European Parliament and of the Council of 24 November 2010 on Industrial Emissions (Integrated Pollution Prevention and Control). 2010. Available online: https://eur-lex.europa.eu/legal-content/EN/TXT/PDF/?uri=CELEX:32010L0075&from=en (accessed on 1 June 2022).
- Brnabić, A.; Turković, M. A Roadmap for Deploying Renewable Energy Sources in Serbia and the Regional Perspective: Renewable Energy Policy Considerations; Center for International Relations and Sustainable Development (CIRSD): Belgrade, Serbia, 2015; (In Serbian language). [Google Scholar]
- University of Belgrade, Faculty of Mechanical Engineering. Environmental Impact Assessment Study for the Project of Constructing the Cogeneration Plant “TE-TO Pančevo” at the KP 3523/11 K.O. Vojlovica Site. 2018. Available online: http://www.ekourbapv.vojvodina.gov.rs/wp-content/uploads/2019/01/Procena_uticaja_TE-TO_Pancevo_08_01_2019.pdf (accessed on 1 June 2022)(In Serbian language).
- Anadolu Agency. Is TurkStream’s Second Line to Europe Decided? 2018. Available online: https://www.aa.com.tr/en/info/infographic/12295 (accessed on 1 June 2022).
- World News. Gazprom Chose the Route of “Turkish Stream” to Europe Bypassing Ukraine. 2018. Available online: https://sevendaynews.com/2018/11/22/gazprom-chose-the-route-of-turkish-stream-to-europe-bypassing-ukraine/ (accessed on 25 August 2021).
- Hydrocarbons Technology. Gas Interconnection Bulgaria—Serbia (IBS) Pipeline. 2020. Available online: https://www.hydrocarbons-technology.com/projects/gas-interconnection-bulgaria-serbia-ibs-pipeline/ (accessed on 1 June 2022).
- Republic of Serbia, Ministry of Environmental Protection, Directorate for Environmental Protection. National Environmental Strategy. 2004. Available online: https://www.asser.nl/media/2271/cms_eel_id109_1_neap-eng.pdf (accessed on 1 June 2022).
- Republic of Serbia, Ministry of Environmental Protection, Environmental Protection Agency. Environment in Serbia: 2004–2019—Extended Summary. 2019. Available online: http://www.sepa.gov.rs/download/ENG_FIN_JubilarnaPublikacija.pdf (accessed on 1 June 2022).
- Republic of Serbia, Ministry of Energy, Development and Environmental Protection. Report on Strategic Environmental Assessment for the Energy Sector Development Strategy of the Republic of Serbia by 2025 with Projections until 2030, for the Period 2017–2023. 2017. Available online: https://www.mre.gov.rs/doc/efikasnost-izvori/SEA_PROGRAM%20FOR%20THE%20IMPLEMENTATION%20ENERGY%20STRATEGY%20%20FOR%20THE%20PERIOD%20FROM%202017%20UNTIL%202023.pdf (accessed on 25 August 2021).
- Andrijašević, M.; Pašić-Tomić, V. Environment in Serbia in Figures. In Proceedings of the 9th International Symposium on Natural Resources Management (ISNRM 2019), Zaječar, Serbia, 31 May 2019; pp. 1–8. [Google Scholar]
- Balkan Green Energy News. PM10 Concentration in Serbia 10 Times Above Limit, as Region Fills Most Polluted Cities Lists. 2019. Available online: https://balkangreenenergynews.com/pm10-concentration-in-serbia-10-times-above-limit-as-region-fills-most-polluted-cities-lists/ (accessed on 1 June 2022).
- Balkan Green Energy News. Citizens of Serbia Breathe Polluted Air—Particle Pollution Several Times Higher Than Allowed. 2019. Available online: https://balkangreenenergynews.com/citizens-of-serbia-breathe-polluted-air-particle-pollution-several-times-higher-than-allowed/ (accessed on 1 June 2022).
- Official Gazette of the Republic of Serbia—International Agreements, No. 3/2013-1. The Law on Confirmation of the Intergovernmental Agreement between the Government of the Republic of Serbia and the Government of the Russian Federation for the Supply of Natural Gas. 15 March 2013. Available online: https://www.pravno-informacioni-sistem.rs/SlGlasnikPortal/eli/rep/mu/skupstina/zakon/2013/3/1/reg (accessed on 1 June 2022).
- Safari, A.; Das, N.; Langhelle, O.; Roy, J.; Assadi, M. Natural gas: A transition fuel for sustainable energy system transformation? Energy Sci. Eng. 2019, 7, 1075–1094. [Google Scholar] [CrossRef]
- Petroleum Industry of Serbia (NIS). Annual Reports on Sustainable Development for 2012–2020. 2013–2021. Available online: https://www.nis.eu/odrzivi-razvoj (accessed on 1 June 2022). (In Serbian language).
Publisher’s Note: MDPI stays neutral with regard to jurisdictional claims in published maps and institutional affiliations. |
© 2022 by the authors. Licensee MDPI, Basel, Switzerland. This article is an open access article distributed under the terms and conditions of the Creative Commons Attribution (CC BY) license (https://creativecommons.org/licenses/by/4.0/).