Article

Numerical Analysis of Electric Field Characteristics and Interfacial Pressure of HVDC XLPE Cable Joint Considering Load Cycles

Department of Electronic Engineering, Hanyang University, Ansan 15588, Korea
*
Author to whom correspondence should be addressed.
Energies 2022, 15(13), 4684; https://doi.org/10.3390/en15134684
Submission received: 6 May 2022 / Revised: 24 June 2022 / Accepted: 24 June 2022 / Published: 26 June 2022
(This article belongs to the Special Issue HVDC Grid Technologies: Present and Future)

Abstract

:
Recent innovations in HVDC extruded cable systems require the development of reliable and safe cable accessories. Cable accessories are made of several insulating materials and contain several interfaces. Interfaces made of different materials can cause electric field distortion and localized enhancement of the field. In addition, the internal temperature profiles of accessories differ depending on load conditions or installation environments, which may lead to an increase in or loss of interfacial pressure due to changes in the mechanical properties of materials. The loss of interfacial pressure degrades the contact state between materials. The micro voids formed due to pressure loss can cause partial discharge and tree, which in turn can lead to reduced lifespan and failure of the cable system. Therefore, it is necessary to study the electrical and mechanical characteristics of cable accessories considering various transient states. However, there is a limit to experimentally analyzing the actual structure. In this paper, electric field and mechanical stress for pre-molded cable joints were analyzed using an electrical model based on the conductivity of the material and a mechanical model based on elastic theory. Temperature fluctuations were simulated according to the sequence of the cable load cycle test, and time-varying electric fields and mechanical stresses were analyzed. From the simulation results, it was confirmed that the electric field and stress distribution in the joint continuously changed according to the heating and cooling periods. In addition, during the cooling cycle, the field strength at the interface near the conductor increased and the interface pressure decreased. In conclusion, it is important to ensure sufficient initial pressure so that the dielectric strength at the interface does not decrease even if there is a loss of interface pressure due to temperature fluctuations.

1. Introduction

A high-voltage direct current (HVDC) system has great advantages in terms of transmission capacity and power losses compared with high-voltage an alternating current (HVAC) system, and is, therefore, used for long-distance transmission [1,2,3,4]. Several projects are underway around the world for the purpose of long-distance transmission and inter-country power grid connection using HVDC cable systems. Early projects mainly used oil-filled (OF) cables and insulated paper cables. Later, extruded polymer materials, excellent in electrical and mechanical performance, were developed and Cross-Linked Polyethylene (XLPE) cables are currently the most used [4,5,6,7].
In cable systems for long-distance transmission, a cable joint is essential to connect the separated cables. Depending on the type of cable, there are also several kinds of cable joints. Typically, the joints of the HVDC extruded cable system are divided into factory joints and pre-molded joints. The main advantage of factory joints is that they can be assembled in a strictly controlled environment [8,9]. In this case, contamination of the factory joints can be minimized. Also, the joints are made of the same material as the insulating material of the cable. In contrast, pre-molded joints are made of elastomeric materials, such as ethylene propylene diene monomer (EPDM) or silicone rubber (SiR). In this configuration, the interfaces between the XLPE and the elastic materials are essentially present inside the joints.
In general, the heterogeneous interface between different materials can cause electric field distortion and local field concentration. Moreover, the interface pressure is associated with the electrical strength of solid dielectrics, as shown in Figure 1 [10]. Experimental results from the reported studies [11,12,13,14,15,16] show that the interfacial pressure affects breakdown voltage, discharge current and interfacial carbonization. A common reason for this phenomenon is believed to be void formation due to pressure reduction. At the microvoids, the electric field is strengthened locally [17]. The enhanced field can cause partial discharge and electrical treeing, which in turn leads to degradation of the insulation materials. As a result, it may lead to a decrease in the life span of the cable system and further failure of the entire system. To prevent such undesirable phenomena, joints with appropriate surface pressure applied are manufactured. A cable joint composed of several interfaces is the most vulnerable element and is the most important to ensure the reliability of the system.
Additionally, renewable energy generation, such as by solar and wind farms, is increasing worldwide due to decarbonization policies. Renewable energy sources cannot control the amount of power generation at a constant level, so load may increase or decrease rapidly [18,19]. As a result, a more dynamic load profile is expected due to the introduction of renewable energy, and it seems clear that this will be a major factor causing changes in thermal and mechanical stress inside the cable joints. In other words, not only electrical stress, but also thermo-mechanical stress is an important factor to consider when designing cable accessories. However, the experimental approach requires many sensors to obtain a high-resolution pressure distribution, and it is difficult to install the sensors in an actual structure with several curved surfaces; it is, therefore, necessary to develop a numerical approach. Several studies reported the analysis of the mechanical pressure in the cable accessories, based on elastic theory and using the finite element method (FEM) [20,21,22].
Therefore, in this paper, electrical and mechanical numerical analysis was performed taking into consideration the load variability for a 500 kV HVDC XLPE cable pre-molded joint. Load variability was applied according to the load cycle test procedure presented in Technical Brochure 496 published by CIGRE [23]. The electric field and mechanical stress distributions in the joints were derived according to the heating and cooling periods. Additionally, changes in the electric field strength and the interfacial pressure were compared at specific interfaces inside the joint.

2. Simulation Model

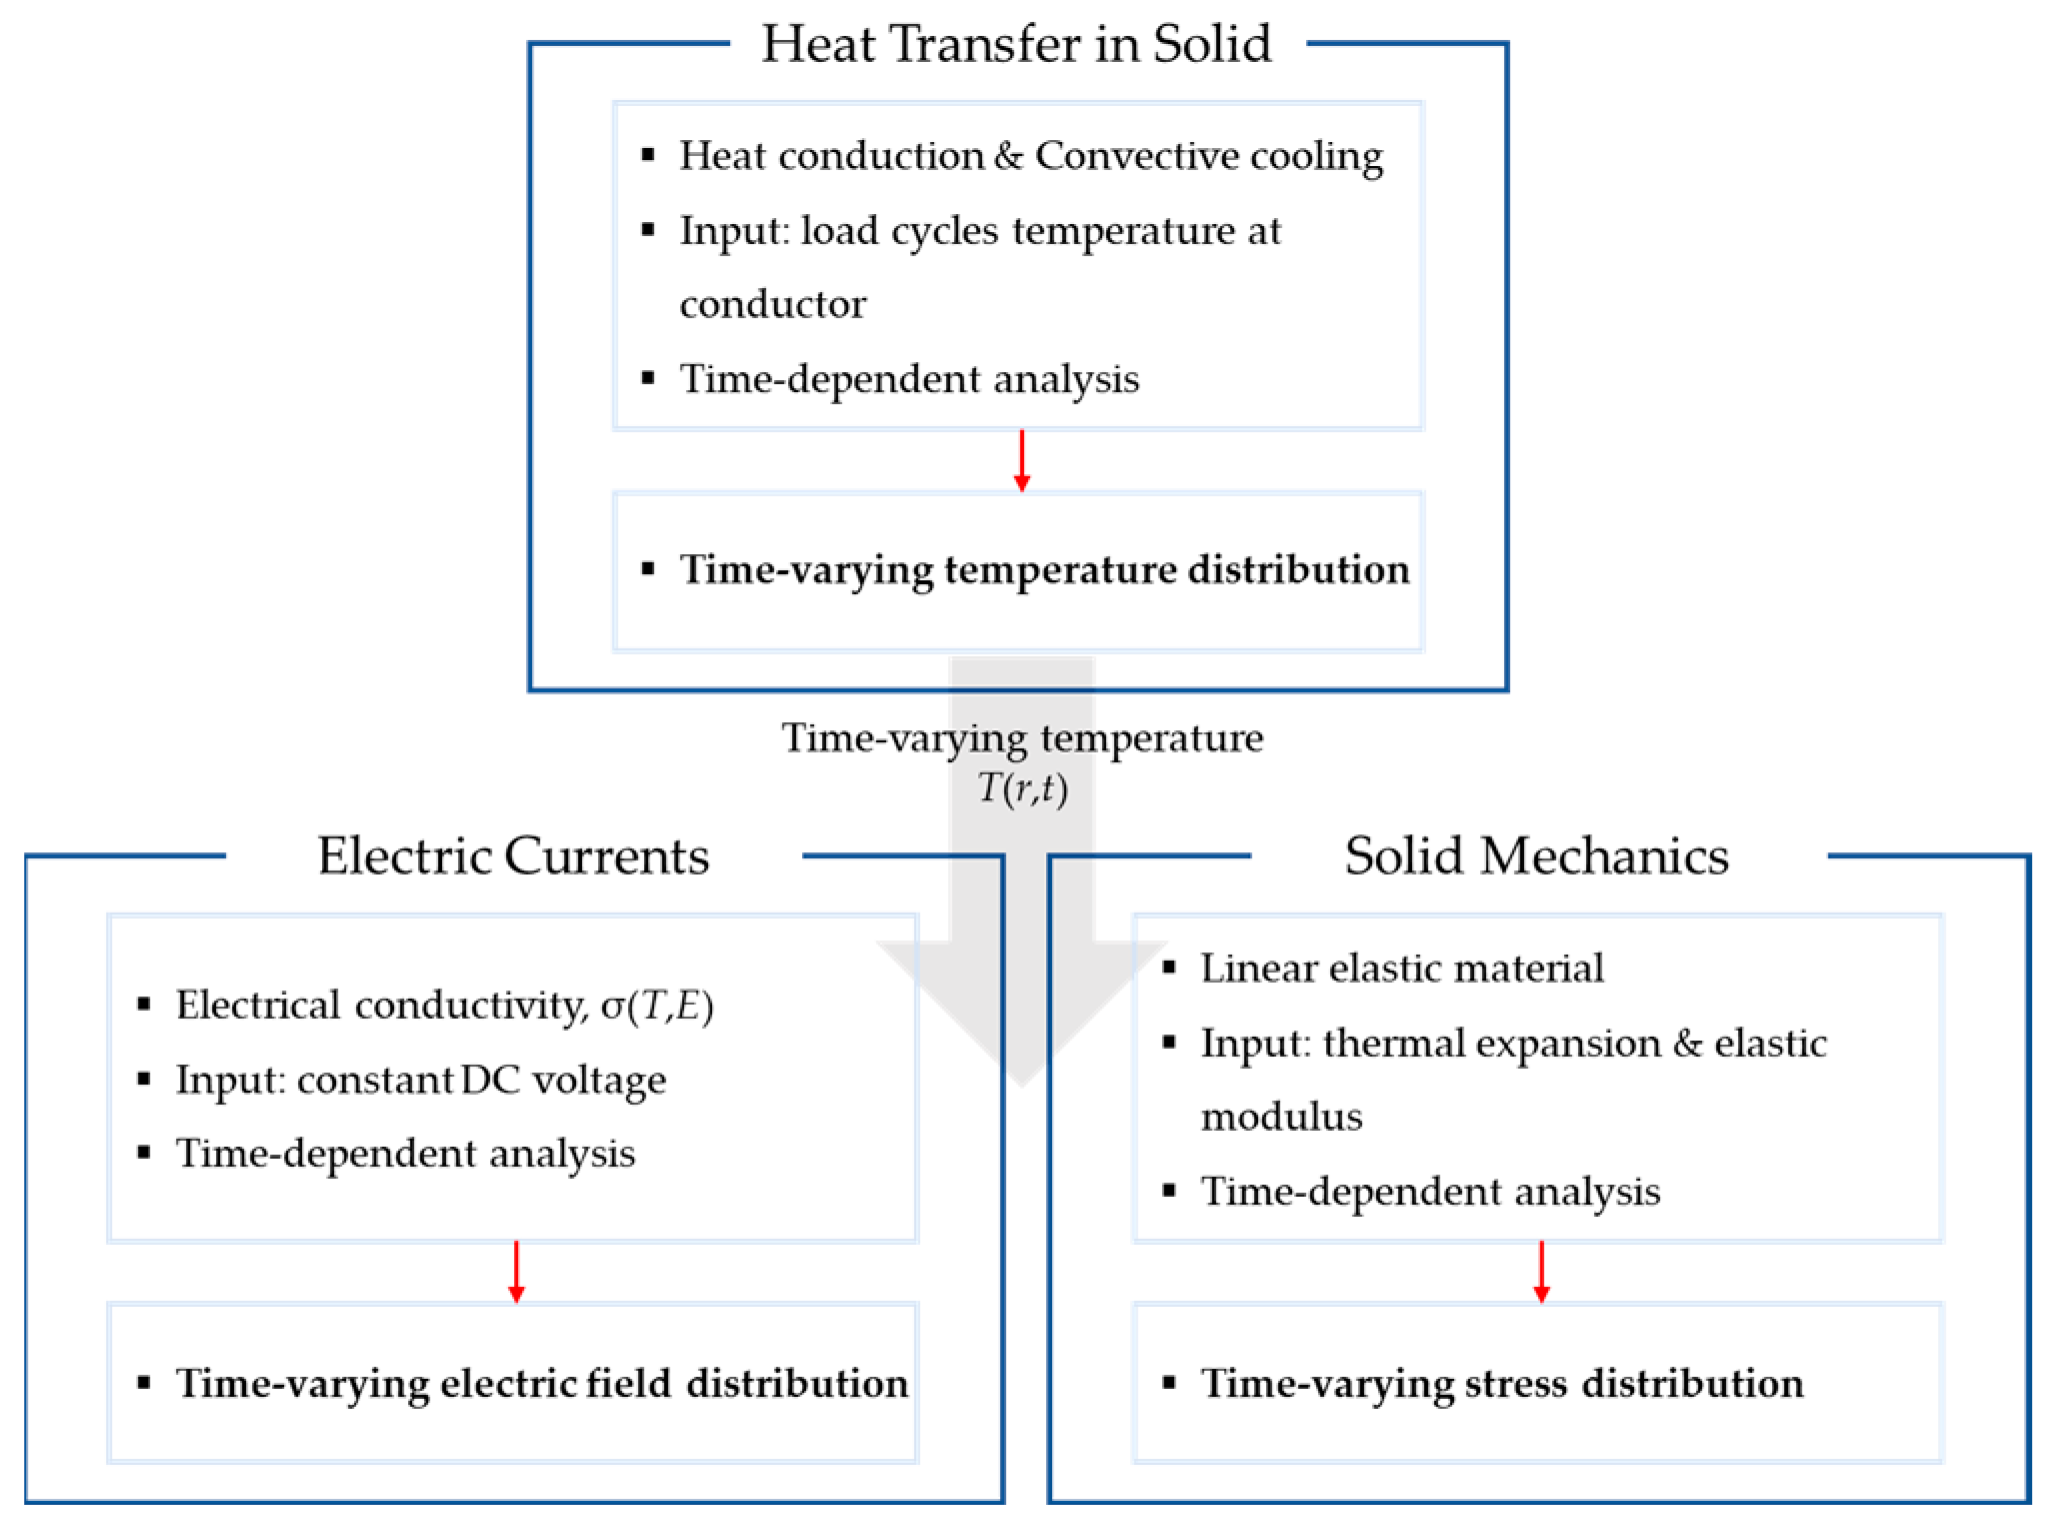
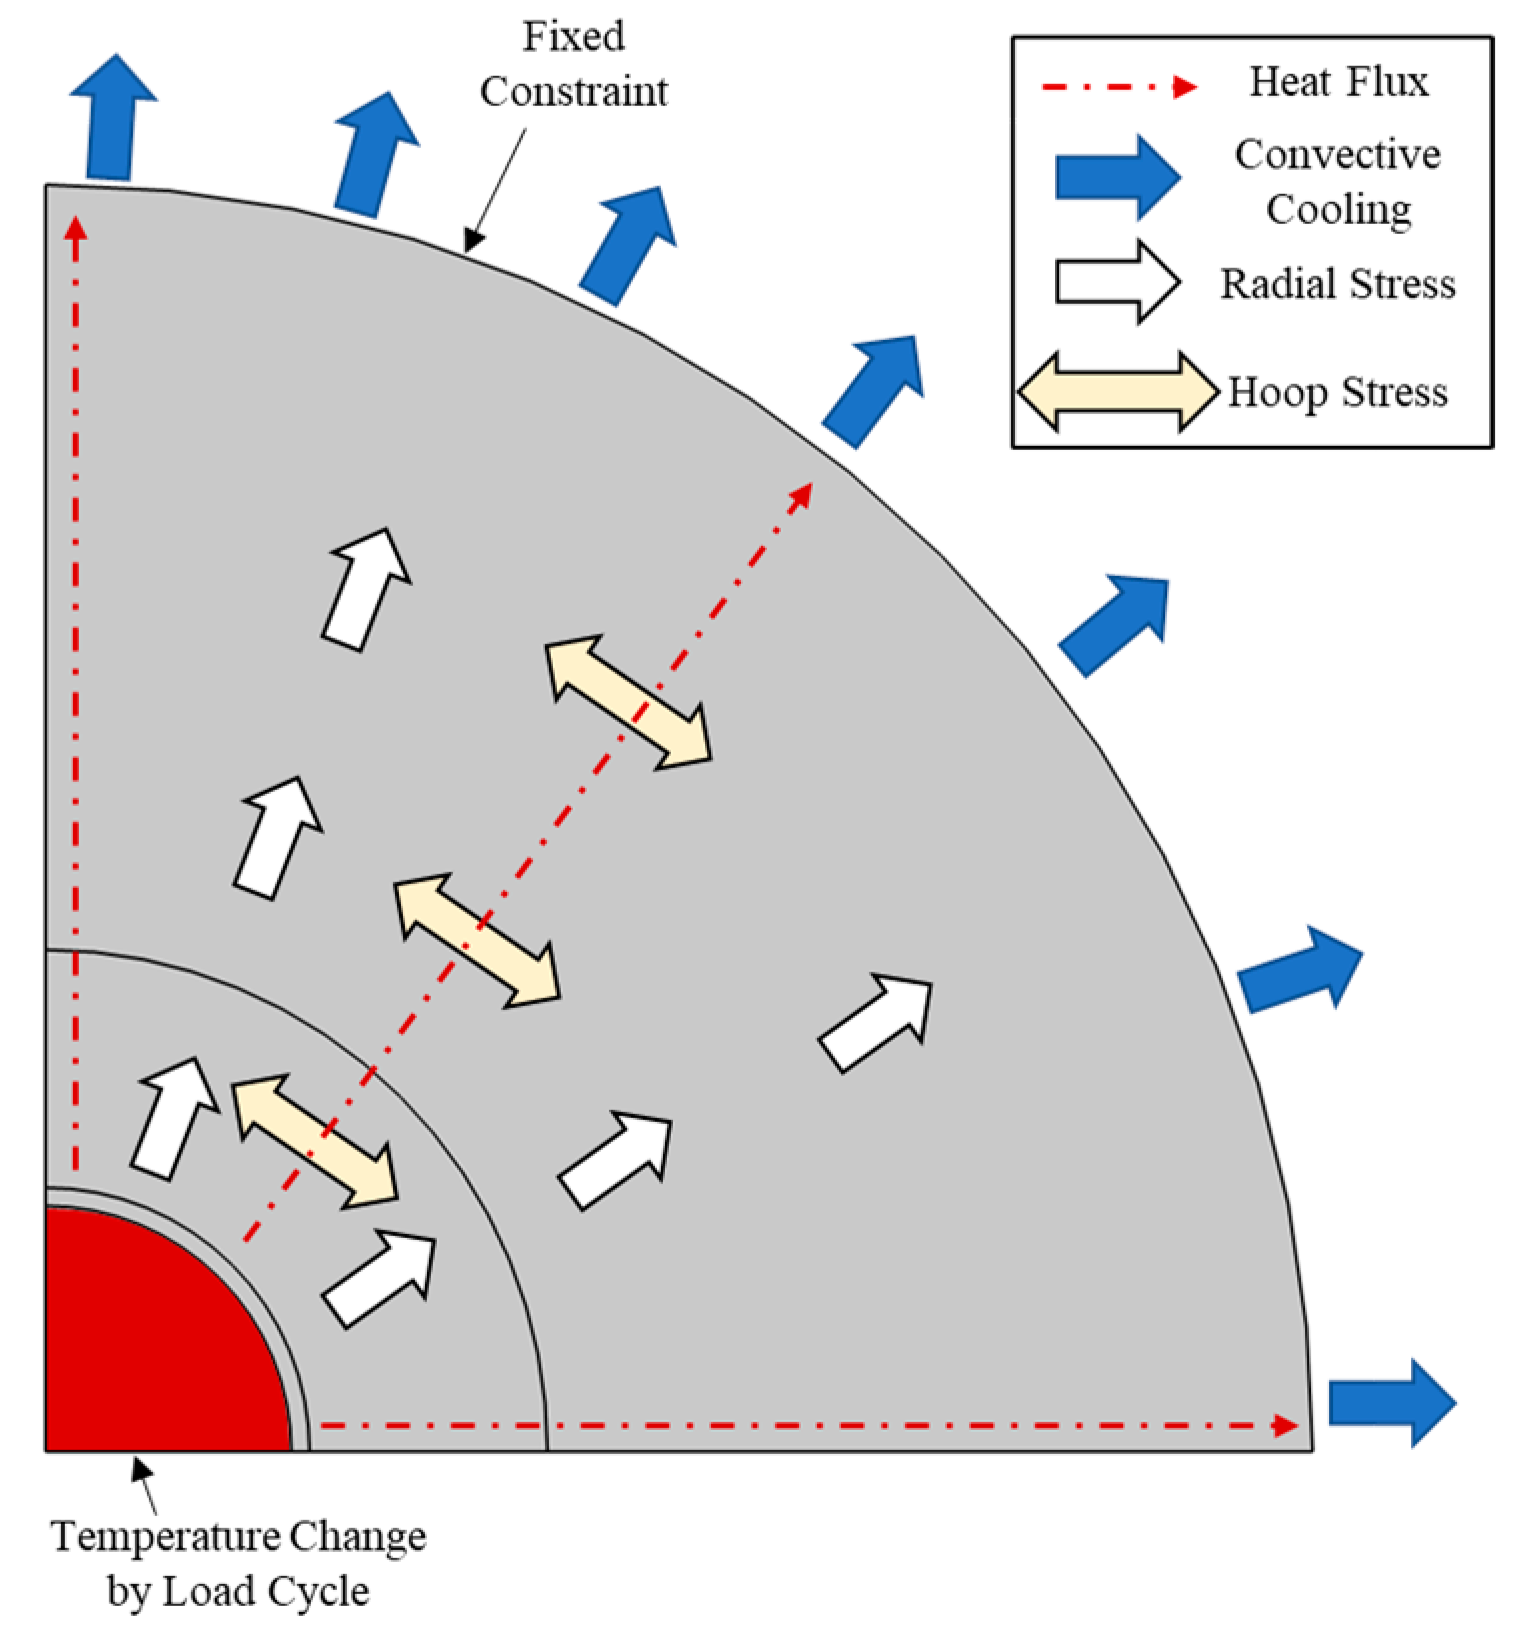
2.1. Thermal Electrical Model

Numerical analysis models based on the conductivity of dielectrics were used to evaluate the electric field characteristics of HVDC cables [24,25,26]. It is well known that DC time-varying electric field distribution depends on temperature, voltage level and cable scale. This is because the conductivity of the insulating material, which is sensitive to temperature and electric field, has a great influence on the formation of DC electric field distribution. When the joule heating of the conductor starts due to the load current, a temperature gradient is formed in the insulation materials, which causes a difference in conductivity by radius. As the temperature difference within the cable insulation increases, the electric field strength near the conductor is lowered and the electric field on the sheath side is enhanced. Such a phenomenon is an electric field inversion that typically occurs in DC cables and is expressed as the resistive electric field [27,28]. This model, based on conductivity, is composed of a combination of the following governing equations:
J = σ E
· ( ε 0 ε r E ) = ρ
· J = ρ t
where J is the current density, σ is the electrical conductivity of materials, Ɛ0 is the vacuum permittivity, Ɛr is the relative dielectric permittivity, and ρ is the charge density.
Thermal simulation inside the joint was performed based on the heat transfer equation [29]. It was assumed that the cooling of the joint was caused by external natural convection, and Equation (5) was set as the boundary condition of the external joint. In this paper, the thermal electrical model analyzes the transient electric field inside the cable joints, taking into account the load cycle test of the cable.
ρ d C p T t = · ( k T ) + Q
q 0 = h ( T a m b T s )
where ρd represents the density of material, Cp is the heat capacity at constant pressure, k is the thermal conductivity, Q is the heat source from the conductor, h refers to the convective transfer coefficient, and Tamb and Ts are the ambient temperature and temperature on joint surface, respectively.

2.2. Thermal Mechanical Stress Model

The distribution of stresses and strains when an object is deformed can be obtained by solving the basic equations of elastic theory. The governing equations expressing the deformation of a solid body are the equilibrium equation, stress–displacement and the strain–stress relationship [30]. When an object deforms, internal forces occur in the material, and these forces per area are defined as stresses. Internal forces, expressed as stresses, along with external and inertial forces, are balanced according to Newton’s second law, Equation (6):
· σ s + F v = ρ 2 u t 2
where σs is the stress tensor, body force per unit volume is Fv, ρ is the density, and u is the displacement field.
Tensile stress and compressive stress exist, and to distinguish between the two types, tensile stress is expressed as a positive value and compressive stress is expressed as a negative value. The elastic material means that when the load is removed, it recovers to its original dimensions prior to deformation. Since the cable joint is composed of elastic material, the linear elastic material model is applied in this study. This linear material model means that the stress–strain relationship is linear and is defined by the following equations. The strain–displacement equation and the stress–strain relation are expressed as:
ε = s u
σ s = E ε
where ε is strain and E is the elastic modulus or Young’s modulus. The elastic modulus is related to the stiffness of a material. The harder the material, the higher the elastic modulus. A material with a high elastic modulus has less elastic deformation than a material with a low elastic modulus. This indicates that a more elastic material has a lower modulus [30]. Additionally, most materials have the property of expanding when the temperature increases. A material with high thermal expansion has a large strain with a change in temperature.
The heat caused by the load currents causes a temperature gradient inside the joint, resulting in a difference in thermal expansion and the elastic modulus of the insulating materials. It is expected that each interface pressure will fluctuate under a transient temperature condition, such as a load cycle.
In order to evaluate the electrical and mechanical properties considering the heat inside the cable joints, a multiphysics simulation should be performed. We used the FEM software COMSOL Multiphysics, version 6.0, and constructed the model by coupling the heat transfer, electric currents and solid mechanics modules as shown in Figure 2. The conductor temperature during the load cycle was set as an input to the heat transfer module. Based on the time-varying temperature distribution, the electrical conductivity of the main parameters, and the thermal expansion and elastic modulus were applied to each module. Finally, the electric field and stress distributions inside the cable joints were calculated.

3. Model Geometry and Simulation Conditions

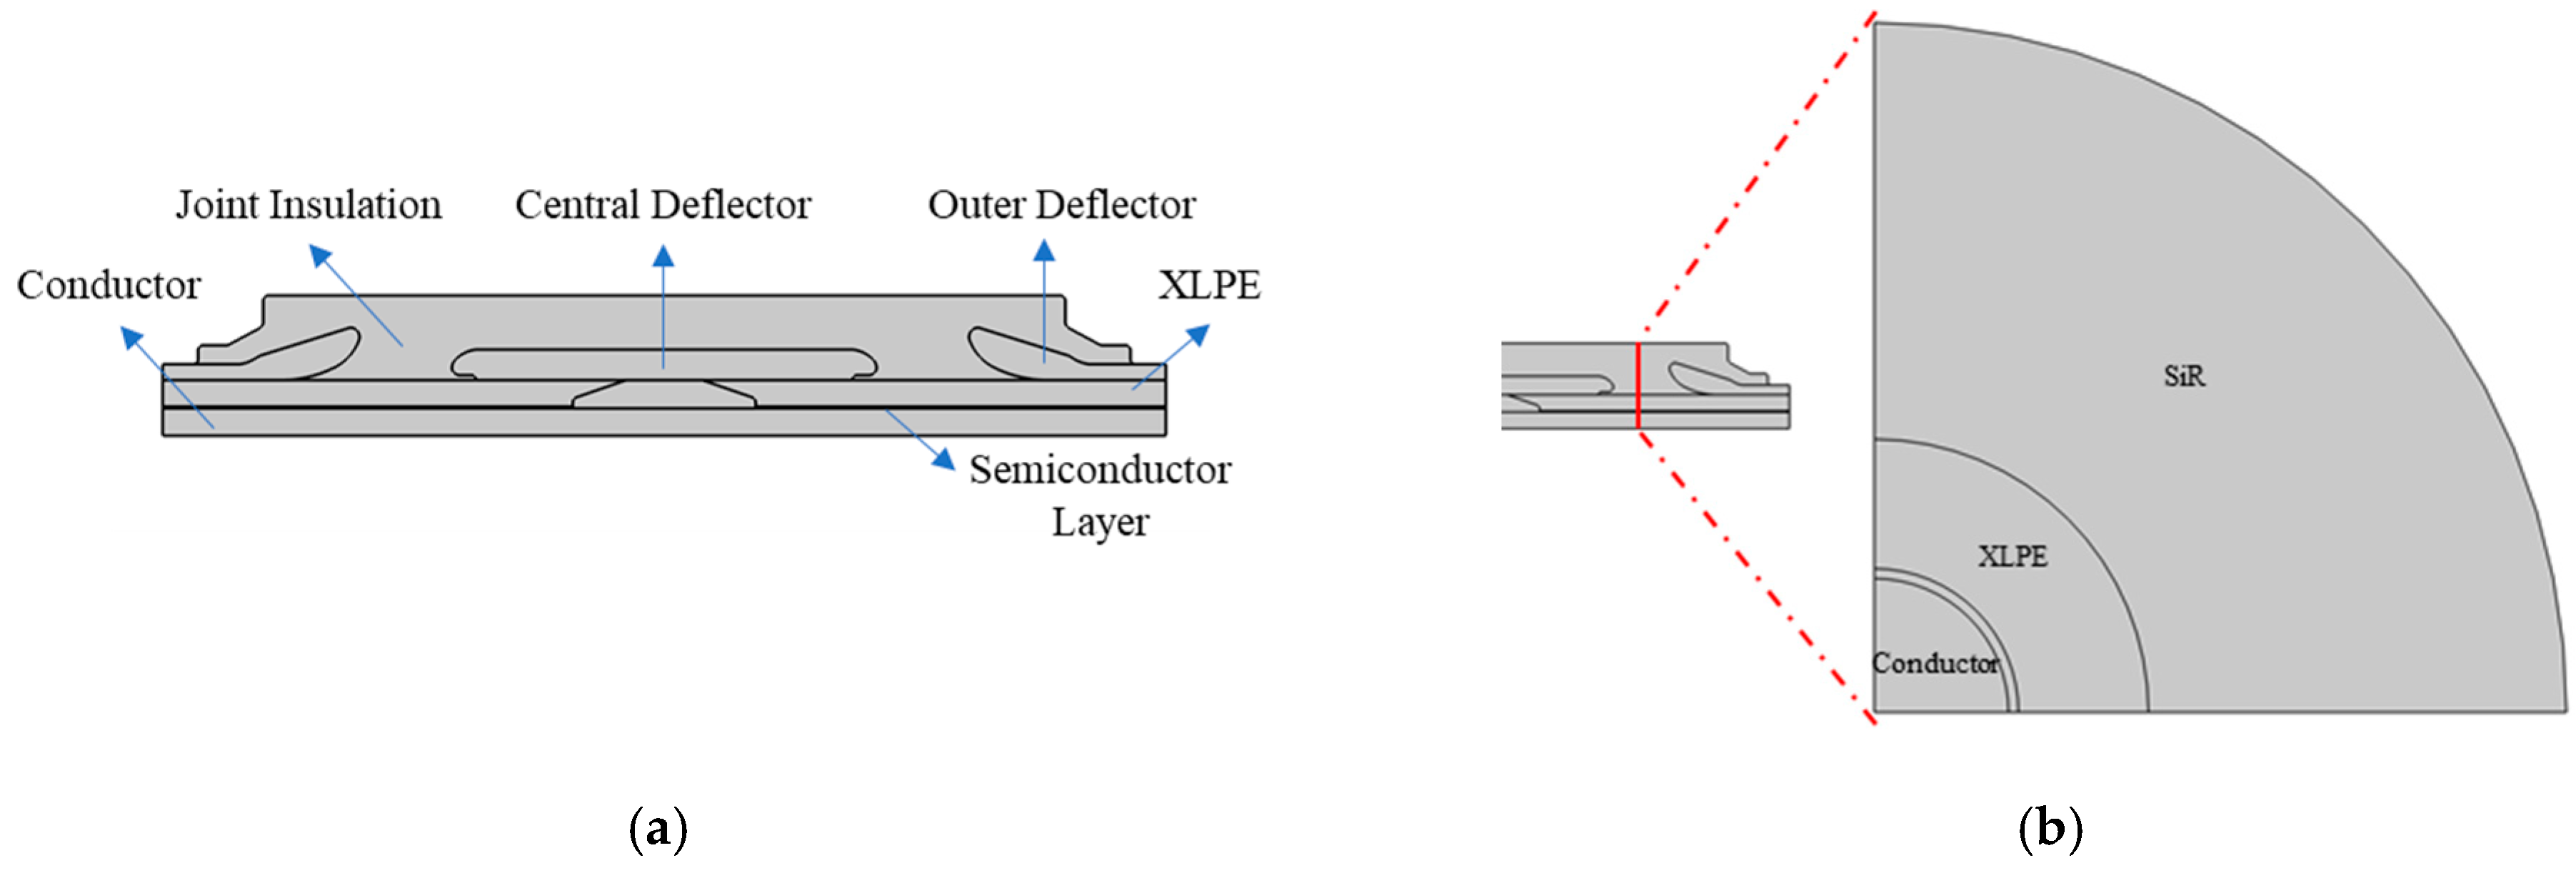
3.1. Cable Joint Geometry

Although various types of pre-molded joints exist, the general structure shown in Figure 3 was applied to the simulation. The analysis object was an HVDC 500 kV XLPE cable joint, and its geometry is shown in Figure 3a. The conductor, with a radius of 31 mm, was fastened with a clamp. The XLPE cable insulation was 30 mm thick. The joint body was composed of semiconducting central/outer deflectors and SiR. In addition, thin semiconducting layers were disposed on the SiR and the conductor.
Figure 3b shows the joint cross-sectional structure used in the thermal mechanical model to compare the interfacial pressure according to the load cycle. Since the temperature gradient in the radial direction is larger than that in the axial direction, the joint cross-sectional structure was applied for mechanical stress analysis. The thicknesses of the conductor and insulation layer corresponding to the indicated cross section were set to be the same.

3.2. Simulation Conditions

The applied voltage and temperature profile were selected by referring to the load cycle test of CIGRE TB 496, which summarizes the DC 500 kV extruded cable system test recommendations. The load cycle test consists of a heating period and a cooling period, and the detailed description is as follows [23,31]:
  • 24 h load cycles consist of at least 8 h of heating followed by at least 16 h of natural cooling.
  • During at least the last 2 h of the heating period, a conductor temperature is maintained above the maximum conductor operating temperature and a temperature drop across the insulation is higher than the maximum temperature difference.
  • Depending on the type of HVDC system, eight or twelve “24-h” load cycles are performed at the test voltage.
Depending on the load cycle temperature conditions, the input data were adjusted so that a conductor temperature of about 73 °C was maintained for 2 h. The initial internal temperature and ambient temperature of the joint were set at 20 °C. Additionally, the test voltage was established as 1.85 times the rated voltage, and only positive polarity was considered in this simulation. The heat transfer coefficient h was set to 5 W/(m2∙K) to maintain an appropriate temperature distribution in the joint.
When describing the volume conductivity of a solid insulation, the form of Equation (9) based on an experimental approach is used. Therefore, the corresponding equation was applied so that the conductivity of XLPE and SiR depended on temperature and electric field. The main parameters used in the thermal electrical model are shown in Table 1 [32,33].
σ ( T , E ) = σ 0 exp ( α ( T T 0 ) + β ( E E 0 ) )
where σ0 is the reference conductivity, T0 is the reference temperature, E0 is the reference electric field, and α and β are the temperature and electric field dependent coefficients, respectively.
The boundary conditions applied for the thermal mechanical analysis are shown in Figure 4. Assuming that there is no change in the outer diameter of the joint, the fixed constraint condition was applied. In addition, to analyze the interfacial pressure according to the load condition change, the elastic modulus and the thermal expansion coefficient including the temperature term were applied. Since it is difficult to set the initial internal stress of the installed joint, only the change in interfacial pressure due to thermal variability after installation was analyzed. The conductor temperature was the same as the load cycle temperature profile. The main parameters used in the thermal mechanical model are shown in Table 2 [34].

4. Results

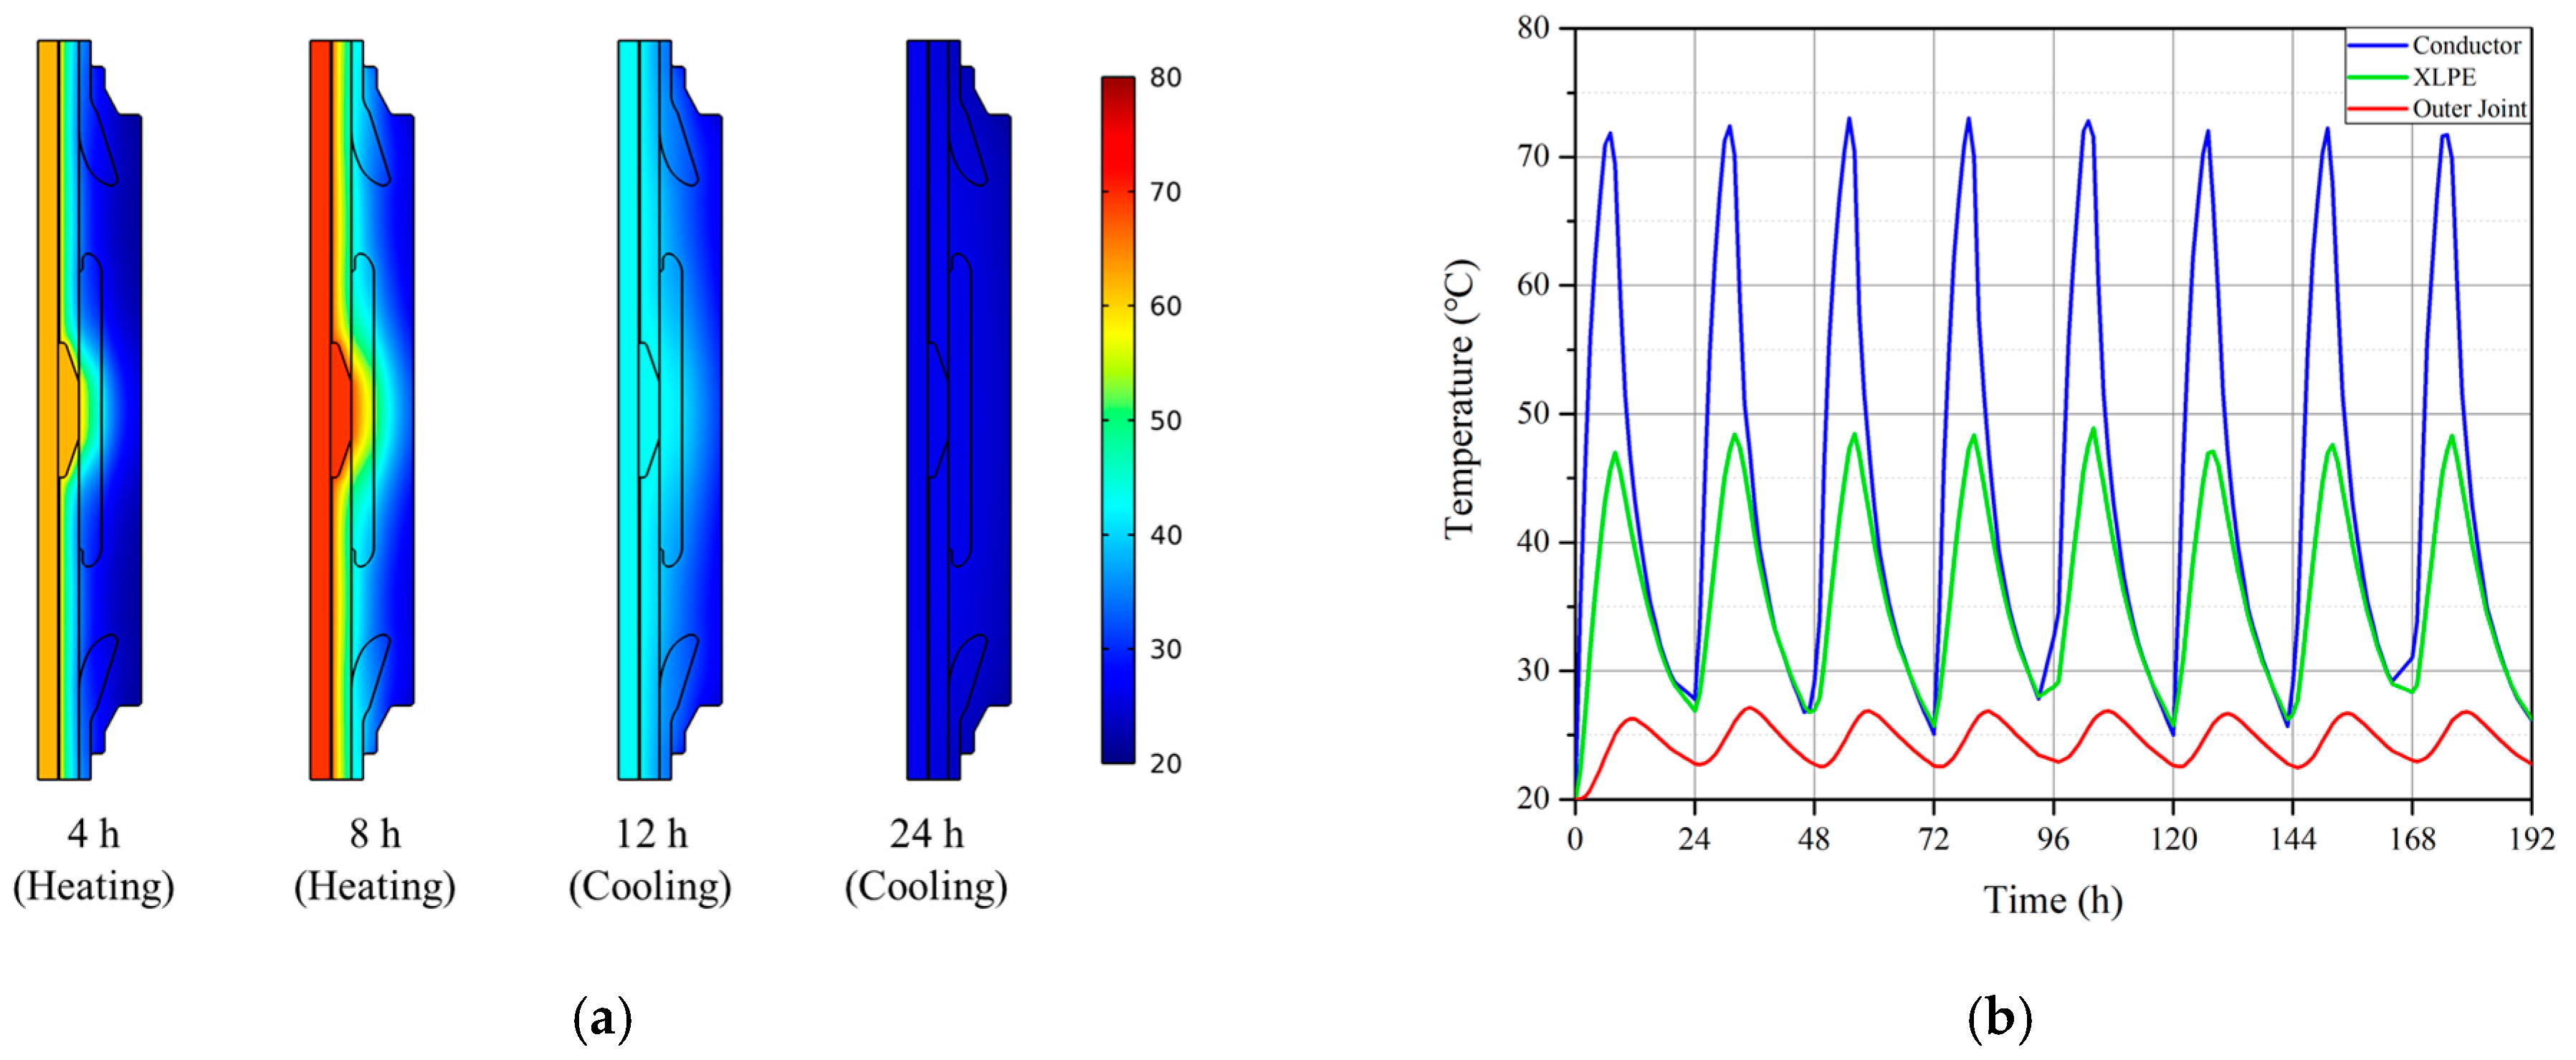
4.1. Thermal Simulation Results

Figure 5a shows the time-varying temperature distribution inside the joint. The conductor temperature rises and falls repeatedly according to the load cycle condition. Heat from the conductor spreads through the insulating material and cools on the outer surface of the joint. Figure 5b shows the temperature profiles at the three indicated points. From the conductor temperature graph, it is seen that the maximum operating temperature of the conductor is maintained at 70 °C or higher for at least 2 h. In the indicated cut line, the temperature gradient of the XLPE insulating layer was 25 °C at 8 h of the heating cycle. At the end of one cycle, temperatures of the conductor and XLPE insulation layer cooled down to 26 °C. It was then confirmed that the temperature profiles appeared in a similar pattern according to the repeated load cycle.

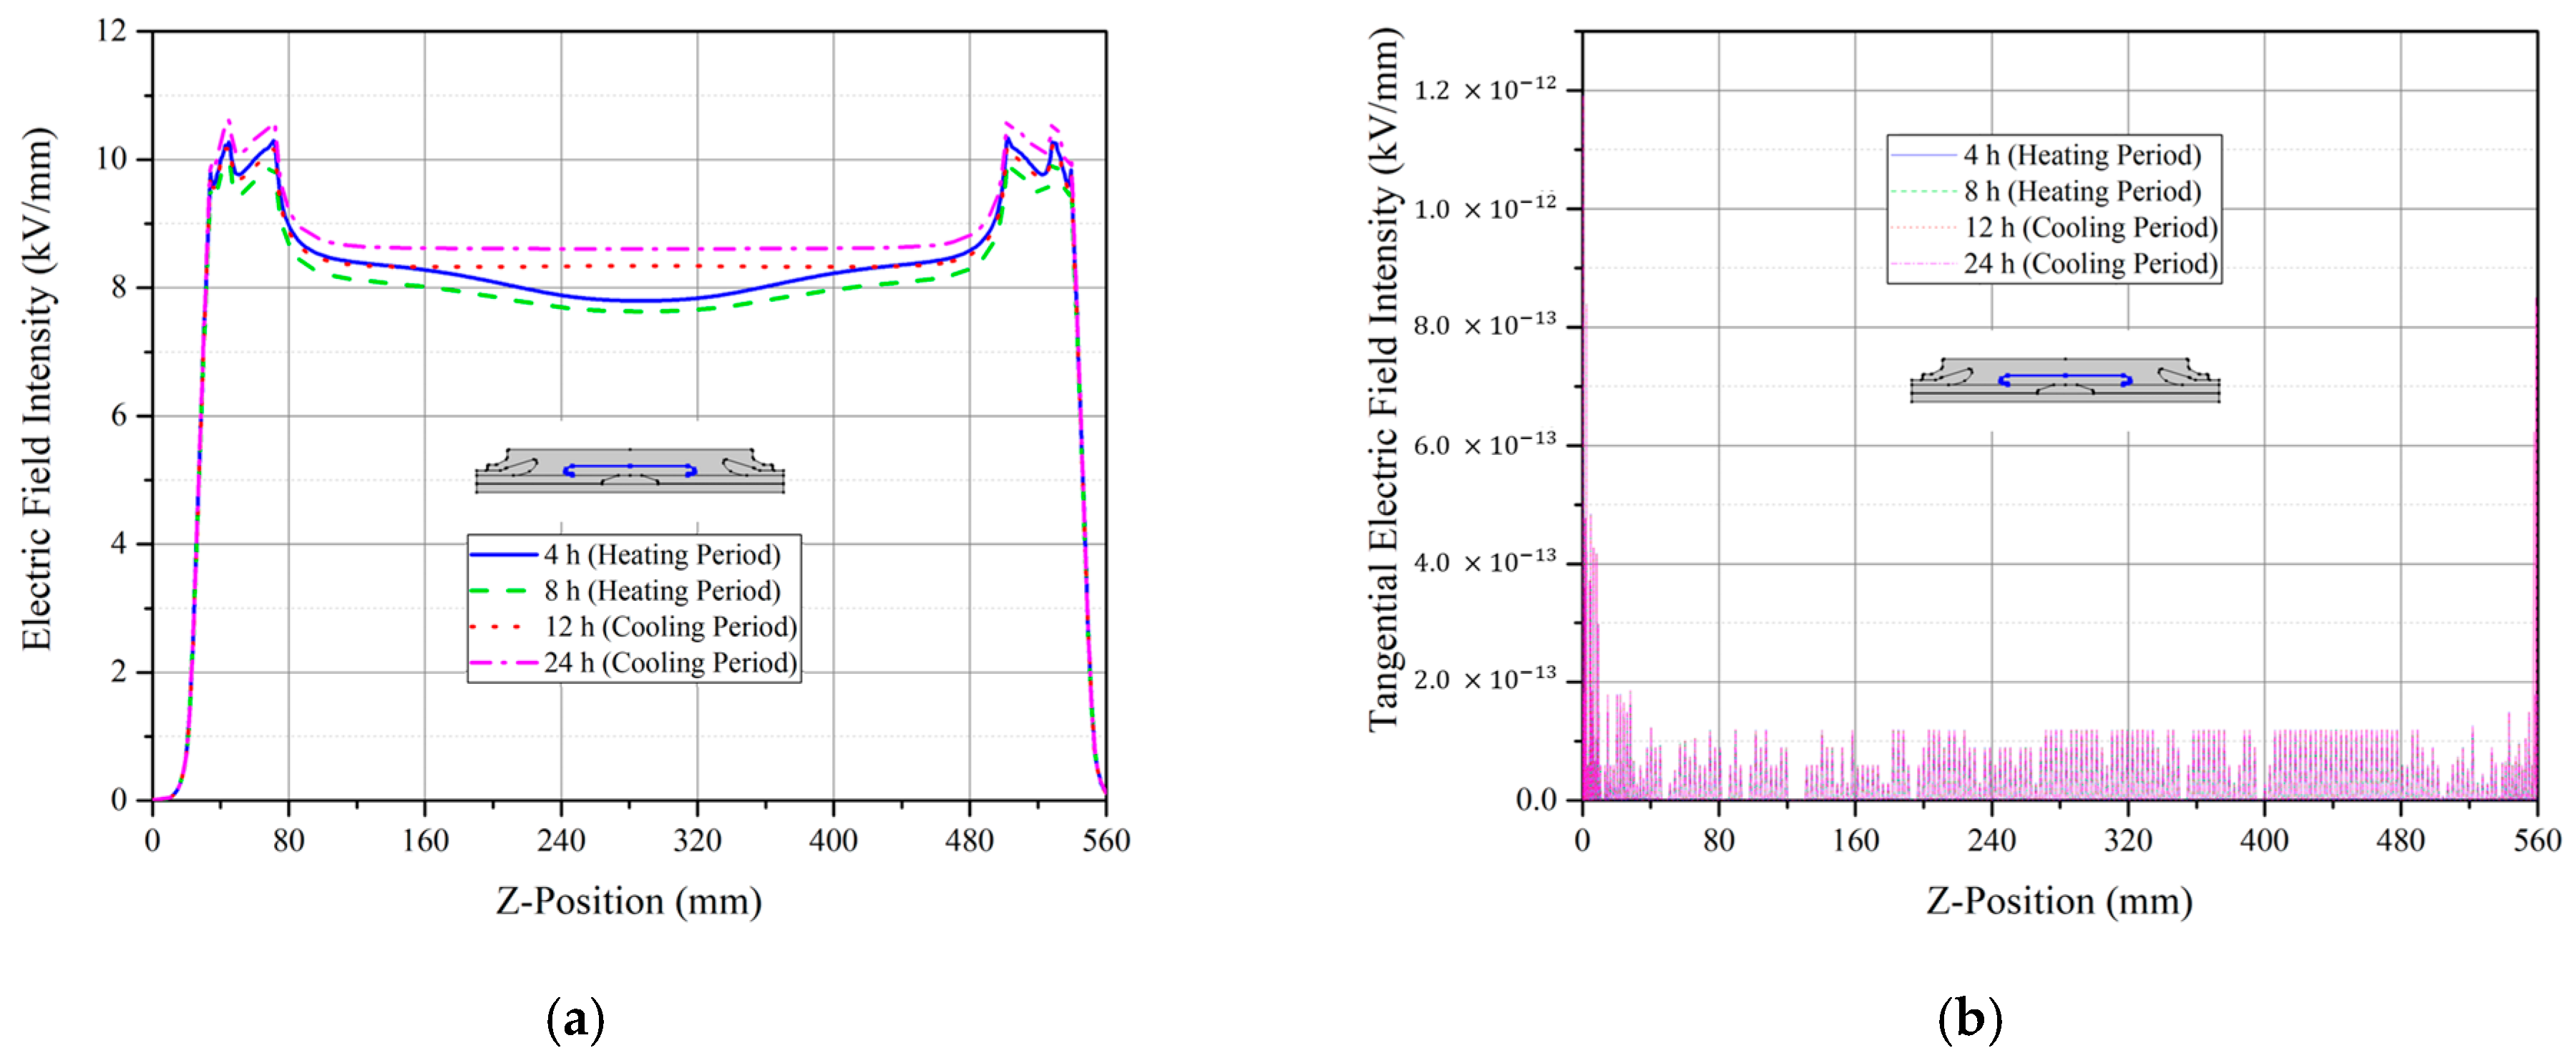
4.2. Electrical Simulation Results

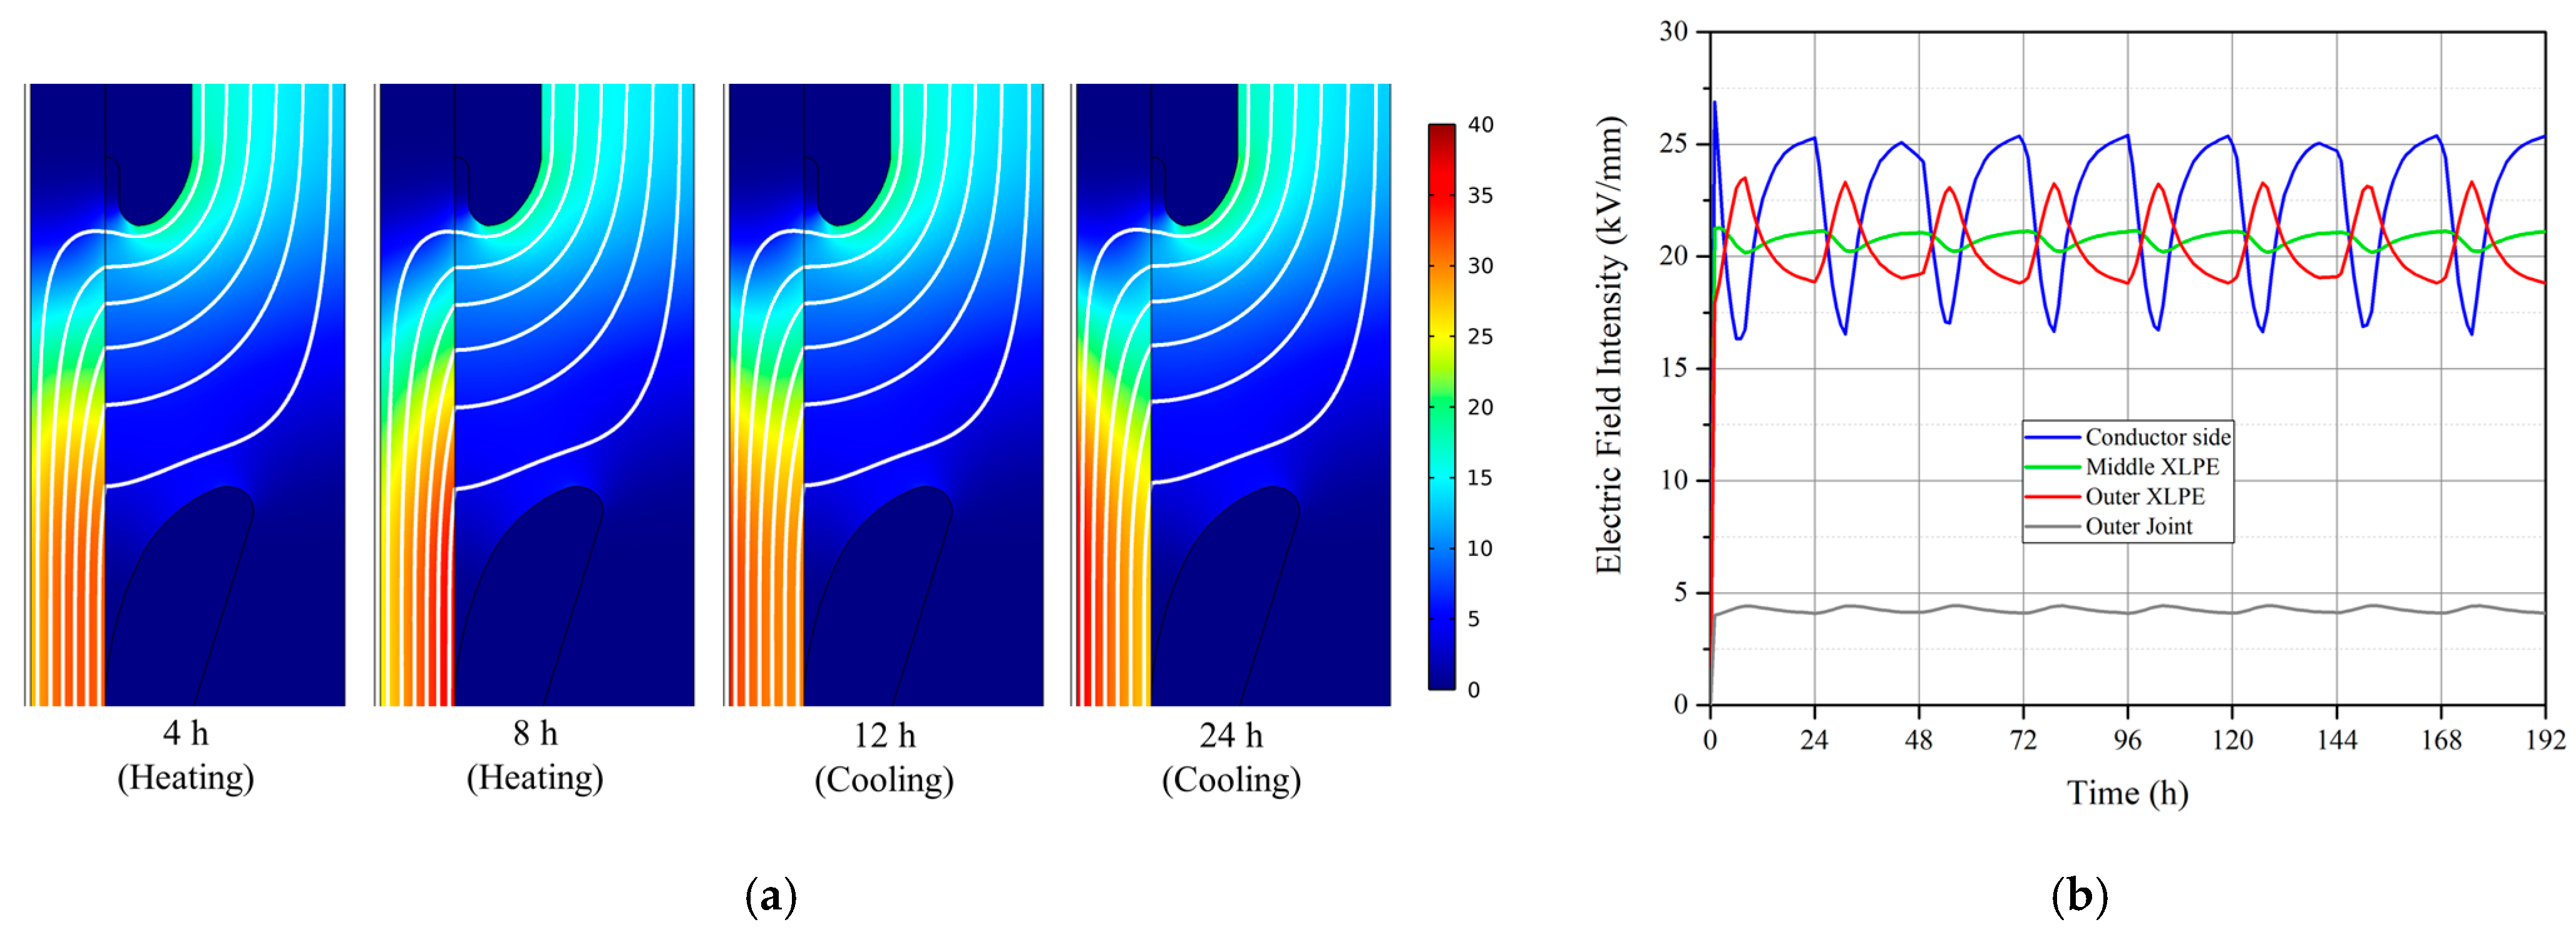
4.2.1. Electric Field Distribution in the Cable Joint According to the Load Cycles

Figure 6a shows the time-varying electric field distribution and equipotential lines inside the joint. The electric field concentration area including XLPE, SiR and the deflector was enlarged and plotted. To confirm the change in the electric field distribution, the legend range was set up to 40 kV/mm. Since the conductivity of XLPE is significantly lower than that of SiR, the electric field is most strongly concentrated inside the cable insulation layer. In addition, as shown in the electric field distribution of the XLPE layer, the field strength at the XLPE/SiR interface gradually increased during the heating cycle. On the other hand, it was confirmed that the electric field on the conductor side gradually increased during the cooling cycle, which is a typical resistive electric field characteristic under DC conditions. In addition, the central deflector, which is a semiconducting component, arranges the equipotential line toward the joint insulation, so that the field strength is high in the vicinity of the central deflector/SiR interface compared with other SiR domains.
Figure 6b shows the time-varying electric field profiles at four points indicated on the joint. As in the previous results, the electric field strength on the conductor side decreased in the heating cycle and increased in the cooling cycle. On the other hand, the electric field strength on the outer XLPE showed the opposite pattern. The field strengths at the midpoint of the XLPE and the outer joint were around 21 kV/mm and 4.8 kV/mm, respectively, and there was no significant change during the entire load cycles.

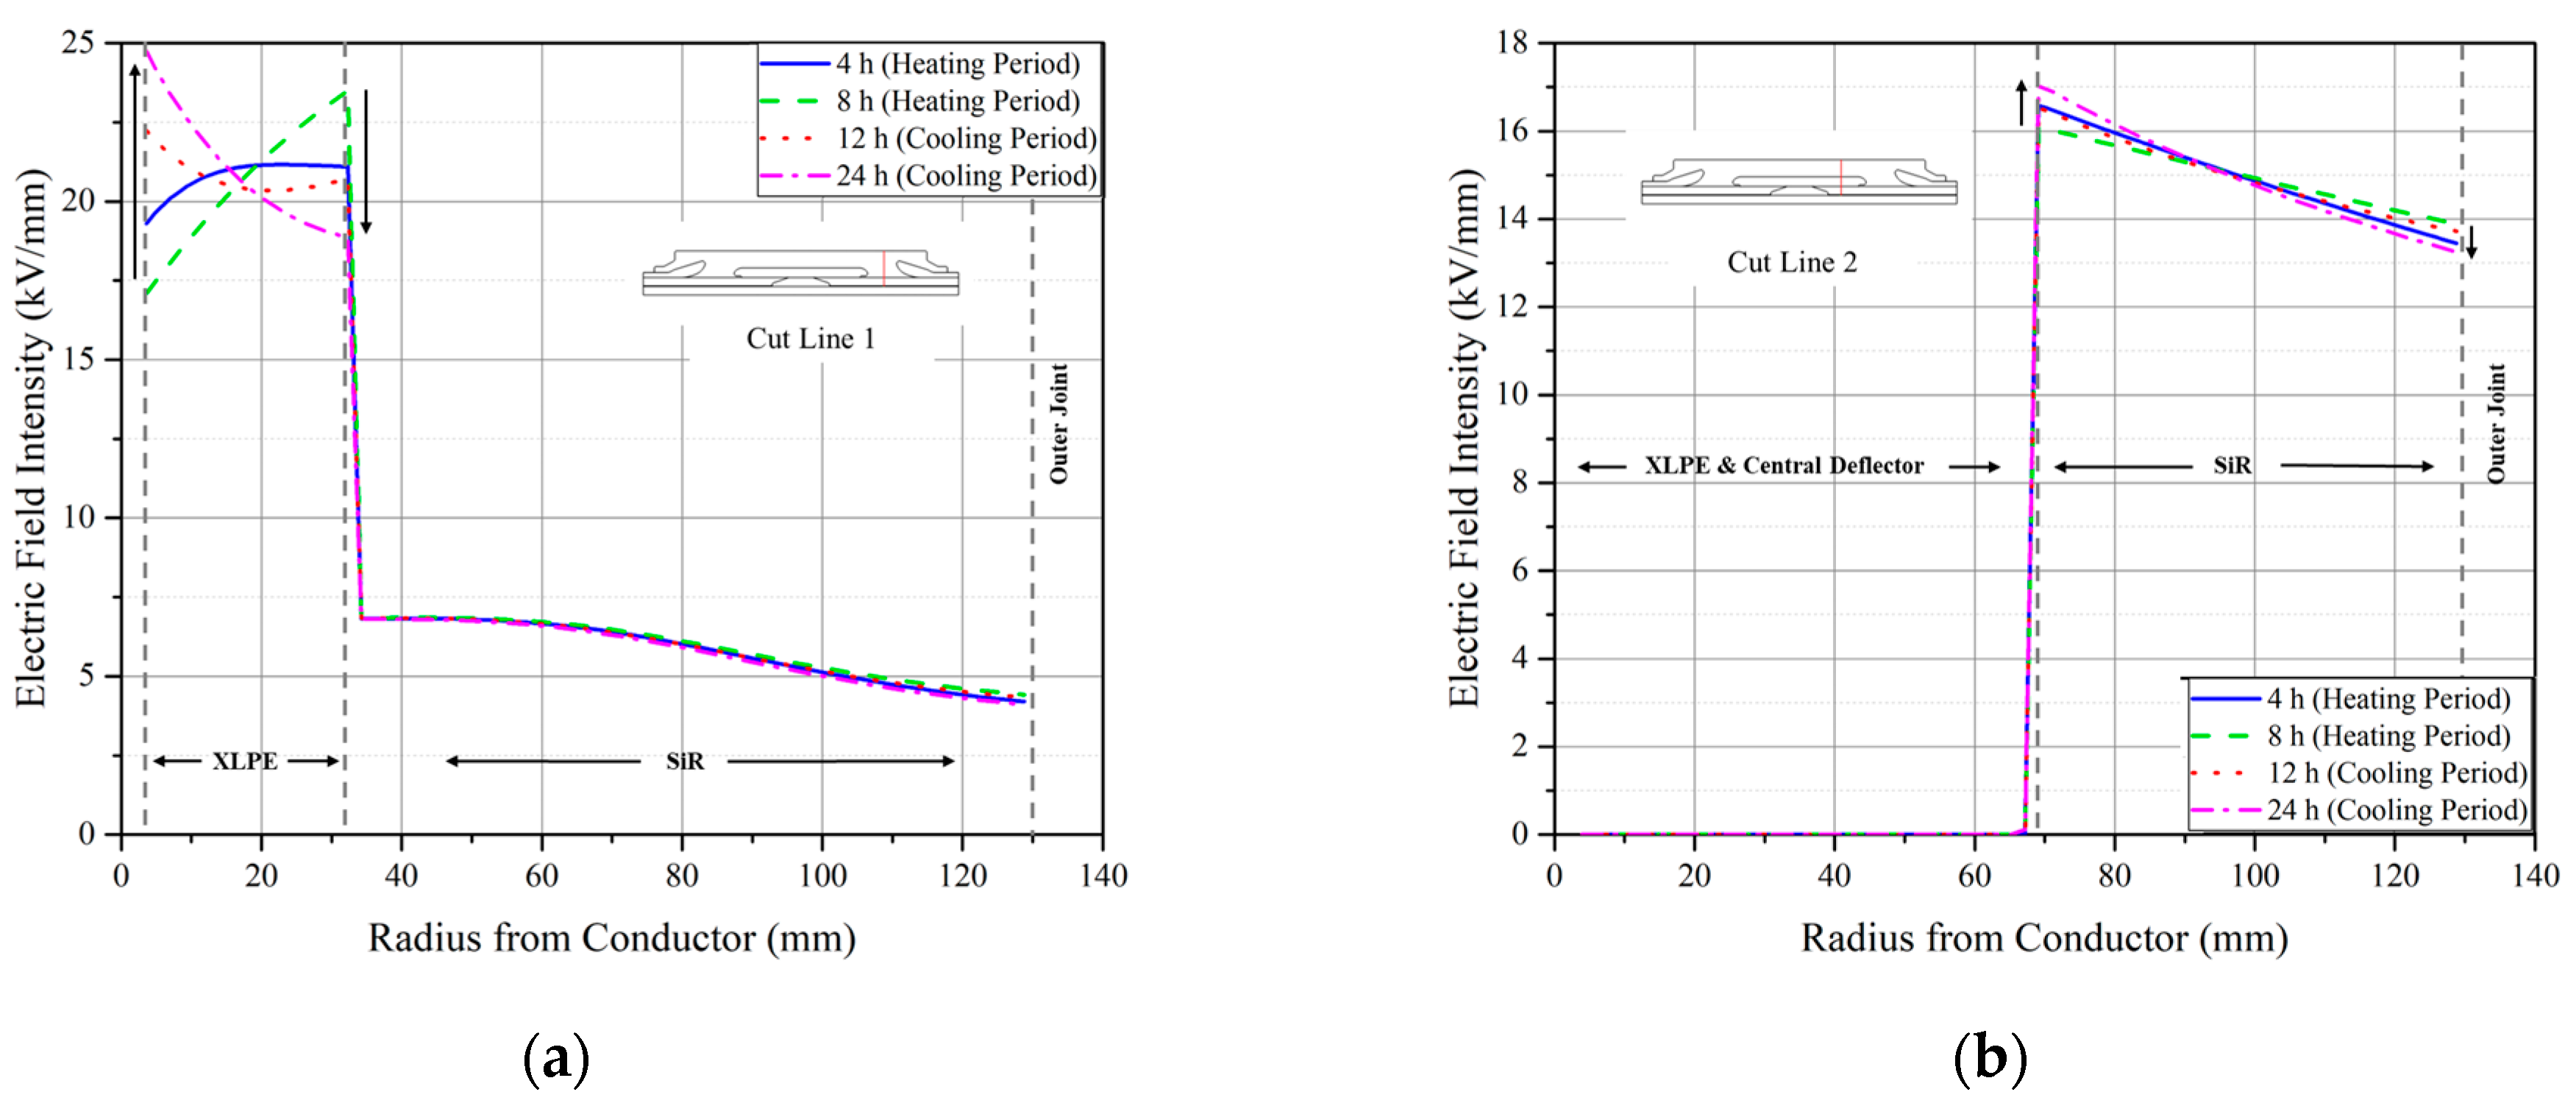
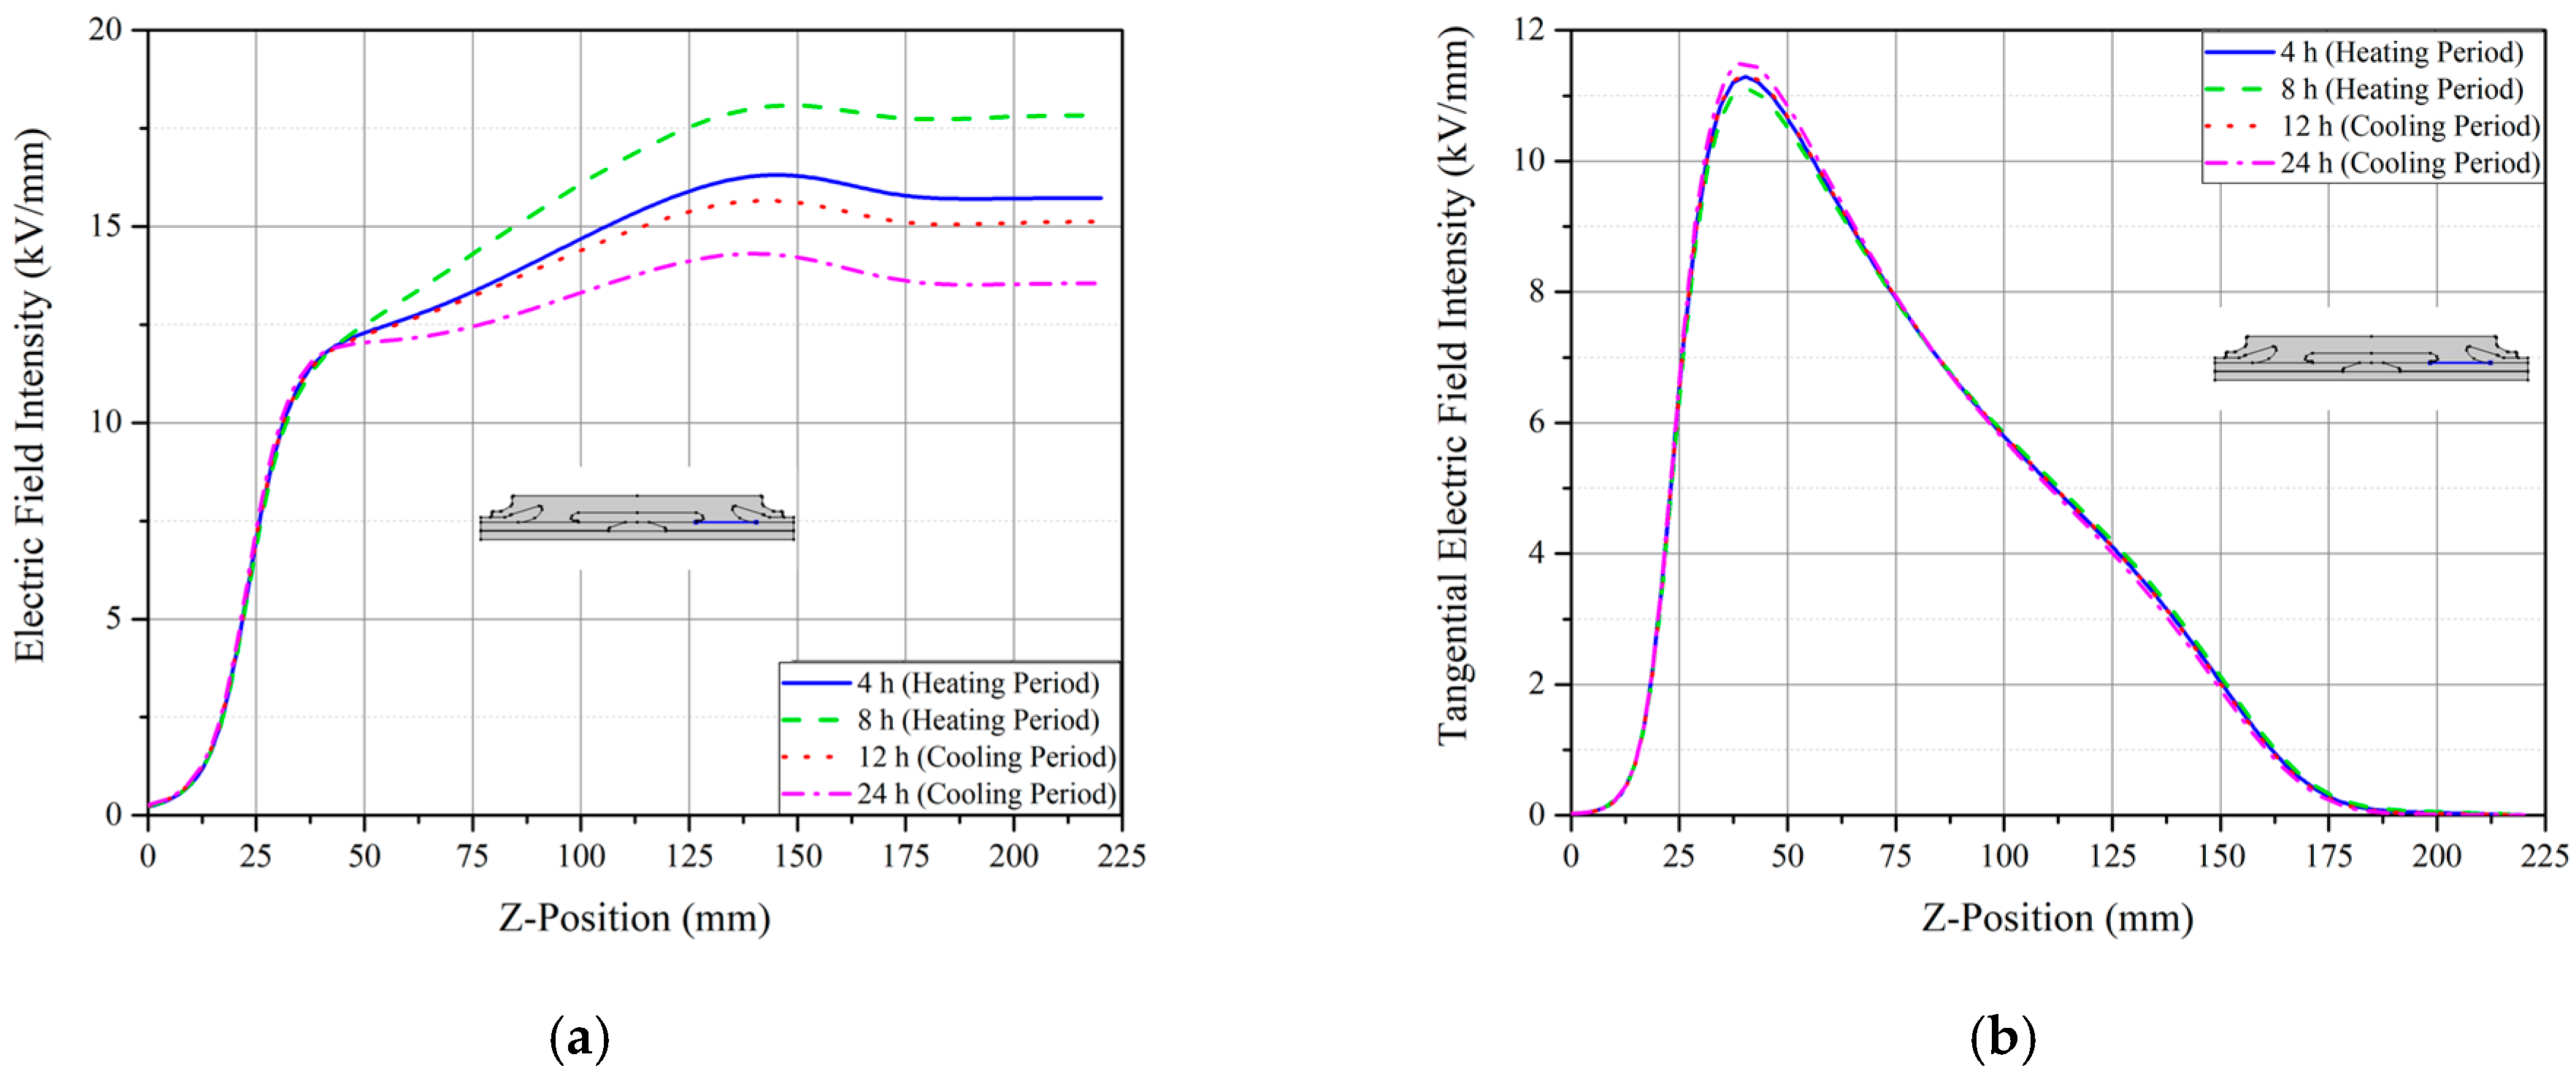
4.2.2. Changes in Electric Field at Specific Locations and Interfaces

Figure 7 is the result of electric field analysis derived according to the path (cut line 1 and 2) indicated inside the joint. At the inner semicon/XLPE interface and the XLPE/SiR interface, the electric field strength varies greatly with time, as shown in Figure 7a. During the heating period, the field strength at the inner semicon/XLPE interface gradually decreased to 17.1 kV/mm at 8 h. On the other hand, in the cooling period, the electric field strength increased to 24.75 kV/mm. Similarly, the field strength at the XLPE/SiR interface was 23.5 kV/mm at 8 h of the heating period, and the field strength decreased to 18.86 kV/mm at 24 h of the cooling period. As a result, the field strength at each interface and the field distribution inside the XLPE layer were different depending on the load conditions. Additionally, in the SiR layer, the electric field strength decreased overall, and the strength change according to the load condition was also insignificant.
Figure 7b shows the results of electric field analysis derived along the path including the central deflector. Most of the electric field is concentrated in the SiR layer, and the electric field strength varies depending on the load condition at each interface. The field strength at the central deflector/SiR interface was 16.1 kV/mm at 8 h of the heating period and 17.08 kV/mm at 24 h of the cooling period. The field strength at the SiR/outer joint interface was 13.88 kV/mm at 8 h of the heating period and 13.25 kV/mm at 24 h of the cooling period.
Figure 8a shows the electric field strength of the interface indicated on the central deflector. The electric field was concentrated at both ends of the deflector, and field strengths of 9.9 kV/mm at 8 h of the heating period and 10.6 kV/mm at 24 h of the cooling period were observed. At the center position of the deflector, 7.64 kV/mm at 8 h and 8.6 kV/mm at 24 h were observed. The overall electric field strength decreased during the heating cycle and, conversely, increased during the cooling cycle. As shown in Figure 8b, due to the characteristics of the semiconducting component, the deflector surface is treated as an equipotential state, and the tangential electric field strength appears to be meaningless.
Figure 9a shows the electric field strength at the indicated XLPE/SiR interface. The electric field strength gradually increases toward the outer deflector. The maximum field strengths at 8 h of the heating period and 24 h of the cooling period were 18.1 kV/mm and 14.3 kV/mm, respectively. Figure 9b shows the tangential field strength of the interface. At a z-axis distance of 40 mm, the maximum intensity at 8 h and 24 h were 11.15 kV/mm and 11.5 kV/mm, respectively.
Table 3 shows the electric field strength and increase/decrease ratio at each location during the cooling cycle from 8 h to 24 h. During the cooling cycle, the electric field strength at the inner semicon/XLPE interface increased by 44% from 17.1 kV/mm to 24.75 kV/mm. As a result, it was confirmed that the change in the electric field strength at both interfaces of the cut line 1 was significant.

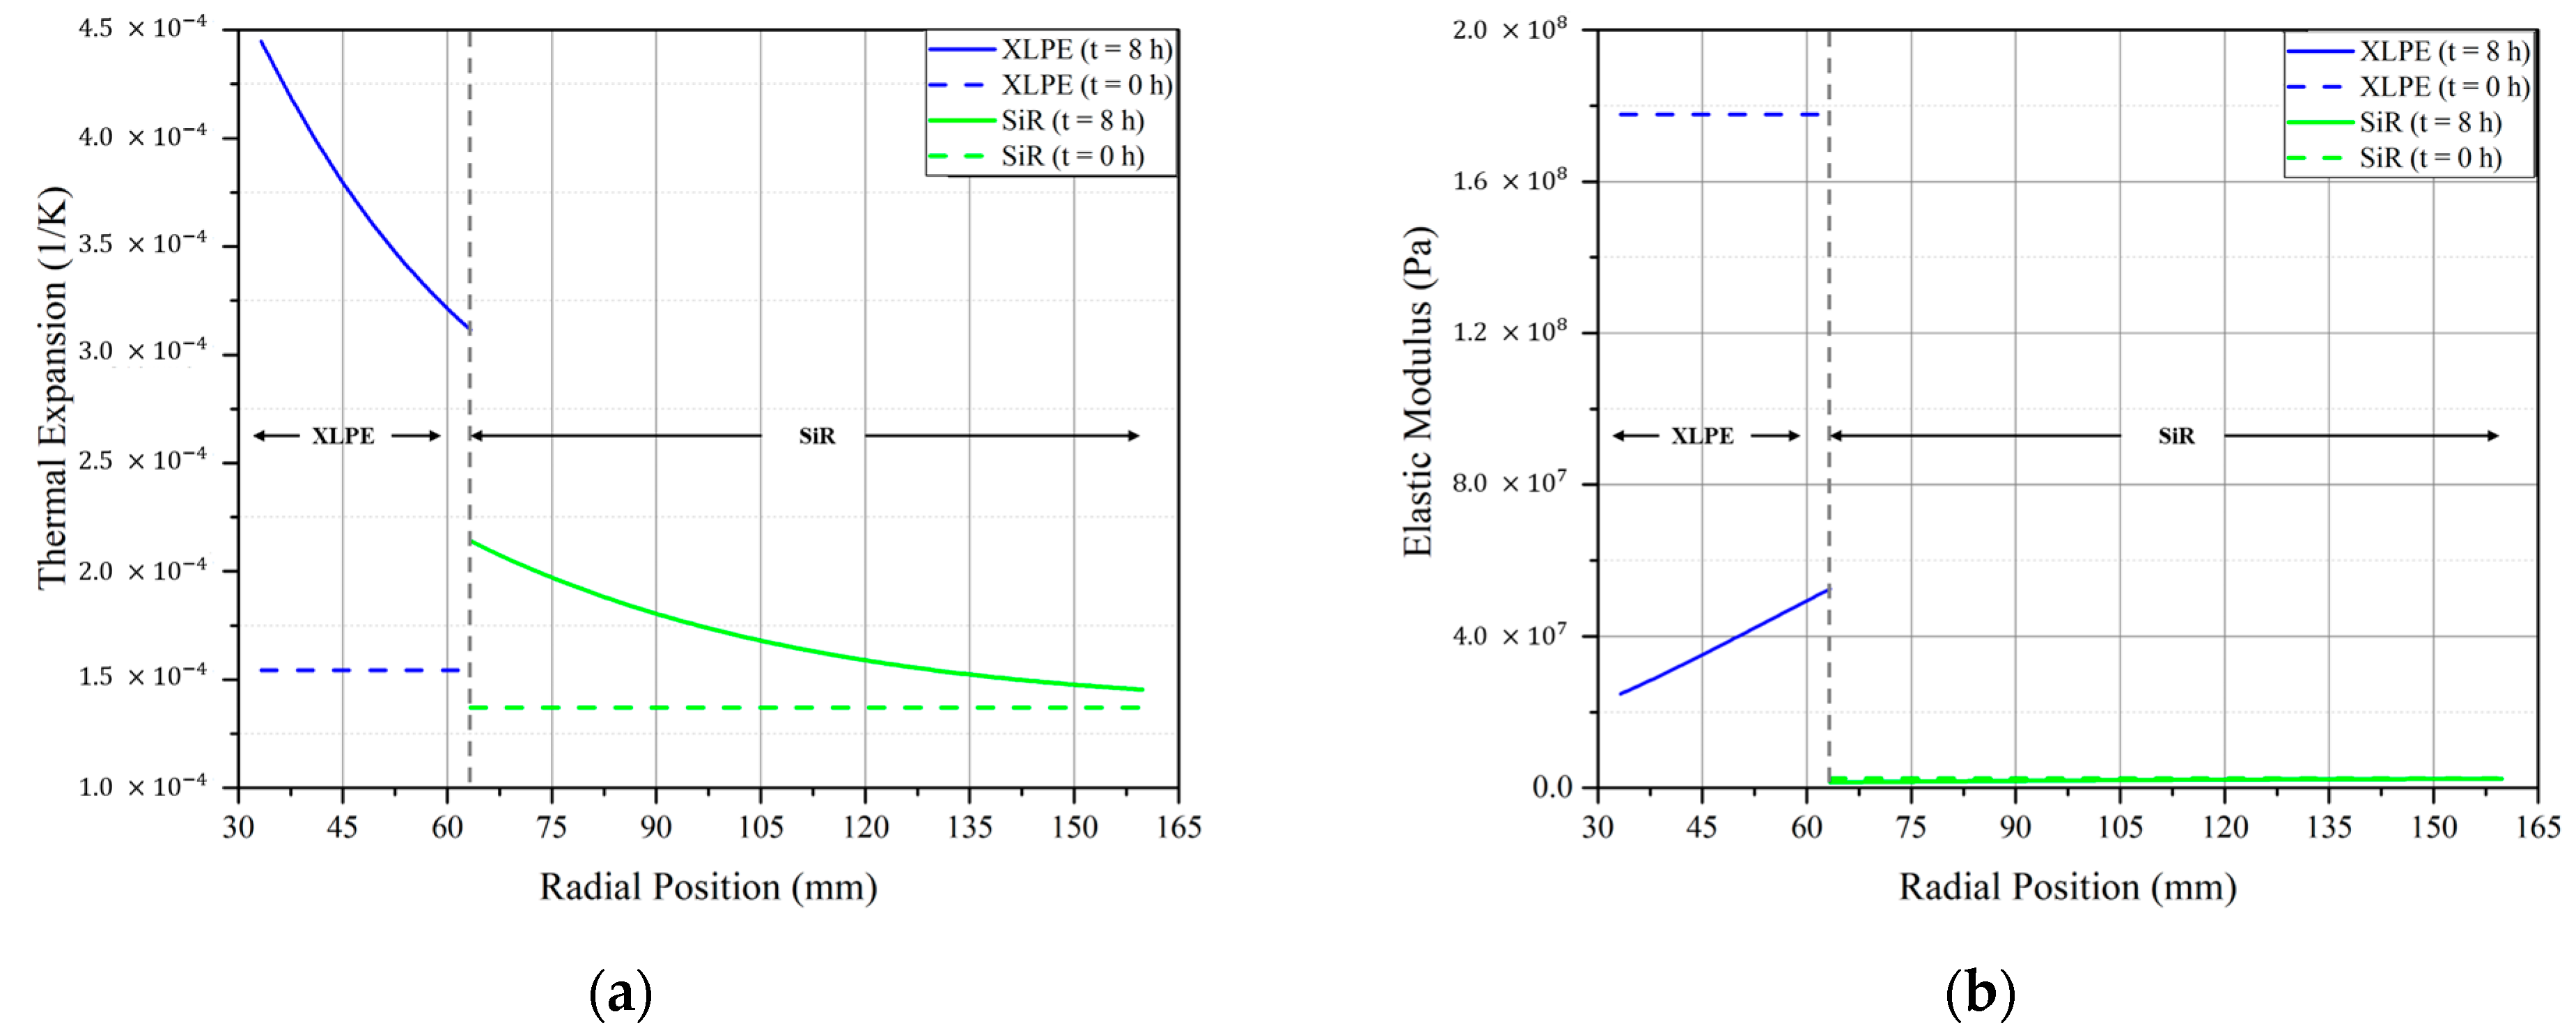
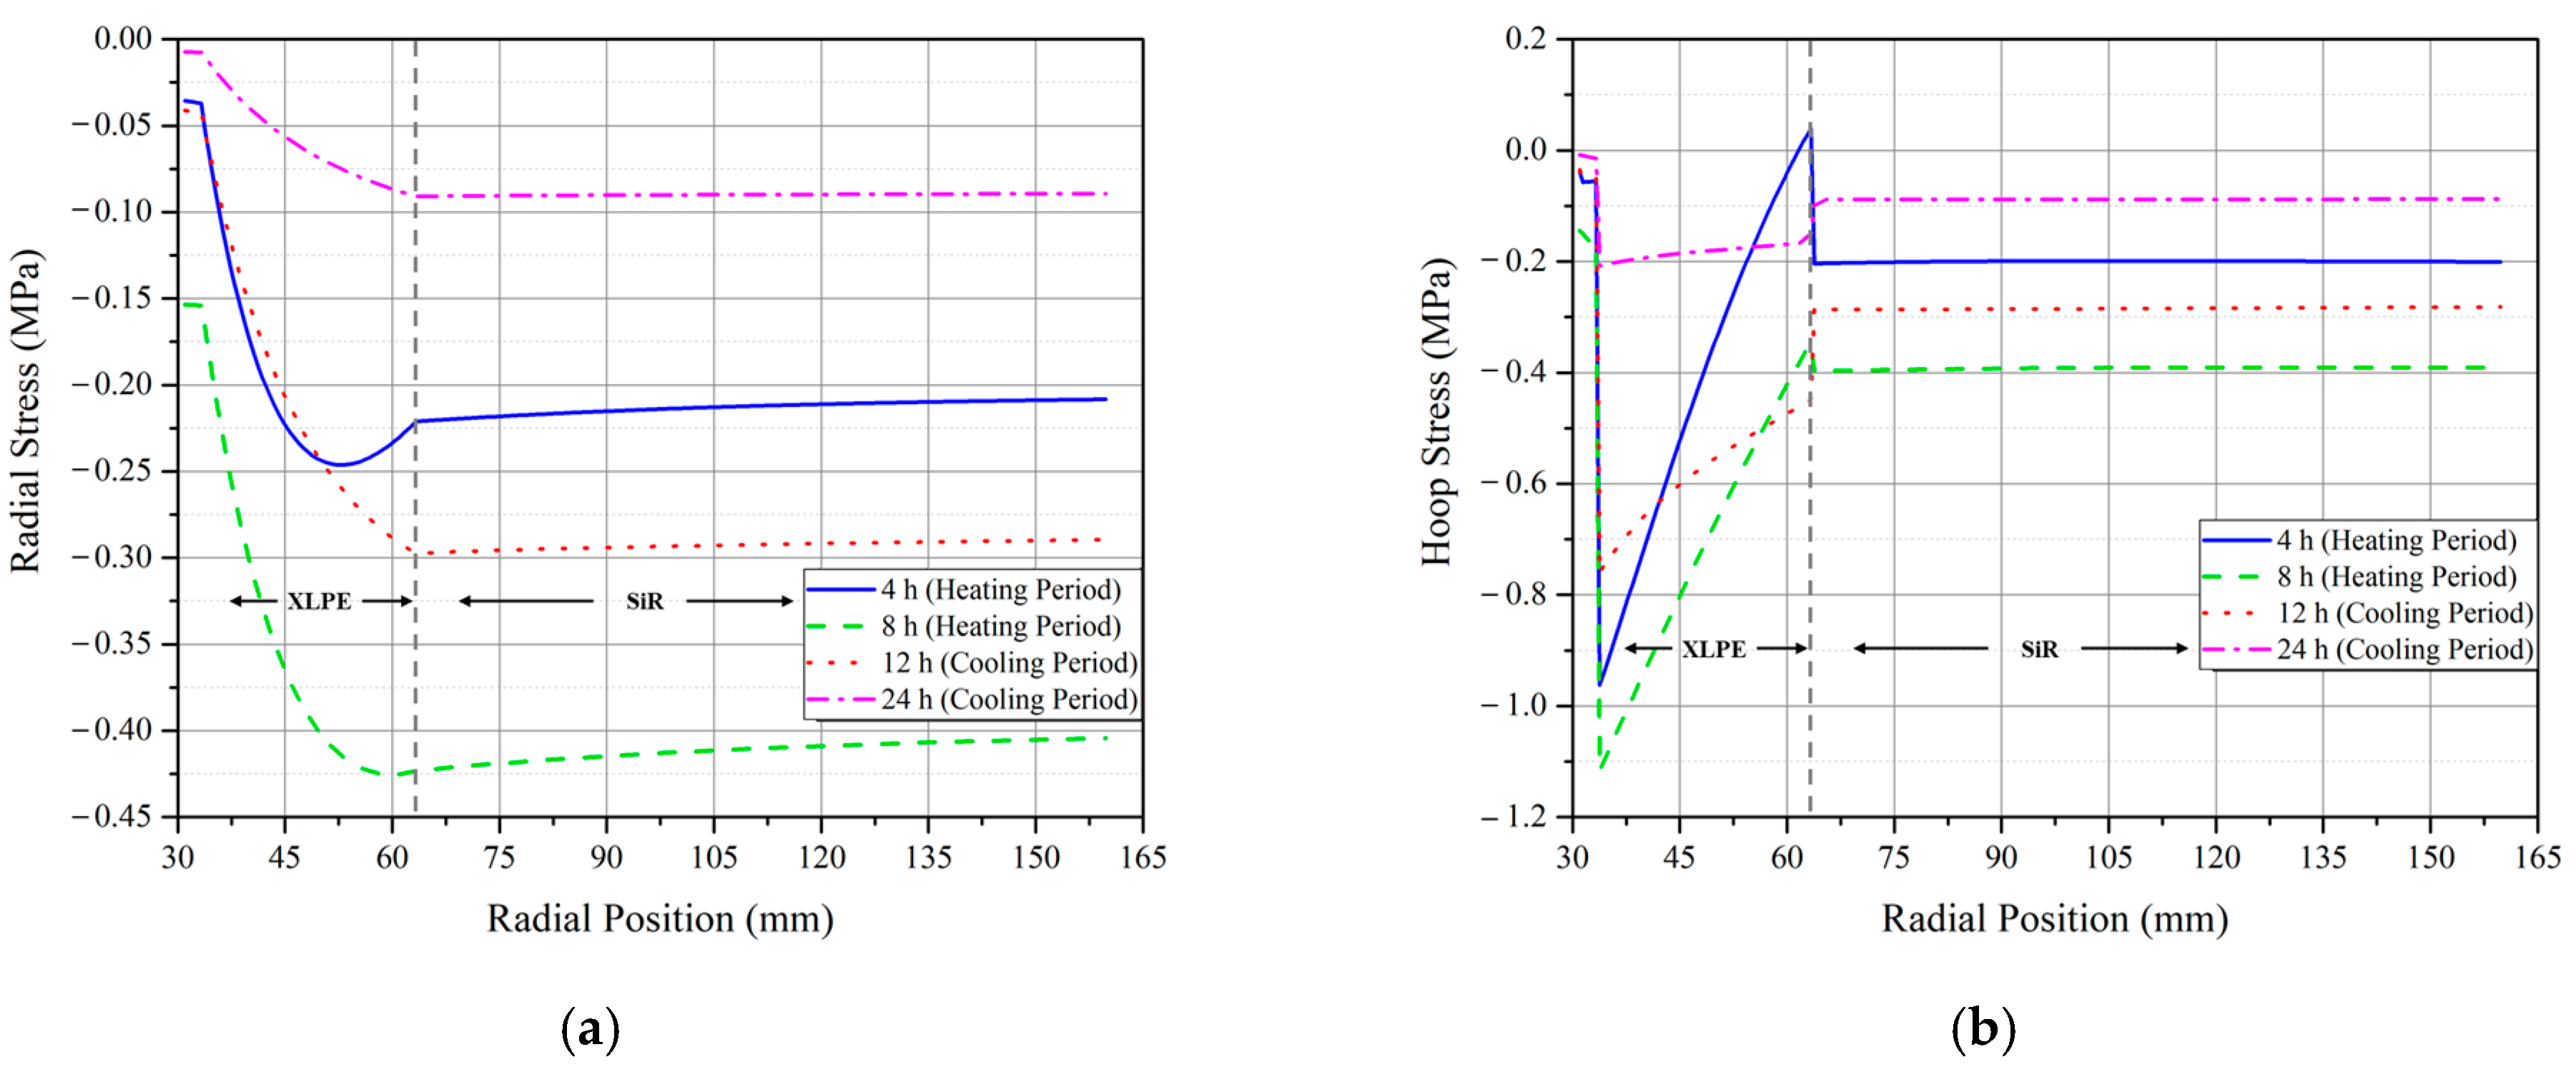
4.3. Mechanical Stress Simulation Results

4.3.1. Mechanical Stress Distribution in the Cable Joint According to the Load Cycles

Figure 10 shows the mechanical stress distribution over the cross section of the cable joint. As shown in Figure 10a, it was confirmed that the radial stress inside the joint increased significantly during the heating period. The maximum compressive radial stress of 0.42 MPa occurred near the XLPE/SiR interface. Thereafter, the radial stress was gradually reduced during the cooling period. In addition, there was a gradient of radial stress depending on the radial position inside the XLPE, whereas the stress inside the SiR was distributed almost uniformly.
Figure 10b shows the hoop stress distribution according to the radial position. The hoop stress inside the joint increased during the heating period, and the maximum compressive hoop stress of 1.11 MPa occurred at the inner semicon/XLPE interface. Similar to the radial stress results, it was confirmed that there is a hoop stress gradient inside the XLPE, while the stress distribution inside the SiR has almost no deviation. As a result, during the heating cycle, the radial and hoop stress increased the most at the XLPE/SiR interface and at the inner semicon/XLPE interface, respectively.
Figure 11 shows the changes in thermal expansion and elastic modulus of XLPE and SiR during a heating cycle of 8 h. Dashed lines indicate the properties of each insulating material at an initial temperature of 20 °C. Figure 11a shows that the thermal expansion for XLPE and SiR increased with temperature rising during the heating period. According to the temperature distribution inside the joint, the thermal expansion showed a linear decrease along the radial position. In addition, compared to SiR, the thermal expansion coefficient of XLPE increased significantly compared to the initial value.
Figure 11b shows that the elastic modulus of XLPE decreased with increasing temperature. The lower elastic modulus means that the XLPE becomes softer as the temperature increases. However, the elastic modulus of SiR did not change during the load cycle, which means that, unlike XLPE, the elastic modulus of SiR is less dependent on temperature. From the comparison of the two parameters, it was found that XLPE had a greater change in mechanical properties due to temperature compared with SiR, which was well reflected in the simulation [34,35]. As a result, XLPE has different values for both thermal expansion and elastic modulus depending on the radius, which leads to a gradient of mechanical stress distribution of the XLPE layer.

4.3.2. Changes in Radial Stress at Specific Locations and Interfaces

The radial stress and electric field strength with time at the two interfaces in contact with the XLPE are presented in Figure 12. Both graphs show common profiles, in that the radial stress increases during the heating period and decreases during the cooling period. These pressure profiles of the simulation results are similar to the measurement results of the cable joints under the thermal cycle conditions [36,37,38]. The measured pressure and simulation results at the XLPE/SiR interface of the cable joints are summarized in Table 4. Experimental results show an increase in interfacial pressure of up to 0.306 MPa and an average of 0.257 MPa as the temperature increases [38]. The results of the simulation show a pressure increase of up to 0.420 MPa. Although the measured data and simulation results are not the same due to the difference in temperature conditions and scale, the pressure dynamics of the XLPE/SiR interface with temperature can be confirmed.
Figure 12a shows that the field intensity decreases during the heating cycle and increases in the subsequent cooling cycle, whereas Figure 12b shows the field intensity increases during the heating cycle and decreases during the cooling cycle.
The radial stress means the contact pressure at the interface. Reduction of contact pressure forms voids at the interface and reduces partial discharge inception voltage (PDIV), which accelerates the deterioration of the insulation material and leads to a decrease in dielectric strength [17,39]. From the simulation results, it was confirmed that not only the pressure at the inner semicon/XLPE interface decreased during the cooling cycle, but also that the electric field was strengthened by the capacitive field. In this case, if an overvoltage, such as lightning or switching impulse, is introduced into the cable, a breakdown may occur due to the intensive field strength superimposed at the interface. As a result, the cooling cycle can be considered as the most severe condition for the insulation of the cable system. Therefore, in order to prevent a decrease in dielectric strength due to pressure even in the cooling cycle, it is necessary to secure a sufficient initial pressure.

5. Conclusions

In this paper, the electric field and mechanical stress inside an HVDC XLPE cable joint were analyzed using numerical analysis and under load cycle conditions. The electrical and mechanical properties of the joint were investigated by representing the electrical conductivity, thermal expansion, and elastic modulus of the materials as temperature dependent. The conclusions drawn from this study are as follows:
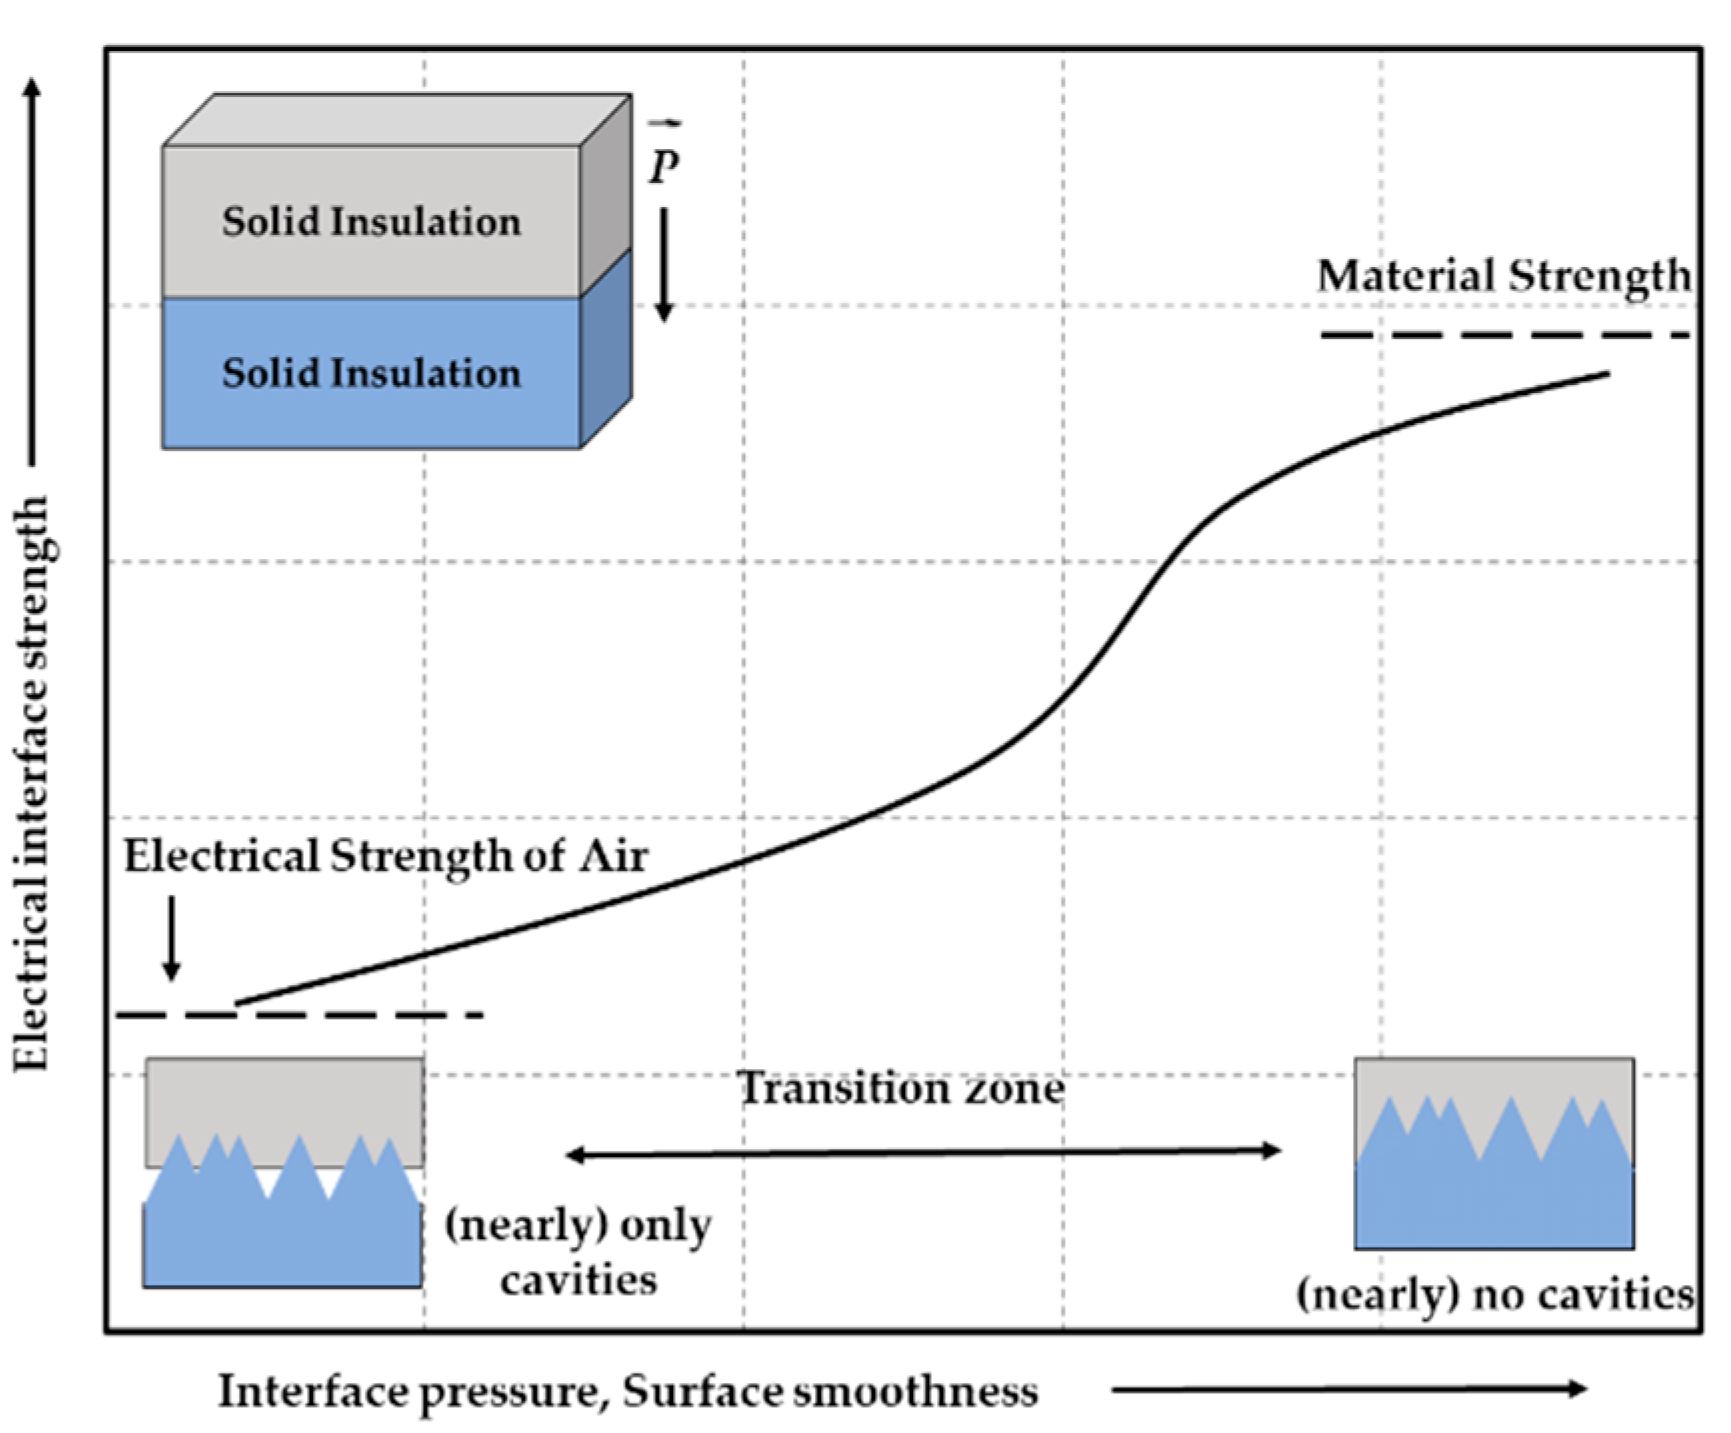
  • Due to the difference in conductivity between XLPE and SiR, most of the electric field is concentrated on the cable insulation layer.
  • During the heating period, the electric field inversion was observed in which the electric field concentration gradually moved to the outer XLPE.
  • During the cooling period of 16 h after the heating period, changes in the electric field strength of 44% at the inner semicon/XLPE interface and 20% at the XLPE/SiR interface were confirmed.
  • Radial and hoop stress increased the most at the XLPE/SiR interface and at the inner semicon/XLPE interface, respectively.
  • During the cooling cycle, the electric field strength at the inner semicon/XLPE interface increased and the radial stress decreased.
  • As a result, this behavior of the electric field and the radial stress can decrease the dielectric strength of the cable joint.
  • In conclusion, it is important to ensure sufficient initial pressure so that the dielectric strength at the interface does not decrease, even if there is a loss of interface pressure due to temperature fluctuations.
Numerical analysis using the finite element method makes it possible to analyze the electrical and mechanical properties of the cable joints, taking into account transient conditions, such as temperature cycles. In the future, we plan to conduct experimental verification and simulations considering various transient states, such as polarity reversal, superimposed impulse voltages and fault currents. Additionally, the deformation of components, such as deflectors or stress cones, for cable accessories with a two-dimensional axisymmetric structure and their resulting electrical properties will be analyzed.

Author Contributions

Conceptualization, S.-J.K. and B.-W.L.; methodology, S.-J.K.; software, S.-J.K.; validation, S.-J.K. and B.-W.L.; investigation, D.-G.L. and J.-H.K.; resources, S.-J.K.; data curation, S.-J.K.; writing—original draft preparation, S.-J.K.; writing—review and editing, S.-J.K. and B.-W.L.; visualization, S.-J.K. and D.-G.L.; supervision, B.-W.L. All authors have read and agreed to the published version of the manuscript.

Funding

This research received no external funding.

Institutional Review Board Statement

Not applicable.

Informed Consent Statement

Not applicable.

Data Availability Statement

Not applicable.

Conflicts of Interest

The authors declare no conflict of interest.

References

  1. Andersen, B. HVDC transmission-opportunities and challenges. In Proceedings of the 8th IEE International Conference on AC and DC Power Transmission (ACDC 2006), London, UK, 28–31 March 2006; pp. 24–29. [Google Scholar]
  2. Arrillaga, J.; Arrillaga, J. High Voltage Direct Current Transmission; Iet: London, UK, 1998; Volume 29. [Google Scholar]
  3. Meah, K.; Ula, S. Comparative evaluation of HVDC and HVAC transmission systems. In Proceedings of the 2007 IEEE Power Engineering Society General Meeting, Tampa, FL, USA, 24–28 June 2007; pp. 1–5. [Google Scholar]
  4. Rudervall, R.; Charpentier, J.; Sharma, R. High voltage direct current (HVDC) transmission systems technology review paper. Energy Week 2000, 2000, 1–19. [Google Scholar]
  5. Alassi, A.; Bañales, S.; Ellabban, O.; Adam, G.; MacIver, C. HVDC transmission: Technology review, market trends and future outlook. Renew. Sustain. Energy Rev. 2019, 112, 530–554. [Google Scholar] [CrossRef]
  6. Ardelean, M.; Minnebo, P. HVDC Submarine Power Cables in the World: State-of-the-Art Knowledge; Office of the European Union: Luxembourg, 2015. [Google Scholar]
  7. Valenza, D.; Cipollini, G. HVDC submarine power cable systems-state of the art and future developments. In Proceedings of the the 1995 International Conference on Energy Management and Power Delivery EMPD’95, Singapore, 21–23 November 1995; pp. 283–287. [Google Scholar]
  8. Ghorbani, H.; Jeroense, M.; Olsson, C.-O.; Saltzer, M. HVDC cable systems—Highlighting extruded technology. IEEE Trans. Power Deliv. 2013, 29, 414–421. [Google Scholar] [CrossRef]
  9. Mazzanti, G.; Castellon, J.; Chen, G.; Fothergill, J.; Fu, M.; Hozumi, N.; Lee, J.; Li, J.; Marzinotto, M.; Mauseth, F. The insulation of HVDC extruded cable system joints. Part 1: Review of materials, design and testing procedures. IEEE Trans. Dielectr. Electr. Insul. 2019, 26, 964–972. [Google Scholar] [CrossRef]
  10. CIGRÉ, J.T.F. 21/15, Interfaces in Accessories for Extruded HV and EHV Cables; Technical Brochure; Springer: Berlin/Heidelberg, Germany, 2002; p. 210. [Google Scholar]
  11. Dang, C.; Fournier, D. Dielectric performance of interfaces in premolded cable joints. IEEE Trans. Power Deliv. 1997, 12, 29–32. [Google Scholar] [CrossRef]
  12. Fournier, D.; Lamarre, L. Effect of pressure and length on interfacial breakdown between two dielectric surfaces. In Proceedings of the Conference Record of the 1992 IEEE International Symposium on Electrical Insulation, Baltimore, MD, USA, 07–10 June 1992; pp. 270–272. [Google Scholar]
  13. Du, B.; Gu, L. Effects of interfacial pressure on tracking failure at XLPE cable joint by analyzing discharge light distribution. In Proceedings of the 2010 10th IEEE International Conference on Solid Dielectrics, Potsdam, Germany, 4–9 July 2010; pp. 1–4. [Google Scholar]
  14. Du, B.; Gu, L.; Zhang, X.; Zhu, X. Fundamental research on dielectric breakdown between XLPE and silicon rubber interface in HV cable joint. In Proceedings of the 2009 IEEE 9th International Conference on the Properties and Applications of Dielectric Materials, Harbin, China, 19–23 July 2009; pp. 97–100. [Google Scholar]
  15. Kantar, E.; Ildstad, E.; Hvidsten, S. Effect of material elasticity on the longitudinal AC breakdown strength of solid-solid interfaces. IEEE Trans. Dielectr. Electr. Insul. 2019, 26, 655–663. [Google Scholar] [CrossRef]
  16. Yoshida, S.; Tan, M.; Yagi, S.; Seo, S.; Isaka, M. Development of prefabricated type joint for 275 kV XLPE cable. In Proceedings of the IEEE international symposium on electrical insulation, Toronto, ON, Canada, 3–6 June 1990; pp. 290–295. [Google Scholar]
  17. Illias, H.; Chen, G.; Lewin, P.L. Modeling of partial discharge activity in spherical cavities within a dielectric material. IEEE Electr. Insul. Mag. 2011, 27, 38–45. [Google Scholar] [CrossRef]
  18. Denholm, P.; Ela, E.; Kirby, B.; Milligan, M. Role of Energy Storage with Renewable Electricity Generation; National Renewable Energy Lab.(NREL): Golden, CO, USA, 2010. [Google Scholar]
  19. Sinden, G. Characteristics of the UK wind resource: Long-term patterns and relationship to electricity demand. Energy Policy 2007, 35, 112–127. [Google Scholar] [CrossRef]
  20. Liu, T.; Hui, B.; Fu, M.; Hou, S.; Luo, B.; Wang, G. Experimental and simulation analysis of electrical breakdown for 220kV silicone rubber pre-moulded cable joints. In Proceedings of the 2017 INSUCON-13th International Electrical Insulation Conference (INSUCON), Birmingham, UK, 16–18 May 2017; pp. 1–5. [Google Scholar]
  21. Wang, X.; Wang, C.; Wu, K.; Tu, D.; Liu, S.; Peng, J. An improved optimal design scheme for high voltage cable accessories. IEEE Trans. Dielectr. Electr. Insul. 2014, 21, 5–15. [Google Scholar] [CrossRef]
  22. Song, M.; Jia, Z. Calculation and simulation of mechanical pressure of XLPE-SR surface in cable joints. In Proceedings of the 2018 12th International Conference on the Properties and Applications of Dielectric Materials (ICPADM), Xi’an, China, 2 July 2018; pp. 1001–1005. [Google Scholar]
  23. CIGRE WG B1.32. Recommendations for Testing DC Extruded Cable Systems for Power Transmission at a Rated Voltage up to 500 kV; CIGRE Technical Brochure 496; International Council on Large Electric Systems: Paris, France, 2012. [Google Scholar]
  24. Hampton, R. Some of the considerations for materials operating under high-voltage, direct-current stresses. IEEE Electr. Insul. Mag. 2008, 24, 5–13. [Google Scholar] [CrossRef]
  25. Mauseth, F.; Haugdal, H. Electric field simulations of high voltage DC extruded cable systems. IEEE Electr. Insul. Mag. 2017, 33, 16–21. [Google Scholar] [CrossRef] [Green Version]
  26. Reddy, C.C.; Ramu, T. On the computation of electric field and temperature distribution in HVDC cable insulation. IEEE Trans. Dielectr. Electr. Insul. 2006, 13, 1236–1244. [Google Scholar] [CrossRef]
  27. Jeroense, M.; Morshuis, P. Electric fields in HVDC paper-insulated cables. IEEE Trans. Dielectr. Electr. Insul. 1998, 5, 225–236. [Google Scholar] [CrossRef]
  28. Zhou, Y.; Peng, S.; Hu, J.; He, J. Polymeric insulation materials for HVDC cables: Development, challenges and future perspective. IEEE Trans. Dielectr. Electr. Insul. 2017, 24, 1308–1318. [Google Scholar] [CrossRef]
  29. Mazzanti, G.; Marzinotto, M. Extruded Cables for High-Voltage Direct-Current Transmission: Advances in Research and Development; John Wiley & Sons: Hoboken, NJ, USA, 2013; Volume 93. [Google Scholar]
  30. Slaughter, W.S. The Linearized Theory of Elasticity; Springer Science & Business Media: Berlin/Heidelberg, Germany, 2012. [Google Scholar]
  31. Diban, B.; Mazzanti, G. The effect of insulation characteristics on thermal instability in HVDC extruded cables. Energies 2021, 14, 550. [Google Scholar] [CrossRef]
  32. Frobin, S.J.; Niedik, C.F.; Freye, C.; Jenau, F.; Häring, D.; Schröder, G. A generic approach for HVDC cable accessories modelling. In Proceedings of the 2018 IEEE 2nd International Conference on Dielectrics (ICD), Budapest, Hungary, 1–5 July 2018; pp. 1–6. [Google Scholar]
  33. Chi, Q.-G.; Li, Z.; Zhang, T.-D.; Zhang, C.-H. Study on nonlinear conductivity of copper-titanate-calcium/liquid silicone rubber composites. IEEE Trans. Dielectr. Electr. Insul. 2019, 26, 681–688. [Google Scholar] [CrossRef]
  34. Hamdan, M.; Pilgrim, J.; Lewin, P. Thermo-mechanical analysis of solid interfaces in HVAC cable joints. IEEE Trans. Dielectr. Electr. Insul. 2019, 26, 1779–1787. [Google Scholar] [CrossRef] [Green Version]
  35. Eichhorn, R. A critical comparison of XLPE-and EPR for use as electrical insulation on underground power cables. IEEE Trans. Electr. Insul. 1981, 469–482. [Google Scholar] [CrossRef]
  36. Amyot, N.; David, E. A study of interfacial pressure behavior for two types of thermally cycled coldshrinkable joints. In Proceedings of the Conference Record of the the 2002 IEEE International Symposium on Electrical Insulation (Cat. No. 02CH37316), Boston, MA, USA, 7–10 April 2002; pp. 476–480. [Google Scholar]
  37. Amyot, N.; Fournier, D. Influence of thermal cycling on the cable-joint interfacial pressure. In Proceedings of the the 20001 IEEE 7th International Conference on Solid Dielectrics (ICSD’01) (Cat. No. 01CH37117), Eindhoven, The Netherlands, 25–29 June 2001; pp. 35–38. [Google Scholar]
  38. Di Sante, R.; Ghaderi, A.; Mingotti, A.; Peretto, L.; Tinarelli, R. Effects of thermal cycles on interfacial pressure in MV cable joints. Sensors 2019, 20, 169. [Google Scholar] [CrossRef] [PubMed] [Green Version]
  39. Oh, D.-H.; Kim, H.-S.; Lee, B.-W. Novel diagnostic method of DC void discharge in high temperature superconducting cable based on pulse sequence analysis. IEEE Trans. Appl. Supercond. 2020, 30, 1–5. [Google Scholar] [CrossRef]
Figure 1. Electrical strength characteristics according to interface pressure [10].
Energies 15 04684 g001
Figure 2. Multiphysics coupling process in COMSOL 6.0 software.
Energies 15 04684 g002
Figure 3. Geometry of the cable joint for simulation: (a) The two-dimensional axisymmetric cable joint; (b) Cross section of the joint used for thermal mechanical analysis.
Energies 15 04684 g003
Figure 4. Overall process of thermal mechanical model for the cable joints.
Energies 15 04684 g004
Figure 5. Thermal simulation results: (a) Time-varying temperature distribution inside the cable joint; (b) Temperature profiles during the entire load cycles.
Energies 15 04684 g005
Figure 6. Electrical simulation results: (a) Time-varying electric field distribution and equipotential line; (b) Electric field profiles during the entire load cycles.
Energies 15 04684 g006
Figure 7. Time-varying electric field distribution: (a) Radial path without central deflector; (b) Radial path with central deflector.
Energies 15 04684 g007
Figure 8. Time-varying electric field distribution at central deflector/SiR interface: (a) Electric field intensity at the interface; (b) Tangential electric field intensity at the interface.
Energies 15 04684 g008
Figure 9. Time-varying electric field distribution at XLPE/SiR interface: (a) Electric field intensity at the interface; (b) Tangential electric field intensity at the interface.
Energies 15 04684 g009
Figure 10. Mechanical stress distribution during load cycle: (a) Radial stress; (b) Hoop stress.
Energies 15 04684 g010
Figure 11. Distribution of thermal expansion and elastic modulus of XLPE and SiR: (a) Thermal expansion; (b) Elastic modulus.
Energies 15 04684 g011
Figure 12. The radial stress and electric field intensity with time at the two interfaces (a) Inner semi-con/XLPE interface; (b) XLPE/SiR interface.
Energies 15 04684 g012
Table 1. Parameters used for the thermal electrical model [32,33].
ParameterXLPESiR
Temperature dependent coefficient α (1/K)0.050.01672
Electric field dependent coefficient β (mm/kV)0.030.04719
Relative permittivity Ɛr2.33.3
Reference electrical conductivity σ0 (S/m)3 × 10−162.2 × 10⁻¹³
Reference temperature T0 (K)298.15298.15
Reference electric field E0 (kV/mm)1010
Thermal conductivity k (W/(m∙K))0.2860.29
Heat transfer coefficient h (W/(m2∙K))5
Ambient temperature Tamb (K)293.15
Table 2. Parameters used for the thermal mechanical stress model [34].
ParametersXLPESiRCopper
Elastic modulus (Pa) 3.8 × 10 8 e 0.038 T 3.6 × 10 6 e 0.01713 T 126 × 10 9
Thermal expansion (1/K) 3.6 × 10 8 T 2 + 2.3 × 10 6 T + 9.4 × 10 5 2.4 × 10 6 T + 8.9 × 10 5 1.9 × 10 5
Poisson’s ratio0.460.490.34
Table 3. The electric field strength and changes during the cooling cycle.
Location in Cable JointsEt = 8 h
(kV/mm)
Et = 24 h
(kV/mm)
Field Strength Change
Cut Line 1Inner Semicon/XLPE17.1024.7544% increase
XLPE/SiR23.5018.8620% decrease
Cut Line 2Central Deflector/SiR16.1017.086% increase
SiR/Outer Joint13.8813.255% decrease
Deflector/SiREnd of Deflector9.910.607% increase
Middle of the Deflector7.648.6012% increase
XLPE/SiRz-axis, 148 mm18.1014.3011% decrease
Table 4. Comparison of XLPE/SiR interfacial pressure increment between experimental data and simulation.
Varying Temperature RangeDiameter of ConductorInterfacial Pressure
Increment
Experimental Results [38]24~60 °CApprox. 13 mmMax. 0.306 MPa
Average. 0.257 MPa
Simulation Results20~73 °C
(First cycle)
62 mm0.420 MPa
Publisher’s Note: MDPI stays neutral with regard to jurisdictional claims in published maps and institutional affiliations.

