Abstract
The tobacco industry is an important contributor to realizing the carbon reduction goal. Less attention is paid to the carbon emissions of the tobacco industry. The tobacco production system is generally a carbon sink, where carbon sequestration by photosynthesis in tobacco planting and by soil are sufficient to offset the carbon emissions of the tobacco production system. This work proposed an integrated framework of life-cycle assessment (LCA) and Source-Sink Model to determine the optimal allocation of carbon sources to sinks with the objective of maximizing the profitable external benefits. From an economic perspective, internal carbon sources could be offset by the internal carbon sink of the tobacco production system. The additional internal carbon sinks can be transferred in the form of carbon trading, increasing external revenue. A case-study tobacco manufacturing plant in Sichuan, China, was chosen to demonstrate the feasibility of the proposed work. This study assesses the carbon footprint and economic benefits of a tobacco industry supply chain case (from tobacco cultivation to finished product) and analyzes the energy restructuring of different percentages of renewable energy to replace thermal power. The objective of the study is to maximise the offsetting of carbon emissions from the tobacco production system, while achieving optimal internal costs and profitable external benefits.
1. Introduction
In the context of climate change, the Paris Agreement sets the goal of limiting the global average surface temperature rise in the 21st century to below 2 °C from pre-industrial levels and further reduce it to 1.5 °C. To achieve the goal of climate governance, a balance must be achieved between the anthropogenic emissions of greenhouse gases (GHGs) by sources and removal by sinks during the second half of this century. In September 2020, China pledged to achieve a carbon peak by 2030 and to achieve the goal of carbon neutrality by 2060. In 2019, carbon emissions related to energy consumption in China accounted for 28% of the global energy-related CO2 emissions [,]. The carbon neutrality target in China is expected to reduce global warming by 0.24 °C in the 21st century [], which could increase China’s GDP and lead to a positive “spillover” effect on other countries.
Industries play a key role not only in the economy but also in the field of energy consumption. As urbanization and industrialization have rapidly increased in China, industrial value-added accounts for more than 30% of China’s GDP [], and contributes to approximately 70% of China’s total energy consumption []. This indicates that the industrial sector plays an important role in reducing CO2 emissions in China. The overall efficiency of direct and embodied carbon emissions in China has improved in recent decades. However, significant heterogeneity exists among the various industry sectors []. Many studies have explored the changes in the influencing factors, energy consumption, and environmental impacts of industrial CO2 emissions in China. Lin and Wang [] analyzed the energy efficiency of China’s steel industry based on a stochastic frontier model. Wang et al. [] proposes a new total factor energy-efficiency indicator, based on the directional meta-frontier data envelopment analysis (DEA) approach, to account for the heterogeneity of production technology among provinces in China. An et al. [] constructed a DEA and grid search (DEA-GS) model from a cost perspective to understand emission-reduction characteristics and found that the carbon price for China’s manufacturing industry should not exceed 200 RMB/t. Jin and Han [] conducted a decoupling analysis of carbon emissions and industrial value-added to investigate the state of the manufacturing industry under “low carbon” and “economy” pressures.
The abovementioned studies primarily analyzed the potential for carbon reduction, the efficiency of resource utilization, and a characteristic analysis of carbon emissions from the industry. Less attention has been paid to the management of carbon emissions from a systematic perspective. Carbon emission pinch analysis (CEPA) is an effective technique that can be used to examine options to decarbonize the power generation sector. Its graphical tools have a highly intuitive visual display, which can be readily interpreted and used for effective communication with stakeholders and decision makers. This technique was first introduced by Tan and Foo [], as a special branch of the pinch analysis approach, which has been recognized as a systematic design tool for heat recovery systems in energy-intensive processes since the late 1970s []. Tan and Foo [] first introduced a graphical tool known as the energy-planning pinch diagram (EPPD) to identify the minimum zero-carbon renewable energy sources (termed the “target”) for an energy-planning scenario. The tool could identify the optimum pairing of energy sources and demands by maximizing the use of readily available but polluting fossil sources. Lee et al. [] expanded the application of the EPPD to cases with near-zero carbon renewables. Foo et al. [] also proposed an equivalent algebraic tool to identify a rigorous target for the energy-planning problem. This was further applied to the planning of Carbon Capture and Storage (CCS) by establishing various graphical tools []. After over a decade of development, the CEPA was widely applied to determine energy planning with carbon constraints in many countries. Jia et al. [] analyzed power generation planning in China based on five key indices. Li et al. [] proposed a modified CEPA to minimize the carbon footprint of regional renewable electricity planning in China. Moreover, CEPA has been applied to optimize the carbon emission strategies of municipal solid-waste management [].
The tobacco industry is an important sector, which significantly contributes to the GDP of China. In January 2022, the State Tobacco Administration in China specified the main objectives of the industry’s carbon peak and carbon neutral activities. The industry’s green low-carbon cycle development system was estimated to be established by 2025, and the CO2 emissions per 10,000 yuan of industrial value addition would be 20% lower than those in 2020. By 2030, the CO2 emissions of 10,000 yuan of industrial value addition will be reduced by more than 80% compared to 2005, and a carbon peak is expected to be achieved ahead of schedule. By 2060, the industry’s green low-carbon cycle development system and a clean, low-carbon, safe, and efficient energy system would be fully established, energy utilization efficiency would be at the advanced international level, the proportion of non-fossil energy consumption would be significantly increased, and the carbon neutral goal would be successfully achieved.
Tobacco companies are actively exploring methods to achieve dual carbon goals. At the international scale, Philip Morris International Tobacco (PMI) released a low-carbon transition plan to achieve carbon neutrality in its direct operations by 2025 and carbon neutrality throughout its value chain by 2040. China’s Beijing Tobacco Logistics Center studied the carbon peak and carbon-neutral measures to build a green supply system involving the entire cigarette distribution process. Sichuan Cigarette Industry Co., Ltd. has fully launched the construction of an energy management system, with each factory developing a list of energy-saving opportunities and preparing a plan for energy-saving measures.
The tobacco industry has implemented several measures to reduce carbon emissions, such as reducing pollutant emissions, rationally using waste, and improving the efficiency of machinery and equipment to reduce energy consumption. In terms of energy conservation research in the tobacco industry, Lu et al. [] discussed the status of energy consumption and energy conservation measures in cigarette enterprises. Li et al. [] studied energy efficiency in cigarette enterprises and Zhang and Shao [] studied the operational characteristics of key equipment in tobacco enterprises. Furthermore, Gao et al. [] analyzed the pyrolysis of tobacco residues and determined the best model for different stages of pyrolysis, and Wang and Yuan [] explored the energy-saving and emission-reduction potential of primary tobacco-processing.
However, most of the above studies focused on the analysis of energy consumption for individual equipment and utilities. Few studies have conducted a comprehensive evaluation of the environmental impacts of the industry from the life-cycle perspective. Furthermore, the previous work did not consider the allocation between carbon sources and sinks. Therefore, based on life-cycle assessment (LCA) and the Source-Sink Model (SSM), this study assesses the carbon footprint and economic benefits of the tobacco industry (case study in Chengdu in 2014), and analyses the energy restructuring of different percentages of renewable energy to replace thermal power. The objective of the study is to maximise the offsetting of carbon emissions from the tobacco production system while achieving optimal internal costs and profitable external benefits.
2. Problem Statement
Based on the case of the tobacco production supply chain in Sichuan, China, the problem to be solved is described as follows. Given:
- A set of carbon sources, including agricultural materials (A1), agricultural energy (A2), farmland management (A3), tobacco-processing-to-finished-product handling processes in a silk workshop (A4), wrapping workshop (A5), power workshop (A6), comprehensive workshop (A7), management and control workshop (A8), and office (A9).
- A set of carbon sinks, including carbon sequestration by photosynthesis (B1) and soil carbon sequestration (B2).
- The corresponding carbon emissions and investment costs are given for all carbon sources.
- There are corresponding carbon emissions and investment costs for all carbon sinks.
The objective is to maximize the offset of carbon emissions from tobacco production systems while achieving optimal internal costs and profitable external benefits.
3. Methodology
3.1. Llife-Cycle Assessment (LCA)
This study is based on cradle-to-gate study of the tobacco industry and covers tobacco cultivation, storage, cutting and rolling, and product-handling processes in the tobacco industry supply chain. The entire tobacco industrial supply chain is illustrated in Figure 1. Based on LCA, the system boundary of the tobacco industry supply chain is defined, and carbon emissions and related cost data are accounted for in each sector.
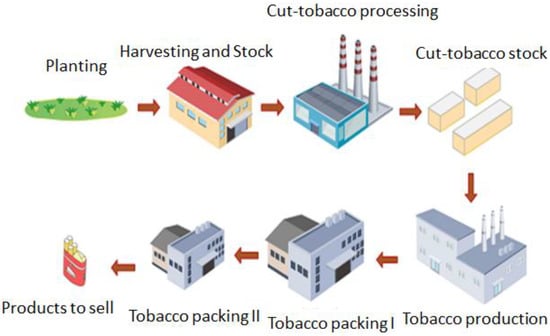
Figure 1.
Life-cycle of the tobacco industry.
The system boundary includes the tobacco planting (TP: agricultural materials, such as fertilizers and pesticides, farmland management, and agricultural energy) and the tobacco-processing-to-finished-product handling processes (TPFP: silk workshop, wrapping workshop, power workshop, comprehensive workshop, the management workshop, and office).
3.1.1. The Tobacco-Planting Stage (TP)
The tobacco-planting stage of the tobacco industry relates to the tobacco planting. The carbon sources of TP include the agricultural material consumption, farmland management, and agricultural energy. The agricultural material consumption refers to the application of nitrogen fertilizers, phosphate fertilizer, potash fertilizer, pesticide, and plastic film. The farmland management involves the plowing, sowing, and irrigation. The agricultural energy is related to the energy consumed in the plowing, sowing, growth, harvesting process of tobacco. The carbon sinks of TP relate to carbon sequestration by crop photosynthesis and soil carbon sequestration.
The carbon emissions in TP and its related costs are determined by Equations (1) and (2), respectively.
where represents the carbon emission of jth item of the TP stage. j is agricultural material, farmland management, and agricultural energy. i is the materials consumed in the TP stage, e.g., various fertilizers, pesticides, energy, and water. is the related cost of the jth item of TP stage. is the average carbon emission factor per hectare per year for material i consumed in the jth item of TP stage [], A is the area of tobacco cultivation. In this work, A was set as 3670.6 hm2. Pesticides were sprayed onto the ground and into the air through various methods, such as sprays, granules, dust, and fog. Although the amount of pesticide applied varies by geographical area and depends on the level of weed and pathogen infestation, pesticides were applied to tobacco plantations approximately thrice per season. is the amount of material i consumed in the jth item of TP stage. is the frequency of material i consumed in the jth item of TP stage per year. is the unit price of the material i consumed in the jth item of TP stage. For details of the parameters of material consumption and carbon emission in TP stage, the readers may refer to reference [].
The carbon sequestration by crop photosynthesis () in the TP is obtained from Equation (3). The soil carbon sequestration () is determined by Equation (4).
where, is the total carbon sequestration per hectare of tobacco production by typical tobacco cooperatives in different regions of Shaanxi Province is taken to be 90% of the lowest value [], taking into account losses to the tobacco plant caused by weather and other factors, and is the average carbon sequestration factor per hectare per year for , and = 1.62 t(C) hm−2 a−1. is the average carbon sequestration factor per hectare per year for carbon sequestration method s. s is the three methods of soil carbon sequestration, i.e., rational fertilization (RF), straw returning (SR), and no-tillage (NT). The carbon sequestration of RF, SR, and NT is 1.78, 0.47, and 0.71 t(C) hm−2 a−1, respectively []. The corresponding cost of carbon sequestration by crop photosynthesis and soil carbon sequestration is also determined by Equation (2).
3.1.2. The Tobacco-Processing-to-Finished-Product Handling Processes (TPFP)
This section describes the production of tobacco product. It covers the tobacco processing process and the production process of finished products in the tobacco industry. It includes the slicing workshop, wrapping workshop, power workshop, comprehensive workshop, management workshop, and office.
Tobacco processing involves thinly slicing tobacco leaves and stems. The primary processing of tobacco includes four stages: flake processing, stem processing, cutting and puffing, and flavoring. Tobacco processing includes the leaf yarn and cigarette-rolling processes This process involves many pieces of high-energy-consuming equipment, and accounts for 78.94% of the energy consumption of the main production system. Tobacco is processed according to cigarette modules, and the production processes vary for different brands. Different types of energy, such as electricity, heat (steam), compressed air, and fuel (coal, natural gas, or diesel), are consumed in the primary tobacco-processing stage. Electricity is the main power source for the production, as well as for the control systems and instrumentations of various pieces of process equipment. Heat (steam) is primarily used as a process medium for the insulation, conditioning, drying, and expansion equipment. Fuel is used for combustion, providing the heat for the steam and hot air required in the drying process. Furthermore, compressed air is primarily used to control pneumatic valves in all processing equipment. As steam is the processing medium for most of the equipment in the tobacco’s primary processing stage, it accounts for 50–60% of the total energy consumption of the process, followed by electricity, which accounts for 30–50% of the total energy consumption. Hot air and compressed air had the lowest contributions, accounting for 5% and 2% of the total energy consumption, respectively. According to the requirements of clean production, clean energy sources, such as natural gas, are gradually replacing coal as the main fuel for cigarette manufacturing companies. For the TPFP process, the carbon emissions from TPFP are obtained from Equation (5). The related costs of each workshop are estimated by Equation (6)
where p is the stage leading to TPFP carbon emissons (including silk workshop, wrapping workshop, power workshop, comprehensive workshop, management workshop, and office); is the amount of standard coal consumed in the p stage. is the emission factor of standard coal. is the amount of material i consumed in the jth item of TP stage. is the frequency of material i consumed in the jth item of TP stage per year. is the unit price of the material i consumed in the jth item of TP stage.
3.2. Source-Sink Model (SSM)
In this work, the Source-Sink Model was used to analyze the carbon emissions of the tobacco industry from the life-cycle perspective, as shown in Figure 2. In this model, the carbon source on the left was linked to the sink on the right, where carbon is sequestrated. The carbon sources emit carbon emission to the atmosphere and the carbon sinks capture carbon from the atmosphere. To achieve the goal of carbon neutrality for the tobacco industry, the simplest approach is to allocate the carbon sources to carbon sinks based on the carbon emission. However, this could result in the low efficiency of carbon sources in the system. For example, the tobacco industry is a net carbon sink for the whole supply chain. The surplus carbon sequestrated in the tobacco industry could increase profits through the carbon exchange market with a relatively high price, rather than offsetting them using the carbon sources in the supply chain. The carbon emissions produced by each source were delivered to the sink via a different process pathway, which aims to maximize the net profit of the system.
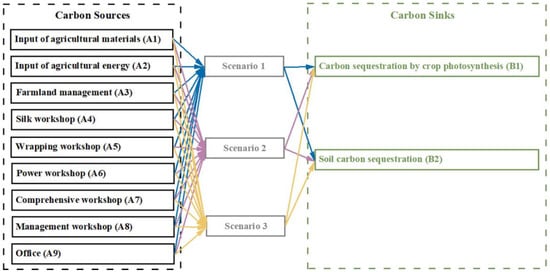
Figure 2.
SSM of the tobacco industry.
In this study, the source-sink of the tobacco production supply chain in Sichuan, China, is defined as shown in Figure 2. The carbon source consists of two components: the tobacco-planting stage and the tobacco-processing-to-finished-product handling processes. The carbon source for the tobacco-planting stage contains agricultural materials (A1), agricultural energy (A2), farmland management (A3), and the tobacco-processing-to-finished-product handling processes contains a silk workshop (A4), wrapping workshop (A5), power workshop (A6), comprehensive workshop (A7), management workshop (A8), and office (A9). The carbon sinks of the system include carbon sequestration by crop photosynthesis (B1) and soil carbon sequestration (B2).
4. Results and Discussion
A tobacco manufacturing plant in Chengdu, China, was chosen as the case study. The carbon footprint of the supply chain of the tobacco industry was evaluated and the related economic costs of tobacco from cultivation to the final products were investigated. This study focused on the carbon footprint of the tobacco industry supply chain from the LCA perspective. The sectors in TP stage, i.e., agricultural materials, agricultural energy, and farmland management, as well as the tobacco production process, i.e., tobacco slicing workshop (A4), wrapping workshop (A5), power workshop (A6), comprehensive workshop (A7), management workshop (A8), and office (A9), in the tobacco industrial chain were considered carbon sources, while carbon sequestration by crop photosynthesis (B1) and soil carbon sequestration (B2) were considered carbon sinks. The basic data, carbon footprint and economic benefit data for the tobacco industrial chain are shown in Table 1 and Table 2. It is worth noting that, in Table 1, the material consumption, and energy consumption are converted into standard coal.

Table 1.
The data of the case study.
Table 2.
Carbon footprint and economic benefits of the tobacco supply chain.
In this study, by adjusting the energy structure, 0%, 15%, and 30% clean energy (photovoltaic power) were assumed to replace the corresponding thermal power generation. Carbon dioxide emission reductions and capital investment were determined under different scenarios.
4.1. Scenario 1 without Renewable Energy
In the base scenario, no renewable energy was used in the system. The data in Table 2 were used to plot the source–sink curve according to the cost per unit of carbon, as shown in Figure 3. First, the carbon sources and sinks were arranged in order of increasing carbon cost. Next, the source and sink composite curves were plotted with the carbon emission as the horizontal axis and the cost as the vertical axis. The slope of the composite curve at any given point corresponds to the unit cost of carbon emission.
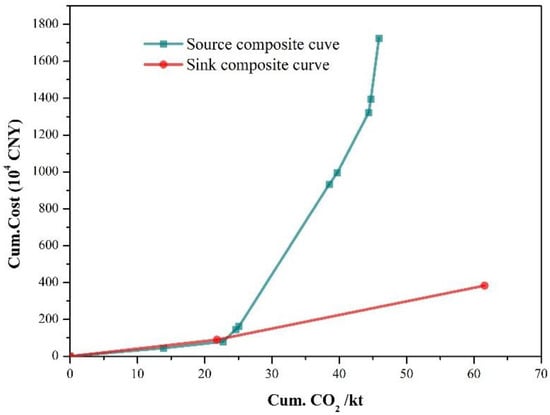
Figure 3.
Source–sink curve of the tobacco industry for Scenario 1.
As shown in Figure 3, some segments of the sink composite curve were entirely above the source composite curve. This indicates that the carbon sinks cannot meet the demand of the sources under cost constraints. When the segment of sink composite curve was located above the source composite curve, this segment of the sink composite curve has a higher slope than that of the source curve. This indicates that the carbon absorbed by the sink has a higher cost than the cost of carbon removed from the source. This is not economic from the cost perspective. When the segment of the sink composite curve is located below the source composite curve, the carbon has a lower cost than the source composite curve.
The sink composite curve is then shifted horizontally to the right until it becomes tangential to the source composite curve, as shown in Figure 4. The tangent point is the pinch point. The shifted distance is 3.50 kt, indicating that, in order to meet the goal of net carbon emission, the tobacco industry requires 3.50 kt CO2 with no investment. This implies that the carbon sinks need to enhance the efficiency of carbon removal. Above the pinch point, the segment of the source curve has a higher slope than that of the sink curve. This implies that if the segment of carbon sinks above the pinch point are used to offset the carbon sources, this is economic. Before optimization, the slope of the segment of source curve below the pinch point is less than that of the sink curve. This indicates that the segment of the carbon sink composite curve below pinch point has a higher slope. If the carbon emission of the sources below the pinch point is offset by the corresponding sink. This is not economic. However, after optimization, the sink curve below the pinch point has a lower slope because of the additional carbon (3.50 kt). The distance between the right end of the source composite curve to the end of sink composite curve is 19.20 kt CO2. This shows that the tobacco industry has a surplus amount of 19.20 kt CO2 after the system achieves carbon neutrality. The excess CO2 can be exchanged in the carbon market.
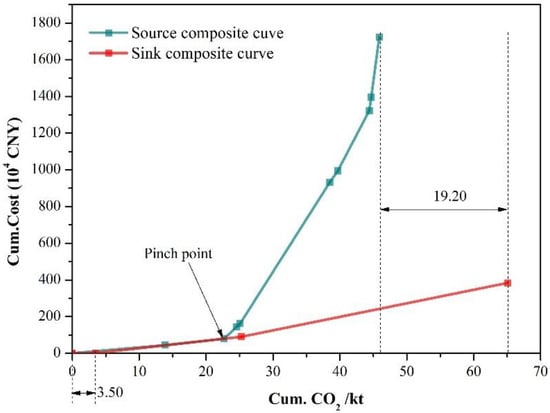
Figure 4.
Optimized composite curve of the tobacco industry for Scenario 1.
4.2. Scenario 2 with 15% of Energy Substituted by Renewable Energy
In Scenario 2, 15% of the thermal power generation in the system was assumed to be replaced by renewable energy (photovoltaic power). The carbon emissions and costs are listed in Table 3.
Table 3.
Tobacco industrial chain with an input of 15% clean energy.
The sources and sinks composite curve of the system are plotted according to the previous description, as shown in Figure 5. The horizontal and vertical coordinates represent cumulative CO2 emissions and the cost, respectively, where the blue and pink curves are the sink and source composite curves, respectively. As shown in Figure 5, some segment of the sink composite curve is located above the source composite curve, which indicates that the carbon sinks cannot meet the demand of carbon sources under the cost constraints.
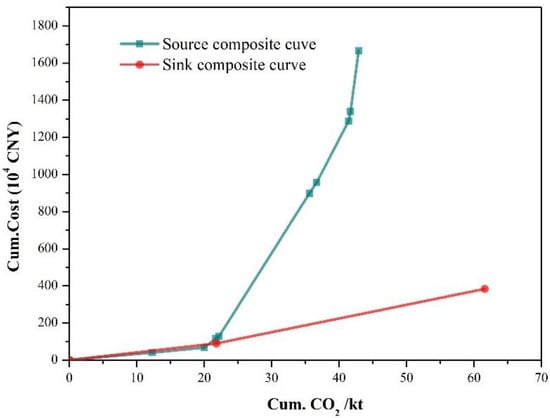
Figure 5.
Source–sink curve of the tobacco industry for Scenario 2.
Subsequently, the sink composite curve was shifted horizontally to the right until it became tangential to the source composite curve, as shown in Figure 6. This implies that the horizontal distance has a minimum value, i.e., 3.67 kt CO2. The sink composite curve is located below the source composite curve. The surplus carbon absorbed by the sink composite curve was 22.37 kt. This implies that the carbon sink of the system requires that 22.37 kt carbon is absorbed without additional costs. A maximum amount of 22.37 kt carbon can be sold to the carbon market after the system achieves the goal of carbon neutrality.
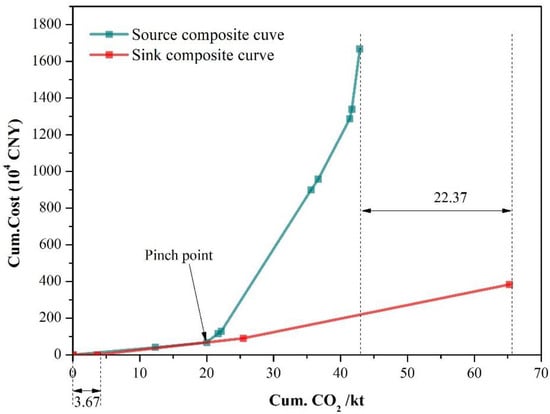
Figure 6.
Optimized composite curve of the tobacco industry for Scenario 2.
4.3. Scenario 3 with 30% of Energy Substituted by Renewable Energy
In Scenario 3, 30% of the thermal power generation in the system was replaced by renewable energy (photovoltaic power). The corresponding carbon emissions and costs are listed in Table 4.
Table 4.
Accounting for the tobacco industrial chain with an input of 30% clean energy.
The sources and sinks of the system are illustrated in Figure 7. The horizontal and vertical coordinates represent the cumulative CO2 emissions and cost, respectively, where the blue and pink curves are the sink and source composite curves, respectively. As shown in Figure 7, some segments of the sink composite curve are located above the source composite curve, indicating that the carbon sinks cannot meet the demand from the sinks under cost constraints.
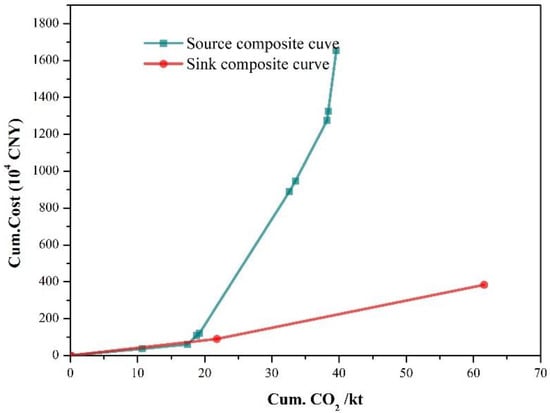
Figure 7.
Source–sink curve of the tobacco industry for Scenario 3.
The sink composite curve was then shifted horizontally to the right until it became tangential to the sink composite curve, as shown in Figure 8. This implies that the horizontal distance has a minimum value, resulting in the minimum value of the carbon being absorbed by the carbon sinks (2.84 kt CO2). The surplus carbon emission for the sink composite curve was 27.84 kt. This confirmed that the system could achieve the goal of net carbon emissions, implying that the carbon sink can offset carbon emissions from its sources.
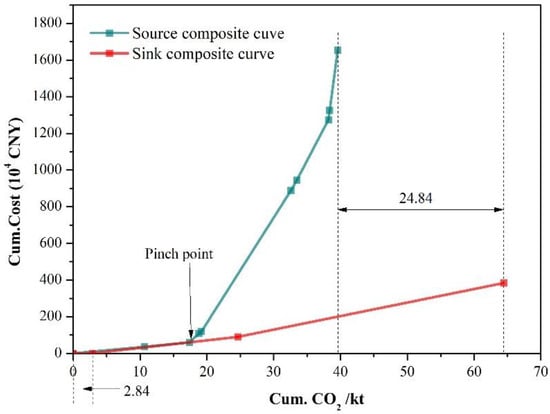
Figure 8.
Optimized source–sink model of the tobacco industry for Scenario 3.
Based on the previous discussion, a comparison of these three scenarios is shown in Figure 9. With the increase in the substitution of renewable energy in the tobacco industry, the maximum amount of carbon for exchange increases. The deployment of renewable energy reduces the carbon intensity of the industry. The carbon sink could provide more carbon for trading in the carbon market. However, with the increasing penetration of renewable energy, the minimum carbon absorbed by the carbon sink with zero cost first increases and then declines. This implies that the higher penetration of renewable energy in the system does not necessarily result in lower carbon target with zero costs. For example, the target of carbon with zero cost in Scenario 2 is greater than that in Scenario 1 and Scenario 3. Scenario 2 has a higher carbon target with zero cost than Scenario 1. This shows that Scenario 2 faces more pressure to enhance the carbon efficiency in carbon sinks. However, Scenario 2 has a higher amount of carbon available for exchange compared with Scenario 1.
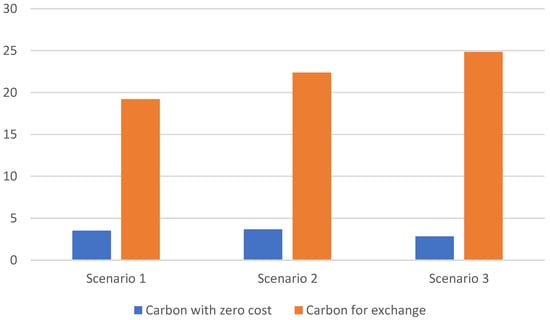
Figure 9.
A comparison of the results of three scenarios.
5. Conclusions and Policy Implications
The tobacco industry is one of the important contributors to China’s GDP. China is actively promoting carbon reduction actions. All industries or companies in China are facing a critical phase of the clean-energy transition. This study uses life-cycle assessment and SSM methods to evaluate the impact of a clean, low-carbon transition on the carbon reduction and cost-effectiveness of the tobacco production supply chain in Sichuan, China. The results indicate that the tobacco industry is a carbon sink, and there is still room for additional carbon trading that can benefit tobacco companies. In scenario 1, when renewable energy use is 0%, excess carbon emissions for the carbon sink after offsetting internal carbon sources can be used for carbon trading (19.2 kt CO2); in scenario 2, when renewable energy use is increased to 15%, and the excess carbon is increased by 3.17 kt CO2 compared to scenario 1; in scenario 3, when renewable energy use is increased to 30%, the excess carbon sink is increased by 5.64 kt CO2 compared to scenario 1. Thus, the higher the amount of renewable energy used in the tobacco industry, the higher the flexibility of the tobacco industry to adjust to the carbon exchange market. The methodology has important general implications for planning investments in the tobacco and other industries that consider carbon trading to be a cooperative carbon management strategy.
Author Contributions
Conceptualization, Y.Z.; Data curation, H.W.; Formal analysis, T.Z.; Funding acquisition, X.J.; Investigation, H.W.; Methodology, X.J.; Resources, Z.L.; Software, Z.L.; Supervision, X.J.; Visualization, T.Z.; Writing—original draft, Y.Z.; Writing—review & editing, H.W., T.Z., Z.L. and X.J. All authors have read and agreed to the published version of the manuscript.
Funding
This research was funded by the National Natural Science Foundation of China 41771575.
Institutional Review Board Statement
Not applicable.
Informed Consent Statement
Not applicable.
Conflicts of Interest
The authors declare no conflict of interest.
References
- Dudley, B. BP statistical review of world energy. BP Stat. Rev. 2018, 6, 116. [Google Scholar]
- Fatima, T.; Xia, E.; Cao, Z.; Khan, D.; Fan, J.-L. Decomposition analysis of energy-related CO2 emission in the industrial sector of China: Evidence from the LMDI approach. Environ. Sci. Pollut. Res. 2019, 26, 21736–21749. [Google Scholar] [CrossRef] [PubMed]
- Pollitt, H. Analysis: Going carbon neutral by 2060 ‘will make China richer’. Carbon Brief. 2020. Available online: https://www.carbonbrief.org/analysis-going-carbon-neutral-by-2060-will-make-china-richer/ (accessed on 10 December 2021).
- Feng, C.; Wang, M.; Zhang, Y.; Liu, G.-C. Decomposition of energy efficiency and energy-saving potential in China: A three-hierarchy meta-frontier approach. J. Clean. Prod. 2018, 176, 1054–1064. [Google Scholar] [CrossRef]
- Ke, J.; Price, L.; Ohshita, S.; Fridley, D.; Khanna, N.Z.; Zhou, N.; Levine, M. China’s industrial energy consumption trends and impacts of the Top-1000 Enterprises Energy-Saving Program and the Ten Key Energy-Saving Projects. Energy Policy 2012, 50, 562–569. [Google Scholar] [CrossRef] [Green Version]
- Gao, P.; Yue, S.; Chen, H. Carbon emission efficiency of China’s industry sectors: From the perspective of embodied carbon emissions. J. Clean. Prod. 2021, 283, 124655. [Google Scholar] [CrossRef]
- Lin, B.; Wang, X. Exploring energy efficiency in China’s iron and steel industry: A stochastic frontier approach. Energy Policy 2014, 72, 87–96. [Google Scholar] [CrossRef]
- Wang, Q.; Zhou, P.; Zhao, Z.; Shen, N. Energy Efficiency and Energy Saving Potential in China: A Directional Meta-Frontier DEA Approach. Sustainability 2014, 6, 5476–5492. [Google Scholar] [CrossRef] [Green Version]
- An, Y.; Zhou, D.; Yu, J.; Shi, X.; Wang, Q. Carbon emission reduction characteristics for China’s manufacturing firms: Implications for formulating carbon policies. J. Environ. Manag. 2021, 284, 112055. [Google Scholar] [CrossRef]
- Jin, B.; Han, Y. Influencing factors and decoupling analysis of carbon emissions in China’s manufacturing industry. Environ. Sci. Pollut. Res. 2021, 28, 64719–64738. [Google Scholar] [CrossRef]
- Tan, R.R.; Foo, D. Pinch analysis approach to carbon-constrained energy sector planning. Energy 2007, 32, 1422–1429. [Google Scholar] [CrossRef]
- Linnhoff, B.; Townsend, D.; Boland, D.; Hewitt, G.; Thomas, B.; Guy, A.; Marshall, R. User Guide on Process Integration for the Efficient Use of Energy; IchemE: Rugby, UK, 1982. [Google Scholar]
- Lee, S.C.; Ng, D.K.S.; Foo, D.C.Y.; Tan, R.R. Extended pinch targeting techniques for carbon-constrained energy sector planning. Appl. Energy 2009, 86, 60–67. [Google Scholar] [CrossRef]
- Foo, D.C.; Tan, R.R.; Ng, D.K. Carbon and footprint-constrained energy planning using cascade analysis technique. Energy 2008, 33, 1480–1488. [Google Scholar] [CrossRef]
- Tan, R.R.; Foo, D.C.Y.; Aviso, K.B.; Ng, D.K.S. The use of graphical pinch analysis for visualizing water footprint constraints in biofuel production. Appl. Energy 2009, 86, 605–609. [Google Scholar] [CrossRef]
- Jia, X.; Li, Z.; Wang, F.; Foo, D.C.; Tan, R.R. Multi-dimensional pinch analysis for sustainable power generation sector planning in China. J. Clean. Prod. 2016, 112, 2756–2771. [Google Scholar] [CrossRef]
- Li, Z.; Jia, X.; Foo, D.C.; Tan, R.R. Minimizing carbon footprint using pinch analysis: The case of regional renewable electricity planning in China. Appl. Energy 2016, 184, 1051–1062. [Google Scholar] [CrossRef]
- Jia, X.; Wang, S.; Li, Z.; Wang, F.; Tan, R.R.; Qian, Y. Pinch analysis of GHG mitigation strategies for municipal solid waste management: A case study on Qingdao City. J. Clean. Prod. 2018, 174, 933–944. [Google Scholar] [CrossRef]
- Lu, D.F.; Yan, Y.M.; Liu, X.P. Discussion on Energy Consumption Status and Energy Saving Measures in Cigarette Enterprises; Chinese Society for Environmental Sciences: Beijing, China, 2013. [Google Scholar]
- Li, H.T.; Yan, Y.M.; Liu, C.X. Application of input-output model in energy consumption analysis of cigarette enterprise. Tob. Sci. Technol. 2009, 258, 5–8. [Google Scholar]
- Zhang, Z.H.; Shao, G.Y. Energy management modes of tobacco industrial corporation based on the key nodes. Energy Res. Mang. 2011, 4, 87–89. [Google Scholar]
- Gao, W.; Chen, K.; Xiang, Z.; Yang, F.; Zeng, J.; Li, J.; Yang, R.; Rao, G.; Tao, H. Kinetic study on pyrolysis of tobacco residues from the cigarette industry. Ind. Crops Prod. 2013, 44, 152–157. [Google Scholar] [CrossRef]
- Wang, Q.; Yuan, Q. Energy-saving and emission reduction potential of the tobacco industry: A case study of China’s 18 cigarette enterprises. J. Clean. Prod. 2020, 244, 118429. [Google Scholar] [CrossRef]
- Zhang, R.Y.; Chen, R.; Wang, X.J.; Jiang, Z.D. Carbon effect of modern tobacco agriculture: Based on tobacco cooperatives in Shaanxi Province. Chin. J. Eco-Agric. 2019, 27, 1903–1915. [Google Scholar]
Publisher’s Note: MDPI stays neutral with regard to jurisdictional claims in published maps and institutional affiliations. |
© 2022 by the authors. Licensee MDPI, Basel, Switzerland. This article is an open access article distributed under the terms and conditions of the Creative Commons Attribution (CC BY) license (https://creativecommons.org/licenses/by/4.0/).