1. Introduction
Electric traction systems are among the largest consumers of electric power. Therefore, it is essential to use them economically and reduce power losses for the sake of rapidly growing environmental pollution, limited non-renewable energy sources, and the necessity to increase energy efficiency. At the same time, the existing approaches and methods for electricity loss estimation in grids are the weakest link in the overall energy balance calculation circuit. In our opinion, this is due to the fact that traditional methods for analysis and reduction in energy losses in electric traction networks are based on the “circuit” approach, that is, on the theory and electrical appliances of electrical circuits, which follows from the analysis of publications [
1,
2,
3,
4,
5,
6,
7,
8]. This article continues and expands on the researches outlined in [
9,
10]. Let us summarise them shortly.
In [
9], a “field” approach based on the theory of the electromagnetic field was proposed and theoretically substantiated for the analysis of the electromagnetic energy transfer from a traction substation (TS) to an electric rolling stock (ERS) through the airspace of inter-substation zones of AC electric traction power supply systems (TPSs). The approach is based on the fundamental law of electromagnetic energy propagation, i.e., on the fact that energy is distributed not by wires but by dielectrics (in particular, by the air) and is transmitted not by current but by electromagnetic waves. It was shown that the electricity required to move trains and trams, propagating through the airspace of the inter-substation zone, enters the electric rolling stock through the roof and bottom of its body, i.e., the electromagnetic energy enters the inside of the electric locomotive through the roof porcelain insulator and through the air holes in the bottom of the locomotive body [
9,
10]. Based on the “field” approach of electromagnetic energy propagation from the traction substation to the electric rolling stock described in [
9], the next research published in [
10] showed that the reactive power consumed by the electric rolling stock is characterised by the standing waves formed in the airspace of the inter-substation zone by the superimposition of the waves falling on the elements of electric traction (contact wire, rails, locomotive and car bodies), and the waves reflected from the surfaces of these elements and devices. The authors proposed two ways to reduce the reactive power which arises as a result of the formation of standing waves—either by the “suppression” (damping) of the already formed standing waves or by preventing the formation of reflected waves by the application of special thin film coatings (single or multi-layered) to the surface of these elements of the electric transport system. The last way is the most effective and state of the art method, which is developing in recent publications [
11,
12,
13,
14].
The article is structured as follows.
Section 2 presents a review of the last researches and articles and the current issues connected with the definition of power losses on electrified transport.
Section 3 is dedicated to the “field” approach and its theoretical aspects.
Section 4 describes the conditions and initial data for active power losses numerical calculations. The results of numerical calculations of power losses in different elements are shown in
Section 5 for traction networks,
Section 6 for carriages, and
Section 7 for the electric locomotive. Finally,
Section 8 presents the main conclusions made by authors based on the results of theoretical and numerical analyses.
2. Analysis of Selected Research Studies Dedicated to Power Loss Estimation in Railway Transport
The results of experimental and numerical calculation of electricity losses are shown in [
3] on the example of a feeder zone with two TSs equipped with 6-pulse rectifiers. The experimental research was performed with the help of electric meters installed at TSs and ERSs. The load in the experiments was represented by a freight train with a weight of 1879 tons driven by the ET22 electric locomotive. It was found that the average efficiency of the electric power transmission of the feed zone was 87.21%, and total power losses relative to the energy delivered to the TSs were 12.79%.
Paper [
4] proposes a method for assessing and minimising power losses in the traction power supply system by voltage regulation of a TS according to the limits described in the EN50163 standard. The problem was solved by computer simulation, which found that to reduce power losses it is advisable to increase the voltage of TS to not more than 1700–1800 V.
Article [
5] considers the structure of the imbalance of electric power losses during a train operation, which reaches up to 17%. Experimental research showed that the annual loss of electricity in TPSs is 13.3%, including losses in step-down transformers of 0.7–1.5% of the nominal volume of electricity received from the external power system and losses in traction transformers of 0.81–1.51% of the energy released for train traction.
The magnetic losses in AC locomotives are investigated in [
6]. The authors proposed an improved model which allows one to estimate magnetic losses in the magnetic steel and also in any magnetic material, taking into account their properties, shape, etc. The results of the calculation are presented for electrical steel of 1312 type for different magnetisation frequencies (50 and 60 Hz) based on the NB-418-K5 motor. In addition, the authors performed calculations of efficiency according to different existing procedures and methods to demonstrate potential inaccuracies. The proposed method provides precise results.
Interesting results of measurements and calculations are shown in [
7]. The article discusses power loss estimation and reduction in TPSs of the East Japan Railway Company, fed from a 154 kV power line. The following are proposed as measures to reduce power losses in TSs: introduce a high-efficiency rectifier, voltage regulation, use lithium-ion batteries in energy recovery modes, replace air conditioners, and implement LED lighting.
Using the classical modelling method, [
8] calculates power losses in TPSs with various supply voltages (V): 1500, 3000, 6000, and 9000. It was found that when the supply voltage is raised from 1500 to 3000 V, power losses decrease by 25%.
The author of [
15,
16] demonstrates that the existing indirect methods for determining electrical energy losses
in the contact line have an error of about 7.5%. This is due to the fact that the existing methods are based on the expression below
which calculates the losses using the value of feeder current
and energy losses coefficient
; the latter could be determined only imprecisely. Therefore, the author proposed and improved the indirect method by considering the influence of six significant factors on the value of
Some of them include the power supply circuit of the catenary system, the number of trains in the inter-substation zone, the contact wire wear, and ERS movement speed. Based on a full factorial experiment
, a regression equation was obtained to estimate the loss coefficient
from which it follows that the number of trains moving along the inter-substation zone has the most significant influence on
. The proposed technique for assessing
allowed for increasing the accuracy of power loss estimation by 5.13% [
15,
16].
As follows from the publications analysed above [
1,
2,
3,
4,
5,
6,
7,
8] and also many other publications, which are not mentioned in the article, the assessment of power losses in the TPS is carried out either by calculation (analytical or modelling) or experimentally by power meters installed on TSs and ERSs. In the former case, the calculated input data are the electrical parameters and currents in the catenary system, and in the latter case, the currents and voltages of the corresponding electrical circuits of the TS and ERS. Such a solution to the problem is explained by the fact that it is traditionally believed that electricity propagates from the TS to the ERS along the wires of the catenary system and is transferred by the electric current flowing through these wires. However, it is well established that according to the fundamentals of theoretical electrical engineering, the electromagnetic energy is transmitted from a source to a consumer not through the wires of an electrical circuit but through a dielectric, and is transferred not by the movement of charged particles (not by current), but by electromagnetic waves, i.e., an electromagnetic field with the speed of
m/s. In our opinion, the failure to take into account this fundamental law of electricity distribution leads to the fact that until now, electrical specialists cannot establish the “true” electricity costs in electric traction systems. Thus, calculations and readings of power meters for electricity consumption for train traction (i.e., for a TS and an ERS) differ significantly, and the variation sometimes reaches 28%. These “difference leakages” of electricity are even given the name “conditional loss”, the hopelessness of which is emphasised by the fact that they are even regulated by directives [
17]. Conditional losses reach quite significant percentages and are equal in average up to 15.1% in an AC electric traction system. Although the authors of [
17] tried to substantiate the factors of the appearance and the dynamics of changes in these losses, in our opinion, the arguments they use are unconvincing.
In this regard, the authors of this article propose a new so-called “field” approach to assess power losses in electric traction systems; that is, an approach based on the theory of the electromagnetic field, according to which the transmission of electricity by quantity and direction is characterised by the Poynting vector
[
9,
10]:
where:
and
are the electric and magnetic field strength vectors at the points of the dielectric or devices in the inter-substation zone of the AC electric traction system.
Works [
18,
19] have significant theoretical and practical investigations dedicated to waves propagation in the overhead wires and accurate calculations of magnetic field intensity in general applications. At the same time, a significant number of publications, for example [
20,
21,
22,
23,
24,
25,
26,
27], present the results of determining, by calculation or experiment, the strengths of electric
or magnetic
fields at various points in the spaces of electric traction systems. However, the energy properties and functions of these fields are not considered.
In particular, [
20,
21] present the results of measurements of low-frequency magnetic field strength on two DC transformers. The measurements were performed inside TS buildings, at points around the 6-pulse rectifier, and outside a TS in the area surrounding the 132 kV external power transmission line. The H-field spectra present measurement results in the frequency ranges from 30 to 430 Hz and from 430 Hz to 12 kHz. The amplitudes of the H-field inside the buildings for the 3rd (12 A/m), 6th (13 A/m), and 12th (13 A/m) harmonics were established. Outside the TS buildings, the 6th and 12th harmonics had amplitudes of 13 A/m. The resulting strength of the B-field was around 5 nT, which is below the regulatory limit of human exposure.
Similar estimates [
22] of the level of the B-field were also performed by Italian researchers at points 10 m away from a high-speed railway line electrified by 25 kV, 50 Hz. The values of magnetic induction are provided during train movement at a speed of 250 km/h at a current of 390 A. The maximum value of the vector reached 1.9 T, and the most probable value was 0–1 T. The probability of value
T did not exceed 0.03, and the median value was 0.64 T.
To determine the effect of the alternating magnetic field generated by the current in the rails on inductive wheel sensors, the South African Railway Company (Spoornet) funded an experimental study to estimate the level of the B-field around the rail with an alternating current of 600 A, 50 Hz [
23]. As a result, it was found that in the region where the sensor is located, the values of induction
are in the range of 16.0 to 11.5 mT, with a maximum possible value of 19.0 mT.
In [
24], magnetic induction around the wires of the AC catenary system was determined by analytical calculations known from theoretical electrical engineering, with the use of the mirror image method. It was found that induction
reaches 21.0 mT at a distance of 3.5 m from the wire with a current of 170 A.
The methods for approximate calculations of the strengths of electric and magnetic fields in the airspace of a DC-electrified section were proposed in [
25] based on the method of superposition well established in theoretical electrical engineering.
Authors of the publication [
26], using the modelling method of a high-frequency electromagnetic field generated near air networks and railway equipment, showed that a train consuming a current of 200 A generates a voltage of 154 V on a 10 km-long line.
Paper [
27] shows the results of a study dedicated to the application of magnetic field energy harvesting located closely to the railway track of Norwegian railways with a voltage of 15 kV AC, 16.7 Hz. The possibility of accumulation of sufficient energy in the magnetic field is analysed to extend the lifetime of distributed condition monitoring systems used in such infrastructure as bridges, tunnels, rails, etc. The study showed that a train driven by the Rc8 locomotive receiving a current of
A creates a magnetic field with induction at a distance of 0.5 m from the rail and
μT. This field strength is sufficient to accumulate the energy in the storage device, making it possible to increase the service time of the existing monitoring systems significantly.
Many more publications which estimate the level of the electromagnetic field—mainly its magnetic component created by the electric traction network—could be cited and analysed. However, the primary goal of such publications and those analysed above is to assess the magnitude of possible impacts of such a field on people (which is quite understandable and natural) located in its space. Yet, the electromagnetic field (electromagnetic waves) is created and propagated throughout the space of inter-substation zones of the electric traction system. Therefore, it covers and energetically affects all elements of the TPS, including the main “productive” object of the system—a moving train. This influence is undoubtedly significant from the technical and economic point of view to estimate the energy-efficient operation of electric traction systems.
This article aims to develop and theoretically substantiate a new method for determining active power losses in the devices of electric traction systems based on the existing theory of the propagation of electromagnetic field energy in dielectric and conductive media.
3. Theoretical Aspects of the “Field” Approach
Let us consider the inter-substation zone of the AC electric traction system with several freight trains being in operation. The space of the inter-substation zone is conditionally limited by the traction substation, traditional suspension catenary and rails. Additionally, let us assume that according to the electromagnetic characteristics this space is linear, homogeneous, isotropic, and does not contain external electric motive forces (EMF) and free charges.
In the dielectric space (i.e., the inter-substation zone’s airspace), the electromagnetic field is created by currents flowing in the traction network and the voltage between the catenary and the rails. At the same time, electromagnetic waves propagating in the airspace of the inter-substation zone meet catenary wires, electric rolling stock, carriages, and rails on their way. They are partially reflected from the surfaces of these structures [
9,
10], and partly they penetrate and dissipate in them in the form of heat losses, the determination of which is the primary purpose of this article.
To solve the problem based on the “field” approach, we must establish the coordinate system in which to perform the calculations of the strengths of the electric and magnetic fields, considering the shape of the contact suspension and the rails.
Let us represent the overhead contact system (catenary) of PBSM2-95+MF-100 type used in the investigated electric traction system by a single equivalent contact wire with a cross-section of
m
2 [
28] and cylindrical shape with a radius of
m. Its specific electrical conductivity is
S/m and relative magnetic permeability is
10. Let us assume that the feeder voltage and current in normal operation modes are sinusoidal, with frequency equal to
Hz. Then the penetration depth
of a harmonic electromagnetic wave with a frequency of 50 Hz into the surface of the equivalent contact wire will be equal to:
Similarly, let us replace both rails of R65 type by a single equivalent rail with a cross-section of 1.65 m
2 [
28,
29,
30] and cylindrical shape with radius of
m. Its specific electrical conductivity is
S/m, and relative magnetic permeability is
. Then the depth of penetration of an electromagnetic wave into the surface of the equivalent rail is equal to:
From the resulting inequalities ( and ) it follows that the electromagnetic fields of inside layers with thicknesses of and would be the same as if the layers had a flat shape. Then, for the equivalent contact wire and rail, all relationships established for the case of a flat dielectric-conductor interface are valid. This makes it possible to solve the set electromagnetic problem in the Cartesian coordinate system.
An alternating electromagnetic field with a frequency of 50 Hz in the conductive media of devices in the inter-substation zone is described by the following system of equations for instantaneous electromagnetic quantities [
31,
32]:
Let us perform the
operation from both sides of Equation (1):
Considering the replacement of the operation
in Equation (5) and the substitution of Equation (2) into Equation (5), we obtain:
Considering relation in Equation (4), we obtain the simplest homogeneous d’Alembert equation for
:
Let us consider a plane wave for strength
, propagating along the 0 Z axis, in the Cartesian coordinate system, perpendicular to the conductive surfaces of the studied devices of the inter-substation zone. Then, Equation (7) could be simplified to
Electromagnetic waves in the inter-substation zone are excited by the sinusoidal voltage and current of the traction network, so strengths
and
will also be harmonic functions. Then, Equation (8) could be written in a complex form as
As it is known, Equation (9) has a solution:
where:
and
are constants of integration;
is a wave propagation coefficient.
The electric field strength is determined based on Equation (1) as
and for a plane wave as
i.e., this means that:
After differentiation of Equation (10) and its substitution into Equation (11), we obtain the following:
where:
is the wave complex resistance of the conducting medium of the devices of the inter-substation zone, which could be defined as
where
Let us use the boundary conditions described below to determine the constants of integration and in Equations (10) and (12).
As was found above, the radii of the equivalent contact wire and rail are greater than the wave propagation depth. Similarly, it can also be shown that the thicknesses of the steel sheets of the electric locomotive bodies (5 mm) and train carriages (3 mm) exceed the wave attenuation depth (0.736 mm). Therefore, these devices of the inter-substation zone can be considered infinite electrically conductive half-spaces (“impervious” to electromagnetic waves). Then
the first boundary condition is that for the value of the coordinate
, the values of
and
. Then Equations (10) and (12) will take the following form:
From the system of Equations (14) and (15) it follows that under the above-mentioned condition, the constant must be equal to zero , otherwise, the strengths and will not take zero values, but infinitely large values, which does not happen in practice (i.e., it is impossible).
The second boundary condition for the surfaces of the devices under study, we could find for
. Then, Equations (10) and (12) will be written for
in the following form:
where
and
are the strengths of the magnetic and electric fields on the surface of the contact wire, rail, carriage bodies, locomotive, etc.
Considering the obtained values
and
, the resulting system of equations of the electromagnetic field in the conductive media of the devices of the inter-substation zone will be written in the following form:
Having available the dependencies
,
and Equation (13) for
, we could write the expression for the Poynting vector in complex form as
where
is the effective value of the magnetic field strength on the surface of the device under study.
Finally, the expression for power losses per unit surface of the device will be determined as the real part of Equation (20) for and will be [W/m2]:
- (a)
for non-magnetic materials:
- (b)
for magnetic materials (considering non-linearity
and hysteresis losses):
4. Conditions for Numerical Calculations of Power Losses
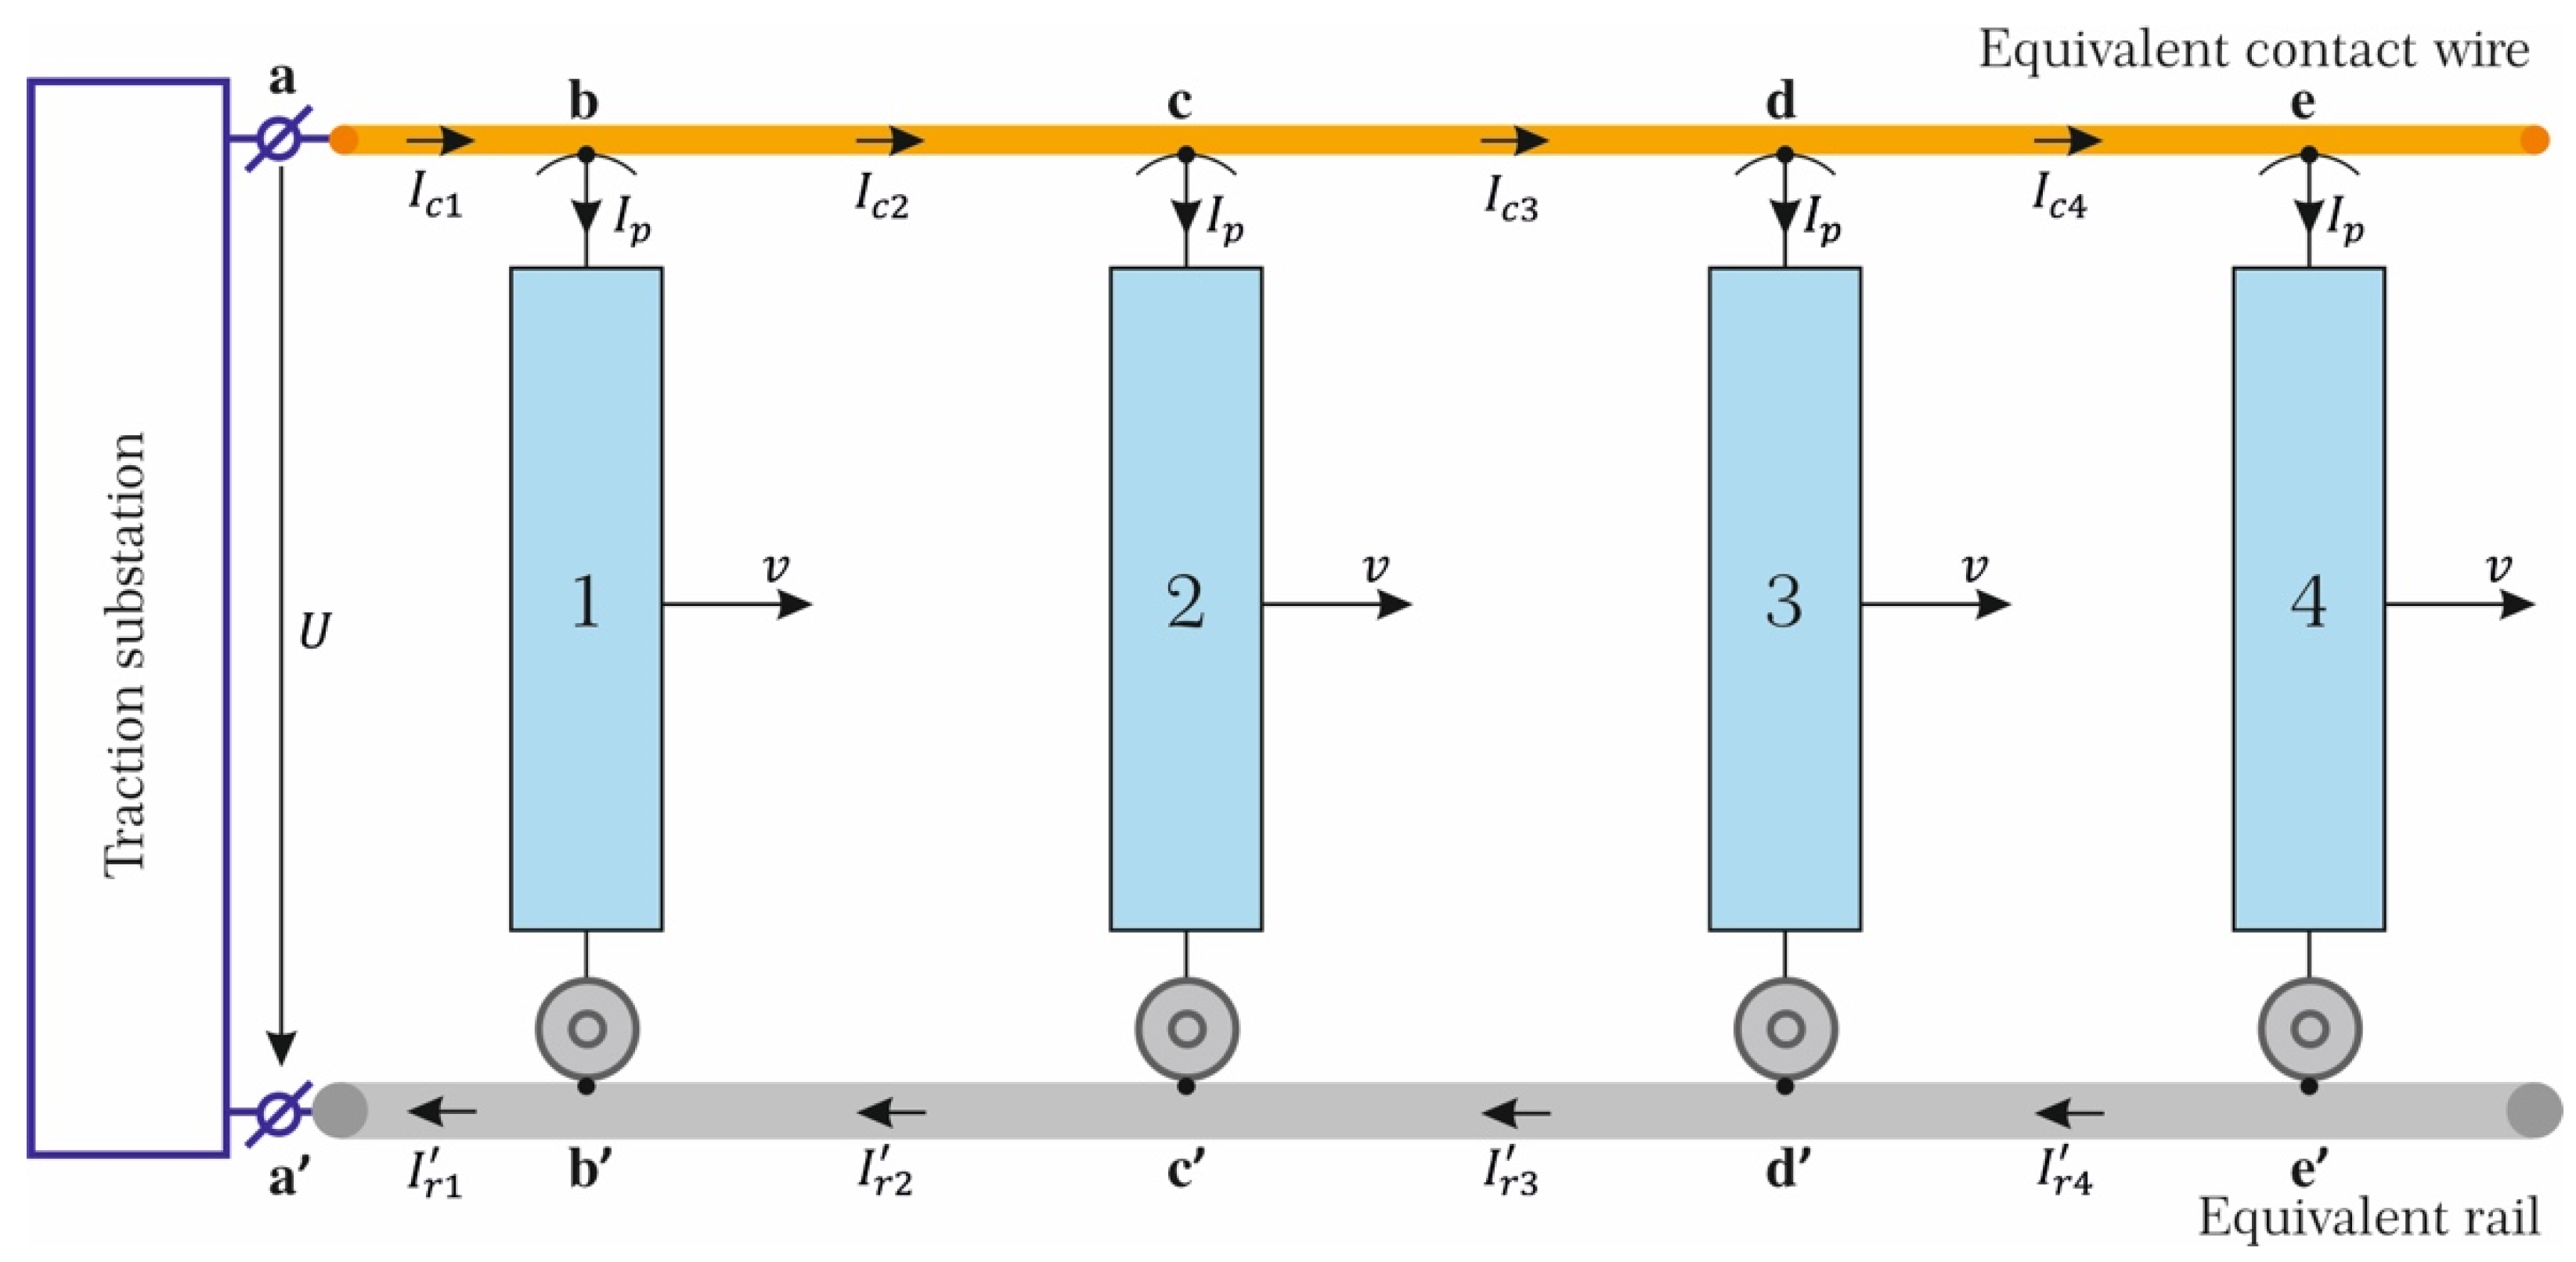
Let us perform numerical calculations of active power losses in the devices and elements of the inter-substation zone mentioned above with unilateral supply (in this case, the power losses will be maximum, and we will determine them), i.e., in equivalent contact wire, locomotives, carriages, and equivalent rail.
Four freight trains operate in this zone, with 57 universal covered 4-axle carriages of the 11-270 model. Each train is driven by AC 50 Hz electric locomotives of DS3 type (manufactured by Dniprovskiy Electric Locomotive Building Plant in Ukraine), taking a load current
A, power
kW, and having the pantograph voltage
V. Let us assume that the trains are of the same type, located at the same distance of 12 km from each other. At some point, their location corresponds to the schematic shown in
Figure 1.
In this case, according to Kirchhoff’s first law, the currents in sections
ab,
bc,
cd, and
de of the catenary (i.e., equivalent contact wire) will be equal to
A,
A,
A, and
A. At the same time, according to different publications [
33,
34,
35,
36], the proportion of currents flowing in the track circuits of the AC electric traction system could vary in a very wide range up to 50–60% of the current in the catenary. The nature of stray (earth) return current transmission in itself is a complicated enough topic because of different factors. There are many approaches for the calculation of stray currents in railway traction, depending on the type of section, load, and other factors. There may also be different underground infrastructure: a continuous pipeline (without interruptions), and a separate pipeline, with and without active protection against corrosion. The stray currents also vary with soil resistivity. In addition to the fact that the earth is a good suppressor of electromagnetic waves [
37], the leakage currents flowing in the ground will not be clustered, as in rails, but will spread over the metal infrastructure, forming a more scattered and rather weak magnetic field than in rails where the field will be clustered (concentrated) on a small plane. All of this causes a multitude of options both for calculating the stray current itself and for the losses associated with the transfer of energy by an electric field. The solution to this problem requires an integrated approach and can be the subject of future articles. In view of this, the leakage current is not considered in this article as an issue that requires separate and in-depth research [
10]. Assuming that the return current proportion is around 55%, the currents in the corresponding sections
a′b′,
b′c′,
c′d′, and
d′e′ of the rails (i.e., equivalent rail) are
A,
A,
A, and
A.
Power losses in the equivalent contact wire were determined by Equation (21), and in the equivalent rail, steel roof sheets of the electric locomotive and carriages, as well as in the steel sheets of the carriage bottoms according to Equation (22). At the same time, the necessary values of the magnetic field strength
on the surfaces of these devices and elements were estimated by various methods depending on their shapes and physical dimensions. The assumed parameters of the studied devices of the inter-substation zone are provided in
Table 1.
6. Power Losses in Steel Sheets of Carriage Roofs and Bottoms
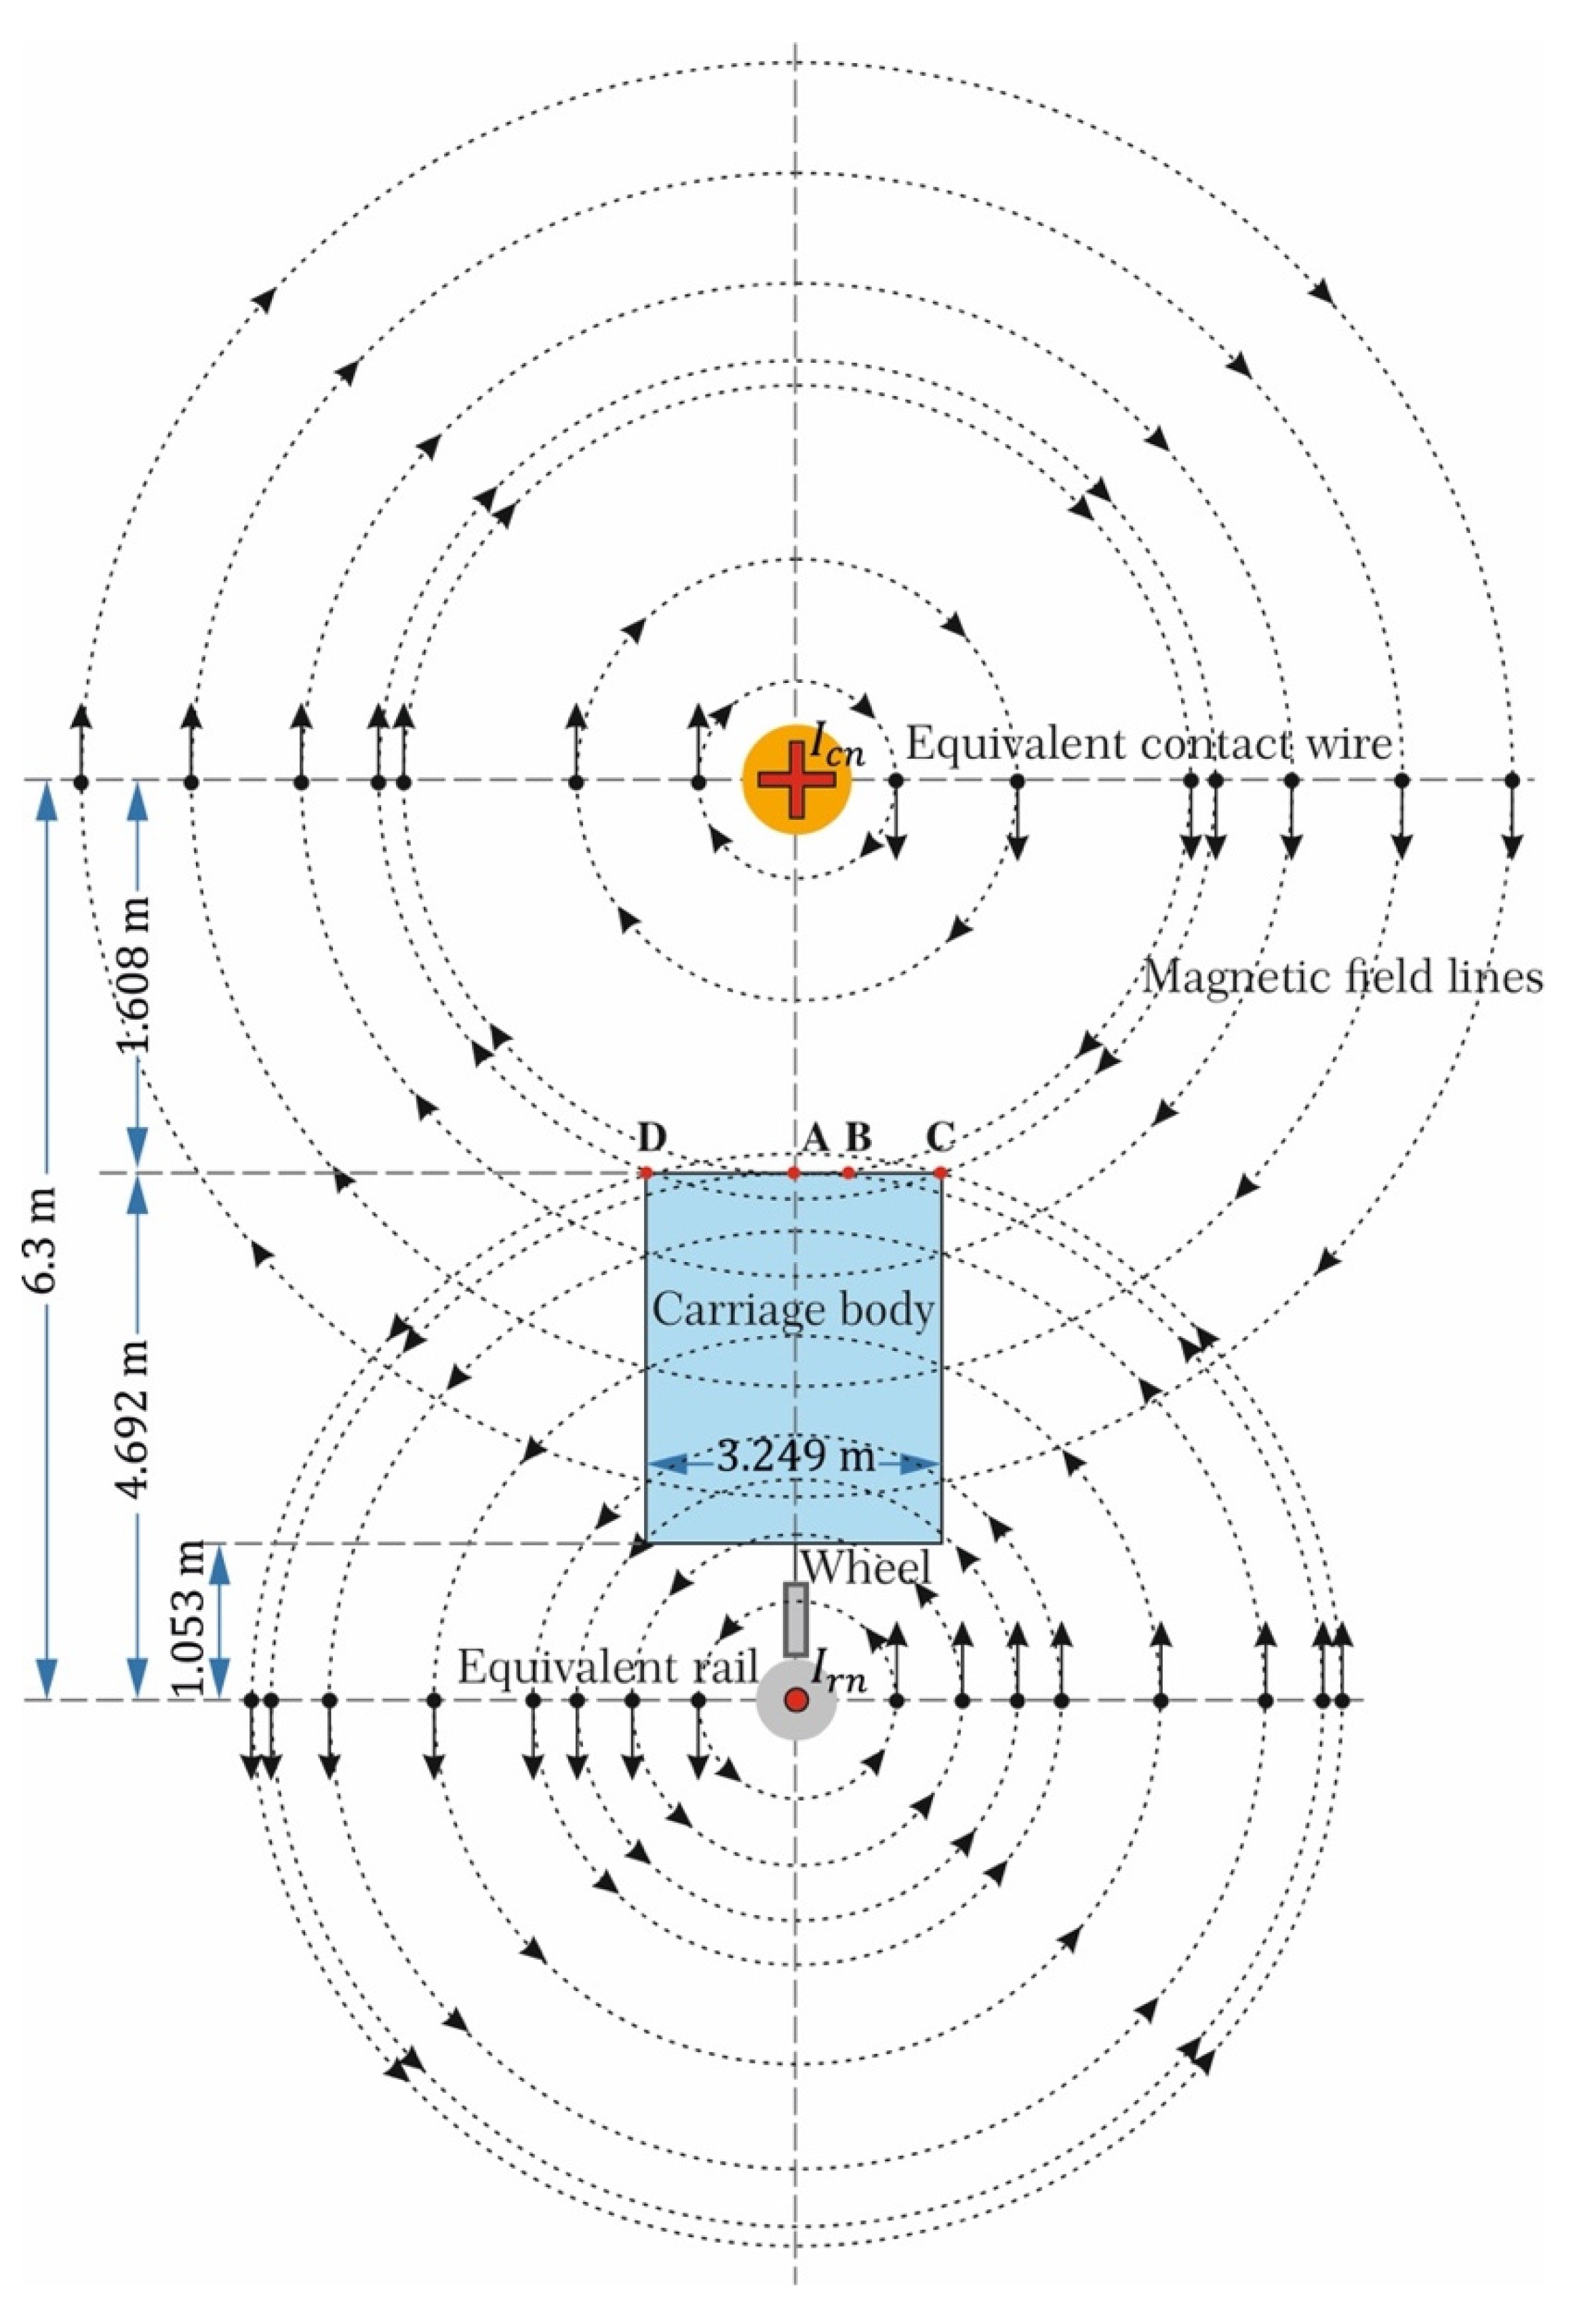
The sheathing of the upper parts (roofs) and lower parts (bottoms) of carriage body frames of 11-270 type is made of the 10X NDP low-alloy steel grade 3 mm thick and with magnetic permeability
. The penetration depth of an electromagnetic wave with a frequency of 50 Hz into such sheets is 0.736 mm. Thus, the sheets of roofs and bottoms of carriages can be considered infinite electrically conductive half-spaces. In this regard, magnetic field strengths on the surface of roofs and bottoms, necessary for estimating power losses in them according to Equation (22), were determined by the mirror image method well established in theoretical electrical engineering [
32,
38]. In this case, the equivalent contact wire and, accordingly, the equivalent rail could be represented as in
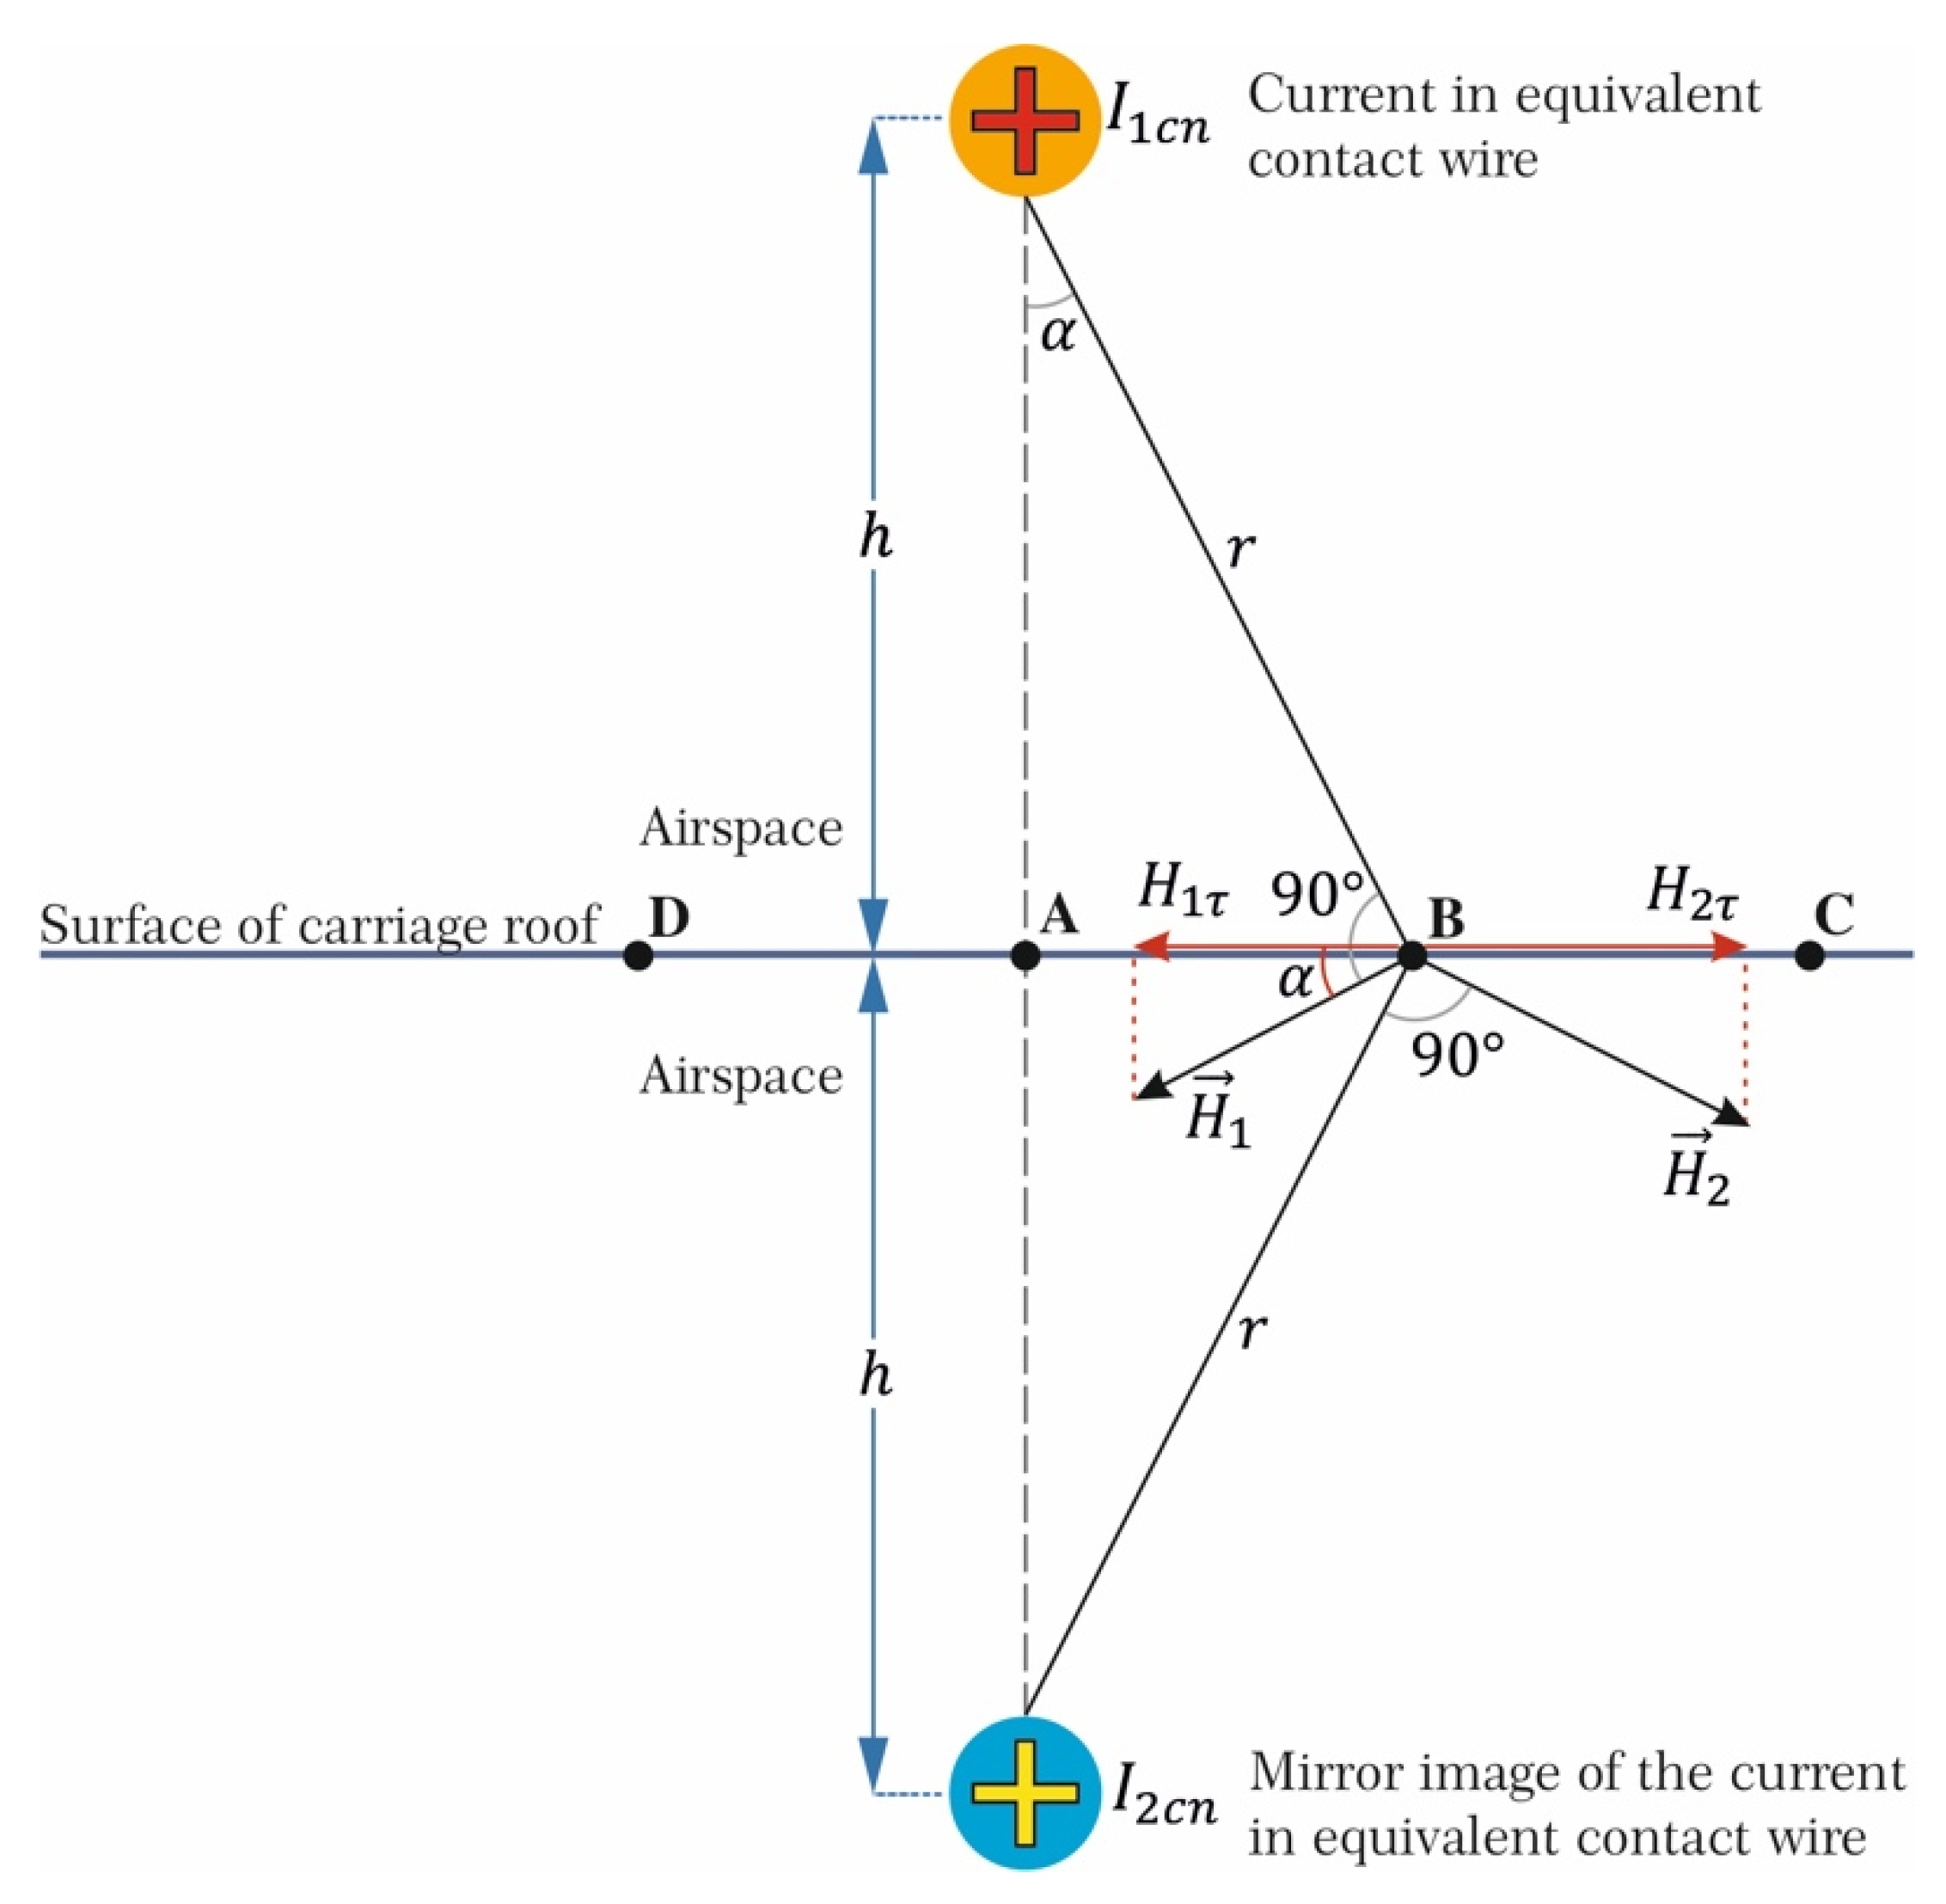
Figure 2.
To solve the task of power losses estimation in the steel sheets of the carriage roof, it is necessary to determine
on the surface
CD shown in
Figure 2 and
Figure 3. This strength is equal to the difference between the tangential components of the corresponding total strengths
and
according to
Figure 3 with the mirror image
of the current in the contact wire
:
Therefore, the strengths
and
, created by currents
and
, are separated by the expression of the total current law (analogically to Equation (23)), respectively, as:
The dependences
and
are equilateral hyperbolas, which determine the uneven hyperbolic distribution of the
and
values, and also
,
, and
on the surface of the carriage roof. Hence, when assessing
as the calculation point
B (
Figure 2 and
Figure 3) on the roof
CD, the abscissa
AB (we denote it as
) has to be taken equal to the median value of the distribution of the strengths. Calculations give the following result
Subsequently, calculations were carried out according to
Figure 3 as follows. Let us define current image
:
where:
is the mirror image coefficient of alternating current [
38] equal to
where:
is the relative magnetic permeability of the air space above the carriages, and it equals 1;
is the fictitious relative magnetic permeability of a massive ferromagnet, and it equals 1.5 [
38] in our task for the steel sheet of the carriage roof.
Therefore, according to Equations (27) and (28):
and
. From the right triangle in
Figure 3 for
m and
m, we find that
m and
; then
and
.
Further, the application of Equations (25) and (26) and the obtained figures allow us to determine the tangential components of the strengths
and
:
As a result, the expression of the desired resulting magnetic field strength on the carriage roof surface will take the form:
Further, substitute into Equation (29) the values of the currents in the contact wire
,
,
, and
shown in
Figure 1. We obtain the values of
on the surface of the roof of the carriages of the corresponding train. The specific and the total power losses on the surfaces (area 2568.63 m²) of roofs of 57 carriages of the corresponding train are possible to determine by Equation (22). The results of the calculation are presented in
Table 4.
In addition, calculations of power losses in the steel sheets of the carriage bottoms were performed by the mirror image method according to a similar technique and using the geometric dimensions of
Figure 2; the results are shown in
Table 4.
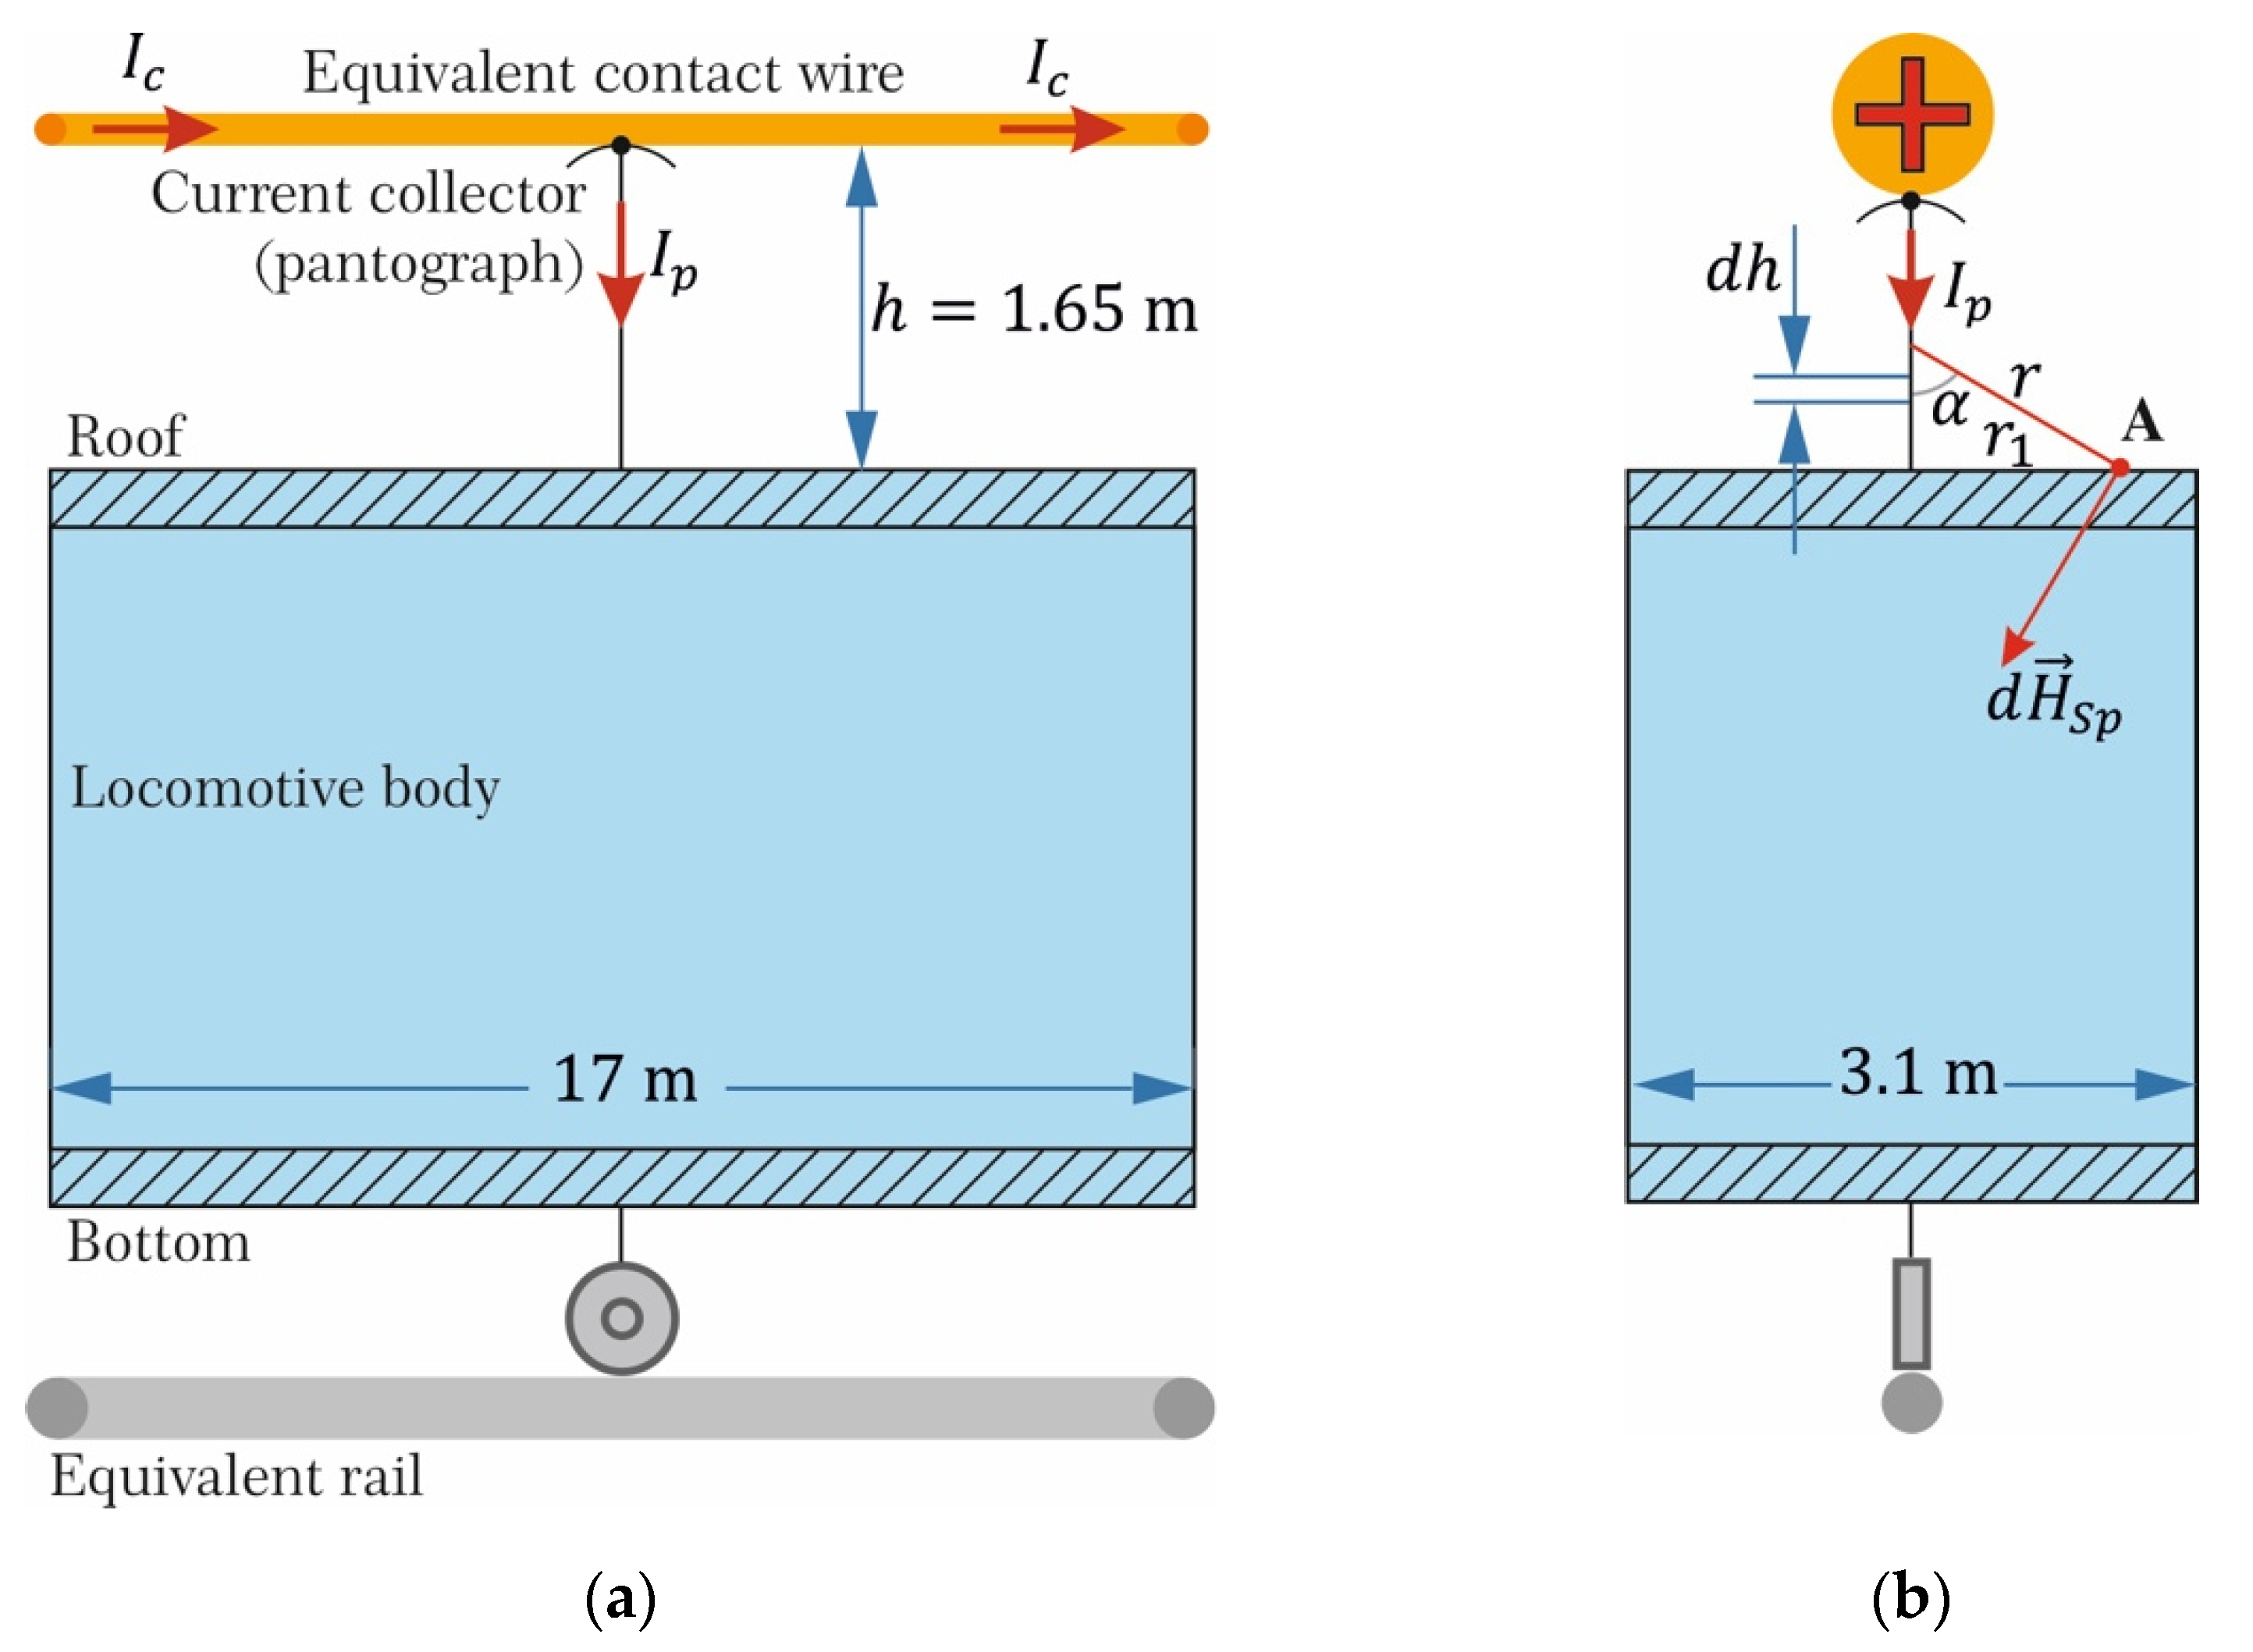
7. Power Losses in Steel Sheets of Roofs of Electric Locomotives
The roofs of electric locomotives are made of steel sheets 5 mm thick; the depth of electromagnetic waves with a frequency of 50 Hz is 0.736 mm. That is, the roofs of electric locomotives are infinite electrically conductive half-spaces.
The electromagnetic wave, created by the current in the contact wire
and the current flowing in the current collector (pantograph)
(
Figure 4), fall on the roof surface with dimensions of 17 × 3.1 m for each electric locomotive. This requires determining the magnetic field strength
on the surface of the roofs of electric locomotives by superimposing two components:
. The component
of the current in the contact wire was determined (similarly to the roofs of the carriages) by the mirror image method according to the geometric dimensions of
Figure 4a, and specific power losses, according to Equation (22). Total losses for a single electric locomotive were found for the surface area of the roof of the electric locomotive being 52.7 m
2; calculation results are given in
Table 5.
Let us estimate component
from the current in the current collector using the Biot–Savart differential law, according to which the current
in the element
of the current collector (
Figure 4b) creates tension at point
A of the roof surface according to the equation below [
38]:
Then, magnetic field strength
at any point of the roof surface from the current
in the current collector with height
(
Figure 4b) could be determined as:
As a result of the foregoing, we obtain that the electromagnetic wave with strength
falls on the surface of the roofs. This wave is reflected from the surface of the roofs, superimposed on the incident wave, and determines the resulting tension
which numerically varies according to the hyperbolic law depending on distance
(
Figure 4b). For
A and roof surface area of one electric locomotive 52.7 m
2 in the range of change
equals 0.005–1.55 m (the end of the roof in one direction), the calculations yielded 48.7 kW of power losses.
8. Discussion of Calculation Results
As it follows from
Table 2,
Table 3,
Table 4 and
Table 5, power losses in the traction network are 3769.84 kW, including 2048.2 kW in the catenary system and 1721.64 kW in the rails. The power losses in the roofs and bottoms of all carriages of all four trains could reach 1208.2 kW and in the electric locomotive 208.62 kW. For active power spent on train traction equal to 21,476 kW, the total percentage of power losses in the devices of the inter-substation zone with four moving trains is 24.1% (
Table 6). Furthermore, 9.5% are the losses in the catenary system, 8% in the rails, and 6.6% in the roofs and bottoms of carriages and the roofs of electric locomotives. At the same time, it should be noted that power losses in carriages and electric locomotives can be larger due to the components of losses in their side and end surfaces, which are not evaluated in this article.
Additionally, we must pay attention to the difference in the total calculated power losses, estimated according to the “field” (24.1%) and “circuit” (8.83–9.68%) approaches. This difference could be explained by the fact that the losses in the “circuit” approach contain only losses in the catenary system since the losses in the rails, as a rule, are usually not determined or are determined inaccurately. This method cannot estimate the losses in the steel sheets of the roofs and bottoms of carriages and electric locomotives. The “conditional” losses are usually applied to compensate for the above difference, but their essence and estimation methods have not been clarified yet. Only in [
15,
16] is it assumed that one of the reasons, along with others, for the appearance of “conditional” losses is probably the influence of the electromagnetic field on the devices of electric traction systems. In our opinion, and what follows from the figures in
Table 6, the “conditional” losses correspond to losses in rails, train carriages, and electric rolling stock. Undoubtedly, such an assumption is fully justified by the loss percentage balance. The so-called “conditional” power losses are losses due to inaccurate and incomplete estimates of total losses performed based on the “circuit” approach.
In conclusion, it should be emphasised that the results of power loss calculations according to the “field” method depend on: the type, shape, and number of carriages in the train; the number of trains in the inter-substation zone; the type and condition of the soil, etc.


