
Reduction of Power Consumption and CO2 Emissions as a Result of Putting into Service High-Speed Trains: Polish Case


Abstract
:1. Introduction
- -
- Enables the basic need for access to the transport system for individuals and society to be met safely and consistently with the needs of human health and ecosystems and meets the capital value requirements within one generation and internationally;
- -
- It is affordable; it functions efficiently, it offers a choice of means of transport and supports a thriving economy;
- -
- Reduces emissions and waste, taking into account the planet’s absorption capacity, minimizes the use of non-renewable resources, limits the consumption of renewable resources to a level of sustainability, outweighs and re-uses their components, minimizes land use, and reduces noise levels [11].
2. Energy Consumption and GHG Emissions by Transport Sector in Poland
- -
- Organizational activity of the Center for Railway Energy Efficiency (CEEK)—which aims to provide a space for knowledge and exchange of ideas, as well as education in the field of energy efficiency and resource management, all to achieve the set energy saving goals in the railway sector by developing and implementing energy efficient and environmentally friendly solutions that benefit all railway market participants;
- -
- Zero-emission target for PKP Energetyka (power supply company for railways in Poland);
- -
- Zero emission target of rail companies—reducing the railway carbon footprint, not just in PKP (Polish State Railways) but throughout the rail industry;
- -
- RES (Renewable Energy Sources) investments-continue investment in the research and development of RES (Solar systems and wind farms) [39], chapter 1, p. 19.
3. Strategic Role of Electrified Transport in Poland
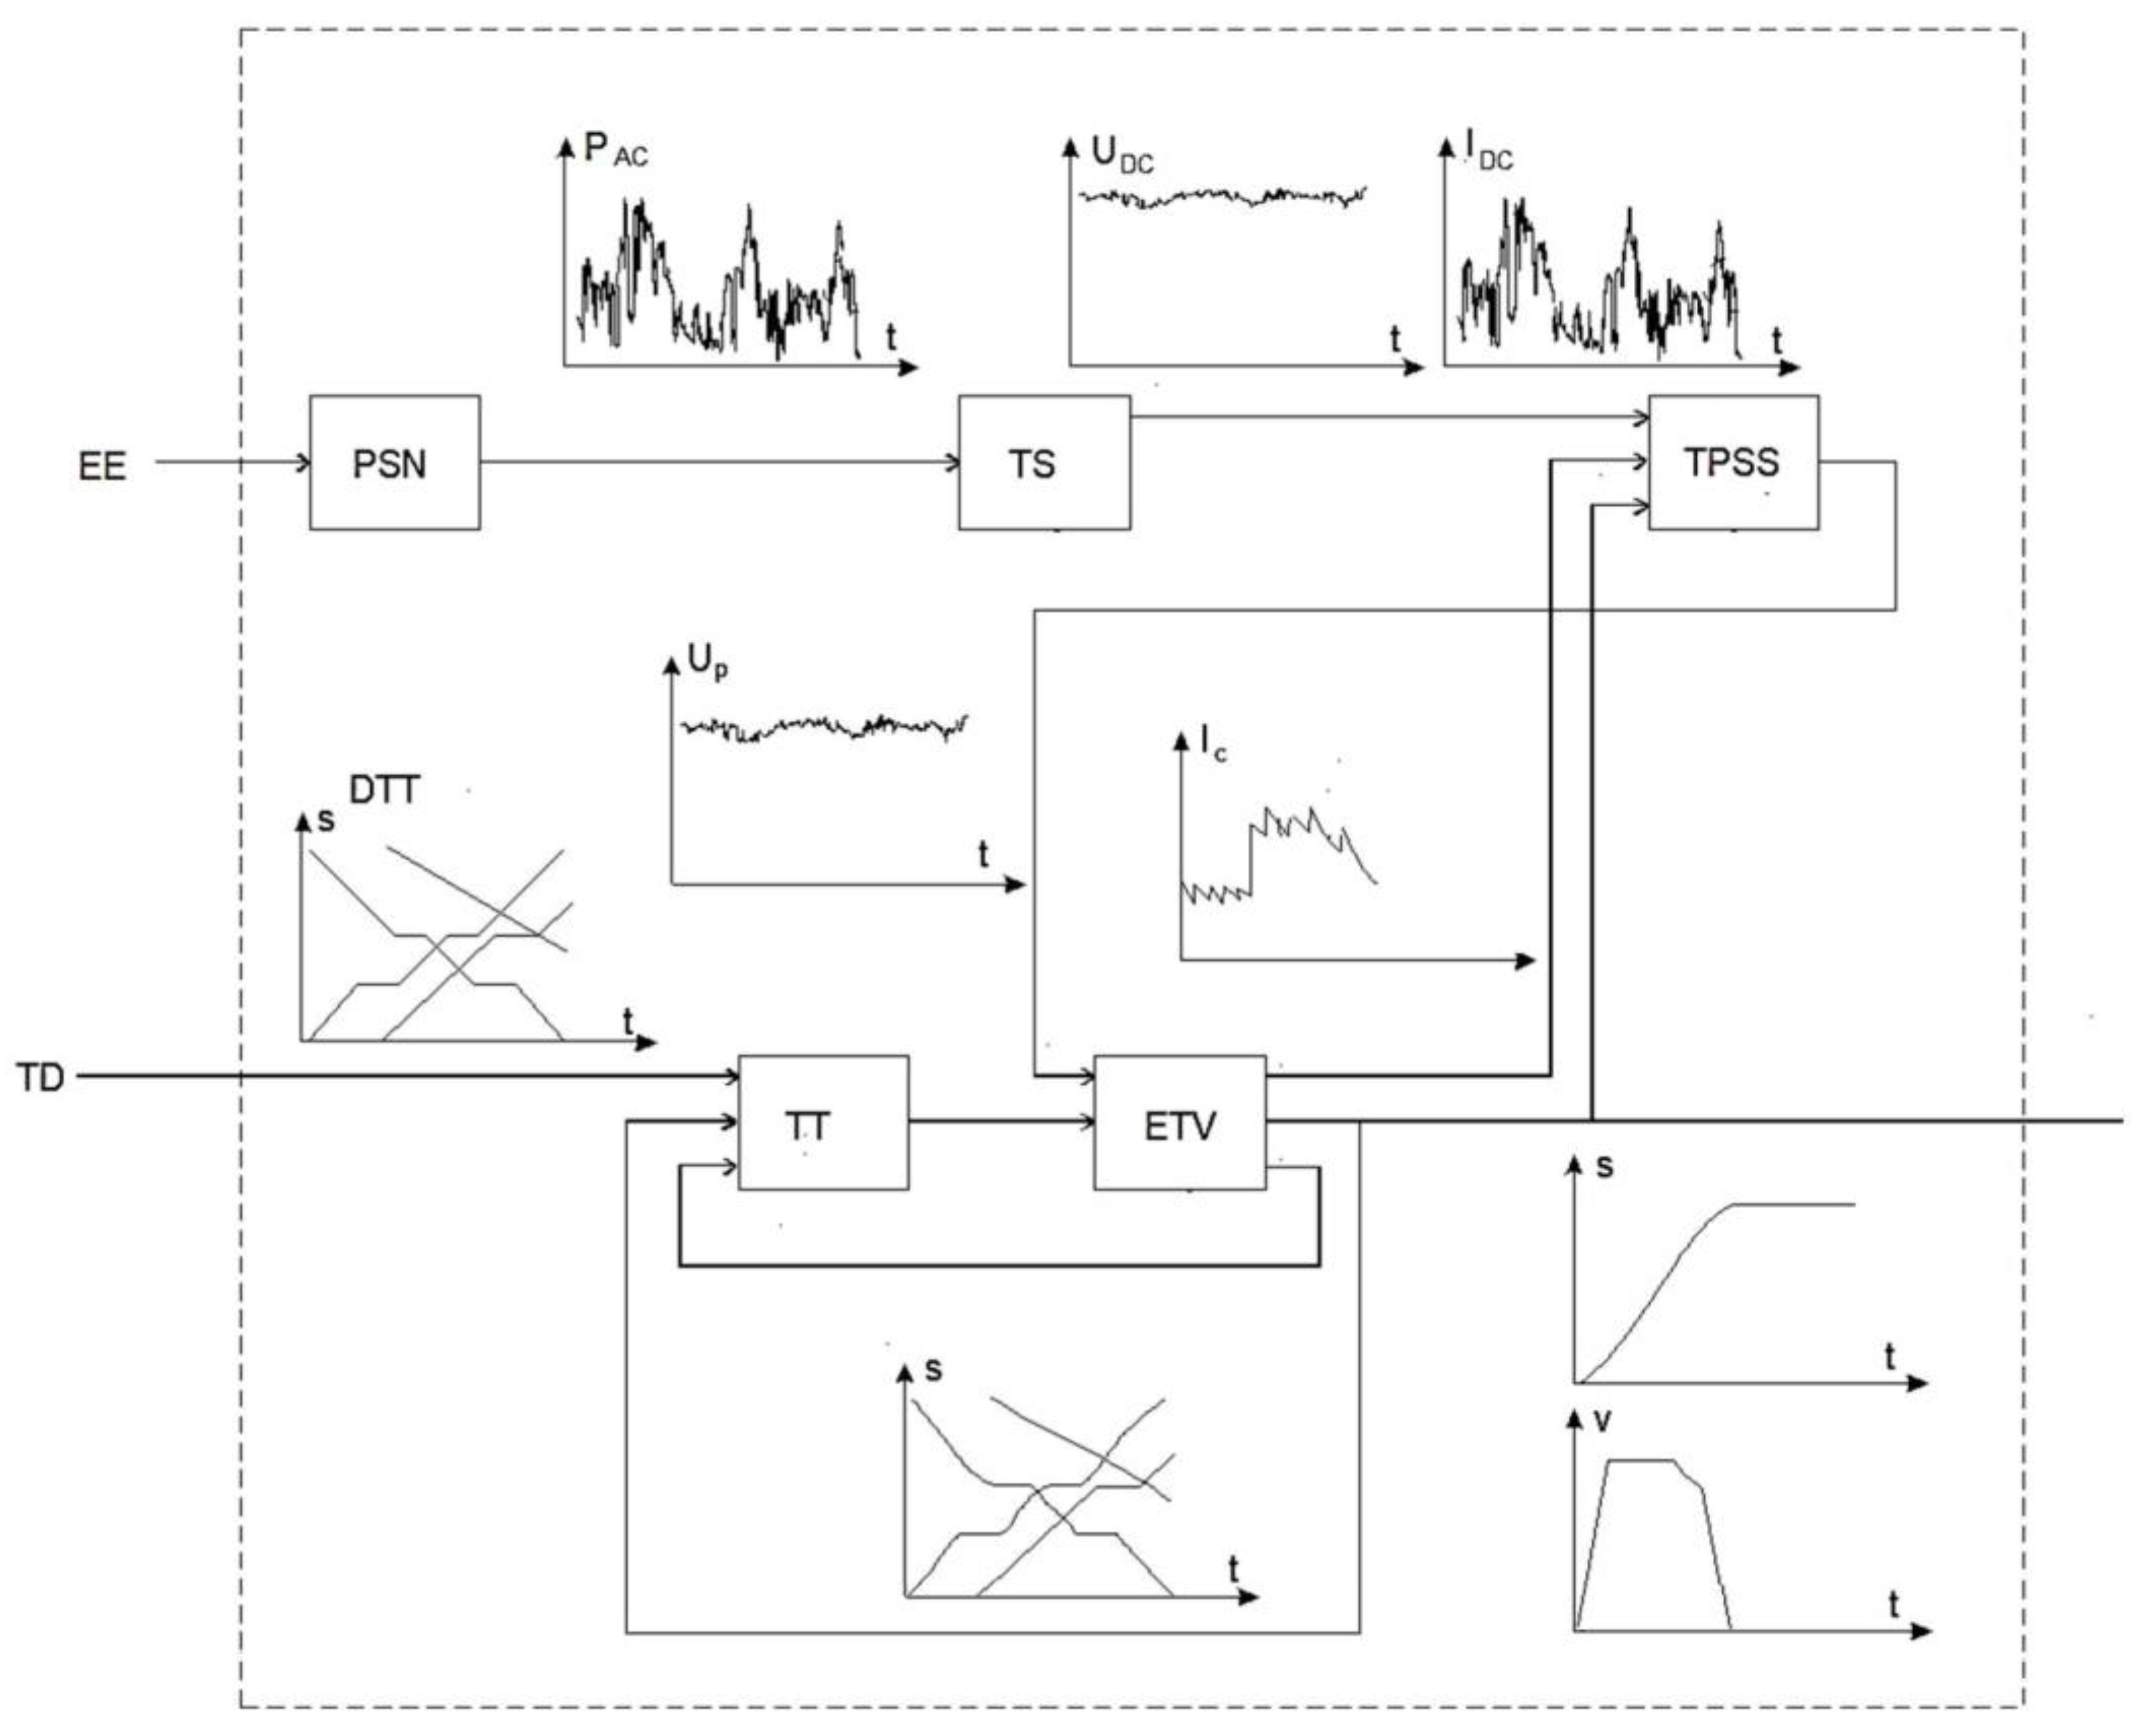
4. Methods of Analysis of Electrified Transport Systems
- -
- Find a solution for technical structure of AC and DC power supply for a defined traffic flow and organization;
- -
- Calculate, according to the defined criteria, railway traffic capacity for the pre-set structure of power supply and describe the requirements for the organization of traffic;
- -
- Verify, with a view to energy consumption, the assumed organization of traffic volumes, assign it to trains categories and timetables.
- -
- Usefulness of the solution;
- -
- Multivariant options;
- -
- Mathematical description of technical and economic problems of energy use;
- -
- Assessment of the advantages and drawbacks of particular options taking into account uncertainties and risks.
- Long-term measures:
- -
- Upgrade of AC and DC power supply networks;
- -
- Putting into service a new type of rolling stock;
- -
- Track upgrade (proper profile, increased speed limits).
- Short-term (low-investment) measures are based on organizational changes in:
- -
- Traffic;
- -
- Energy supply (lower tariffs, special agreements, time-zone tariffs, etc.).
- Optimized vehicle movement, timetable, sequences of trains, including by application of automatic control and management;
- Proper matching of locomotives and trains (power, speed, weight, distance, route profile).
- Applying proper power supply patterns and systems;
- Energy saving equipment;
- Spreading peak loads during longer periods to limit excessive rush load and make traction load more uniform, increase reliability and availability of power delivery systems.
- -
- Aim at reduction in energy consumption;
- -
- Reduction in costs of energy and demanded power;
- -
- Defining the rational level of required investments in power supply.
- -
- Where possible, reasonable and economically justified reduction in energy consumption, having in mind traffic demand and quality of service;
- -
- Reduction in the cost of energy whenever and wherever possible.
- Interoperability;
- Reliability;
- Minimization of investment and operational costs;
- Improving safety by implementation of ETCS (European Train Control System);
- ERTMS (European Rail Traffic Management System);
- Reducing negative impacts of railway lines on infrastructure and the environment.
5. ED250 (Pendolino)—The First High-Speed Trains in Poland
5.1. Assumptions of the High-Speed Train Purchase Project in Poland
- EIC (Express Intercity)—a wagon train run by a locomotive; assumed V max 160 km/h;
- IC (Intercity)—new emu and new or modernized coaches, assumed V max 160 km/h;
- TLK—conventional coaches.
- Speed record in the Polish network;
- World record for 3kV DC traction system;
- Record for Pendolino trains family.
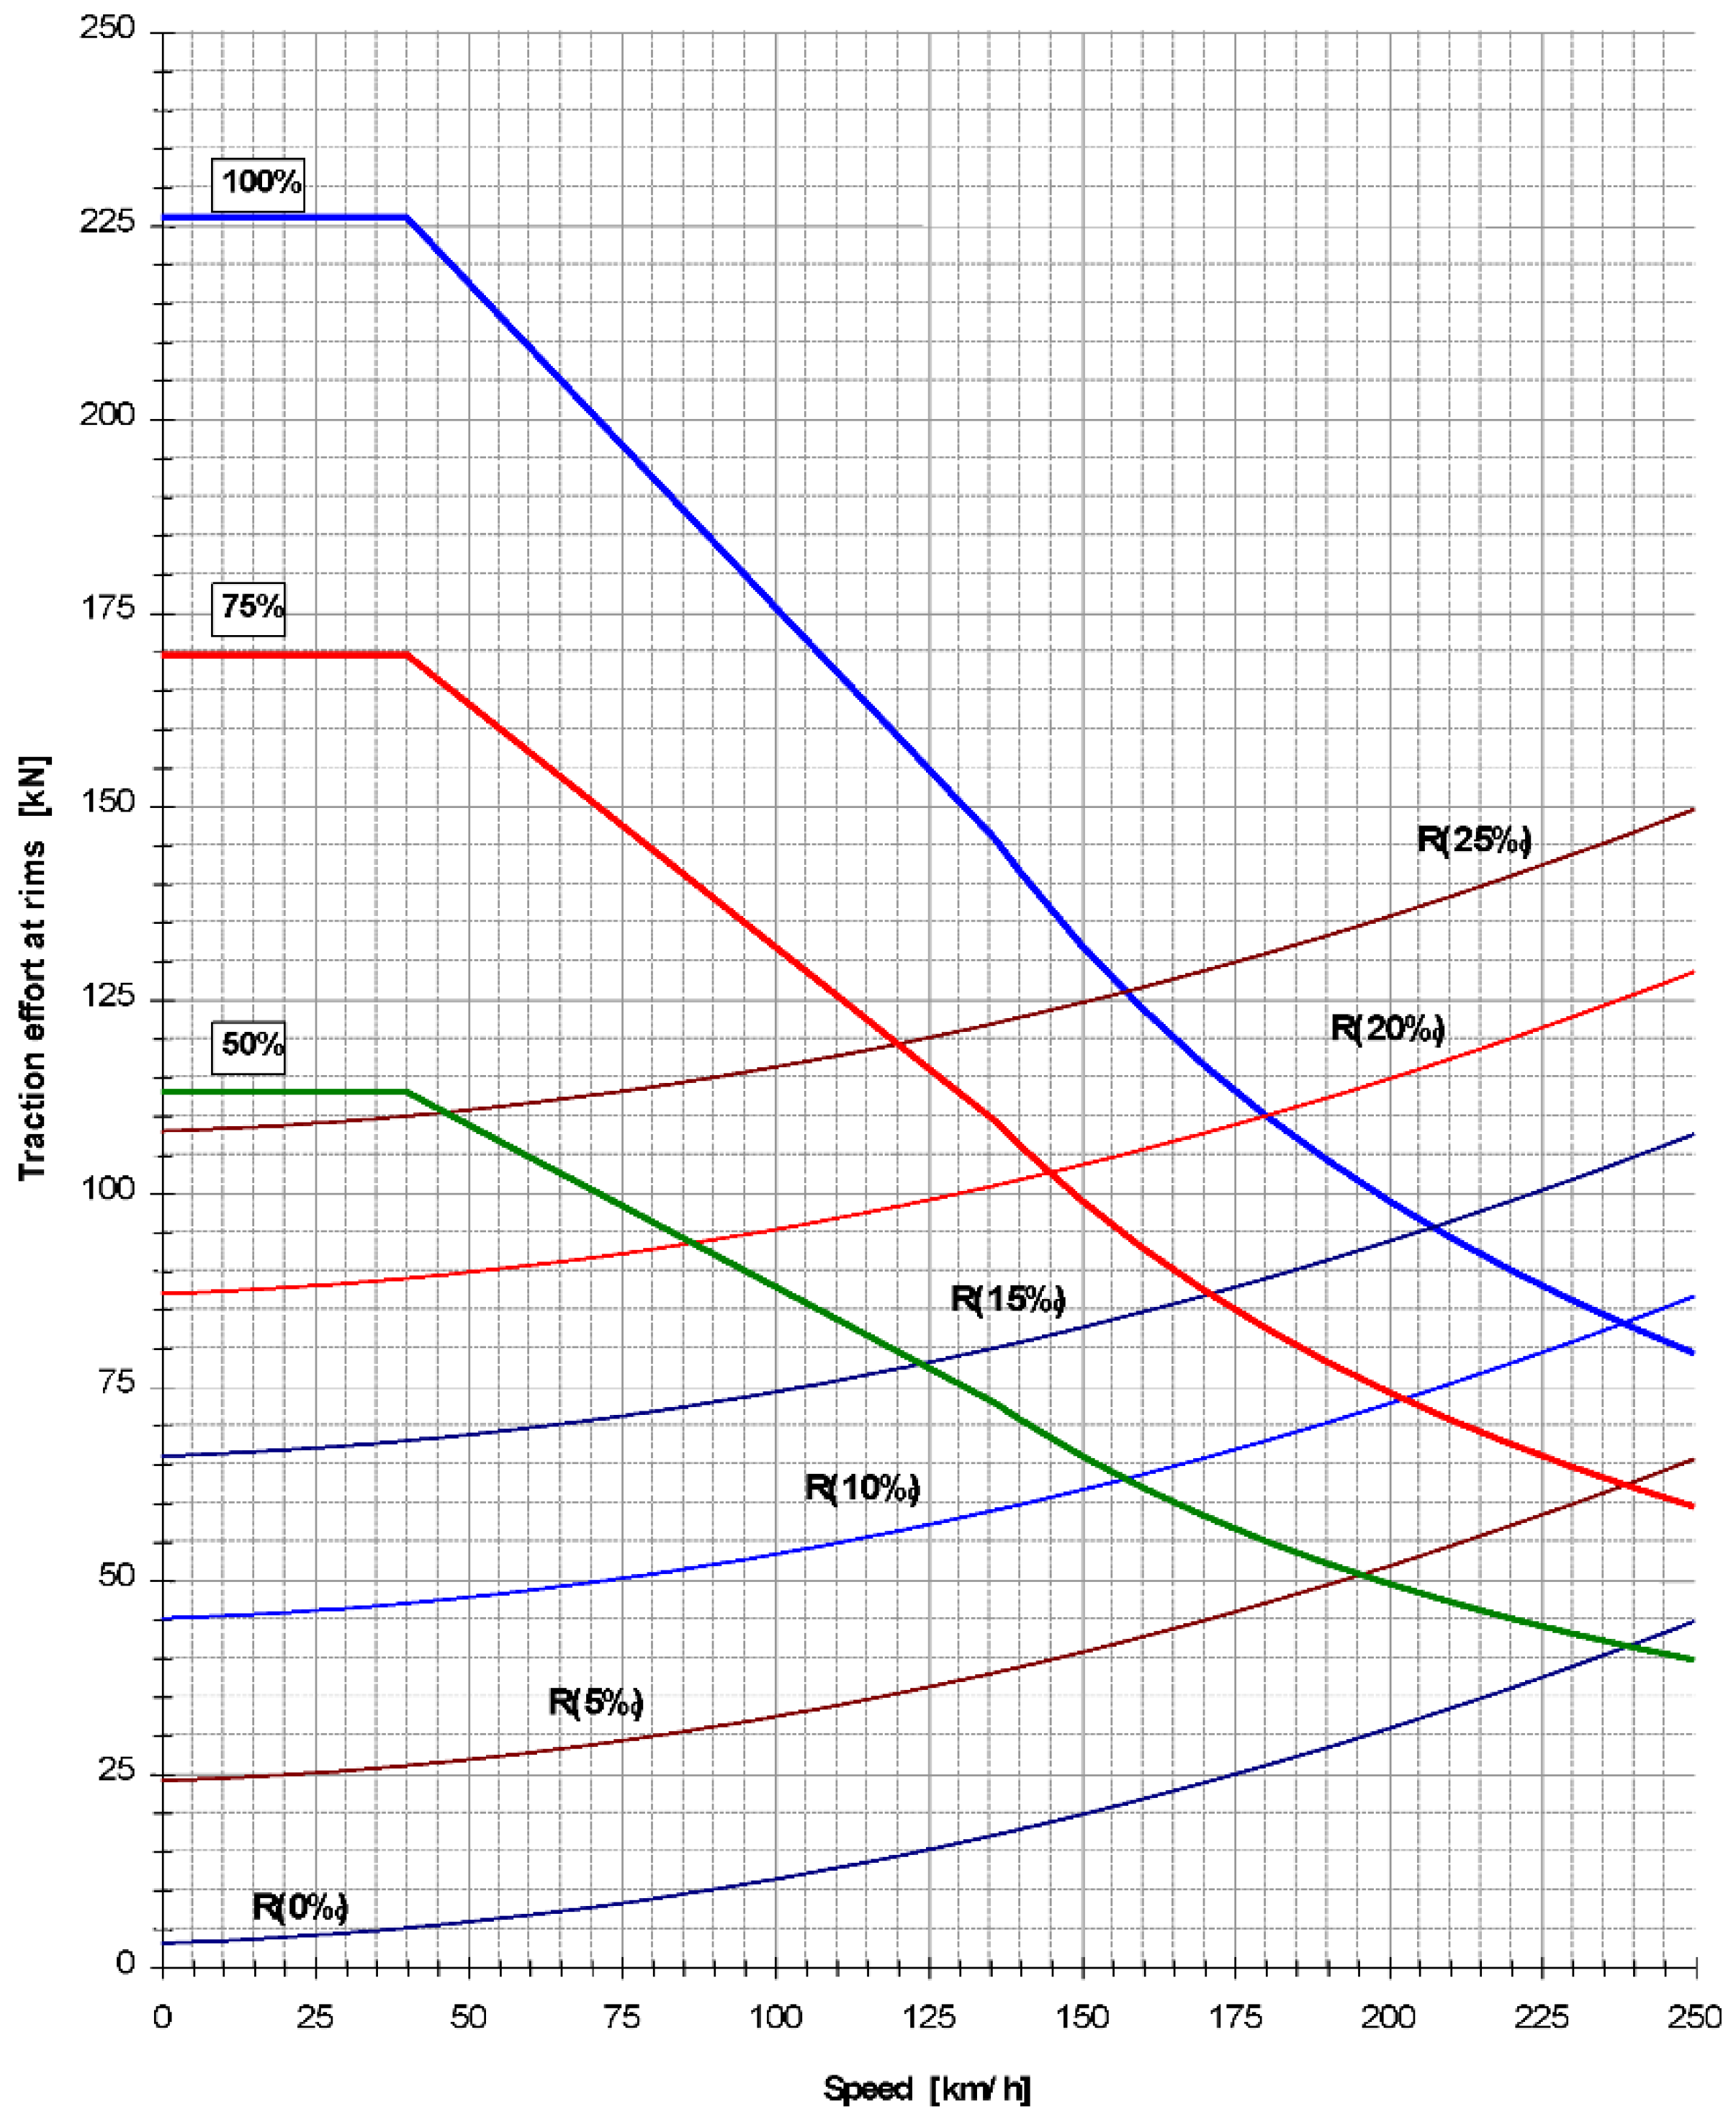
5.2. Characteristics of ED250
5.3. Offer Development
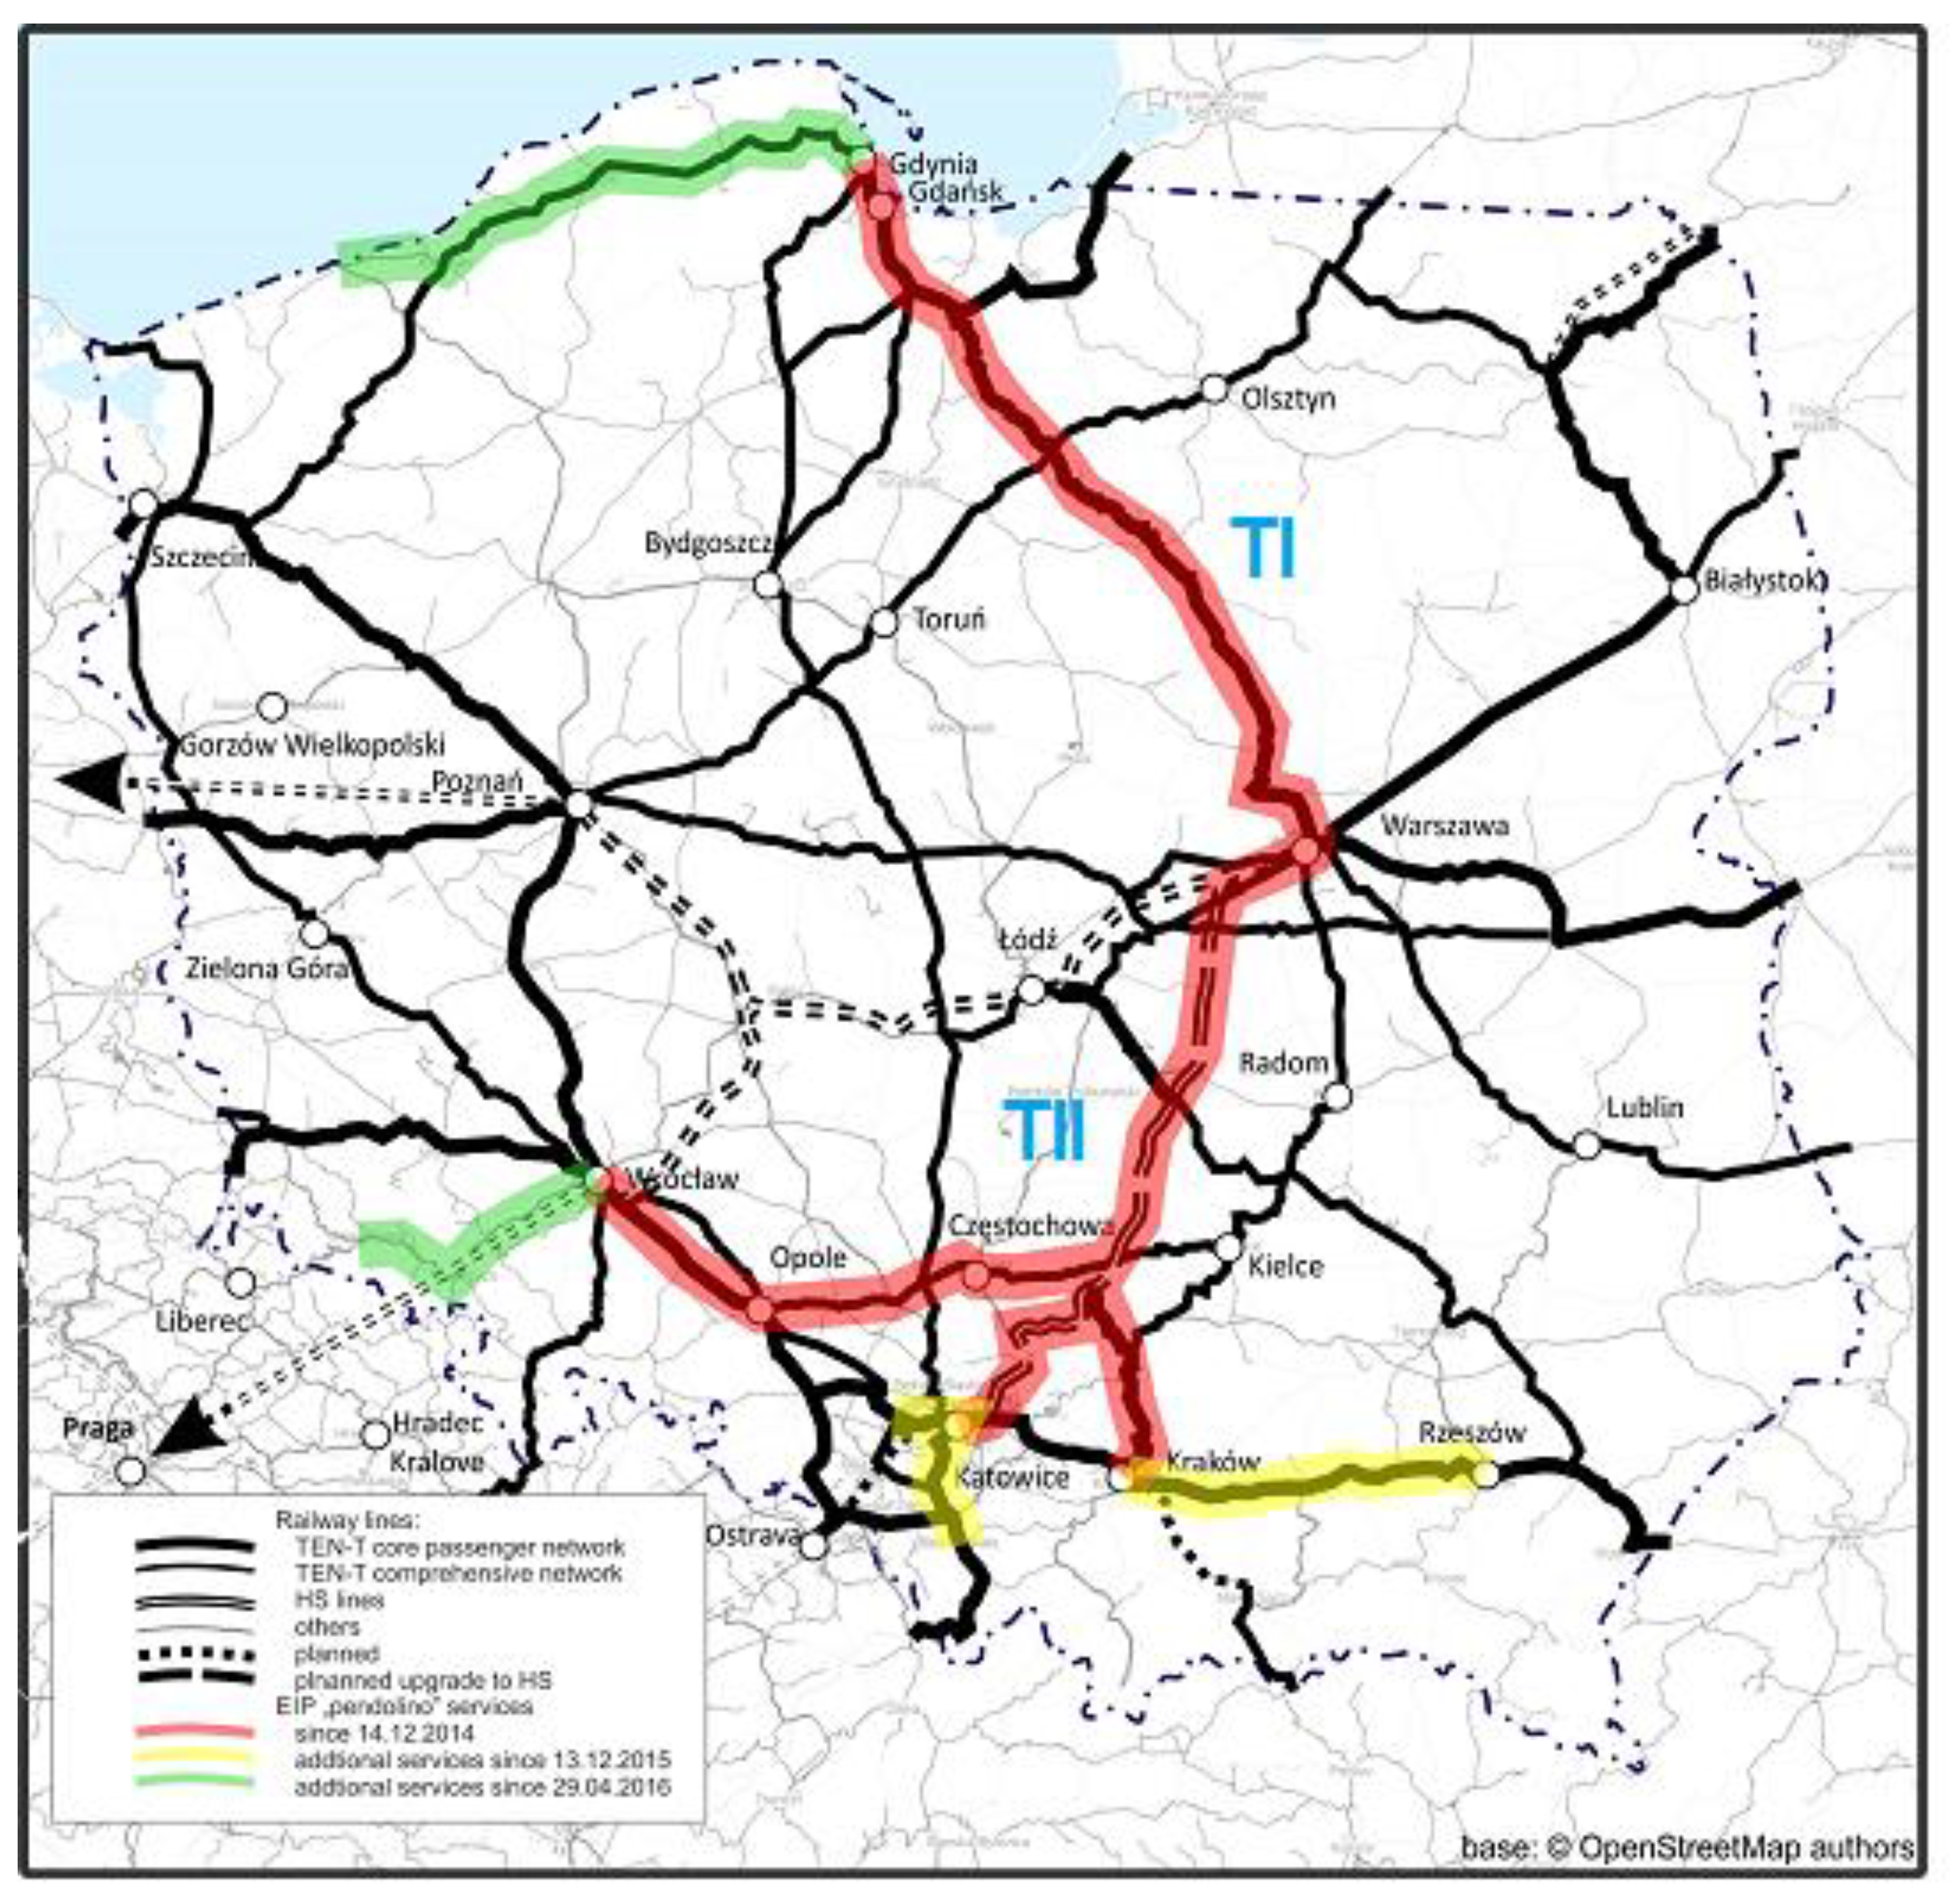
- Warsaw–Gdynia (with intermediate stations: Sopot, Gdańsk Oliwa, Gdańsk Wrzeszcz, Gdańsk Główny, Tczew, Malbork, Iława, Warszawa Wschodnia);
- Warsaw–Krakow (with intermediate stations: Warszawa Zachodnia);
- Warsaw–Katowice (with intermediate stations Warszawa Zachodnia, Sosnowiec Główny, Zawiercie) [51].
- On 13 March 2016, certain connections to Wrocław were temporarily redirected from line No. 4 to line No. 1, which extended travel time and involved a stop at the Częstochowa Stradom station instead of Częstochowa The reason for the change was maintenance works on line 4 [53];
- On the 6–11 August 2016, due to maintenance works at the Biała Rawska station, the movement of trains on the Grodzisk Mazowiecki–Idzikowice section was completely suspended, and trains were directed to detour routes: to Kraków via Koluszki, Tomaszów Mazowiecki and Idzikowice, and to Katowice via Skierniewice, Koluszki, and Częstochowa [54];
- From 10 July to 10 August 2017 on the CMK section Opoczno Południe–Włoszczowa Północ/Knapówka there was a round-the-clock both-way closure, as a result of which most trains ran through Skierniewice and Częstochowa. In addition, two EIP Warsaw–Jelenia Góra trains ran through the Łódź Widzew station [55].
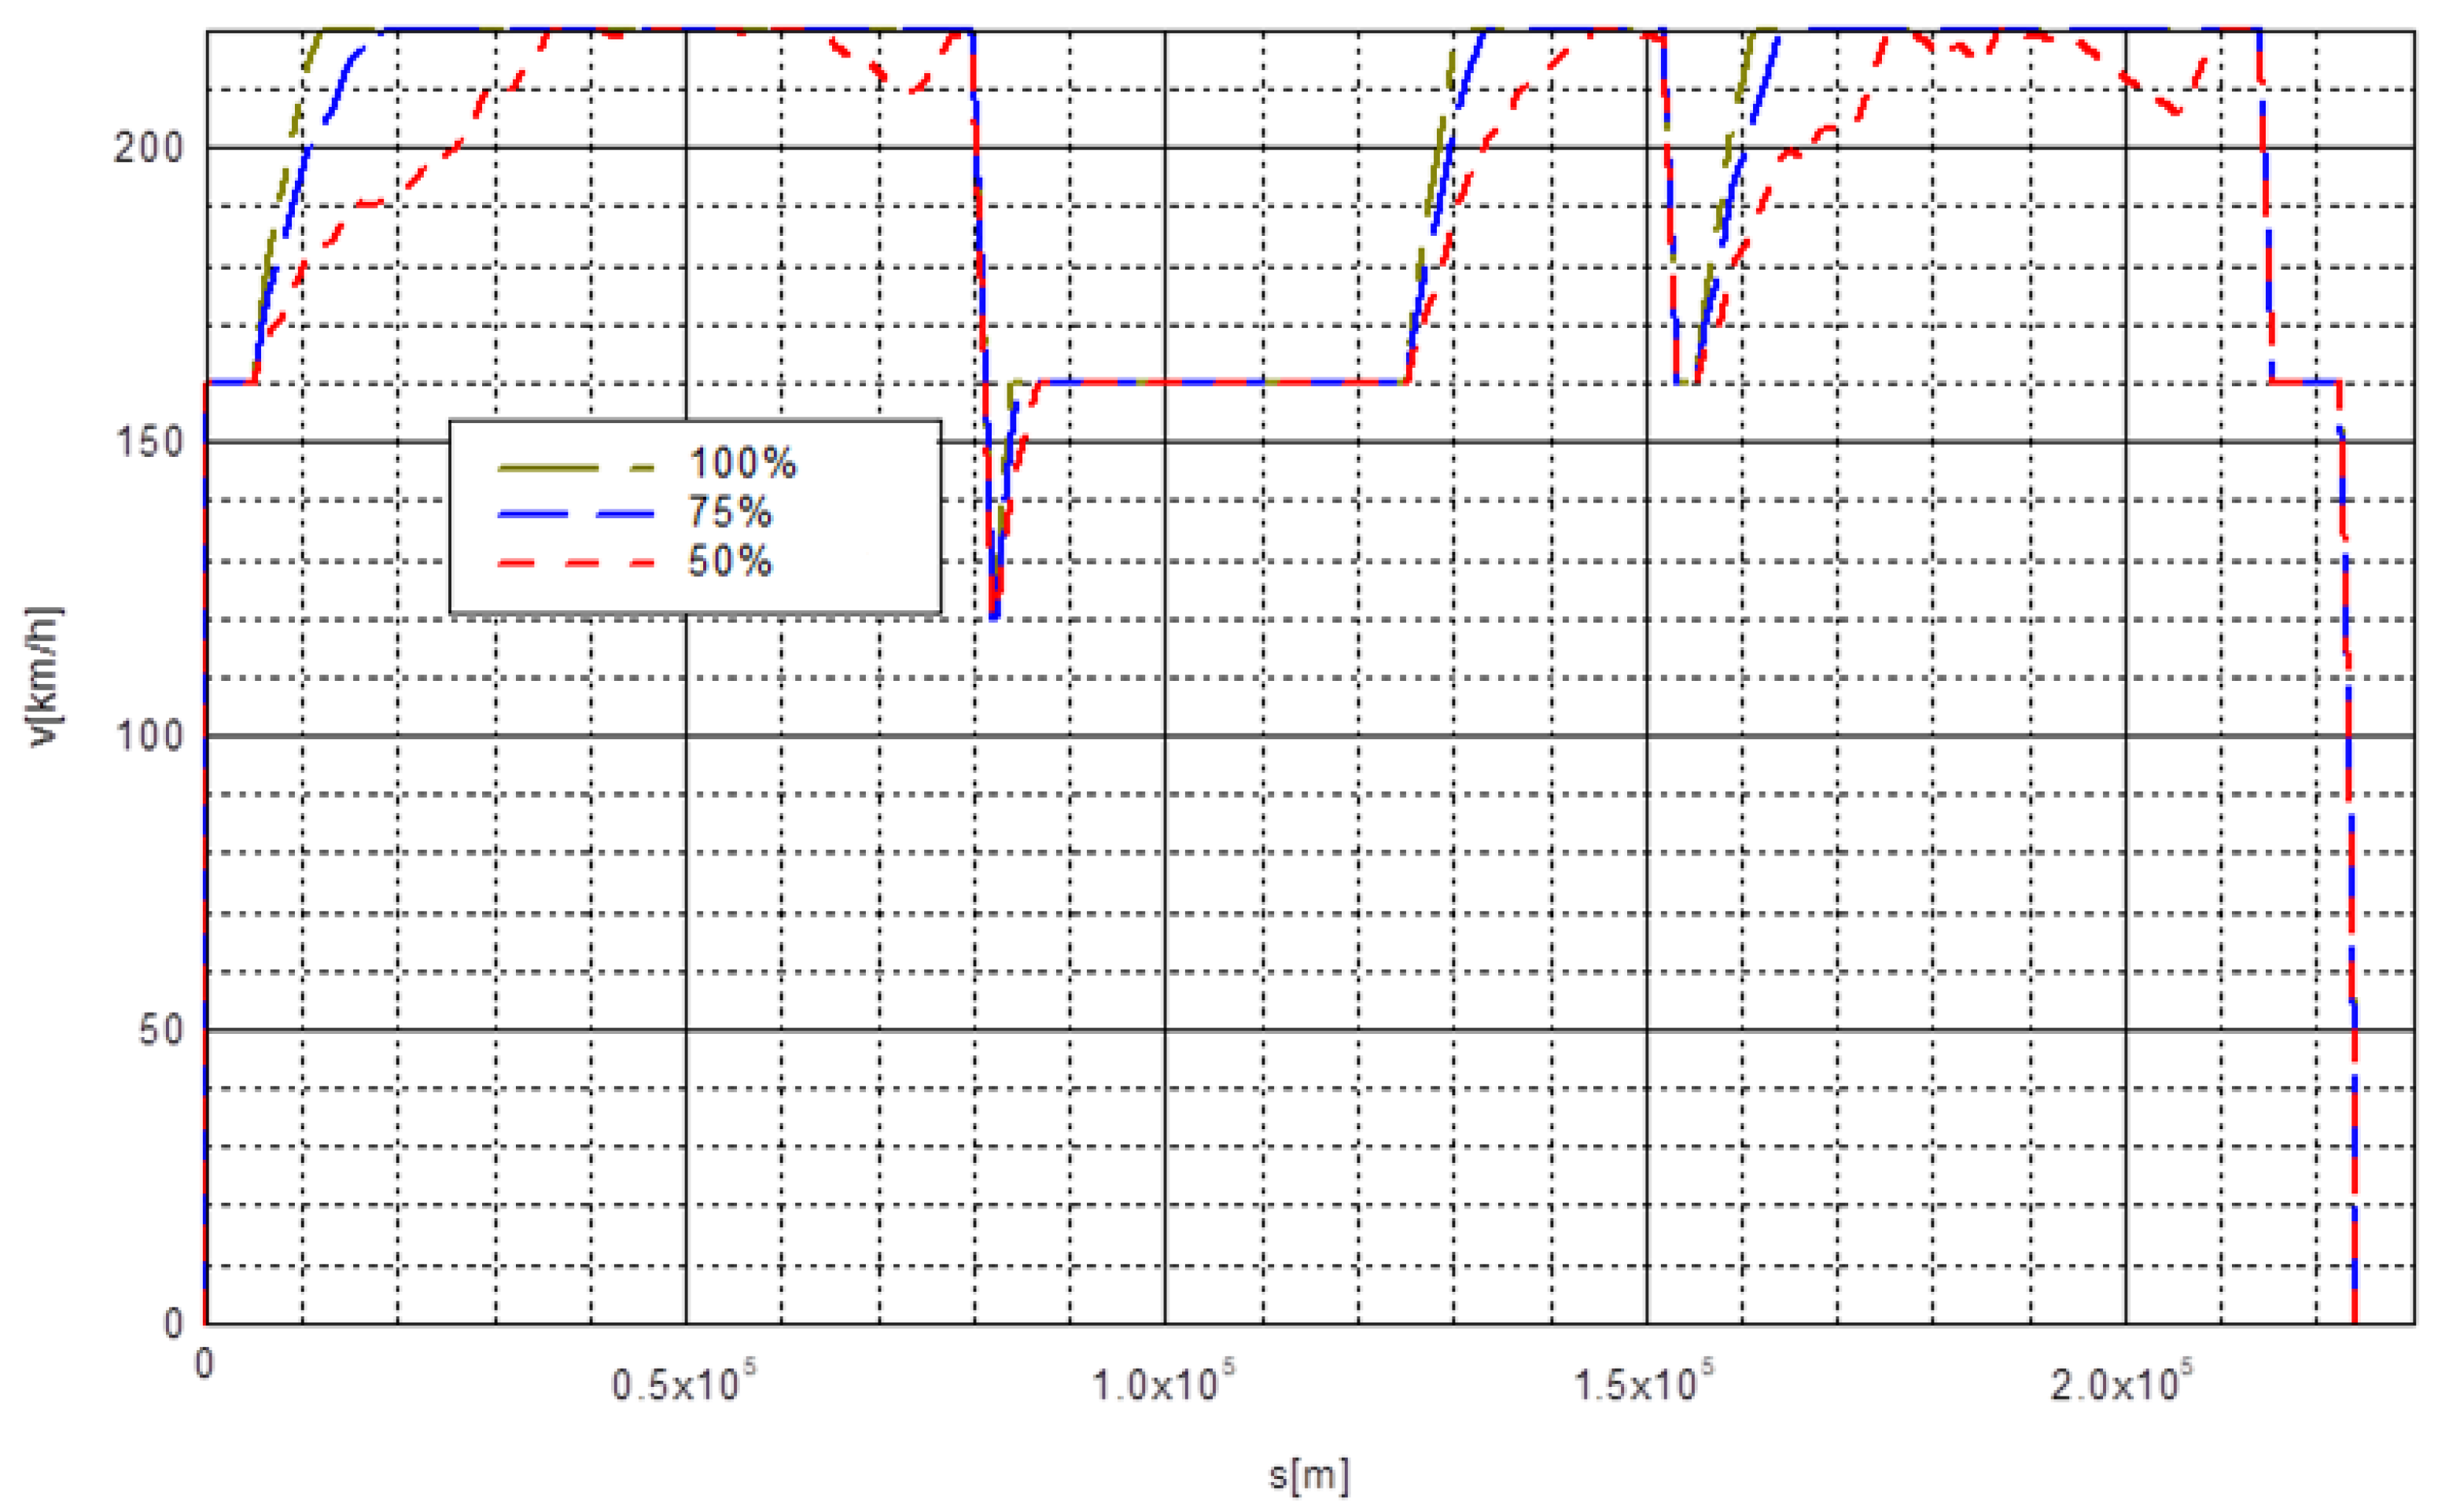
6. Energy Efficiency and Environmental Outcomes of ED250 Trains—A Case Study
- -
- -
- -
- Warszawa–Łódź-Kalisz 230 km;
- -
- Kalisz–Poznań 120 km;
- -
- Kalisz–Wrocław 100 km;
- -
- Poznań–German border (to Berlin) 120 km;
7. Conclusions
Author Contributions
Funding
Institutional Review Board Statement
Informed Consent Statement
Data Availability Statement
Conflicts of Interest
Nomenclature
| AC | Alternating current |
| CBA | Cost–Benefit Analysis |
| CEEK | Center for Railway Energy Efficiency |
| DC | Direct Current |
| DTT | Demanded Timetable |
| Ec | Energy consumption for traction purposes only on a route |
| Ecu | Specific energy consumption for traction purposes per to km |
| Ecut | Specific energy consumption for traction purposes per train km |
| Ecrek | Energy consumption for traction purposes only with recuperation on the route |
| EC | European Commision |
| EE | Electrical energy |
| EIC | European Innovation Council |
| ERL | Electrified Railway Lines |
| ERTMS | European Rail Traffic Management System |
| ETCS | European Train Control System |
| ETS | Electrified Transport System |
| EU ETS | EU Emissions Trading System |
| EU | European Union |
| Eup | Energy consumption for traction per 1000 pas km |
| Fp | Traction force |
| GHG | Greenhouse Gas |
| Ic | ETV current |
| IDC | TS current |
| OECD | Organisation for Economic Cooperation and Development |
| PAC | Power taken by TS from PSN |
| Pel | Electric power taken by a train |
| Pmech | Mechanical power developed by a train |
| PKP S.A. | Polish State Railways |
| PKP Energetyka | Power supply company for railways in Poland |
| PKP PLK S.A. | Railway Infrastructure Manager |
| PPS | Purchasing Power Standards |
| RES | Renewable Energy Sources |
| RTT | Resulted time-tabe |
| TD | Transport demand |
| TEN-T | Trans-European Transport Network |
| TGV | High-Speed Train (in France) |
| TO | Transport output |
| TT | Timetable |
| UDC | Voltage at TS’s busbar |
| Up | Voltage in catenary (at ETV’s pantograph) |
| UIC | International Union of Railways |
| WKD | Warsaw Commuter Railway (in Poland) |
| Vp | Speed of the locomotive |
| vav | Average velocity without time of stops |
| vavs | The average velocity with time of stops |
| %RS | Savings in energy consumption due to recuperation |
References
- UN. Enviroment Programme Report of the Governing Council on the Work of Its Third Session; UN: New York, NY, USA, 1975. [Google Scholar]
- UN General Assembly. Rio Declaration on Environment and Development; UN General Assembly: New York, NY, USA, 1992; Volume I, pp. 1–5. [Google Scholar]
- UN. Agenda 21. Rio de Janerio. 1992. Available online: http://www.un.org/esa/sustdev/documents/agenda21/english/Agenda21.pdf (accessed on 12 September 2021).
- EC. Towards Sustainability. In A European Community Programme of Policy and Action in Relation to the Enviroment and Sustainable Development; EC: Bruxelles, Belgium, 1993. [Google Scholar]
- European Commission. A Sustainable Europe for a Better World. A European Union Strategy for Sustainable Development; European Commission: Bruxelles, Belgium, 2001; pp. 1–16. [Google Scholar]
- European Council. Review of the EU Sustainable Development Strategy (EU SDS)—Renewed Strategy. Annex 10117/06; European Council: Brussels, Belgium, 2006; pp. 1–29. [Google Scholar]
- Commission of the European Communities. A Sustainable Future for Transport: Towards an Integrated, Technology-Led and User Friendly System; Commission of the European Communities: Brussels, Belgium, 2009. [Google Scholar]
- European Commission. A European Strategy for Smart, Sustainable and Inclusive Growth; European Commission: Brussels, Belgium, 2020. [Google Scholar]
- EC. The European Green Deal; EC: Bruxelles, Belgium, 2019. [Google Scholar]
- Komisja Europejska. Strategia na Rzecz Zrównoważonej i Inteligentnej Mobilności—Europejski Transport na Drodze ku Przyszłości; Komisja Europejska: Bruksela, Belgium, 2020. [Google Scholar]
- OECD European Conference of Ministers of Transport. Assesment & Decision Making for Sustainable Transport; European Conference of Ministers of Transport: Paris, France, 2004. [Google Scholar] [CrossRef]
- Szeląg, A.; Lewandowski, M.; Maciołek, T. Od tramwaju do elektromobilności—140 lat rozwoju i 100 lat nauczania trakcji elektrycznej w Politechnice Warszawskiej. Prz. Elektrotechniczny 2020, 96, 213–224. [Google Scholar] [CrossRef]
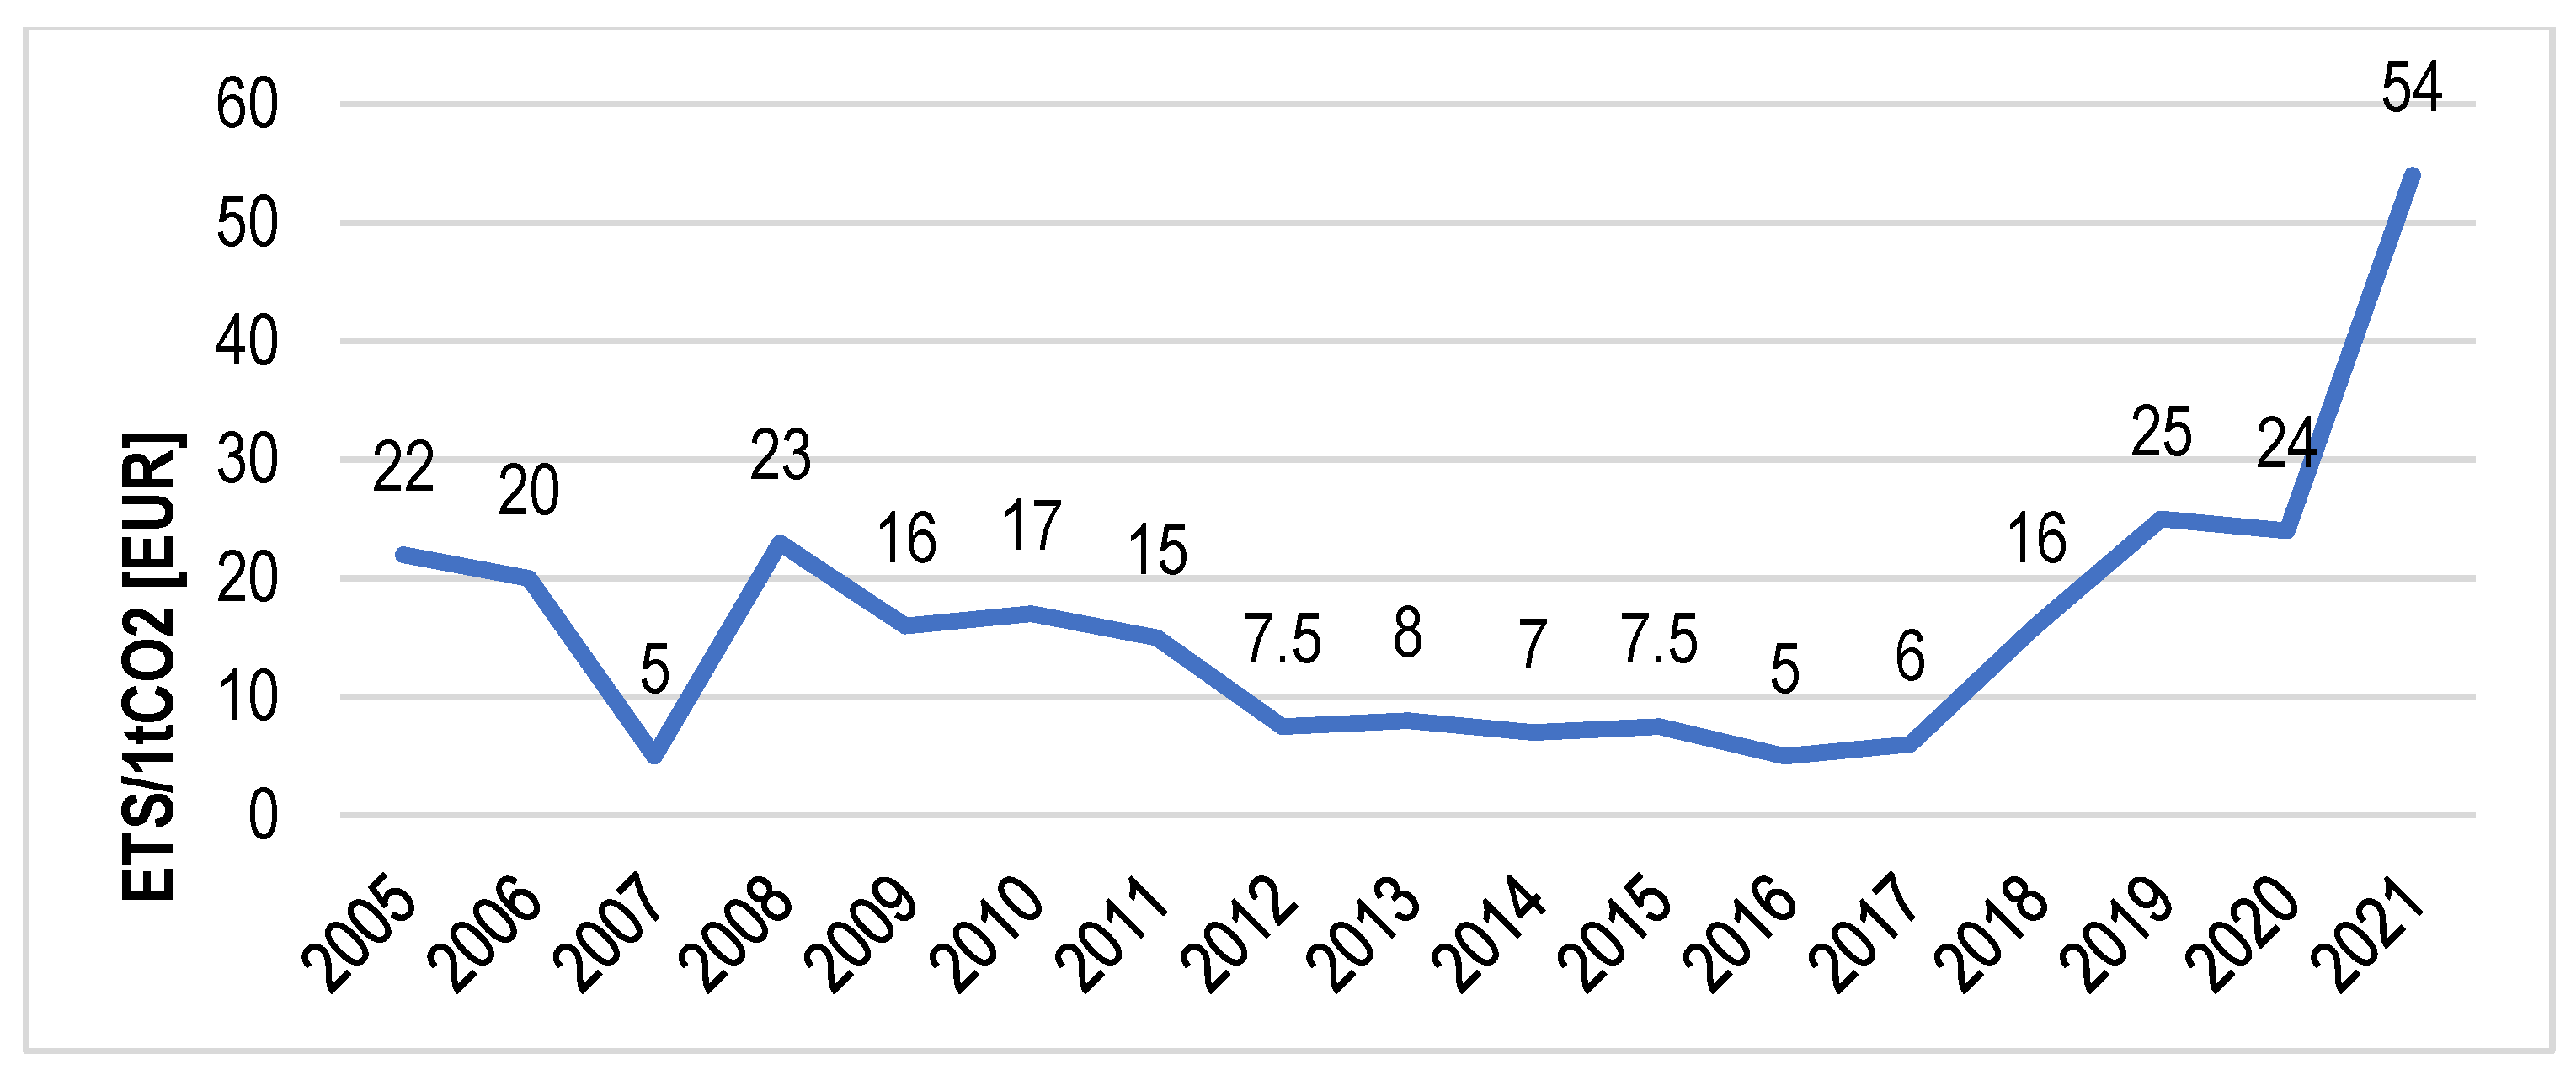
- EU Carbon Permits. Trading Economics. 2022. Available online: https://tradingeconomics.com/commodity/carbon (accessed on 18 February 2022).
- CO2 Emission by Transport. EEA. 2017. Available online: https://www.eea.europa.eu/data-and-maps/indicators/transport-emissions-of-greenhouse-gases/transport-emissions-of-greenhouse-gases-12 (accessed on 18 February 2022).
- GUS. Raport 2020. Polska na Drodze Zrównoważonego Rozwoju’, Warszawa. 2020. Available online: https://raportsdg.stat.gov.pl/2020/cel13.html (accessed on 16 February 2022).
- Song, M.; Wu, N.; Wu, K. Energy Consumption and Energy Efficiency of the Transportation Sector in Shanghai. Sustainability 2014, 6, 702–717. [Google Scholar] [CrossRef] [Green Version]
- Baumeister, S. Replacing short-haul flights with land-based transportation modes to reduce greenhouse gas emissions: The case of Finland. J. Clean. Prod. 2019, 225, 262–269. [Google Scholar] [CrossRef]
- Dalkiç, G.; Balaban, O.; Tuydes-Yaman, H.; Celikkol-Kocak, T. An assessment of the CO2 emissions reduction in high speed rail lines: Two case studies from Turkey. J. Clean. Prod. 2017, 165, 746–761. [Google Scholar] [CrossRef]
- Sun, Y.-Y.; Lin, Z.-W. Move fast, travel slow: The influence of high-speed rail on tourism in Taiwan. J. Sustain. Tour. 2017, 26, 433–450. [Google Scholar] [CrossRef]
- Van Wee, B.; Brink, R.V.D.; Nijland, H. Environmental impacts of high-speed rail links in cost–benefit analyses: A case study of the Dutch Zuider Zee line. Transp. Res. Part D Transp. Environ. 2003, 8, 299–314. [Google Scholar] [CrossRef]
- Van Essen, H.; Bello, O.; Dings, J.; Brink, R.V.D. To Shift or not to Shift, That’s the Question: The Environmental Performance of the Principal Modes of Freight and Passenger Transport in the Policymaking Process; CE: Delft, The Netherlands, 2003. [Google Scholar]
- Huang, C.-H. Inventory of Energy Consumption and Greenhouse Gas Emissions in Transportation Sector—Developing Energy Efficiency Indicator and Modeling Energy Consumption for Transportation Sector; Institution of Transportation, Ministry of Transportation and Communications: Taipei, Taiwan, 2011.
- Robertson, S. The potential mitigation of CO2 emissions via modal substitution of high-speed rail for short-haul air travel from a life cycle perspective—An Australian case study. Transp. Res. Part D Transp. Environ. 2016, 46, 365–380. [Google Scholar] [CrossRef]
- Åkerman, J. The role of high-speed rail in mitigating climate change—The Swedish case Europabanan from a life cycle perspective. Transp. Res. Part D Transp. Environ. 2011, 16, 208–217. [Google Scholar] [CrossRef]
- Chen, P.; Lu, Y.; Wan, Y.; Zhang, A. Assessing carbon dioxide emissions of high-speed rail: The case of Beijing-Shanghai corridor. Transp. Res. Part D Transp. Environ. 2021, 97, 102949. [Google Scholar] [CrossRef]
- Chester, M.; Horvath, A. High-speed rail with emerging automobiles and aircraft can reduce environmental impacts in California’s future. Environ. Res. Lett. 2012, 7, 034012. [Google Scholar] [CrossRef]
- Tang, Z.; Mei, Z.; Zou, J. Does the Opening of High-Speed Railway Lines Reduce the Carbon Intensity of China’s Resource-Based Cities? Energies 2021, 14, 4648. [Google Scholar] [CrossRef]
- Jiang, C.; Wan, Y.; Yang, H.; Zhang, A. Impacts of high-speed rail projects on CO2 emissions due to modal interactions: A review. Transp. Res. Part D Transp. Environ. 2021, 100, 103081. [Google Scholar] [CrossRef]
- Cornet, Y.; Dudley, G.; Banister, D. High Speed Rail: Implications for carbon emissions and biodiversity. Case Stud. Transp. Policy 2018, 6, 376–390. [Google Scholar] [CrossRef] [Green Version]
- Amjad, S.; Rudramoorthy, R.; Neelakrishnan, S. Assessment of petroleum saving and greenhouse gas emission reduction from two-wheeler segment: 2011–2021. Transp. Res. Part D Transp. Environ. 2011, 16, 265–269. [Google Scholar] [CrossRef]
- Smith, R.; Shahidinejad, S.; Blair, D.; Bibeau, E. Characterization of urban commuter driving profiles to optimize battery size in light-duty plug-in electric vehicles. Transp. Res. Part D Transp. Environ. 2011, 16, 218–224. [Google Scholar] [CrossRef]
- Merchan, A.L.; Belboom, S.; Leonard, A. Life cycle assessment of rail freight transport in Belgium. Clean Technol. Environ. Policy 2020, 22, 1109–1131. [Google Scholar] [CrossRef]
- Mabit, S.L.; Fosgerau, M. Demand for alternative-fuel vehicles when registration taxes are high. Transp. Res. Part D Transp. Environ. 2011, 16, 225–231. [Google Scholar] [CrossRef]
- Maghelal, P. Investigating the relationships among rising fuel prices, increased transit ridership, and CO2 emissions. Transp. Res. Part D Transp. Environ. 2011, 16, 232–235. [Google Scholar] [CrossRef]
- Cariou, P. Is slow steaming a sustainable means of reducing CO2 emissions from container shipping? Transp. Res. Part D Transp. Environ. 2011, 16, 260–264. [Google Scholar] [CrossRef]
- Radu, P.V.; Szelag, A.; Steczek, M. On-Board Energy Storage Devices with Supercapacitors for Metro Trains—Case Study Analysis of Application Effectiveness. Energies 2019, 12, 1291. [Google Scholar] [CrossRef] [Green Version]
- Radu, P.V.; Lewandowski, M.; Szelag, A. On-Board and Wayside Energy Storage Devices Applications in Urban Transport Systems—Case Study Analysis for Power Applications. Energies 2020, 13, 2013. [Google Scholar] [CrossRef] [Green Version]
- Carbon-Neutral Flying. Available online: https://www.lufthansa.com/es/en/offset-flight (accessed on 12 February 2022).
- KPGM Advisory Sp. z Ograniczoną Odpowiedzialnością Sp. k. We Energize Polish Rail. Corporate Responsability Report 2020—PKP Energetyka Capital Group, Warsaw. 2020. Available online: https://www.pkpenergetyka.pl/O-PKP-Energetyka/Spoleczna-odpowiedzialnosc/Raporty-spoleczne/PL/PKP_Energetyka_-_Sustainability_Report_2020_EN.pdf (accessed on 8 February 2022).
- EU. Regulation (EU) No 1315/2013 of the European Parliament and of the Council of 11 December 2013 on Union Guidelines for the Development of the Trans-European Transport Network and Repealing Decision No 661/2010/EU; Consolided Version; EU: Bruxelles, Belgium, 2013; pp. 1–21. [Google Scholar]
- EU. Regulation (EU) No 1316/2013 of the European Parliament and of the Council of 11 December 2013 Establishing the Connecting Europe Facility, Amending Regulation (EU) No 913/2010 and Repealing Regulations (EC) No 680/2007 and (EC) No 67/2010; EU: Bruxelles, Belgium, 2013; Volume 2013, pp. 129–171. [Google Scholar]
- Renfe. High Speed Trains and Energy Efficiency; Renfe: Madrid, Spain, 2007. [Google Scholar]
- Banar, M.; Özdemir, A. An evaluation of railway passenger transport in Turkey using life cycle assessment and life cycle cost methods. Transp. Res. Part D Transp. Environ. 2015, 41, 88–105. [Google Scholar] [CrossRef]
- Alnuman, H.; Gladwin, D.; Foster, M. Electrical Modelling of a DC Railway System with Multiple Trains. Energies 2018, 11, 3211. [Google Scholar] [CrossRef] [Green Version]
- Pilo, E.; Rouco, A.; Fernandez, A. A Simulation Tool for the Design of the Electrical Supply System of High-Speed Railway Lines. In Proceedings of the 2000 Power Engineering Society Summer Meeting (Cat. No.00CH37134), Seattle, WA, USA, 16–20 July 2000. [Google Scholar] [CrossRef]
- Arboleya, P.; Mayet, C.; Mohamed, B.; Aguado, J.A.; de la Torre, S. A review of railway feeding infrastructures: Mathematical models for planning and operation. eTransportation 2020, 5, 100063. [Google Scholar] [CrossRef]
- Szeląg, A.; Maciołek, T. A 3 kV DC electric traction system modernisation for increased speed and trains power demand-problems of analysis and synthesis. Prz. Elektrotechniczny 2013, 89, 21–28. [Google Scholar]
- European Commission. Commission Implementing Regulation (EU) 2019/776 of 16 May 2019 Amending Commission Regulations (EU) No 321/2013, (EU) No 1299/2014, (EU) No 1301/2014, (EU) No 1302/2014, (EU) No 1303/2014 and (EU) 2016/919 and Commission Implementing Decision 2011/665/EU; European Commission: Brussels, Belgium, 2019; pp. 108–311. [Google Scholar]
- UIC. Railway Specific Environmental Performance Indicators. In Leaflet 330; UIC: Paris, France, 2008; pp. 1–48. [Google Scholar]
- Uchwała Nr 276/2008 Rady Ministrów z Dnia 19 Grudnia 2008 r. w Sprawie Przyjęcia Strategii Ponadregionalnej Programu Budowy i Uruchomienia Przewozów Kolejami Dużych Prędkości w Polsce; Ministerstwo Infrastruktury: Warszawa, Poland, 2008. Available online: www.mi.gov.pl (accessed on 14 March 2009).
- CUPT. Projekt Indywidualny: Zakup Kolejowego Taboru Pasażerskiego do Obsługi Połączeń Dalekobieżnych—Etap I. CUPT. 2011. Available online: www.cupt.gov.pl/archiwum/indexc68c.html?id=1025 (accessed on 15 April 2021).
- PKP Time-Table: 2014/2015, 2015/2016, 2016/2017, 2017/2018, 2018/2019, 2019/2020. PKP PLK S.A. Available online: https://portalpasazera.pl/Tablice (accessed on 8 December 2019).
- Pendolino Pojedzie Wiedenką do Wrocławia. Kurier Kolejowy. 2016. Available online: https://kurier-kolejowy.pl/aktualnosci/27396/pendolino-pojedzie--wiedenka--do-wroclawia.html (accessed on 15 March 2021).
- Szybkie Prace na CMK. Kurier Kolejowy. 2016. Available online: https://kurier-kolejowy.pl/aktualnosci/28408/szybkie-prace-na-cmk--by-podroze-byly-krotsze.html (accessed on 15 March 2021).
- ‘Czasowe Zmiany na CMK’. Rynek Kolejowy. 2017. Available online: https://www.rynek-kolejowy.pl/wiadomosci/czasowe-zmiany-na-cmk-82465.html (accessed on 15 March 2021).
- Pomykała, A. Polish Regional and Long-Distance Railway Transport during the COVID-19 Pandemic. Probl. Kolejnictwa Railw. Rep. 2021, 65, 185–194. [Google Scholar] [CrossRef]
- Rungskunroch, P.; Shen, Z.-J.; Kaewunruen, S. Benchmarking environmental and economic impacts from the HSR networks considering life cycle perspectives. Environ. Impact Assess. Rev. 2021, 90, 106608. [Google Scholar] [CrossRef]
- UIC High Speed Department. High Speed Railway System Implementation Handbook-Leaflet; UIC High Speed Department: Paris, France, 2012; p. 2. [Google Scholar]
- Wysokienapiecie.pl. 2021. Available online: https://wysokienapiecie.pl/41743-ceny-pradu-w-polsce-niemal-najnizsze-w-europie/ (accessed on 13 February 2022).


| Parameter | Data |
|---|---|
| Class | ED250 |
| Maximum speed | 250 km/h |
| Number of coaches | 7 |
| Number of seats | 402 (57 × 1 class including 12 × mother and child comp, 345 × 2class with 2 PRM) |
| Axle arrangement | 1A′A1′ + 1A′A1′ + 2′2′ + 2′2′ + 2′2′ + 1A′A1′ + 1A′A1′ |
| Length of train | 187.4 m |
| Axle load | 14,643 kg (static ready to service) 15,793 kg (static normal load)) 17,600 kg (static maximum load)) |
| Dead mass | 414 t |
| Operational mass under normal payload | 445 t |
| Traction power | 5500 kW (8 × 708 kW) |
| Traction supply |
|
| On-board control command system | ETCS L1 + L2, SHP, SIFA, PZB/LZB, Mirel |
| Manufacturer | Alstom |
| Date of Putting into Operation | Route | Intermediate Stations |
|---|---|---|
| 14 December 2014 | Warszawa Wsch.– Gdynia Gł. | Iława Gł., Malbork, Tczew, Gdańsk Gł., Gdańsk Wrzeszcz, Gdańsk Oliwa, Sopot |
| Warszawa Wsch.– Kraków Gł. | Warszawa Centralna, Warszawa Zach. | |
| Warszawa Wsch.– Katowice | Warszawa Centralna, Warszawa Zach., Włoszczowa Północ, Sosnowiec Główny | |
| Warszawa Wsch.– Wrocław Gł. | Warszawa Centralna, Warszawa Zach., Częstochowa Stradom, Lubliniec, Opole Gł. | |
| 13 December 2015 | Warszawa Wsch.– Gdynia Gł. | Ciechanów *, Działdowo *, Iława Gł., Malbork, Tczew, Gdańsk Gł., Gdańsk Wrzeszcz, Gdańsk Oliwa, Sopot |
| Warszawa Wsch.– Kraków Gł. | Warszawa Centralna, Warszawa Zach. | |
| Warszawa Wsch.– Rzeszów Gł. | Warszawa Centralna, Warszawa Zach., Kraków Gł., Kraków Płaszów, Tarnów, Dębica | |
| Warszawa Wsch.– Wrocław Gł. | Warszawa Centralna, Warszawa Zach., Częstochowa Stradom, Lubliniec, Opole Gł. | |
| Warszawa Wsch.– Katowice | Warszawa Centralna, Warszawa Zach., Włoszczowa Północ, Sosnowiec Główny | |
| Warszawa Wsch.– Bielsko Biała | Warszawa Centralna, Warszawa Zach., Włoszczowa Północ, Zawiercie *, Sosnowiec Główny, Katowice, Tychy, Pszczyna, Czechowice Dziedzice | |
| Warszawa Wsch.– Gliwice | Warszawa Centralna, Warszawa Zach., Włoszczowa Północ, Zawiercie *, Sosnowiec Główny, Katowice, Zabrze | |
| 29 April 2016 | Warszawa Wsch.– Gdynia Gł. | Ciechanów *, Działdowo *, Iława Gł., Malbork, Tczew, Gdańsk Gł., Gdańsk Wrzeszcz, Gdańsk Oliwa, Sopot |
| Warszawa Wsch.– Kołobrzeg | Ciechanów *, Działdowo *, Iława Gł., Malbork, Tczew, Gdańsk Gł., Gdańsk Wrzeszcz, Gdańsk Oliwa, Sopot, Gdynia Gł., Lębork, Słupsk, Koszalin | |
| Warszawa Wsch.– Kraków Gł. | Warszawa Centralna, Warszawa Zach. | |
| Warszawa Wsch.– Rzeszów Gł. | Warszawa Centralna, Warszawa Zach., Kraków Gł., Kraków Płaszów, Bochnia **, Tarnów, Dębica, | |
| Warszawa Wsch.– Wrocław Gł. | Warszawa Centralna, Warszawa Zach., Częstochowa Stradom, Lubliniec, Opole Gł. | |
| Warszawa Wsch.– Jelenia Góra | Warszawa Centralna, Warszawa Zach., Częstochowa Stradom, Lubliniec, Opole Gł., Wrocław Gł., Wałbrzych Miasto | |
| Warszawa Wsch.– Katowice | Warszawa Centralna, Warszawa Zach., Włoszczowa Północ, Sosnowiec Główny | |
| Warszawa Wsch.– Bielsko-Biała | Warszawa Centralna, Warszawa Zach., Zawiercie *, Sosnowiec Główny, Katowice, Tychy, Pszczyna, Czechowice-Dziedzice | |
| Warszawa Wsch.– Gliwice | Warszawa Centralna, Warszawa Zach., Włoszczowa Północ, Zawiercie *, Sosnowiec Główny, Katowice, Zabrze |
| Route | Number of Train Pairs | Length |
|---|---|---|
| Warszawa–Kołobrzeg | 1 | 582 km |
| Warszawa–Gdynia | 11 * | 362 km |
| Warszawa–Bielsko-Biała | 1 | 360 km |
| Warszawa–Wrocław | 1 | 429 km |
| Warszawa–Kraków | 10 ** | 301 km |
| Warszawa–Rzeszów | 1 | 456 km |
| Warszawa–Jelenia Góra | - | 556 km |
| Warszawa–Gliwice | 3 | 332 km |
| Warszawa–Katowice | 4 *** | 308 km |
| Year * | Average Daily Mileage |
|---|---|
| 2015 | 17,120 km |
| 2016 | 21,310 km |
| 2017 | 19,865 km |
| 2018 | 19,337 km |
| 2019 | 20,330 km |
| 2020 | 14,078 km |
| Parameter | Value |
|---|---|
| Nominal power | 6 MW |
| Locomotive mass | 90 t |
| Mass of one wagon | 45 t |
| Number of wagons | 10 |
| Maximum speed | 200 km/h |
| Number of passengers | 450 |
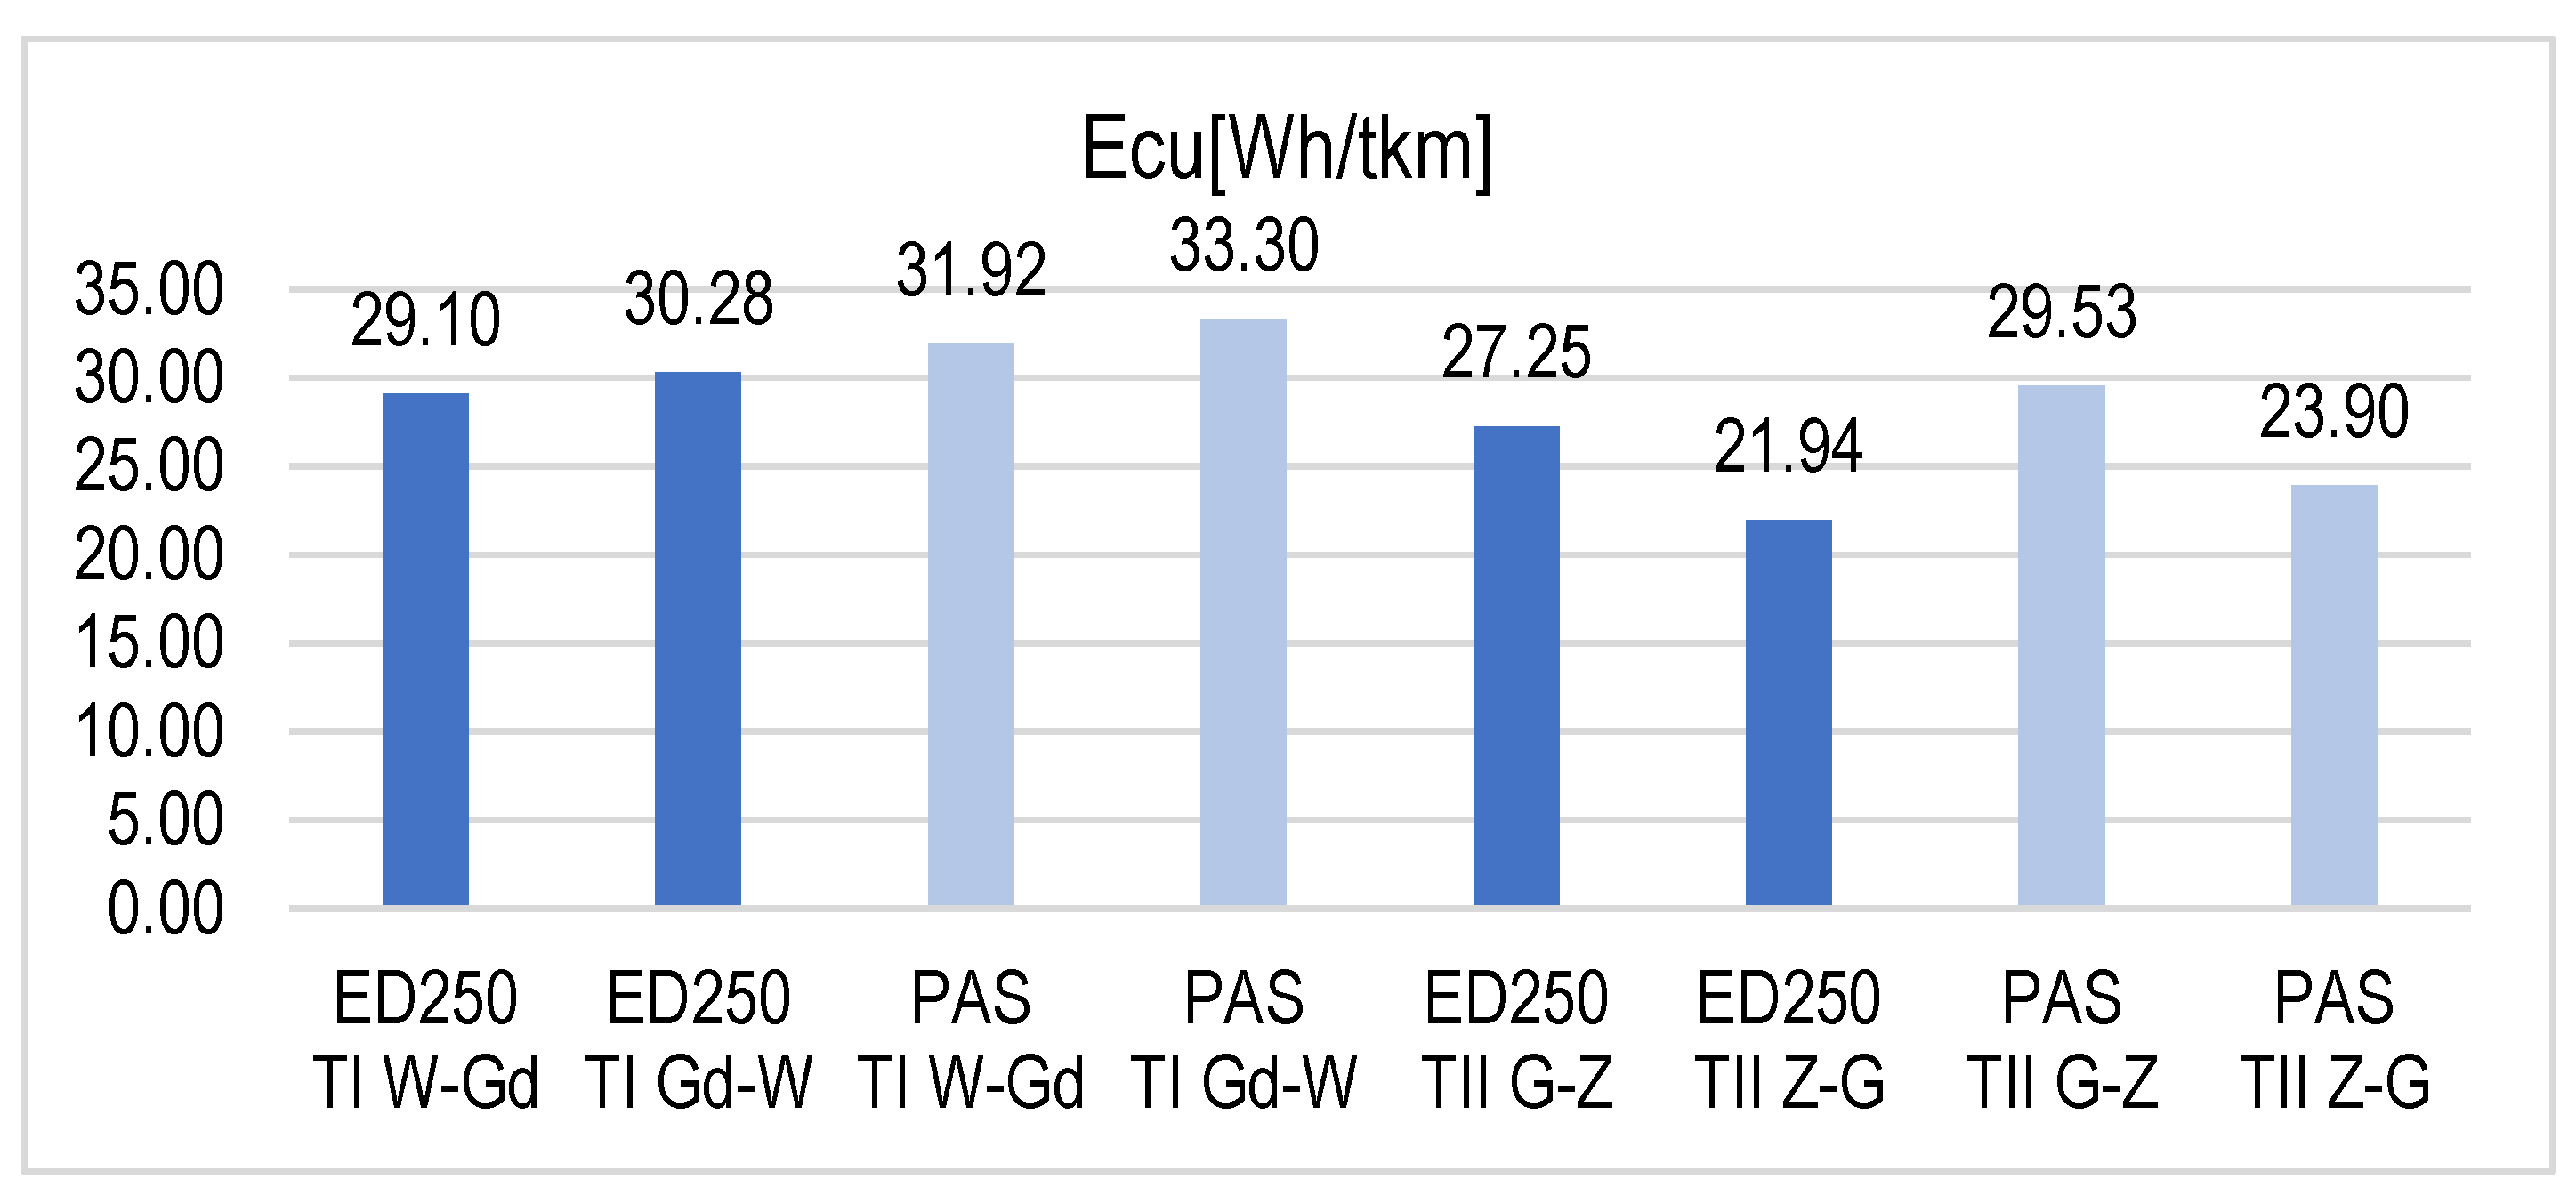
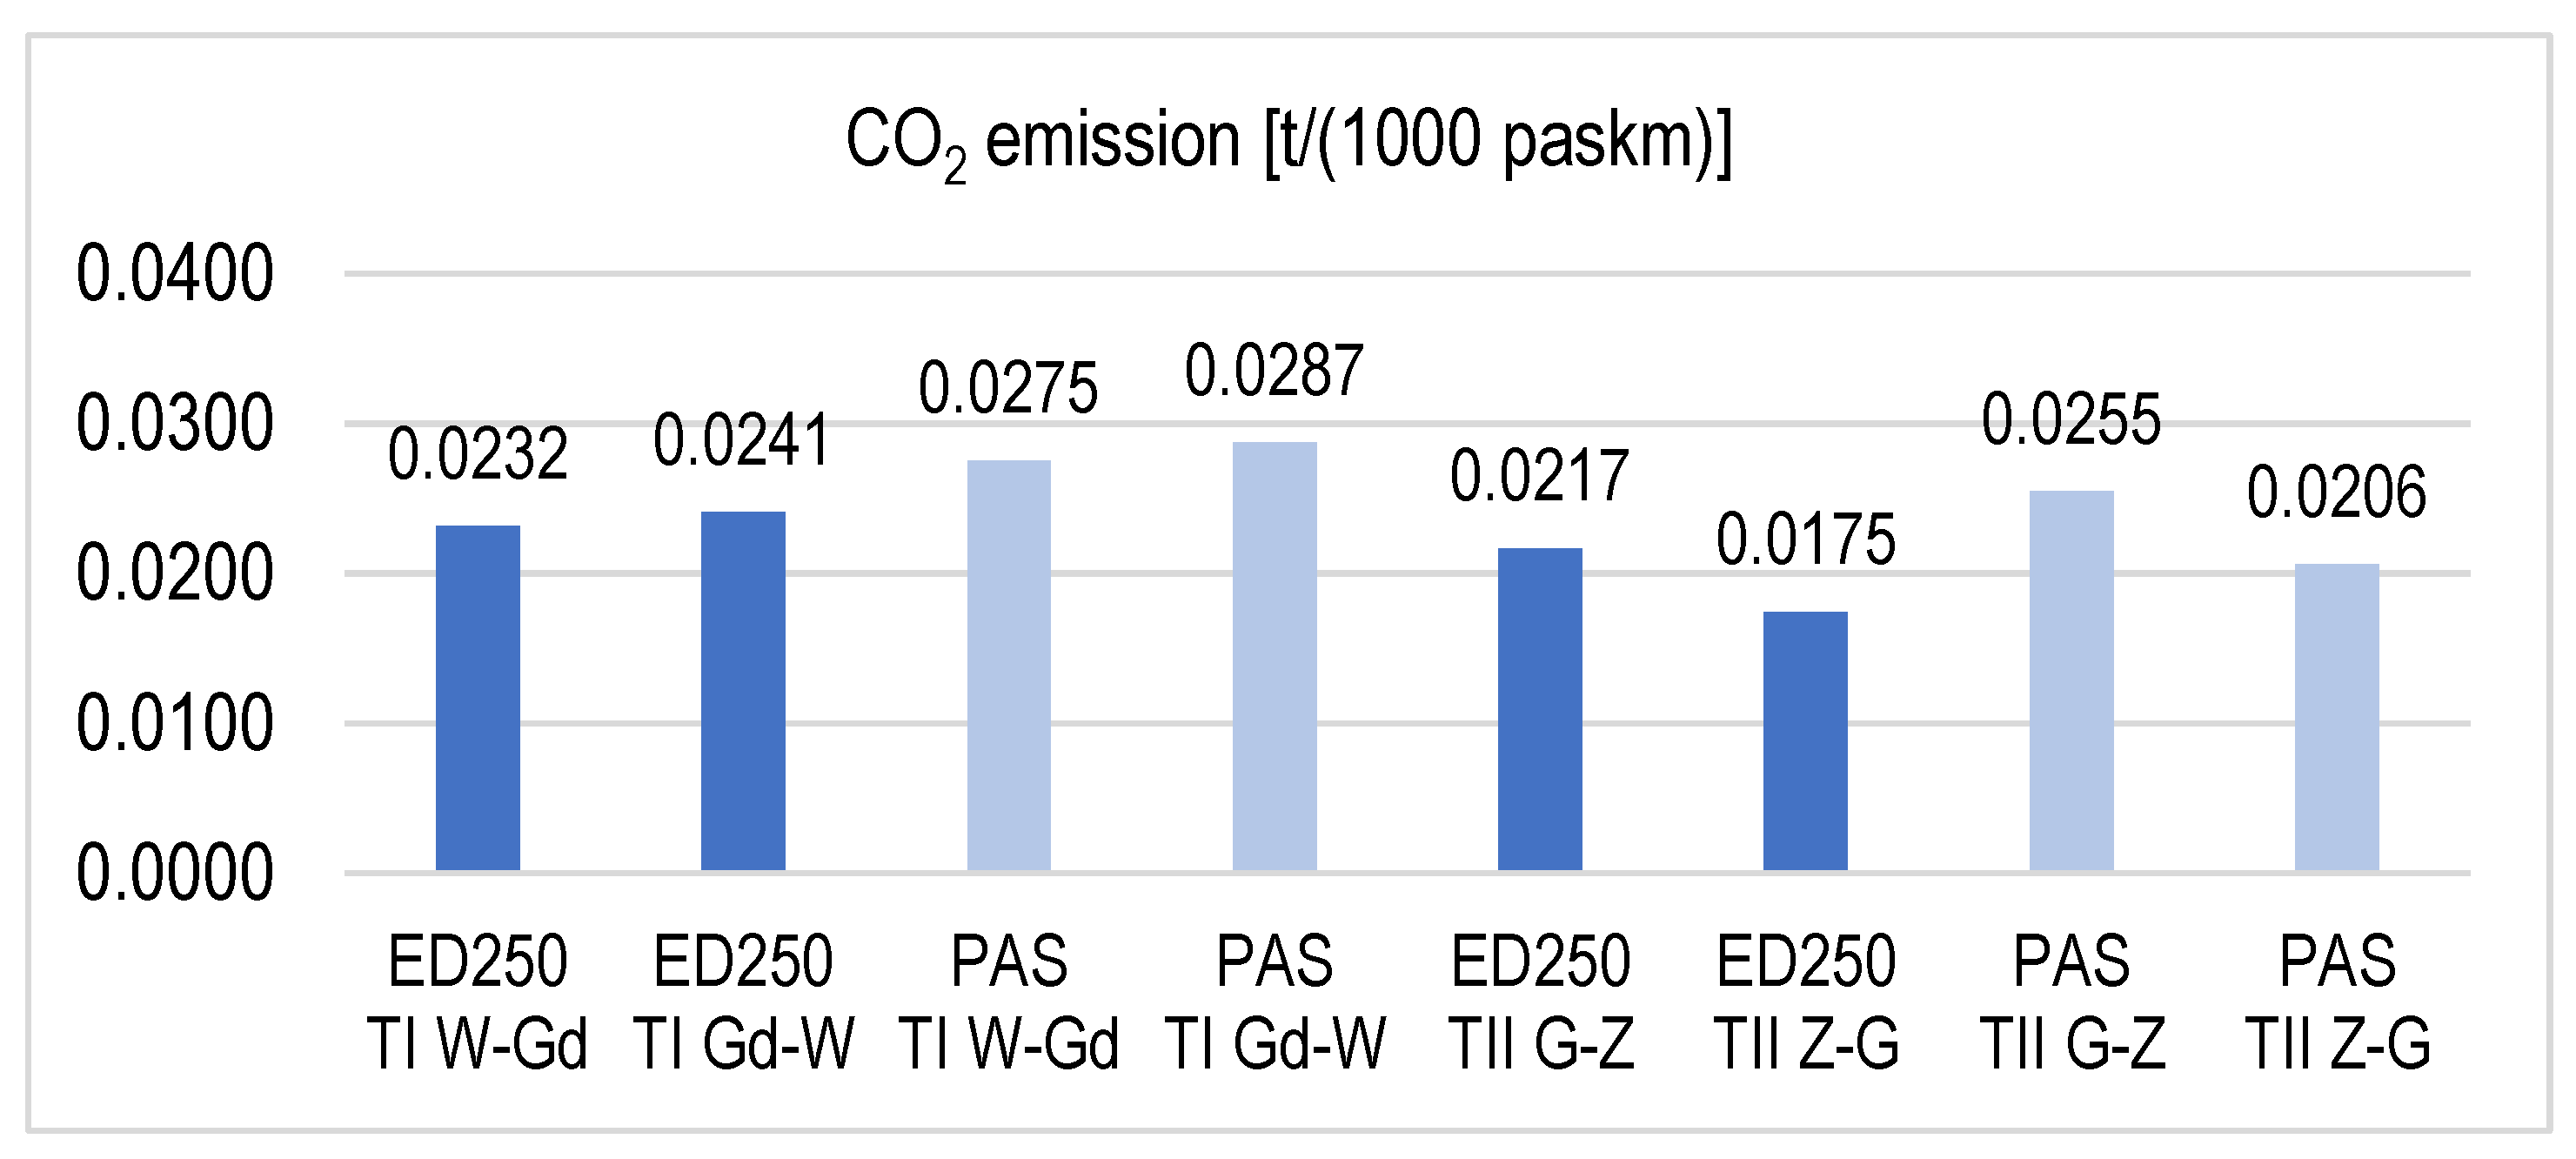
| Train | Direction | Seats | Mass [t] | l [km] | Vav [km] | Vavs [km/h] | Ec [kWh] | Ecu [kWh/km] | Ecrek [kWh] | RS [%] | Eup [kWh/1000 pas km] 100% | Eup [kWh/1000 pas km] 60% | Ecu [Wh/tkm] | CO2 Unit Emission [t/1 MWh] | CO2 Unit Emission [t/1000 pas km] |
|---|---|---|---|---|---|---|---|---|---|---|---|---|---|---|---|
| ED250 | TI W-Gd | 402 | 445 | 328.1 | 153.4 | 132.6 | 4249.15 | 12.95 | 3805.84 | 10.4 | 32.22 | 53.69 | 29.1 | 0.719 | 0.0232 |
| ED250 | TI Gd-W | 402 | 445 | 328.1 | 153.07 | 132 | 4421.03 | 13.47 | 3977.36 | 10 | 33.52 | 55.87 | 30.28 | 0.72 | 0.0241 |
| PAS | TI W-Gd | 450 | 540 | 328.1 | 152.31 | 131.5 | 5655.44 | 17.24 | 5319.55 | 5.9 | 38.3 | 63.84 | 31.92 | 0.721 | 0.0275 |
| PAS | TI Gd-W | 450 | 540 | 328.1 | 151.99 | 131.2 | 5900.25 | 17.98 | 5565.01 | 5.7 | 39.86 | 66.6 | 33.3 | 0.722 | 0.0287 |
| ED250 | TII G-Z | 402 | 445 | 224.05 | 179.36 | 179.4 | 2716.79 | 12.13 | 2606.07 | 4.1 | 30.16 | 50.27 | 27.25 | 0.723 | 0.0217 |
| ED250 | TII Z-G | 402 | 445 | 224.05 | 179.25 | 179.2 | 2187.48 | 9.76 | 2067.04 | 5.5 | 24.29 | 40.48 | 21.94 | 0.724 | 0.0175 |
| PAS | TII G-Z | 450 | 540 | 224.05 | 178.8 | 178.8 | 3573.11 | 15.95 | 3491.3 | 2.3 | 35.44 | 59.07 | 29.53 | 0.725 | 0.0255 |
| PAS | TII Z-G | 450 | 540 | 224.05 | 178.7 | 178.68 | 2891.54 | 12.91 | 2807.22 | 2.9 | 28.68 | 47.8 | 23.9 | 0.726 | 0.0206 |
Publisher’s Note: MDPI stays neutral with regard to jurisdictional claims in published maps and institutional affiliations. |
© 2022 by the authors. Licensee MDPI, Basel, Switzerland. This article is an open access article distributed under the terms and conditions of the Creative Commons Attribution (CC BY) license (https://creativecommons.org/licenses/by/4.0/).
Share and Cite
Pomykala, A.; Szelag, A. Reduction of Power Consumption and CO2 Emissions as a Result of Putting into Service High-Speed Trains: Polish Case. Energies 2022, 15, 4206. https://doi.org/10.3390/en15124206
Pomykala A, Szelag A. Reduction of Power Consumption and CO2 Emissions as a Result of Putting into Service High-Speed Trains: Polish Case. Energies. 2022; 15(12):4206. https://doi.org/10.3390/en15124206
Chicago/Turabian StylePomykala, Agata, and Adam Szelag. 2022. "Reduction of Power Consumption and CO2 Emissions as a Result of Putting into Service High-Speed Trains: Polish Case" Energies 15, no. 12: 4206. https://doi.org/10.3390/en15124206
APA StylePomykala, A., & Szelag, A. (2022). Reduction of Power Consumption and CO2 Emissions as a Result of Putting into Service High-Speed Trains: Polish Case. Energies, 15(12), 4206. https://doi.org/10.3390/en15124206