1. Introduction
1.1. Motivation and Incitement
The information technology (IT) sector involves a huge energy consumption, and there is a desire to reduce its environmental footprint. In 2010, it was estimated that data centers alone were responsible for 1.5% of the worlds total electricity consumption [
1], and as the demand for data center services is increasing, so is the power consumption [
1,
2]. To handle the increasing demand for power in data centers, there is a need for sustainable, smart solutions on utilizing renewable energy sources, and on how to efficiently handle the increasing workload these data centers manage every day [
3,
4]. Renewable energy sources (RES) are making their way into the energy market at a rapid pace [
5]. While these are good news with regard to CO
emissions and sustainability, there are challenges with integrating these highly fluctuating power sources into the energy grid, and some renewable power is wasted. These challenges pose an opportunity for the information-technology industry. If this wasted power could be utilized in the power-hungry data centers, this would benefit both the power utility companies, and the data centers. In addition, it could help stabilize the power grid, and contribute to reduce CO
-emissions [
6].
Globally, the power system today is largely based on non-renewable energy sources. This energy production is stable, adjustable and predictable, which is essential in current data-center operations, where continuous operation is demanded, and where a total power outage could be disastrous. Instead, RESs such as wind and solar, are fluctuating and less predictable. To be able to utilize this intermittent energy in data centers, either a certain amount of energy storage needs to be accessible [
7], or the methods of how workloads are handled in the data center need to be addressed. Previous studies on the subject have either focused on using energy storage to handle the fluctuating energy supply [
8], or on certain workload types [
9,
10], or have had either no workload prediction [
3,
9,
11,
12], or prediction only of the overall workload [
8,
13].
In this work, a neural network is used to predict the CPU utilization and duration of individual tasks. The prediction of task usage is utilized to pack the tasks into as few machines as possible, thereby reducing the number of machines running with low utilization.
1.2. Literature Review
There have been many studies on improving the efficiency and sustainability of data centers, with different foci on approaches and targets [
14,
15,
16]. In this section, we shall review some representative research studies that investigate the usage of renewable energy sources in data centers. One way to utilize more renewable energy is to have geographically distributed data centers handle different amounts of the same workload, depending on where renewable energy is available [
17]. Gao et al. present a request-routing framework for large-scale internet application providers that routes the requests to geographically different data centers based on a trade-off between access delay, cost of electricity and carbon footprint. They find that their proposed framework can reduce the carbon footprint by approximately 10%, without increasing the electricity cost or access delay [
17].
Another way to utilize an intermittent power supply is to adapt the demand to the supply of energy, creating so-called energy-agile workloads, that shape the workload to follow a variable energy supply. Yang and Chien presented a method using stranded power stranded power is excess produced energy that, for some reason, cannot be put into the energy grid, and would otherwise be wasted) to process high-performance computing (HPC) tasks [
18]. In the latter work, the servers that handle the HPC workload are only turned on when stranded power is available. These servers are separate from the main compute cluster, and are connected to one or more wind turbines. They are also connected to the main data center, which, in turn, is connected to, and powered by, the normal electricity grid. The study shows promising results for exploiting excess energy (with an availability of stranded wind power up to 80% of the time, similar to this work), by creating these energy-agile loads. Their work is similar to the scheduler presented in this paper with respect to the workload scheduler reacting to available renewable power, but differs in that they look at a pure HPC workload, without predicting workload demand in advance.
Goiri et al. [
8] proposed a system applied to an actual small-scale data center connected to solar panels, with the option to store excess power in batteries, or sell it back to the grid by net metering (net metering is a system where excess renewable power is transferred into the grid, and the consumer is compensated. In this way, the consumer only pays for the net energy consumption from the grid). The goal was to investigate how solar power could reduce energy costs in the data center, by testing the system on one deferrable and one nondeferrable workload, both with and without batteries. As pointed out by Krioukov et al. [
7], the use of energy-agile loads could be more efficient than using battery storage to utilize excess renewable power. Their study estimates that 200 tons of lead-acid batteries would be needed to achieve the same renewable utilization that was achieved with their energy-agile loads [
7].
In [
19], the authors present an optimization approach based on swarm intelligence in order to consolidate virtual machines (VMs) in a data center. The approach is shown to scale well and is adequate to heterogeneous cloud data centers where the physical characteristics and configuration of the underlying physical machines might differ from one machine to another. Very few approaches in the literature consider energy minimization in data centers based on the characteristics of the tasks. In this sense, most of the work in the literature ignores the characteristics of the task and its duration and merely focuses on scheduling VMs or containers [
20]. Our work is thus among the few works in the literature focusing on placing tasks not only based on predicted CPU consumption but also duration. A notable work is that of Panneerselvam et al. [
21], who propose using a straggler classification method in order to predict the right amount of resources required by straggler tasks within a given job, in order to conserve energy. Furthermore, most of the works in the literature only focus on predicting the energy production or on the resource utilization but studies that both predict energy and resource utilization at the same time as a part of the same approach are scarce. This leads to complicated types of scheduling algorithms that deal with different sources of uncertainties. In this article, we tried to design simplistic algorithms with clear logic that might pave the way towards more research in this type of scheduling problem, with uncertainties related both to energy prediction and resource utilization.
1.3. Contributions and Paper Organization
The main goal of this work is to identify how a scheduler can best place tasks on machines to reduce non-renewable energy consumption by deferring tasks with low latency sensitivity to periods with predicted available wind energy. To achieve this goal, this paper presents the following main contributions:
We introduce a model for a latency-aware workload scheduler to be used in data centers handling heterogeneous workloads, connected to a renewable energy source. The scheduler predicts individual task resource usage over time before distributing the tasks on the servers based on their time restrictions/latency sensitivity. This shapes the workload to meet the supply of renewable energy.
Our scheduler uses two level predictions: (1) with respect to both task resource CPU usage and duration, it uses a feed forward neural network and (2) with respect to wind-power-energy availability, it uses regression based support vector machines. To the best of our knowledge, this is the first work in the literature that performs task placement based on the joint predictions of CPU usage, task duration as well as wind-energy production.
The scheduler is tested and evaluated on a set of machines, with workload traces from a real data center, and with real energy-production data from a wind turbine over a one month period.
We evaluate the developed scheduler by comparing it to clairvoyant versions of the scheduler, i.e., ones that know in advance what the resource usage of the tasks will be. We show that, with good prediction methods, the efficiency of the data center could increase.
The power-aware prediction-based scheduler achieves a reduction in energy usage in the periods with low wind-power availability 93% of the time, compared to the baseline clairvoyant version of the scheduler. The scheduler also increases the average utilization on the active machines, leading to a higher overall efficiency.
The rest of this paper is structured as follows.
Section 1.2 introduces the related work.
Section 2 presents the system model and key concepts.
Section 3 delves into the algorithms for the suggested workload scheduler.
Section 4 describes the data and the processing of said data for the work.
Section 5 describes the workload and wind-power prediction used for the scheduler.
Section 6 reports the results from the experiments, and
Section 7 concludes the paper.
2. System Model
In a data center, a workload scheduler determines how tasks and jobs are distributed on the servers. It can have a variety of different policies to be taken into account, from cost awareness, security and service-level agreements, to electricity and cooling awareness. In this work, we focus on the energy awareness of the workload scheduler.
Here, we present a power-aware workload scheduler that is tested on a smallscale data center (100/500 machines).
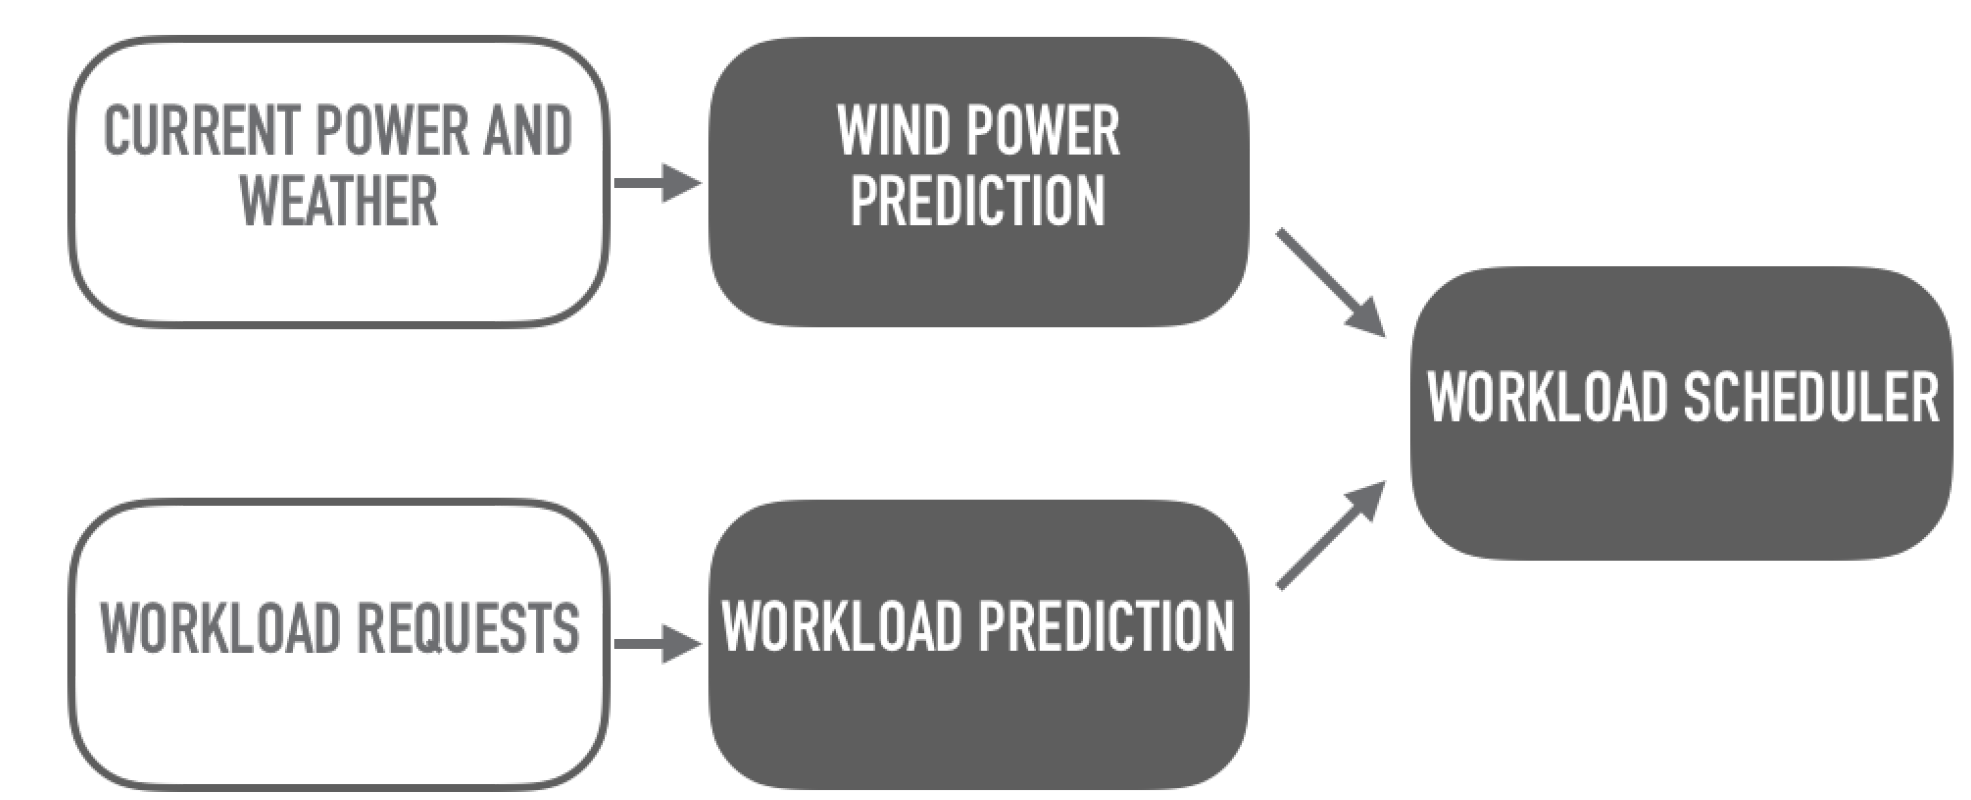
The scheduler, as illustrated in
Figure 1, is dependent on a method for predicting generated renewable energy, and a method for predicting workload resource usage. These predictions are used by the scheduler to determine how to place the tasks on machines. The amount of available wind energy is predicted using a support vector machine for regression (SVR), and is used to determine the number of machines that can be powered by the predicted energy. Then, the task requests are placed on machines based on the resource availability (remaining CPU capacity) on the machines, and on the latency sensitivity of the tasks. The latency sensitivity is a measure of how sensitive the task is to time delays, and in this work this is indicated by a number between 0 and 3, where 3 is the most latency sensitive. Data centers handle
workloads consisting of a variety of different jobs, which again consist of one or more tasks. Different data centers handle different workloads; some only deal with HPC workloads, for example, data centers at scientific institutions. Other commercial data centers handle a variety of different computing tasks, including tasks for web services and other enterprise tasks [
22]. The tasks can have different constraints and dependencies for hardware and software on machines, and have different priorities based on their time sensitivity and importance (revenue generating vs. non-revenue generating, essential for web services vs. non-essential maintenance jobs). There is no established classification of data-center workloads, but in this work the data center workload is separated into three different groups based on latency sensitivity: high-performance-computing (HPC) workloads, enterprise workloads and interactive workloads. These groups have low, medium, and high latency sensitivity, respectively.
Three different versions of the workload scheduler are presented here. Two of these are clairvoyant with respect to task resource usage (CPU utilization), meaning that the scheduler knows in advance how any task will utilize resources during its processing. The purpose of the two clairvoyant algorithms is to establish a best-case scenario, where each task usage is known at the time of placement. This means that the scheduler is guaranteed to not oversubscribe the machines at any time, and thus creates an optimal placement strategy. The results from these schedulers are used to evaluate the prediction-based scheduler. One of the clairvoyant versions takes the availability of renewable power into account when placing the low-latency-sensitive tasks, while the other takes no power into consideration, but attempts only to pack the tasks into as few machines as possible. The last version is non-clairvoyant with respect to both task usage and power availability, and uses a feed forward neural network (FFNN) to predict task CPU usage and duration, which then is used to determine the placement of tasks on machines. The number of available machines at each time is predicted by a support vector machine for regression (SVR).
3. Workload Scheduling Algorithm
The goal of the scheduler is to increase the amount of renewable energy used, and to increase the efficiency of the data center overall. This is achieved using two different approaches. First, the scheduler creates an energy-agile workload, by separating the tasks into categories based on latency sensitivity. In this manner, the least latency sensitive tasks can be postponed to when little or no renewable energy is available. Second, the scheduler predicts, on arrival, what resources a task will use, and for how long. The idea is that, by doing so, the tasks can be placed on fewer machines, since less overhead is needed (in data centers, overhead is the excess capacity on the servers. The servers spend most of the time in the 10–50% utilization range ([
23], p. 75)). With fewer machines in operation, we can utilize a low-power state on the rest of the machines, leading to a higher efficiency overall. In an ideal world, the scheduler would know in advance how much energy would be available at any time, and the quantity of resources each task would use at any point during execution. In this case, the scheduler could place tasks on as few machines as possible, and still make sure that no machine was ever running over capacity. This is the approach taken by the two clairvoyant schedulers, and presents the best possible distribution of tasks. Since this is not the case in reality, the last presented scheduler attempts to achieve an optimal result by using predictions. The results from the non-clairvoyant algorithm are compared to the clairvoyant algorithms, in order to evaluate its performance.
Real-world trace data from a Google data center are used for the experiments in this work [
24]. No considerations other than CPU usage are taken into account when placing a task on a machine. For the sake of simplicity, we suppose that the bottleneck resource is the CPU capacity, which is a common assumption in the literature [
25,
26]. Furthermore, according to the adopted power model in this paper presented in
Section 3.4, the CPU usage is the most central factor for estimating the energy consumption of a server.
The goal of the workload scheduler is to use as much renewable energy as possible, while still meeting time restrictions. The tasks marked as highly latency sensitive will always run on arrival, while the tasks that are less time-sensitive, are free to defer to a later time.
We first develop a clairvoyant baseline algorithm that attempts to fit the tasks into as few machines as possible, in order to reduce idle and low utilization on machines, thereby increasing the efficiency of the data center. This algorithm presents the optimal case for task placement without energy considerations. Then, we expand the scheduler to be power-aware, so that energy considerations are made when placing the lower latency sensitive tasks. In this way, we create an energy-agile load that follows the supply of renewable energy while still trying to pack the tasks into as few machines as possible. This algorithm presents the optimal case for task placement with energy considerations. In the non-clairvoyant version of the scheduler, we introduce a mechanism for predicting a task’s usage and duration, in order to deal with the fact that, in real world scenarios, the usage pattern is not known to the scheduler in advance.
3.1. Clairvoyant Baseline (CB) Algorithm
Algorithm 1 describes the Clairvoyant Baseline (CB) scheduler, and is the basis for the following schedulers as well. The algorithm iterates over the real trace from a Google data center in 5 min increments [
24]. For each 5 min interval, the tasks are separated into three different groups based on latency sensitivity (high (scheduling class 2 and 3), medium (scheduling class 1) and low (scheduling class 0)).
| Algorithm 1: CB scheduler algorithm. |
![Energies 15 04469 i001]() |
The high latency sensitive tasks are placed first, on one of the available machines (maximum number of machines available (100/500)). In this CB scheduler, detailed information about the tasks’ CPU usage over time is known at the time of the task’s arrival. The tasks are placed using a first-fit bin-packing algorithm [
27], where the task is placed on the first available machine that can fit the task for all intervals of the task duration, as described in Algorithm 2. This algorithm takes no energy considerations when placing tasks. Please note that max machines is 100/500 for the baseline without power consideration.
| Algorithm 2: Place task. |
![Energies 15 04469 i002]() |
3.2. Clairvoyant Power-Aware (CP-A) Algorithm
The second algorithm, denoted as the Clairvoyant Power-Aware (CP-A) algorithm, works in the same manner as the CB algorithm described above, with the exception of taking wind-energy production prediction into account when placing the lower latency sensitive tasks. CP-A uses the predicted power availability of 3 h. In other words, the only difference compared to the CB scheduler is that the maximum number of machines for the low-scheduling class tasks is determined based on the predicted available energy. When power is taken into account, max machines for low latency sensitive tasks is determined by the availability of renewable machines. For high-priority tasks, max machines is always 100/500. In this article, we distinguish between the maximum machines available for high latency sensitive tasks and the number of machines available for low-priority tasks. For the high latency sensitive tasks, the max number of machines that can be powered on based on brown energy is fixed. However, for low latency tasks, we can obtain the lowest bound on the number of machines powered with wind energy within three hours and use it as a lower bound or guarantee for scheduling the priority tasks and this lower bound is used as part of Algorithm 2 for task placement. For the sake of uniform notation, we abuse notation and use “max machines” in the Algorithm 2 but, depending on the priority of the task, this number has a different meaning.
The number of machines that can be powered by wind energy for the duration of the task is calculated. If this number is smaller than the currently running machines, the placement of all low latency sensitive tasks is postponed to the next time interval. Otherwise, the energy availability is checked for each interval the task lasts. If at some point of the task duration, there are not enough available renewable machines to process the task, the task is deferred to the next interval, at which a new attempt of placing the task will be made.
3.3. Non-Clairvoyant Power-Aware (N-CP-A) Algorithm
In reality, the scheduler is non-clairvoyant: it will not know in advance how long a task will run, or how it will utilize resources over time. To place the tasks with the proposed workload scheduler, we therefore need a prediction of CPU usage and the duration of the task. This information is used by the Non-Clairvoyant Power-Aware (N-CP-A) scheduler to attempt to fit the tasks into as few machines as possible.
3.3.1. Neural Network for Prediction of Task Usage
We use a feed forward neural network (FFNN) for prediction. A neural network was chosen due to its ability to solve regression problems [
28]. In a real-world application, it is also a viable method, since data centers often have a large amount of data to train the network to obtain accurate predictions. Here, a single prediction of each task’s mean CPU usage, and a prediction of the task duration were made.
3.3.2. Placement of Tasks Based on Predicted Values
The N-CP-A algorithm places tasks in the same manner as the CP-A algorithm described in the previous section. The only difference is that the predicted mean CPU usage and duration are used when placing a task, instead of the real-world values, as described in Algorithm 3. It is worth mentioning that we did not impose any assumption on the CPU usage distribution over the predicted duration. We use neural networks for predicting CPU usage which output a single value and not a distribution. Results from prediction are given in the master’s thesis of the first author [
29], where graphs are shown in the thesis for prediction and true values in Figures 4.16 and 4.17, respectively. The bin-packing problem, in this case used to place the resources, is simply a deterministic one. Another alternative is to formulate the optimization problem within the framework of linear integer programming [
30] or even heuristics, such as genetic algorithms [
31]. However, it would have been possible to place the tasks based on the distribution of the usage and in this case one needs to use a stochastic bin-packing algorithm [
32,
33]. Some other works resort to the predicted instantaneous CPU utilization such as [
34] and even to stochastic model predictive control theory such as carried out in [
35].
The max machines in line 3 denotes the maximum value of the minimum number of machines running high latency sensitive tasks for the duration of the task, and of the minimum number of predicted renewable machines 3 h ahead. When a task is placed, the predicted CPU usage of the task is checked against the
current utilization on the machines. If the placement of the task on this machine leads to an utilization greater than 0.8 for the current interval, we attempt to place the task on another machine. The maximum value of 0.8 is used instead of 1, as a buffer, considering that the prediction method does not reflect the variation in CPU usage over time, and could in reality be greater than the predicted value at any interval of the duration. If the resulting utilization is less than 0.8, an additional check is made, to see if the
predicted utilization (the predicted utilization is the sum of the predicted CPU usage of the tasks that have previously been scheduled to run on the machine at this time) on the machine exceeds 1 at any time of the task duration. If this is the case, we move on to the next machine. As with the other algorithms, if we exhaust all our resources and the task does not fit on any machine for this interval, the task is deferred. Furthermore, in line 7, for high-priority tasks, the task will be placed on the machine with the lowest current utilization instead of being deferred. All algorithms proposed in this paper run in linear time.
| Algorithm 3: Place task (based on predicted usage) in N-CP-A scheduler. |
![Energies 15 04469 i003]() |
3.4. Power Calculations
According to [
3,
21,
36,
37], the power consumption of a server can be represented as a linear relationship of CPU utilization as in (
1), where
u is CPU utilization on the machine,
is the power draw at maximum utilization, and
is the idle power draw of the server. To increase the readability, we summarize the nomenclature in
Table 1 as well as a list of abbreviations in
Table 2. This linear power model is one of the most widely used power models in the literature and yields good accuracy despite its simplicity [
37].
The linear power model is based on the assumption that the CPU usage is the dominant component in the power usage of a server and thus memory usage, network activity or other factors could be ignored. We assume that all machines have the same hardware, and set the maximum CPU utilization to 1.
and
are set to 500 W and 300 W, respectively. This is based on the assumption that the servers are of the mid-range type, from 2011 (we chose values from 2011, due to the trace being from May 2011). The estimate is based on Koomey’s survey from 2007, where he found the mid-range server with the highest market share in 2005 had a typical power of 495 W [
38]. The typical draw is then divided by 0.66 to obtain a maximum power draw of 750 W [
38]. To adjust for the efficiency increase in hardware from 2005 to 2011, the maximum power draw is set to an educated guess of 500 W. The power consumption of idle machines is then set to 60% of the maximum power draw [
39], at 300 watts.
Power usage effectiveness (
) is a metric often used to measure the efficiency of data centers [
40], by comparing total power consumption with IT power consumption. Based on information about
, the power consumption of the center is calculated from (
2)
where
is the total consumed power for all
N machines, and the
is set to 2. This
value is typical [
41], considering that, in 2011, the self-reported
of the participating data centers was, on average, 1.89. Since this value is self-reported, and therefore most likely based on optimal running conditions and best performance values ([
23], p. 69), this was rounded up.
To address the high power consumption of idle machines, a secondary low-power state is introduced, which will give the servers running no tasks the option to “shut down”, while still being available. In this state, the server can wake up and start processing quickly if new processing tasks arrive [
39]. In this “nap”-state, the servers consume 10 W [
39].
4. Workload Trace and Data Processing
Google data-center workload trace. The workload trace used in the experiments is from one of Google’s data centers [
24]. The original trace contains detailed information about the workload on a cluster of 12,000+ machines, for the month of May 2011. Although the trace is highly obscured and there is no way to know what the individual jobs and tasks consist of, the trace includes information about latency sensitivity and priority, which can be used to divide the workload into separate categories.
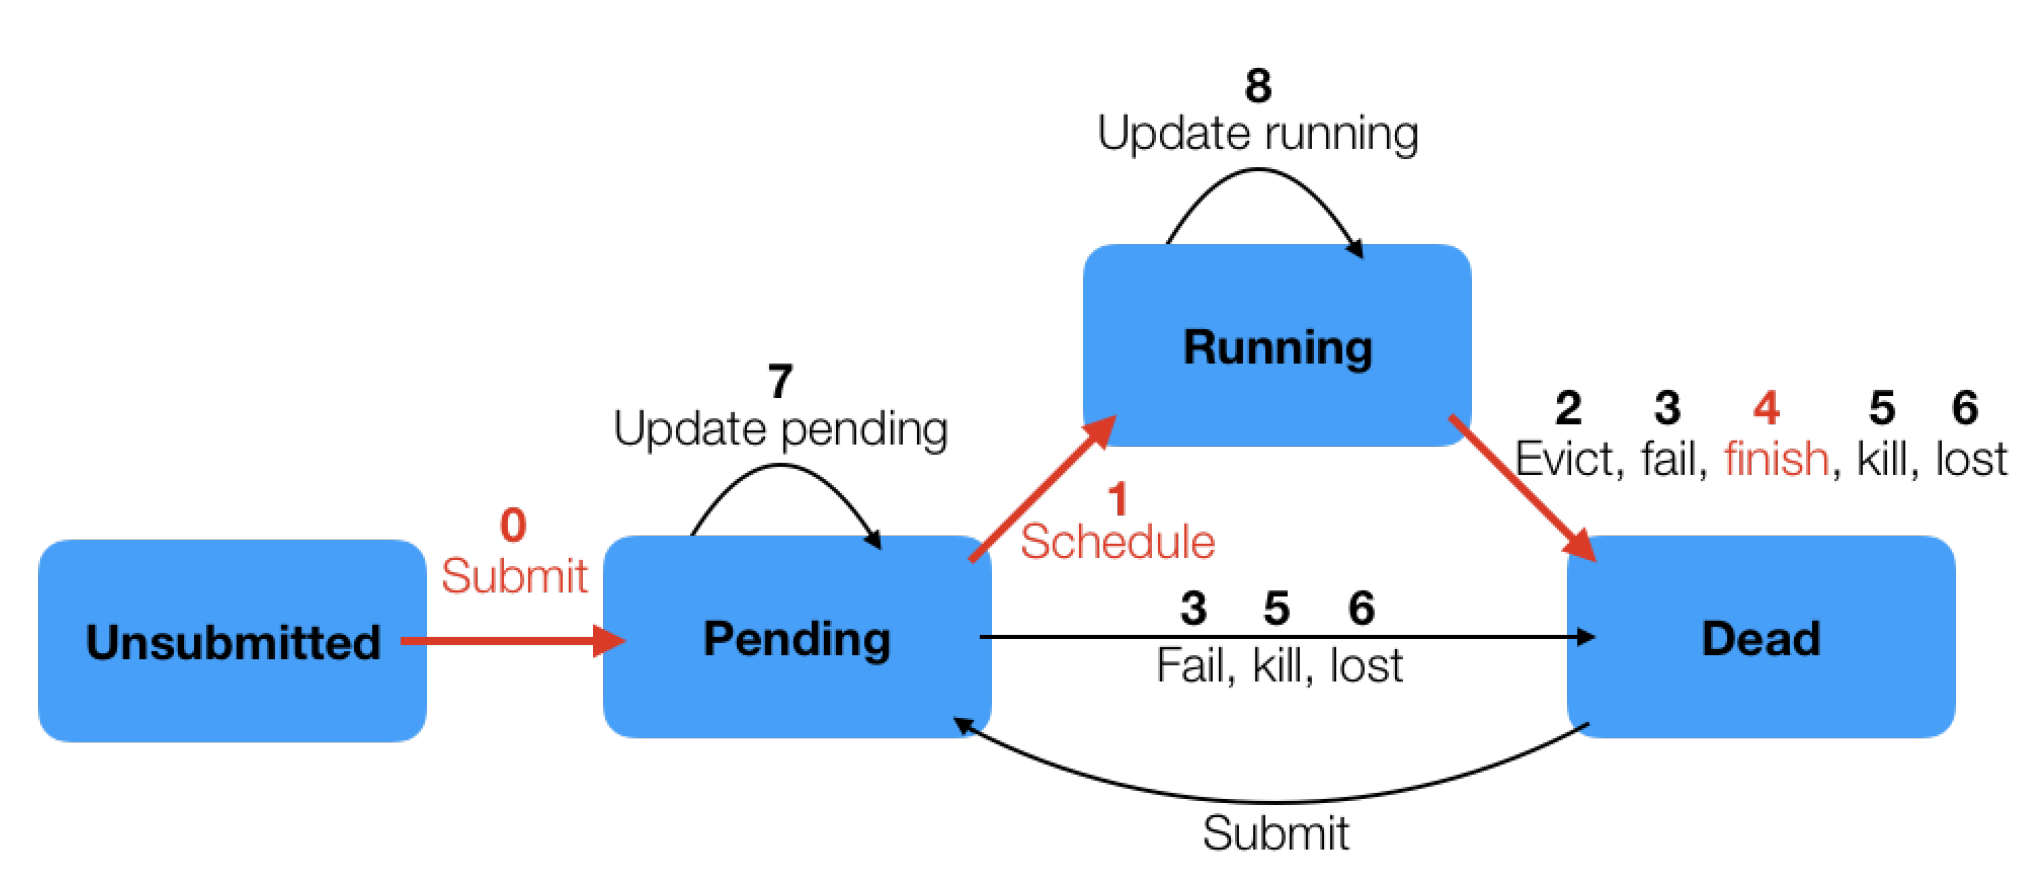
The trace includes detailed information about the task on arrival, with a given priority, latency sensitivity and resource requests (for memory and CPU). The trace data also contains detailed information about how each task used resources. For each 5 min interval a task ran, there is an entry with the mean CPU usage rate for the interval, along with other information. In our experiments, it is assumed that the tasks consume the mean CPU usage rate for the whole 5 min interval. A task can have multiple events over its lifetime. The different events are presented in
Figure 2.
Preparation of smaller samples. For our experiments, two subsets of 100 and 500 random machines were selected (all chosen machines ran undisturbed for the whole trace period, with no maintenance stops or otherwise), and the corresponding workload trace from these machines was extracted. These traces were named the “unaltered trace”. The unaltered trace contains tasks with multiple entries, with
all task state transitions included (see
Figure 2). This creates some exceptions in the task usage table, due to the evicted, failed, killed, or lost tasks being submitted multiple times. Without loss of generality, we ignore those exceptions and a secondary “custom trace” containing only tasks following the “optimal” (red/bold) path in
Figure 2 was created. None of these tasks were evicted, failed, killed, or lost at any time. For the 100 machines, this trace consists of the same number of
submitted tasks as in the unaltered trace, leading to a greater number of overall tasks compared to the unaltered trace, while for the trace simulating 500 machines, the custom trace contains the same number of
unique tasks, leading to overall fewer tasks than the unaltered trace for the same number of machines.
5. Prediction of Workload and Wind Power
Neural network for individual task usage prediction. In the N-CP-A algorithm, a feed forward neural network is used to predict the mean CPU usage of a task and the duration of a task (total number of 5 min intervals) [
29].
The network consists of six layers: an input layer, four hidden layers and an output layer. The input layer consists of seven nodes (for the high latency sensitive tasks, the input to the network has eight nodes, including the scheduling class), which take the input vector. This vector has information about the task, gathered from the task events table. The inputs are priority, event type, scheduling class (only for the high latency sensitive tasks), user ID, time of day, day of week and job ID. The user IDs are given individual integer values in advance.
Before the values are fed to the network, they are normalized by (
3)
where
X is the original input value, and
and
are the minimum and maximum instances of all values for this feature, respectively. There are individual predictors for CPU usage and duration for each workload group. The predictors are trained on 150,000 samples each. These samples are gathered from all tasks that ran optimally. The target CPU values are calculated by taking the average of the mean CPU utilization for all 5-min intervals, and the target duration is the number of 5-min intervals.
The hidden layers have 250, 150, 100 and 50 nodes between the input and output layers. All layers use the ReLU activation function [
42], and the network is trained using the Adam optimizer, with the default parameter values [
43]. This prediction method works well for the prediction of duration.
Wind-power predictions. A support vector machine for regression (SVR) is used for wind-power prediction [
29]. The input features to the regression model are the current wind speed and power output, and the SVR is trained on data from 11 months back in time. Power predictions are made in 10-min intervals, for 10 min to 3 h ahead. The SVR takes current power production and observed wind energy and uses them to predict the production in the future. Separate models are used for different time steps ahead.
6. Results
An overview of the main results is presented in
Table 3. The scheduler was tested on two different workload traces, one consisting of 100 machines, and one with 500 machines. The following results are from the larger sample. All trends were similar for the smaller sample.
6.1. Original Trace Load and Energy Consumption
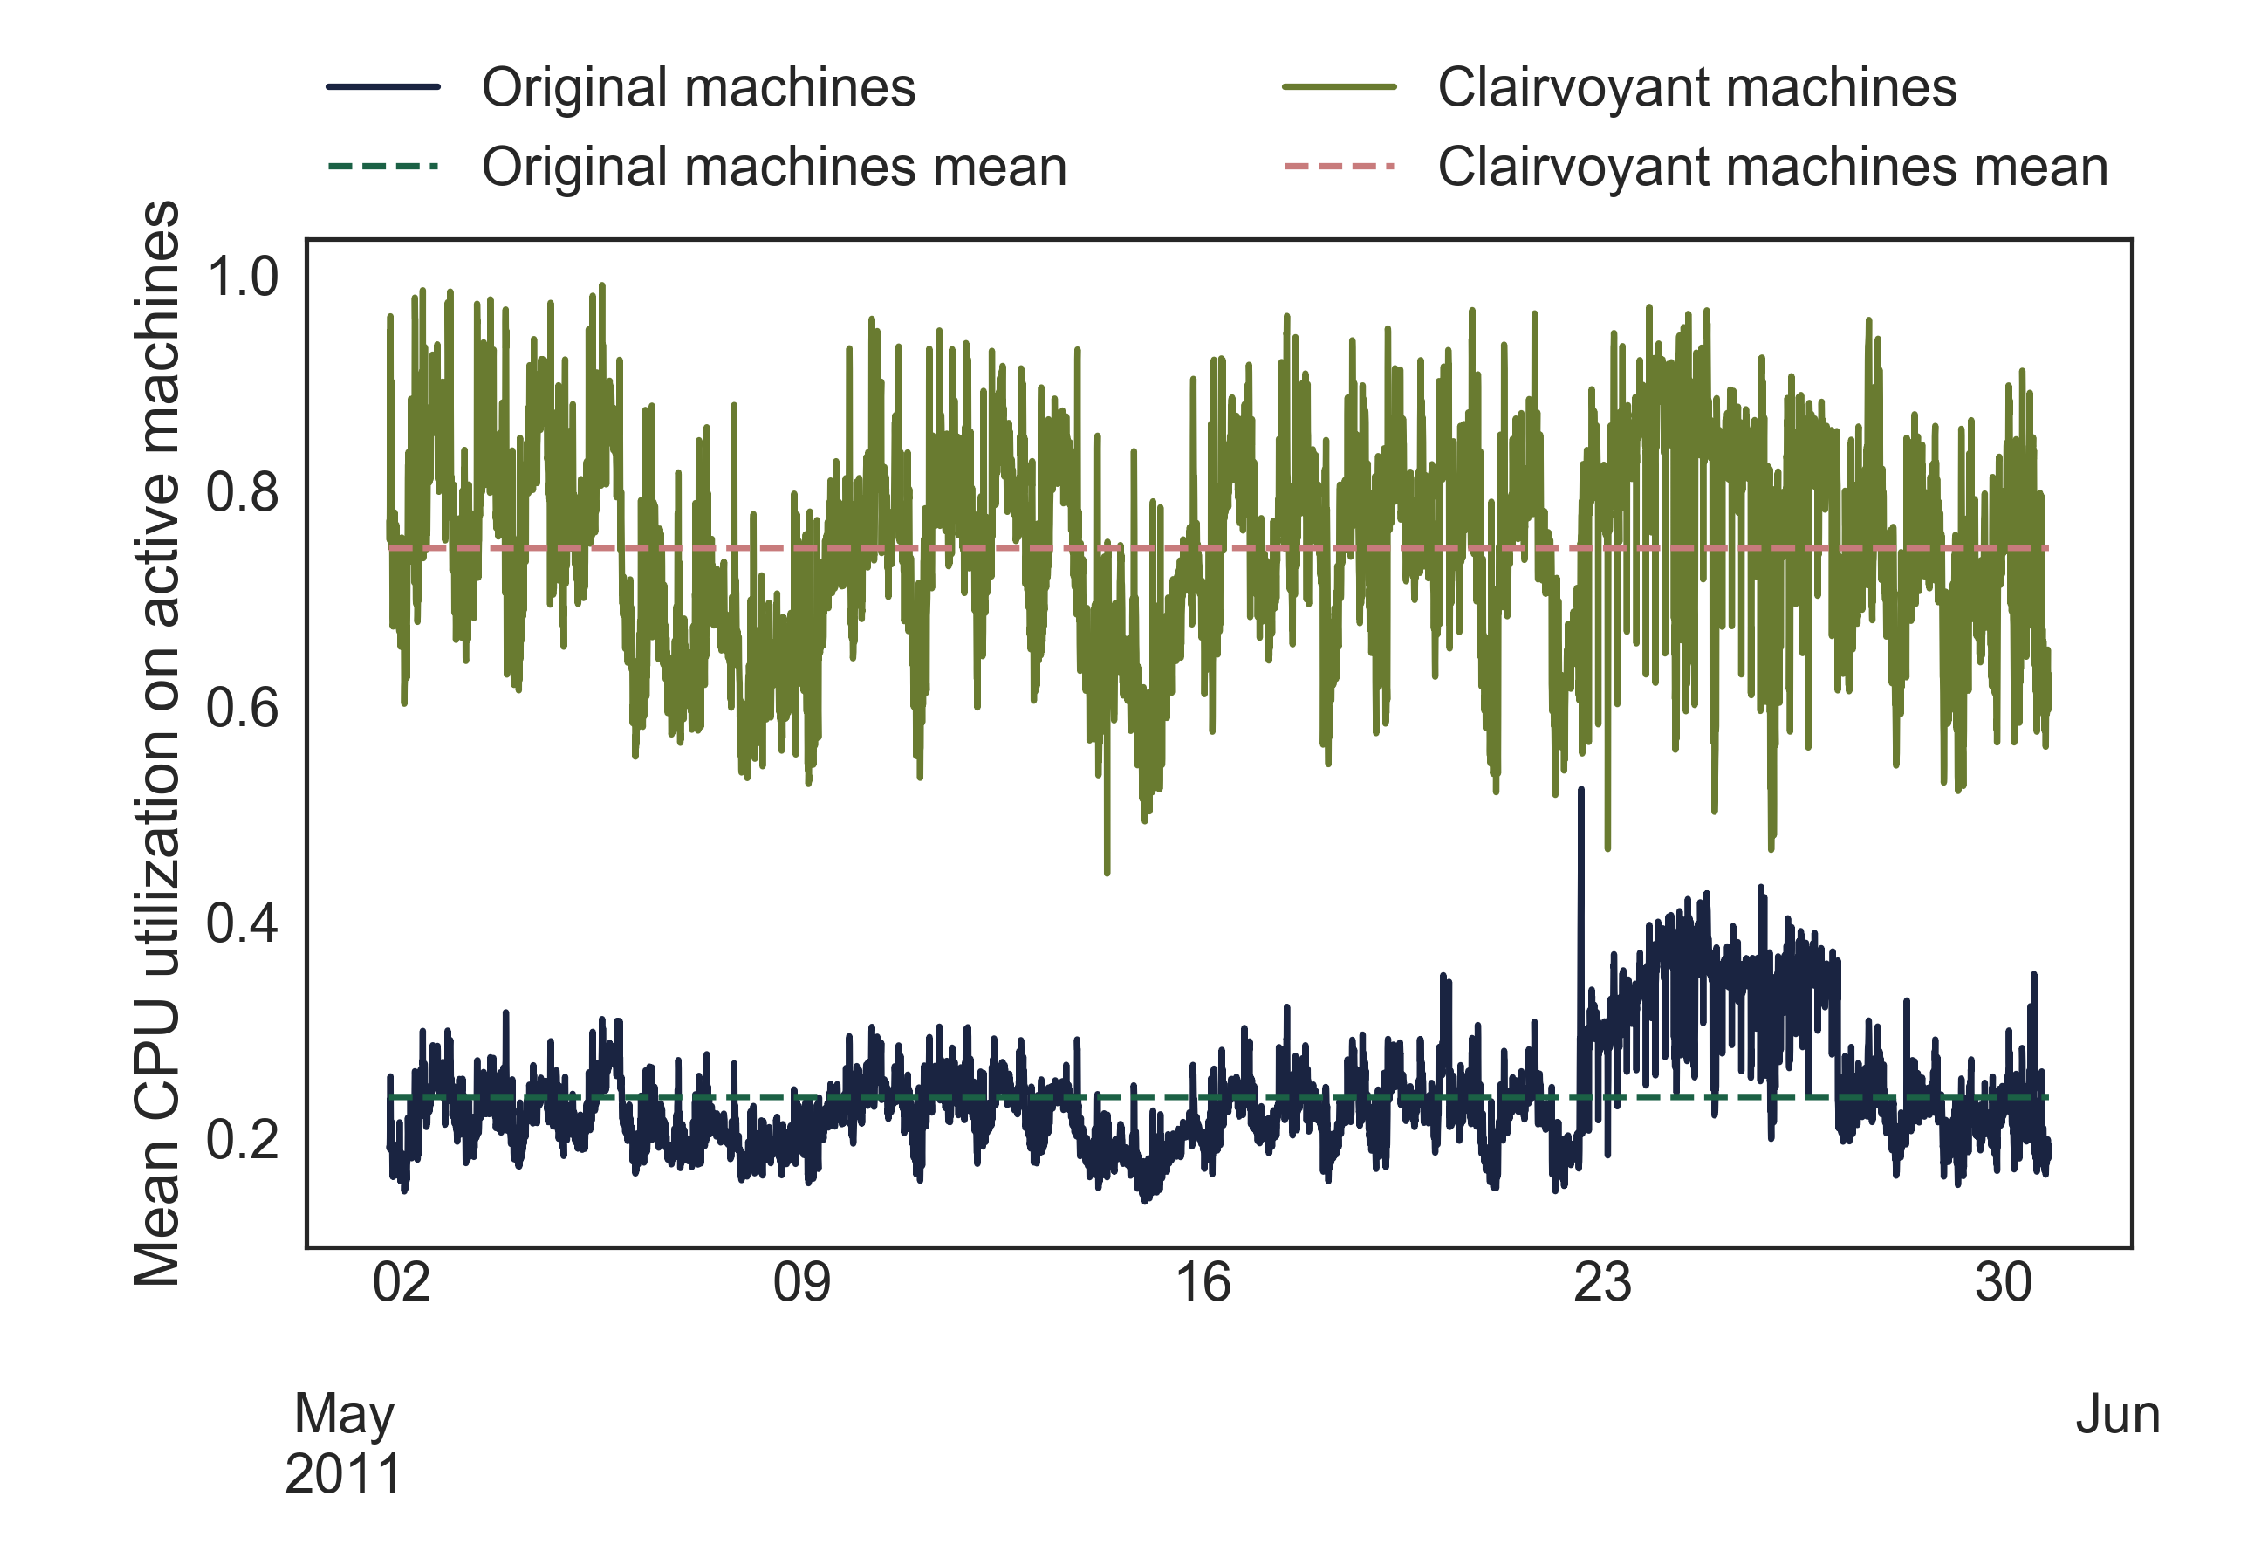
The original trace load from the 500 machines selected at random had a relatively low CPU utilization on average. The mean CPU utilization on the active machines was 0.24. For the smaller sample of 100 machines, this number was similar, at 0.22. The mean CPU utilization remained below 0.3 for the majority of the period, as shown in
Figure 3. This is common for data-center servers ([
23], p. 75), [
39], due to the necessity of having some excess capacity to react to peak usage scenarios of the machines. The mean number of active machines was 500. The total energy used by the machines for the whole trace period was 120,439 kWh, and 68% of this was energy produced by the wind turbine.
6.2. Results from the Clairvoyant Baseline (CB) Scheduler
The following results from the CB scheduler present the best-case scenario, and are used to estimate the performance of the non-clairvoyant scheduler. With the CB scheduler, the need for overhead is removed, due to the tasks’ CPU usage rate being known in advance, in addition to their duration. The machines are then utilized more, and the number of active machines at any given time is reduced significantly. This is illustrated in
Figure 3, showing that the CPU utilization on the active machines is greatly increased with the CB scheduler, from a mean utilization of 0.24 in the original, to a mean utilization of 0.75 for the same trace load.
This increase in efficiency can also be seen from the overall power consumption. With the CB scheduler, the energy consumption is reduced by 59% to 49,126 kWh, compared to the original machines. Most of the reduction is due to fewer machines being active at any time. For the original load, all 500 machines are active most of the time, while the CB algorithm schedules the tasks so that there are, on average, 150, and, at most, 209, active machines (active here means that the CPU utilization of the machine is not 0 for the given 5 min interval). The rest of the 500 machines is in the low-power state at all times, thereby saving a significant amount of energy.
In the CB scheduler, no energy considerations are taken into account, but the renewable-energy utilization increased to 78%. This is most likely due to the overall reduction in energy consumption, since the fraction of time when the machines are fully powered by wind energy is increased from 53% to 71%.
With the unaltered trace, the overall mean CPU utilization on the active machines was 0.69. The overall energy consumption was 34,474 kWh, which is less than the original trace load. This is most likely due to there being the same number of
unique tasks, and, in the original trace, some of the tasks are rescheduled multiple times over the trace period due to a variety of reasons, leading to a higher overall CPU demand compared to the tasks that ran optimally and were only scheduled once (see
Figure 2).
6.3. Results from the Clairvoyant Power-Aware (CP-A) Scheduler
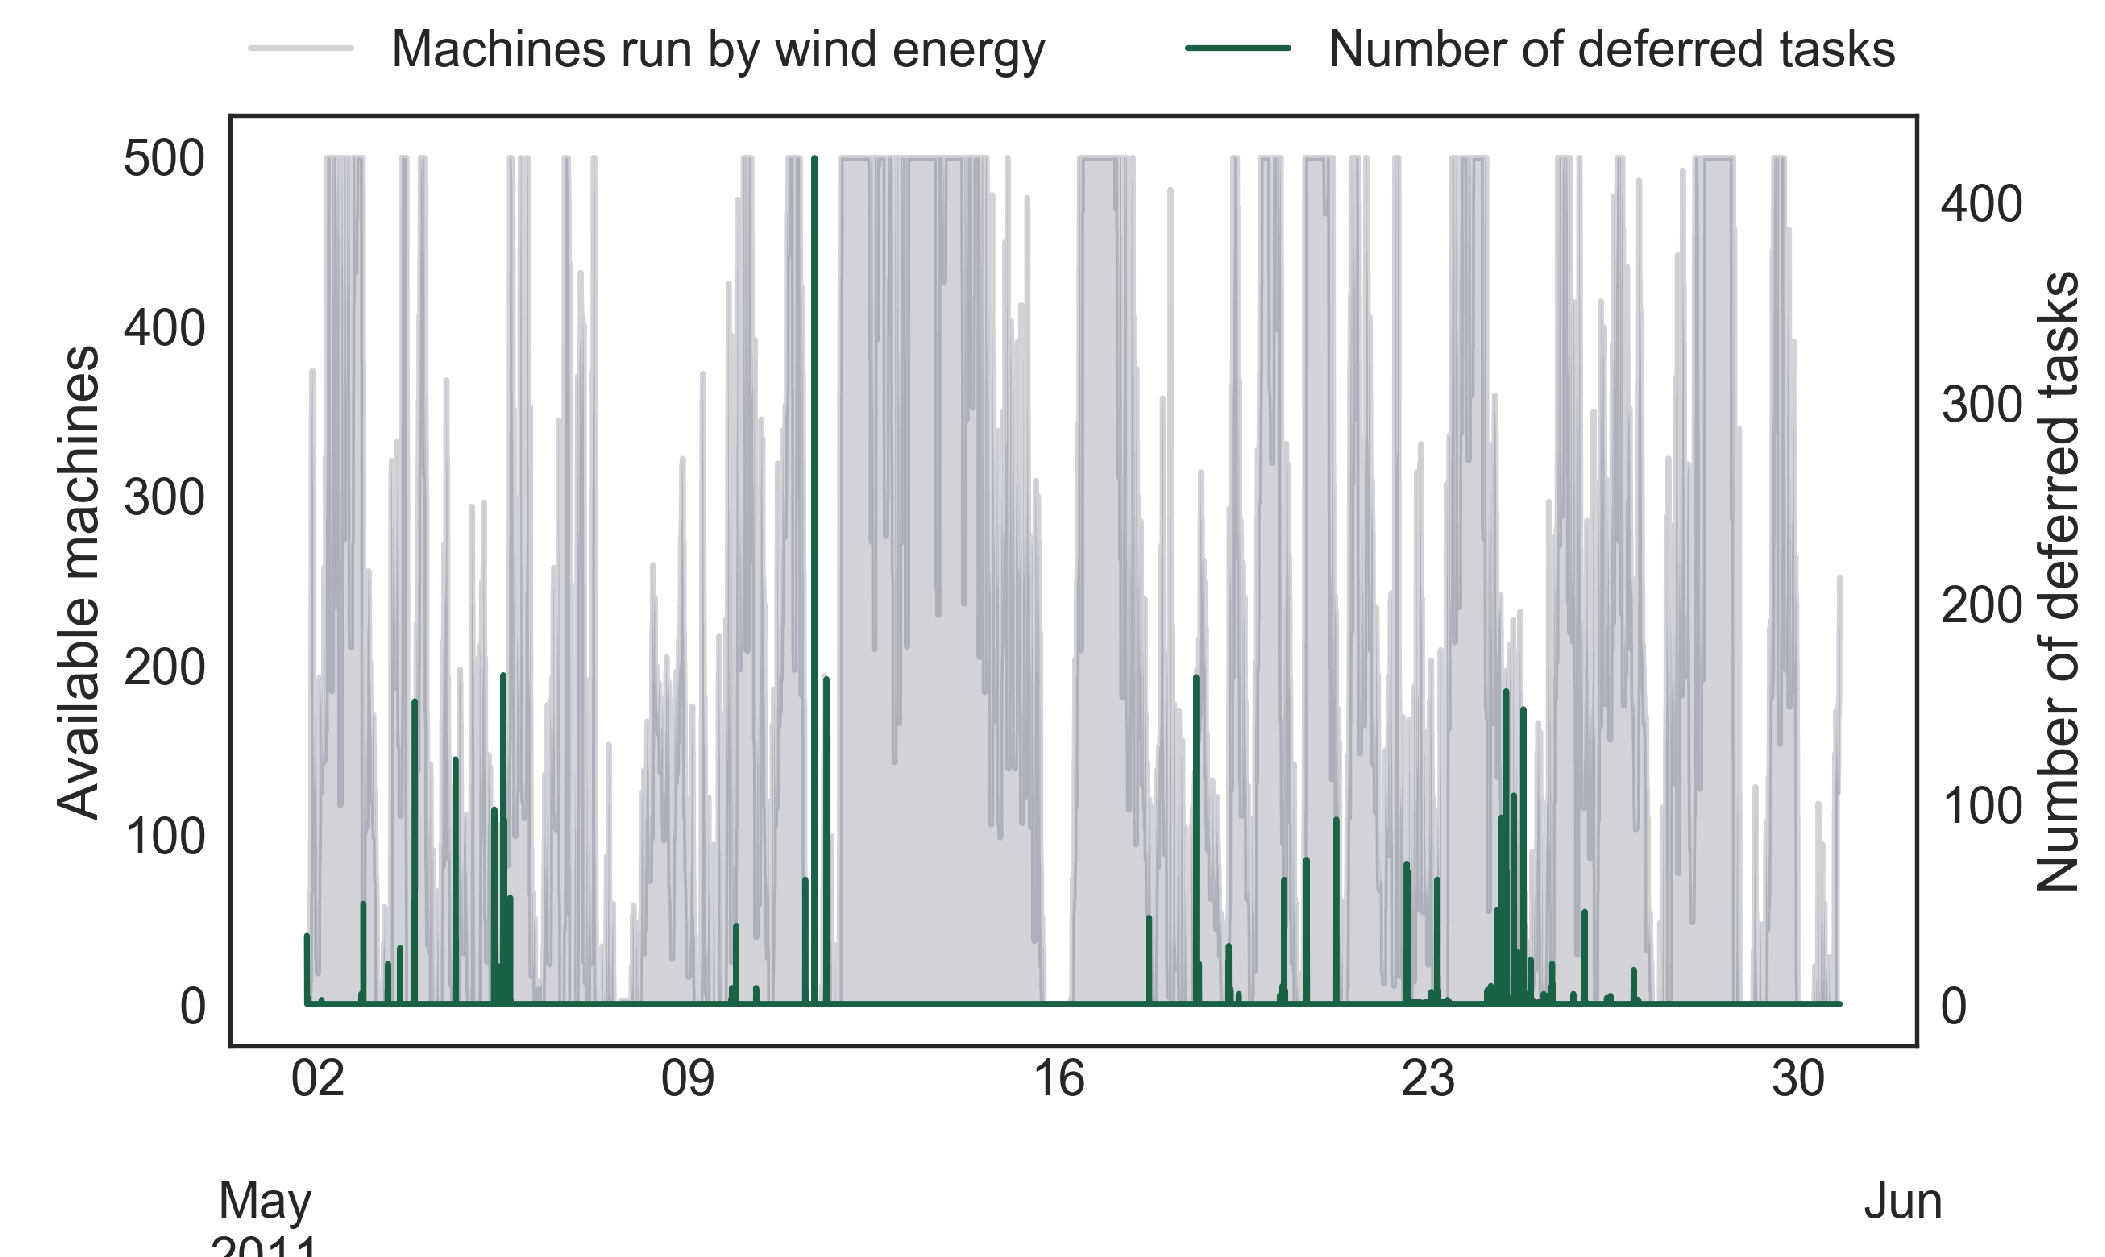
With the CP-A scheduler, the availability of renewable energy is taken into account when the low-latency sensitive tasks are placed. In times of low energy availability, these tasks can be deferred to later time periods. In this manner, an energy-agile workload is created, and the number of deferred tasks is higher in times of low renewable-energy availability, as shown in
Figure 4. This pattern is the same for both the custom and the unaltered trace, and was also seen in the smaller sample of 100 machines. All deferred tasks were scheduled within 6 h of their initial submit time, both for the unaltered and the custom trace. This would be an acceptable delay for these low-latency sensitive tasks, although the delay might be greater in longer periods of no wind-power production. In these data, the longest period without wind power was 12 h.
With the CP-A scheduler there was a small increase in renewable-energy consumption for the unaltered trace, from 78% to 79%. The overall energy consumption decreased by 5%, to 36,687 kWh. For the custom trace, the results are similar, with a reduction in overall energy consumption, and an increase in renewable-energy utilization. The same trend of a reduction in overall power consumption and increase in renewable utilization was seen with the smaller sample size. Here, the renewable percentage increased from 84% to 85% for the unaltered trace, and from 83% to 84% for the custom trace.
For the unaltered trace, there was not enough wind energy to power all the active machines 41% of the time. With the power-aware algorithm, the number of active machines was reduced 84% of this time, compared to the CB algorithm. These numbers for the smaller sample size are 21% and 95%, respectively. For the custom trace, there was not enough wind energy for 34% of the time, and the number of active machines was reduced 43% of this time, compared to the baseline. For the smaller sample, the numbers are 21% and 55%, respectively.
6.4. Results from the Non-Clairvoyant Power-Aware (N-CP-A) Scheduler
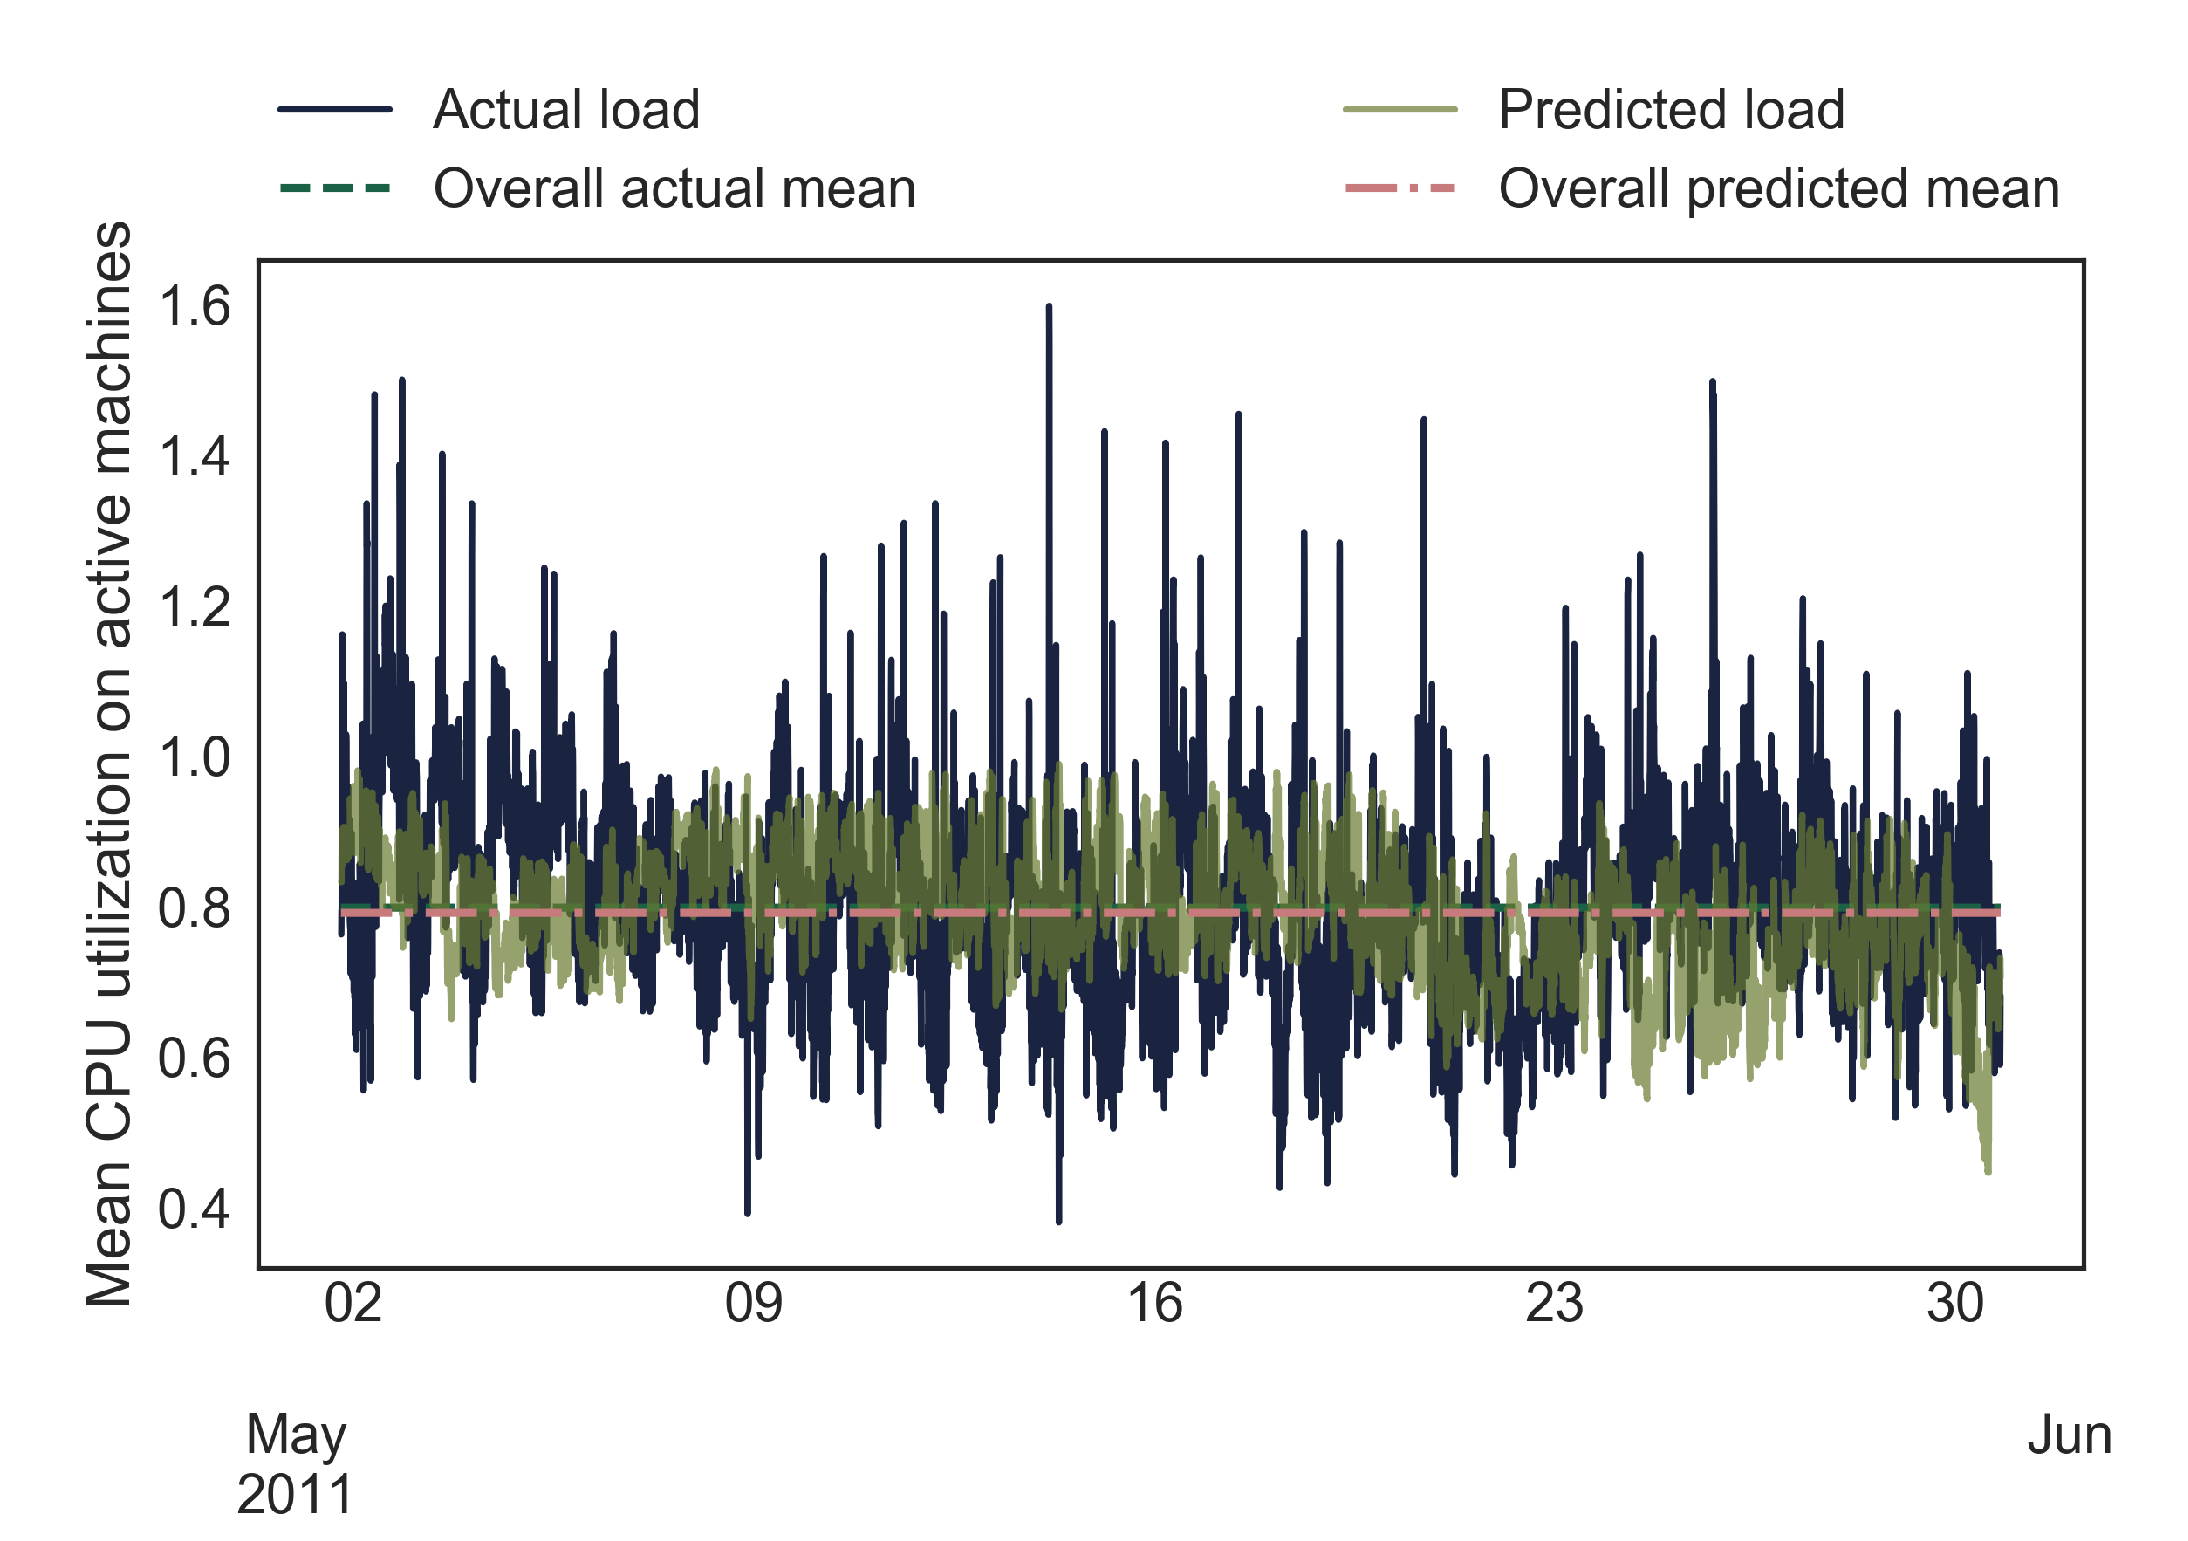
The N-CP-A scheduler performs in a similar way to the CP-A scheduler on the custom trace. The overall power consumption was reduced from 34,474 kWh for the CB scheduler, to 33,433 kWh with the CP-A scheduler, and further to 30,132 kWh with the N-CP-A scheduler. Most likely, the reason for the lower energy consumption of the N-CP-A scheduler is that the machines are oversubscribed some of the time. This can be seen from
Figure 5, where the predicted and actual mean CPU utilization of the active machines are compared. The mean CPU utilization on the active machines with the actual trace load is greater than 1 5.6% of the time, while this never happens for the predicted load.
The machines that were active at some point for the whole sample period were oversubscribed on average 14% of the time, while 50% of the machines were oversubscribed 9% or less of the time. The mean utilization on machines of the predicted and actual load is 0.79 and 0.8, respectively, with the real mean CPU utilization having a greater variance than the predicted mean utilization. This is because the prediction method for task usage only predicts a static mean for each task, while in reality the resource usage of a task will vary considerably.
With the predicted values for CPU usage and duration of the tasks, a mean of 96 machines is expected to be active, with a maximum of 171 machines. The actual trace load based on the predicted values shows that 86 machines are active on average, and the maximum number of active machines is 155. This discrepancy is an indication that a better prediction method for resource usage for a task over time should be used when placing tasks. The energy consumption of the data center when the N-CP-A scheduler is used is 30,132 kWh overall. Here, 81% of the energy is produced by the wind turbine. This result is an improvement from both the CB and the CP-A scheduler, and is once again likely a consequence of the oversubscribed machines, which could be reduced with a more accurate prediction method.
There is not enough wind energy to power all active machines for 31% of the time, and in these intervals, the non-clairvoyant scheduler reduces the number of active machines 93% of the time, with a mean of 22 fewer machines, and a maximum of 65 fewer machines.
7. Conclusions
We presented a workload scheduler for a data center that handles a workload with variable resource demands and involving tasks of different latency sensitivities. The scheduler uses a neural network for individual task usage prediction, to optimally place tasks on the fewest machines possible in order to reduce energy consumption. The presented scheduler also manages to shape the workload to the supply of renewable energy, by deferring tasks with low latency sensitivity to periods with more energy available.
The results show that we could reduce the total number of machines running at any time, leading to a lower overall electricity consumption compared to the original traces. The presented scheduler reduced the number of active machines in periods of low wind-power production up to 93% of the time, by postponing tasks with a low latency sensitivity to a later interval. It also increased the mean utilization on the active machines from 0.24 to 0.75.
The prediction method may not be suited for this problem in the real-world scenario, deduced by the resulting oversubscription on machines for periods of time. Future work should attempt to develop a prediction method that better represents the varying resource usage of tasks over time. The results indicate that the presented scheduler reduces the overall energy consumption, and increases the fraction of renewable energy used, compared to both the original trace load and to the baseline algorithms. The prediction algorithm yields 81% renewable-energy consumption, while the original one consumes only 68% of the available renewable energy and the baseline consumes 78%. This increase comes at a cost of oversubscription over short periods.
The number of machines running at times with low renewable-energy availability could be reduced further by implementing a way to stop already-running low latency sensitive tasks in these intervals. It would also be beneficial to increase the complexity of the algorithm by introducing more parameters and metrics to decide the placement of a task.
Despite the assumptions and simplifications considered in this work compared to the real-world scenario, the results obtained can be seen as a proof of concept. We demonstrated that data centers could reduce their energy consumption by jointly predicting individual task usage over time before placement on machines and predicting energy availability. With a more accurate prediction method for task usage, in addition to other improvements and adaptations, the approach presented here is a viable option to efficiently make use of renewable energy in data centers. In the future, we would like to test our algorithms using a data-center simulator such as [
44] in the context of a geographically distributed data center as well as in the case of non-distributed data center. We also aim to extend this work to VM placement instead of task placement while maintaining extra constraints related, for instance, to inter-VM communication [
45].


